
Abstract
OBJECTIVE:
To investigate the value of CT-based radiomics signature for preoperatively discriminating mucinous adenocarcinoma (MA) from nomucinous adenocarcinoma (NMA) in rectal cancer and compare with conventional CT values.
METHOD:
A total of 225 patients with histologically confirmed MA or NMA of rectal cancer were retrospectively enrolled. Radiomics features were computed from the entire tumor volume segmented from the post-contrast phase CT images. The maximum relevance and minimum redundancy (mRMR) and LASSO regression model were performed to select the best preforming features and build the radiomics models using a training cohort of 155 cases. Then, predictive performance of the models was validated using a validation cohort of 70 cases and receiver operating characteristics (ROC) analysis method. Meanwhile, CT values in post- and pre-contrast phase, as well as their difference (D-values) of tumors in two cohorts were measured by two radiologists. ROC curves were also calculated to assess diagnostic efficacies.
RESULTS:
One hundred and sixty-three patients were confirmed by pathology as NMA and 62 cases were MA. The radiomics signature comprised 19 selected features and showed good discrimination performance in both the training and validation cohorts. The areas under ROC curves (AUC) are 0.93 (95% confidence interval [CI]: 0.89–0.98) in training cohort and 0.93 (95% CI: 0.87–0.99) in validation cohort, respectively. Three sets of CT values of MA in pre- and post-contrast phase, and their difference (D-value) (31±7.0, 51±12.6 and 20±9.3, respectively) were lower than those of NMA (37±5.6, 69±13.3 and 32±11.7, respectively). Comparing to the radiomics signature, using three sets of conventional CT values yielded relatively low diagnostic performance with AUC of 0.84 (95% CI: 0.78–0.88), 0.75 (95% CI: 0.69–0.81) and 0.78 (95% CI: 0.72–0.83), respectively.
CONCLUSION:
This study demonstrated that CT radiomics features could be utilized as a noninvasive biomarker to identify MA patients from NMA of rectal cancer preoperatively, which is more accurate than using the conventional CT values.
Introduction
Adenocarcinoma is the most common histological type in rectal cancers. Mucinous adenocarcinoma (MA) is a specific morphological subtype of rectal cancer which is diagnosed when more than 50% of the tumor comprises extracellular mucinous pattern upon histological [1], and this group comprises approximately 10%–20% of rectal cancers [2, 3]. However, in some studies, MA is associated with worse clinicopathological characteristics and a poorer prognosis than nonmucinous carcinoma (NMA) [4, 5]. In addition, it also relates to a worse tumor regression grade and tumor down staging compared with the NMA tumors [6]. As neoadjuvant chemoradiotherapy (nCRT) followed by surgery has become the standard treatment for rectal cancer [7], MA responds poorly to nCRT. Even worse, there is considerable possibility of tumor progression during nCRT treatment [8]. Therefore, the treatment strategy for MA could be preoperatively differentiated from NMA. However, biopsy specimens cannot be used for accurate diagnosis of MA, because endoscopic biopsy obtains only a superficial part of the tumor and might not contain a representative amount of mucin.
Thus, radiological examinations may play an important role in the preoperative diagnosis of mucinous carcinoma when used to identify features of the entire tumor. Computed tomography (CT) has been routinely applied in patients with rectal cancer for preoperative staging in clinical practice [9]. However, it is difficult for radiologists to diagnose MA because a certain proportion of mucus components often appears in NMA. Radiomics, allowing a high throughput extraction of quantitative imaging features from tumors [10], has potential to perform better in identifying different types of tumors based on CT. Furthermore, several studies have indicated radiomics signature was a powerful approach for classification. Studies based on radiomics of CT images may help distinguish between malignant lymph nodes and benign lymph nodes not only in gastrointestinal stromal cancer [11] and adenocarcinoma [12], but also in primary lung cancer [13]. CT radiomics signature can help identify different types of breast cancer [14], lung cancer [15], kidney cancer [16] and gastric cancer [17]. One study involving 404 patients found and reported that CT radiomics features have a certain prognostic ability in distinguish epidermal growth factor receptor (EGFR) mutation status than all the clinical and morphological features [18]. In the application of colorectal cancer, studies have demonstrated that applying radiomics features-based predictive models can help discriminate high-grade from low-grade colorectal adenocarcinoma of rectal cancer [19] and preoperatively discriminate stage I-II and stage III-IV of colorectal cancer [20]. Additionally, using CT radiomics features can also help identify metastatic lymph nodes [21].
To the best of our knowledge, there is no reported study to investigate and test the feasibility of applying CT radiomics to predict MA in patients diagnosed with the rectal cancer. Therefore, the purpose of this study is to develop and validate a new CT-based radiomics signature for preoperatively discriminating MA from NMA and compare the results with conventional CT values.
Materials and methods
Patient
This was a multicenter study with patients retrospectively enrolled from two of Chinese hospitals in different province of China and was approved by the ethics committee of the two participating hospitals, with the requirement for informed consent waived. A total of 225 rectal cancer patients who underwent surgical treatment between April 2013 and April 2019 were retrospectively collected according to the following inclusion and exclusion criteria.
Inclusion criterion: (1) Histologically confirmed mucinous adenocarcinoma or common type of adenocarcinoma by surgery; (2) A standard unenhanced and contrast-enhanced pelvic CT performed <30 days before treatment (including neoadjuvant chemoradiotherapy and TME). (3) Clearly image and obviously rectal tumor displayed. Exclusion criteria were: (1) The rectal tumor with unclearly boundary and the target region cannot be accurately delineated; (2) patients who received treatment (radiotherapy or chemotherapy) before CT examination. The workflow of this study is displayed in Fig. 1. The data set with the most enrolled patients was used as the training dataset to reduce any form of over-fitting or bias in the analysis, and the other data sets were used as independent testing dataset.

Illustration of workflow of this study.
Before CT examination, an 8-hour fasting requires for preparation on the patients. The patients were in supine position and all scanning were completed while the patients held their breath. Scans were performed on Somatom Sensation 64 (Siemens Medical Solutions, Forchheim, Germany) or GE Optima CT660 scanner (GE Medical Systems, Milwaukee, Wisconsin)with slice thickness and spacing of 5 mm, tube voltage of 120 kV, tube current of 100 mA, matrix of 512×512, and pitch of 0.984 : 1. After the unenhanced image was scanned, 90 ml contract agent ioversol (320 mgI/ml) was injected via an automatic high-pressure syringe through median cubital vein with injection speed of 2.5 ml/s. then, the enhanced images of portal venous phase were obtained when delaying 70 s after the injection.
Measurement of CT values
The measurement of the CT values was performed by two trained radiologists who were blinded to the any patients’ clinical and pathological diagnosis on the picture archiving and communication system (PACS). Firstly, Two radiologists (yx G and jq Z, with 8 and 12 years of experience in abdominal imaging, respectively) observed and analyzed all images, and selected the image at the slice with the largest axial diameter of tumor in the portal phase to draw a region of interest (ROI) manually at least 10 mm2 on the solid areas (avoiding necrosis and cystic portions) of the tumor. The average CT values of this area were automatically calculated to minimize measurement bias on the PACS. Then the corresponding ROI was propagated to the pre-contrast images. Finally, the difference of CT values (D-values) was calculated by the following formula.
Image feature extraction
Two radiologists (1 from participating hospital, yx G and jq Z, with 8 and 12 years of experience in abdominal imaging, respectively) carefully contoured the tumor on the post-contrast phase CT images. The regions of interest (ROI) were delineated manually via the ITK-SNAP software (version 3.4.0, www.itksnap.org) on each slice of images by excluding the necrosis, air and calcification area. Then the 3D segmentation the entire volume of interest (VOI) of the primary tumor was automatically generated by the continuous cross-sectional ROI images. The delineations included the surrounding chords and bundles, which were suspicion of tumor infiltration, and excluded the non-invaded rectal wall as well as the intestinal lumen, vessel shadow, and perirectal fat. The delineation of rectal cancer is shown in Fig. 2. These VOIs were performed for subsequent feature extraction for further analysis. All the radiologists were blinded to the concretely histopathology informational though rectal cancer was been realized. The inter-observer reproducibility evaluation of radiomics feature extraction was performed using intraclass correlation coefficients (ICC), where an ICC of 0.81 to 1.00 showed almost perfect agreement, 0.61 to 0.80 as substantial agreement, and 0.41 to 0.60 as moderate agreement.
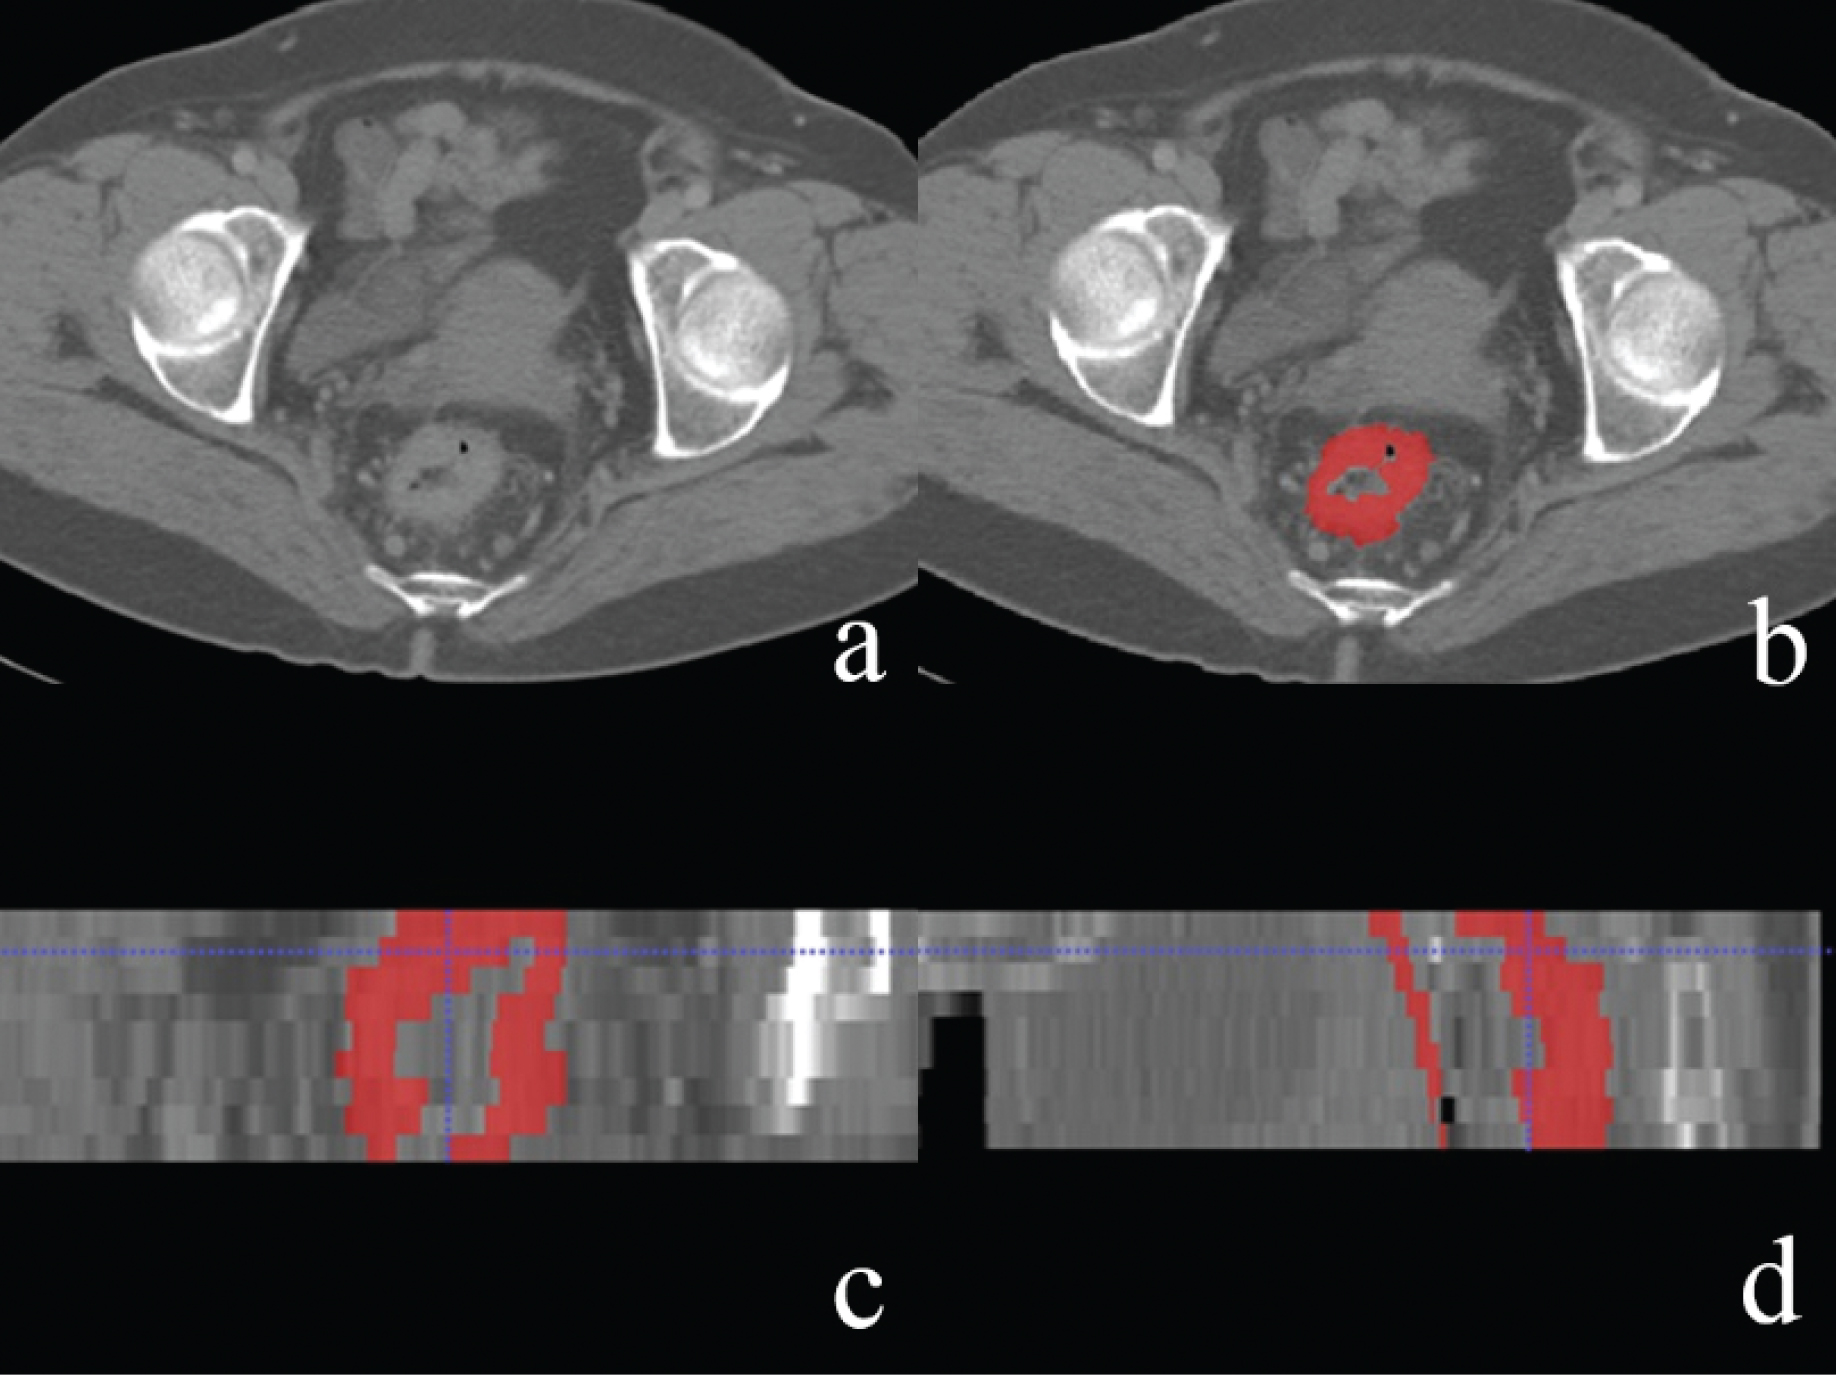
(a) Delineation of the lesion using the ITK-snap software. One patient with rectal cancer, male, 69 years old. (b) The red area represents the maximum cross-sectional area of the tumor. (c, d) Generation of a 3D ROI in sagittal and coronal position.
A total of 396 radiomics features from the VOI of the post-contrast phase CT image were extracted automatically using in-house software (Analysis Kit, version 3.0.0, GE Healthcare). Afterwards, all radiomics features were normalised by transforming the data into standardised intensity ranges for each imaging modality across all subjects with a mean of 0 and an SD of 1 (z-score transformation). These radiomics features were divided into five groups: (1) gray-level histogram features; (2) shape features; (3) gray-level co-occurrence matrix (GLCM) features; (4) gray-level run-length matrix (GLRLM) features and (5) gray level size zone matrix (GLSZM) features. To reduce overfitting and select the most informative radiomics features to develop a prediction model, maximum relevance and minimum redundancy (mRMR) and multivariate logistic regression with the least absolute shrinkage and selection operator (LASSO) were performed in the primary cohort. Logistic regression was used to linearly fit the selected features by their respective coefficients, and the rad score for each patient was calculated.
Predictive performance of radiomics signature
Mann-Whitney U test was applied to evaluate the correlation between radiomics signature and different pathological types in both training and validation datasets. The area under the receiver operator characteristic (ROC) curve (AUC), sensitivity, specificity, predictive positive predictive value (PPV), negative predictive value (NPV), and accuracy of the radiomics signature were assessed in the training set. The optimal cutoff threshold value was directly applied to the validation data set to calculate the sensitivity, specificity, positive predictive value (PPV), negative predictive value (NPV), and accuracy.
In order to validate the robust and reliability of our model, we performed LGOCV (leave group out cross validation) [22] by dividing dataset into training subset and testing subset (training set vs test set, 7 : 3) for 100 times using stratified random sampling. For each time, training set was used to train the model, and testing set used to validate the model. Finally, 100 AUC values were obtained for training and test group respectively.
In addition, a decision curve analysis (DCA) was also conducted by calculating the net benefits at different threshold probabilities to estimate the clinical usefulness of the radiomics nomogram.
Statistical analysis
Statistical analysis was performed using SPSS 23.0 (IBM) and R software (version 3.4.2, http://www.Rproject.org). Normally distributed data were analyzed by Student’s t test and were expressed as means±standard deviations. Non-normally distributed data were analyzed by Mann-Whitney U test, and were expressed as medians and ranges (25th, 75th percentiles). The consistencies of the measurements between the two observers were tested using intra-class correlation coefficients (ICC). A two-sample t-test was conducted for common comparisons of patients’ characteristics for continuous variables. The univariate statistical tests for selection of the radiomics and multivariate regression analysis for prediction model building were performed with R software. The receiver operating characteristic (ROC) analysis was used to compare diagnostic capabilities. P < 0.05 indicated a statistically significant difference.
Results
Patients characteristics
A total of 225 patients were recruited for analysis. Eighty-three patients underwent TME surgery, and 124 patients underwent chemotherapy or chemoradiotherapy and TME. The remaining 18 patients received TME only after chemotherapy or chemoradiotherapy. 163 were confirmed by pathology as NMA and 62 cases were confirmed to be MA.
The detailed patient characteristics in the training cohort and external validation cohort are displayed in Table 1. The training set included 44 (28.3%) and 111 (71.6%) patients with MA and NMA, respectively. and validation set included 18 (25.7%) and 52 (74.2%) patients with MA and NMA, respectively. The statistical analysis showed no significant difference between the two cohorts in number (P = 0.678). In each cohort, there were no significant differences in gender and smoking history. In both the training and validation set, there were more N1-2 rectal cancers (59.1% and 61.1%) in the MA group than in the NMA group (34.2% and 32.7%, both P < 0.05). In the training set, there were more T3/T4 rectal cancers (86.4%) in the MA group than in the NMA group (71.2%, P = 0.047), while there was no significant difference in validation set.
Characteristics of patients in the training and validation cohorts
Characteristics of patients in the training and validation cohorts
MA: mucinous adenocarcinoma; NMA: nomucinous adenocarcinoma.
It showed an excellence ICCs of 0.963 from post-contrast and pre-contrast CT imaging as assessed by the two radiologists. CT values of MA in pre-contrast, post-contrast and D-values (31±7.0 Hu, 51±12.6 Hu, 20±9.3 Hu, respectively) were lower than that of NMA (37±5.6 Hu, 69±13.3 Hu, 32±11.7 Hu, respectively). The two-sample t-test showed that there were statistical differences between MA and NMA groups on pre-contrast, post-contrast CT and D-values (Table 2), with AUC were 0.75(95% CI:0.69–0.81), 0.84(95% CI: 0.78–0.88) and 0.78(95% CI: 0.72–0.83) respectively. The ROC analysis results are displayed in Fig. 3.
CT values in MA and NMA groups
CT values in MA and NMA groups
MA: mucinous adenocarcinoma; NMA: nomucinous adenocarcinoma.

ROC curves of using three sets of the CT values.
To reduce overfitting and select the most informative radiomics features to develop a prediction model, mRMR and lasso regression analysis comparing MA and NMA groups were performed in the training cohort. As a result, 19 out of 396 radiomic features were included. The inter-observer reproducibility of radiomics feature extraction was satisfactory with ICCs more than 0.80 for all extracted features. Therefore, all outcomes were based on the measurements of the first radiologist.
The extracted features were the included: (1) SmallAreaEmphasis, (2) ClusterShade_angle0_offset7, (3) GLCMEntropy_angle135_offset1, (4) HighGreyLevelRunEmphasis_AllDirection_offset7_SD, (5) High-IntensitySmallAreaEmphasis, (6) Variance, (7) Quantile0.025, (8) sumAverage, (9) Long-RunEmphasis_angle45_offset4, (10) GLCMEntropy_AllDirection_offset1_SD, (11) GLCMEntropy_angle135_offset7, (12) GLCMEntropy_angle90_offset7, (13) LowGreyLevelRunEmphasis_AllDirection_offset1_SD, (14) InverseDifferenceMoment_AllDirection_offset4_SD, (15) LongRunLowGreyLevelEmphasis_angle90_offset1, (16) Inertia_AllDirection_offset1_SD, (17) RMS, and (18) Inertia_AllDirection_offset7_SD. These features included 3 first order statistics and 16 texture features. The parameter-tuning procedure of the regression model and the feature space reduction are illustrated in Fig. 4, and the name and weight of the selected features are listed in Fig. 5.
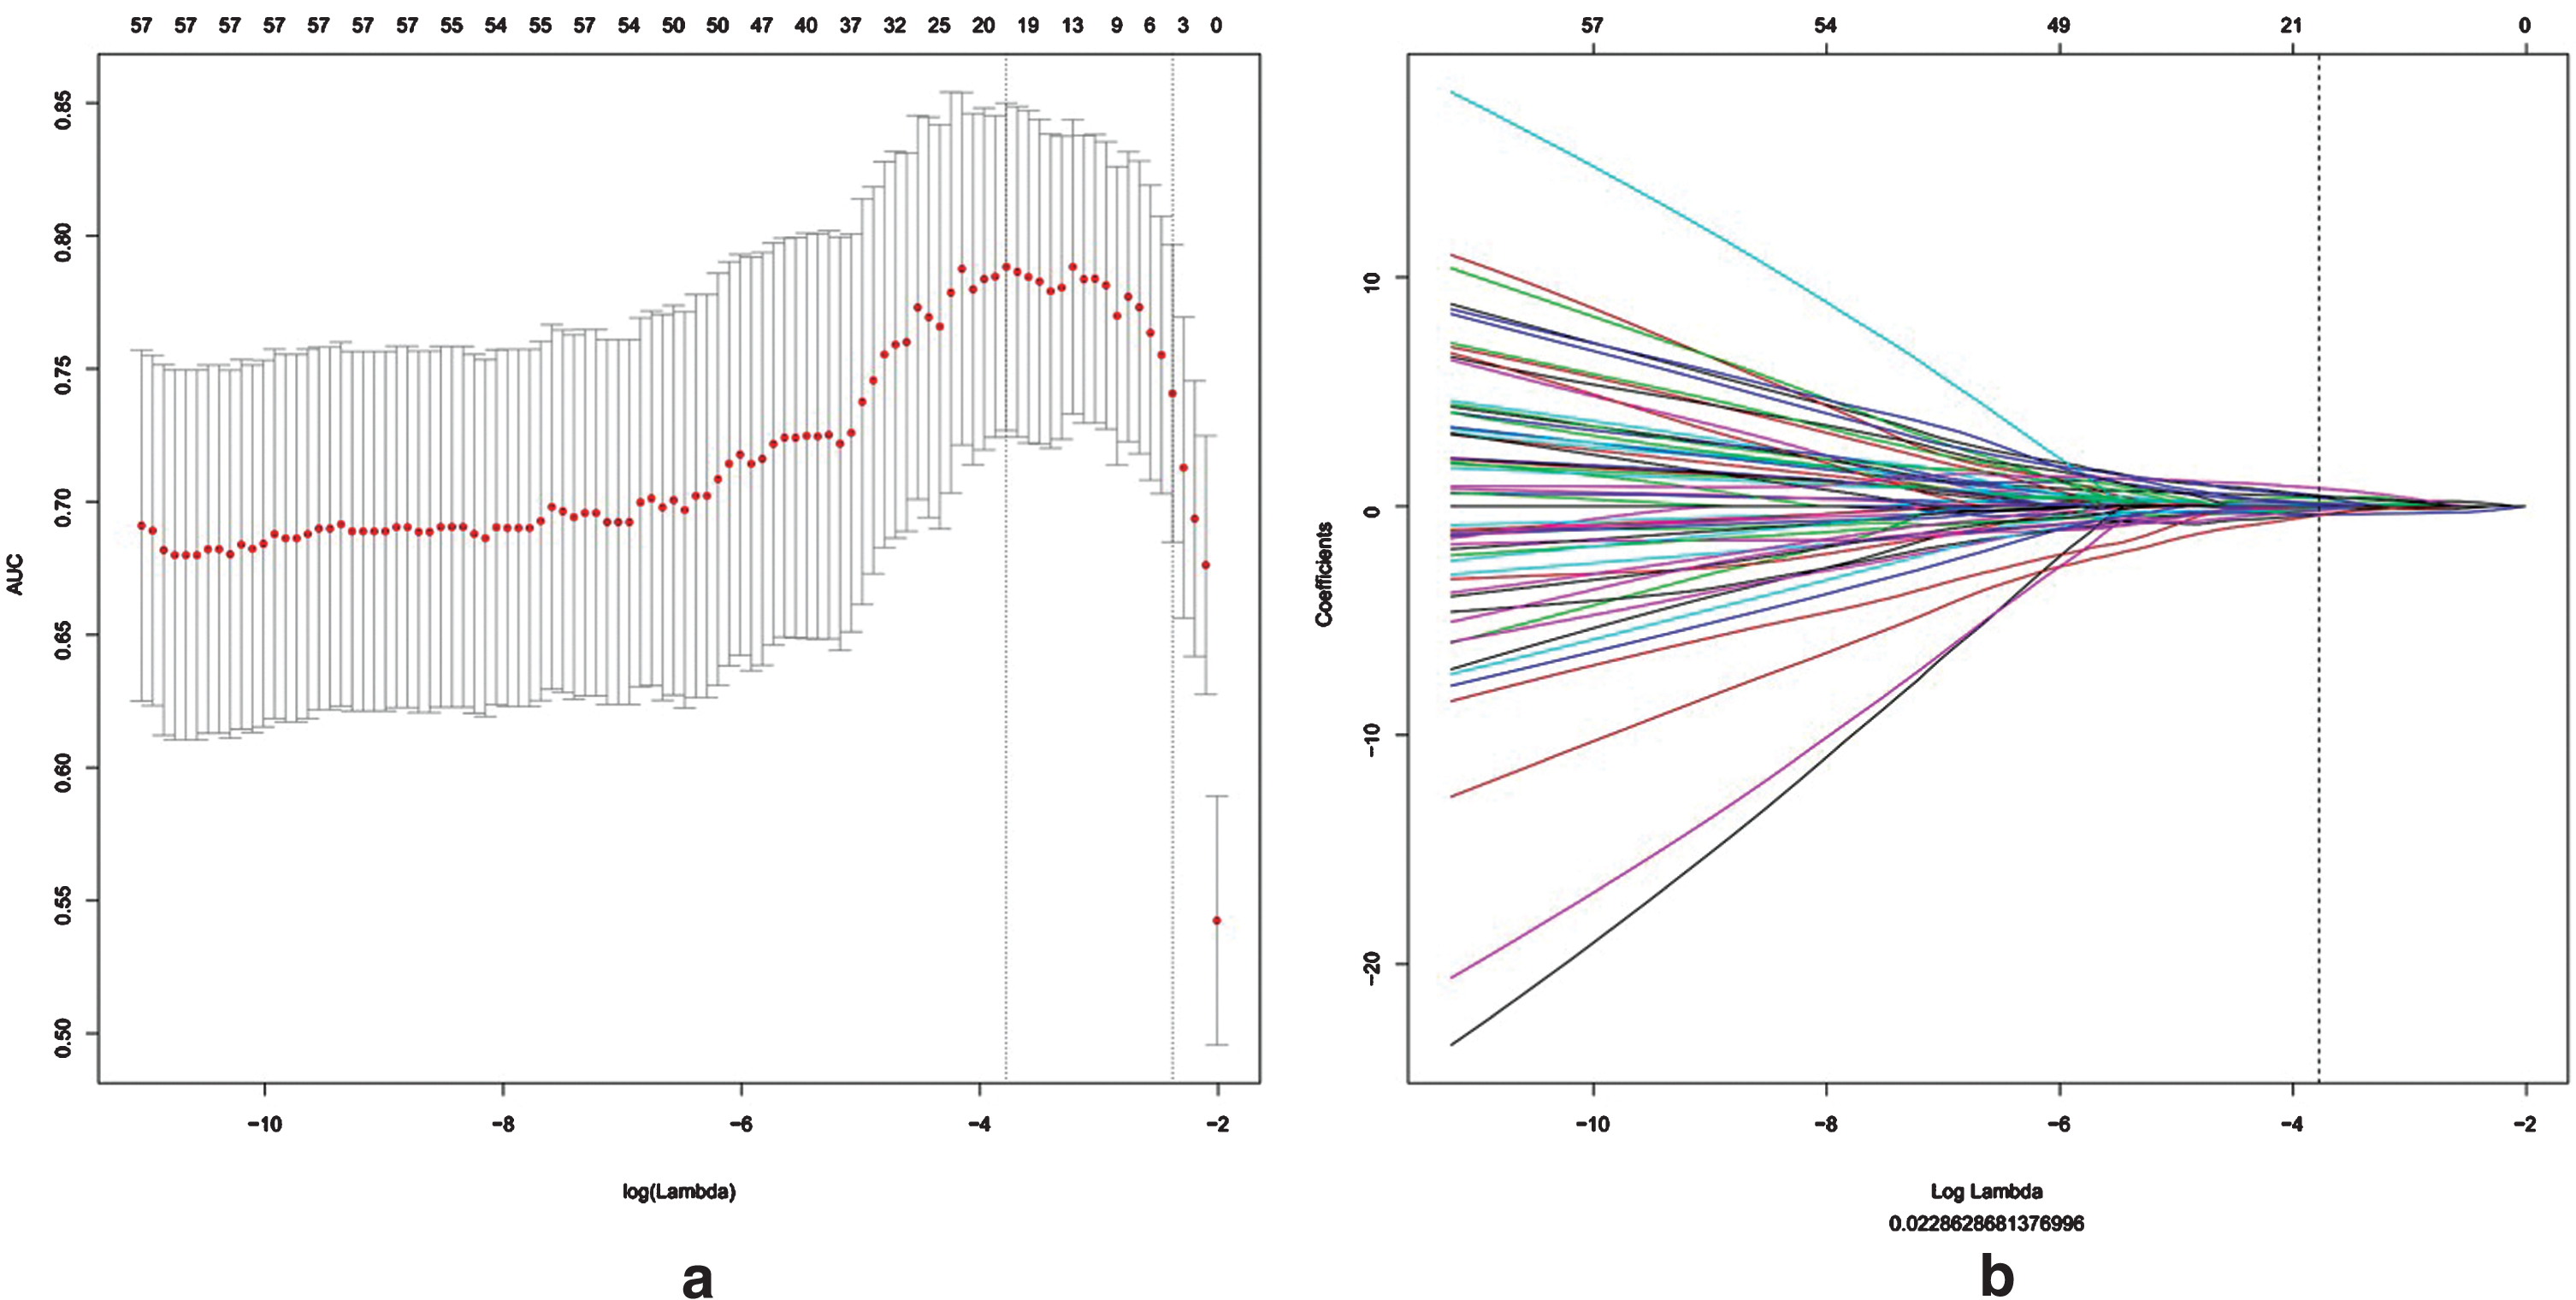
Radiomics feature selection using LASSO logistic regression model. A selection of the tuning parameter (λ) in the LASSO model via tenfold cross-validation based on minimum criteria. The area under there receiver operating characteristic (AUC) curve was plotted as a function of log (λ). Dotted vertical lines were drawn at the optimal values by using the minimum criteria and the 1 standard error of the minimum criteria (the 1- SE criteria). The optimal λ value of 0.02286 with log (λ) = –3.757 was selected. b LASSO coefficient profiles of the 396 radiomics features. A coefficient profile plot was produced against the log (λ) sequence, and the optimal 19 non-zero coefficients were generated at the value selected using tenfold cross-validation in Fig. 4a.
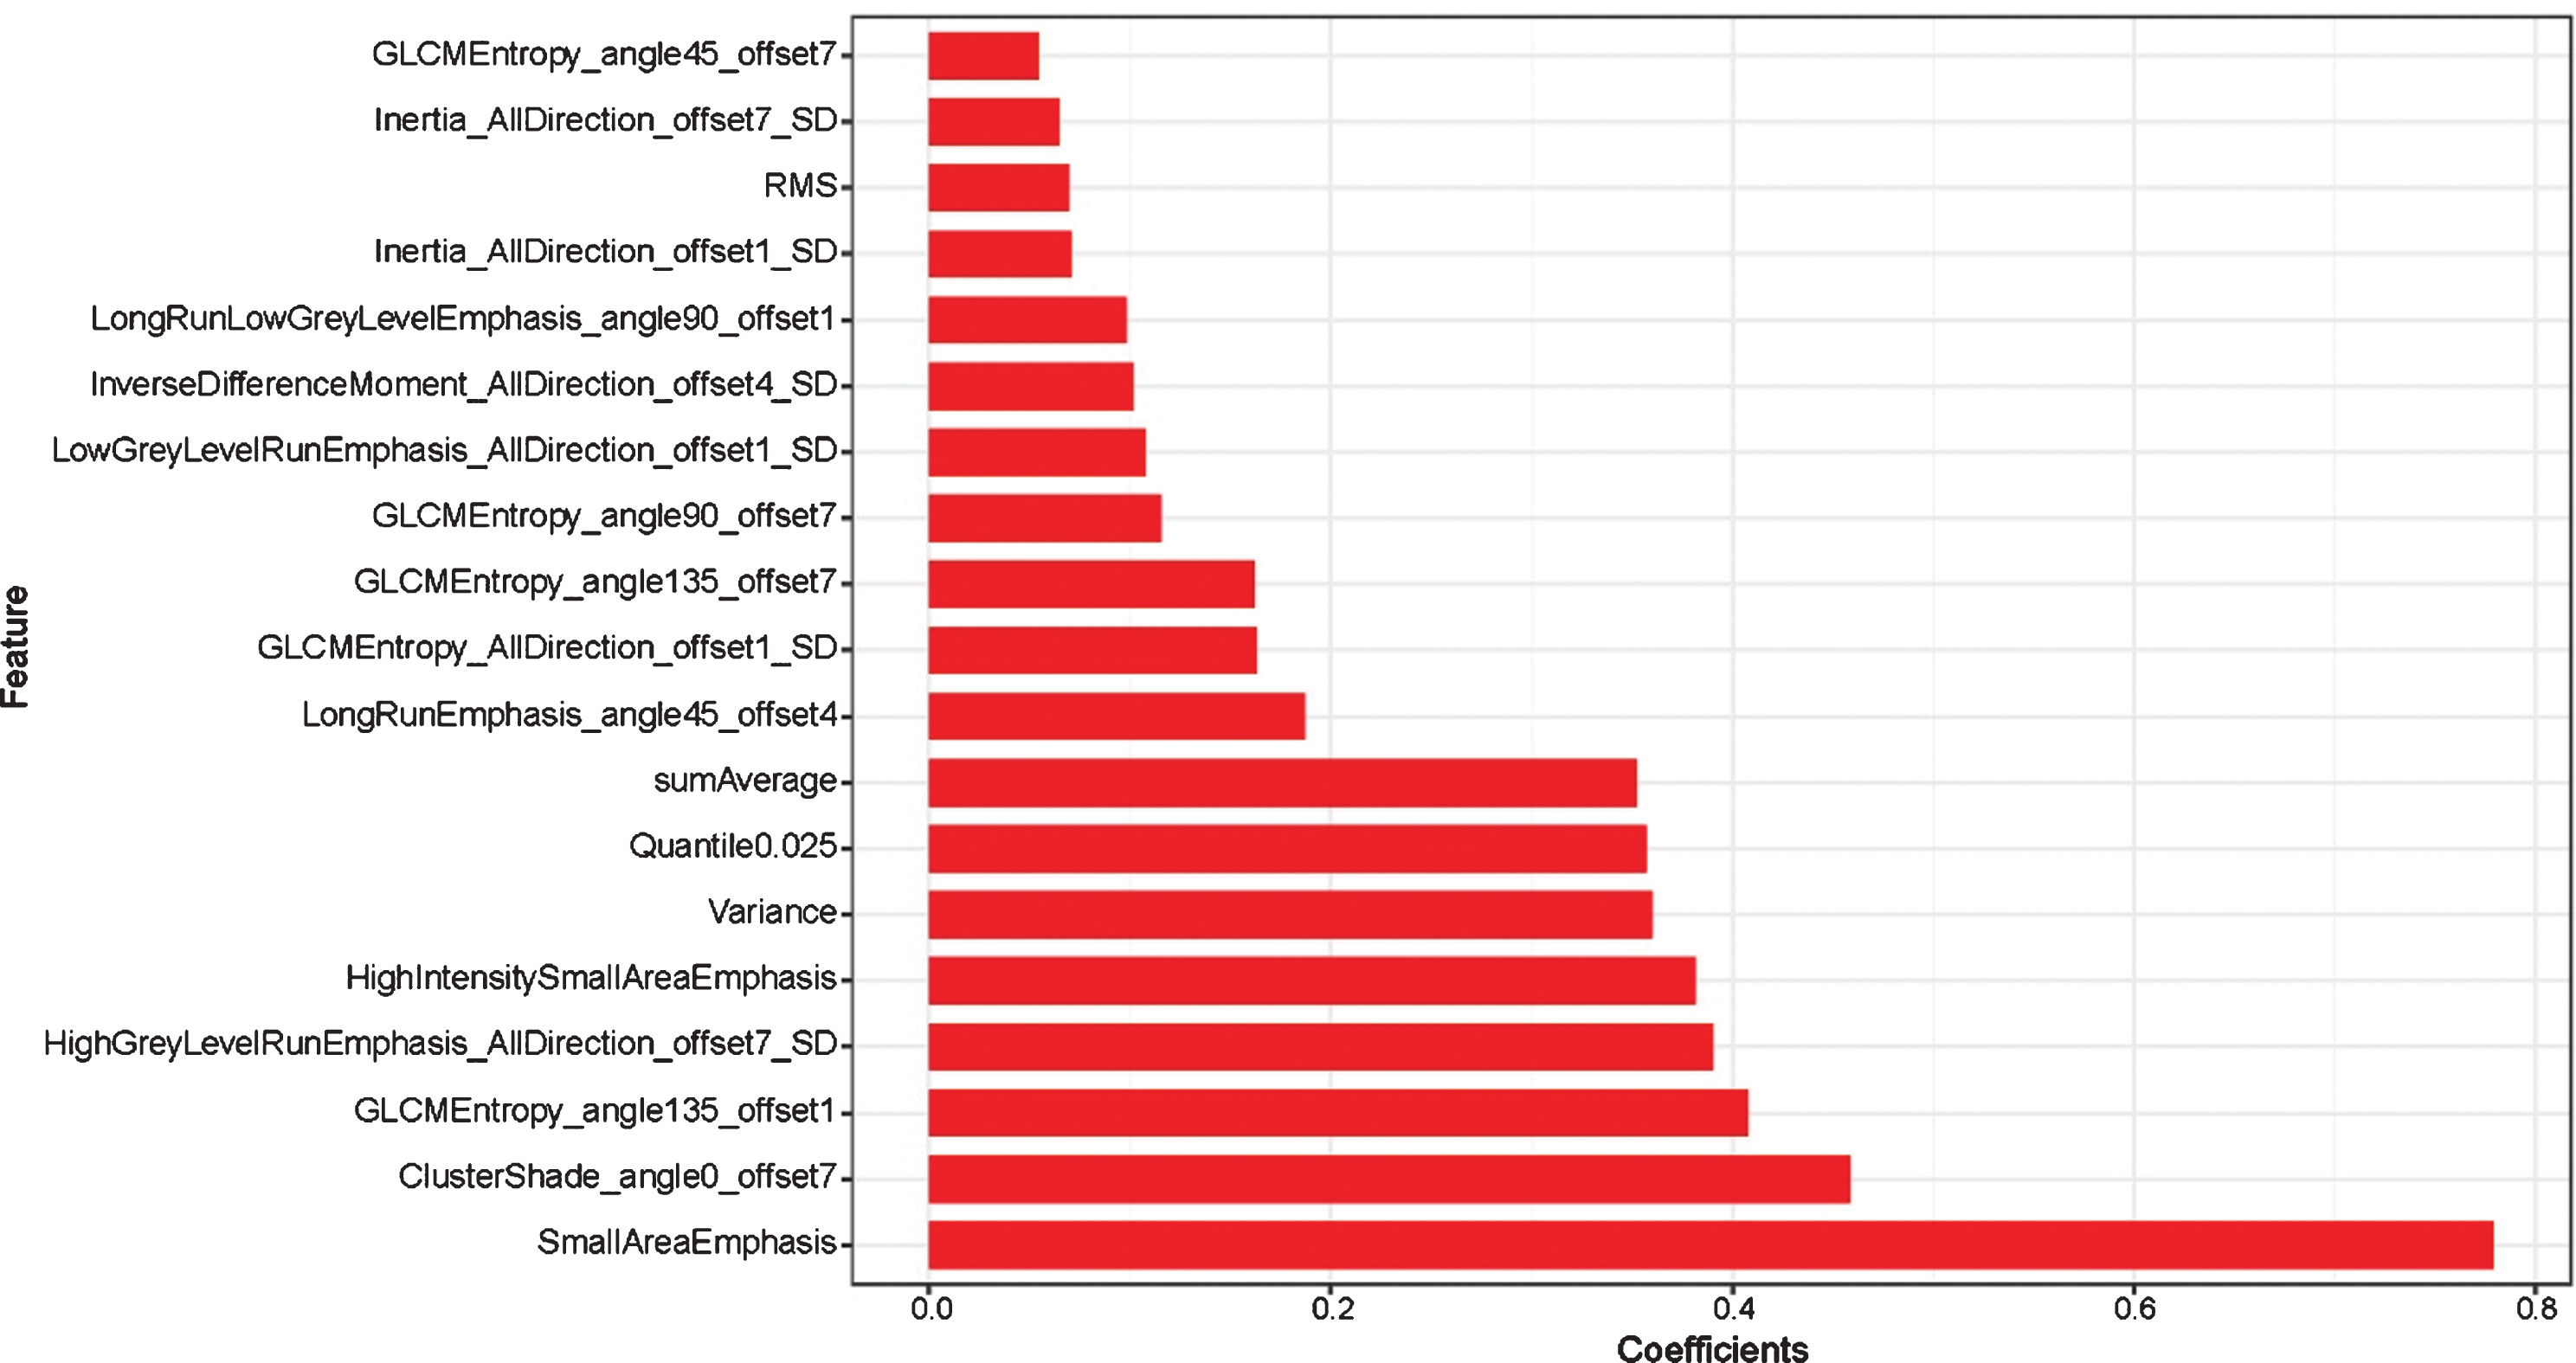
CT radiomics extracted features.
The radiomics models were built by applying multivariate regression analysis. The AUC value of the radiomics model was 0.93 (95% CI: 0.89–0.98), indicating that radiomics features could effectively distinguish MA from NMA.
The radiomics feature-based models predictive performance was also satisfactory when were applied to the validation cohort. The AUC of the model was 0.93 (95% CI: 0.87–0.99), which also indicated a trend towards higher diagnostic efficiency in external agency data for verification. The diagnostic efficiency in the training cohort and validation cohort were shown in Table 3. The ROC analysis results were displayed in Fig. 6. Each patient’s radiomics scores in both the training and validation cohorts were shown in Fig. 7. LGOCV was performed in order to validate the robust and reliability of the radiomics model. The result showed that the mean AUC value for training and testing group were relatively high with 0.94 and 0.85 respectively. The result of LGOCV test was shown in the Fig. 8.
Diagnostic efficiency in the training cohort and validation cohort
Diagnostic efficiency in the training cohort and validation cohort
PPV: positive predictive value; NPV: negative predictive value; CI: Confidence interval.
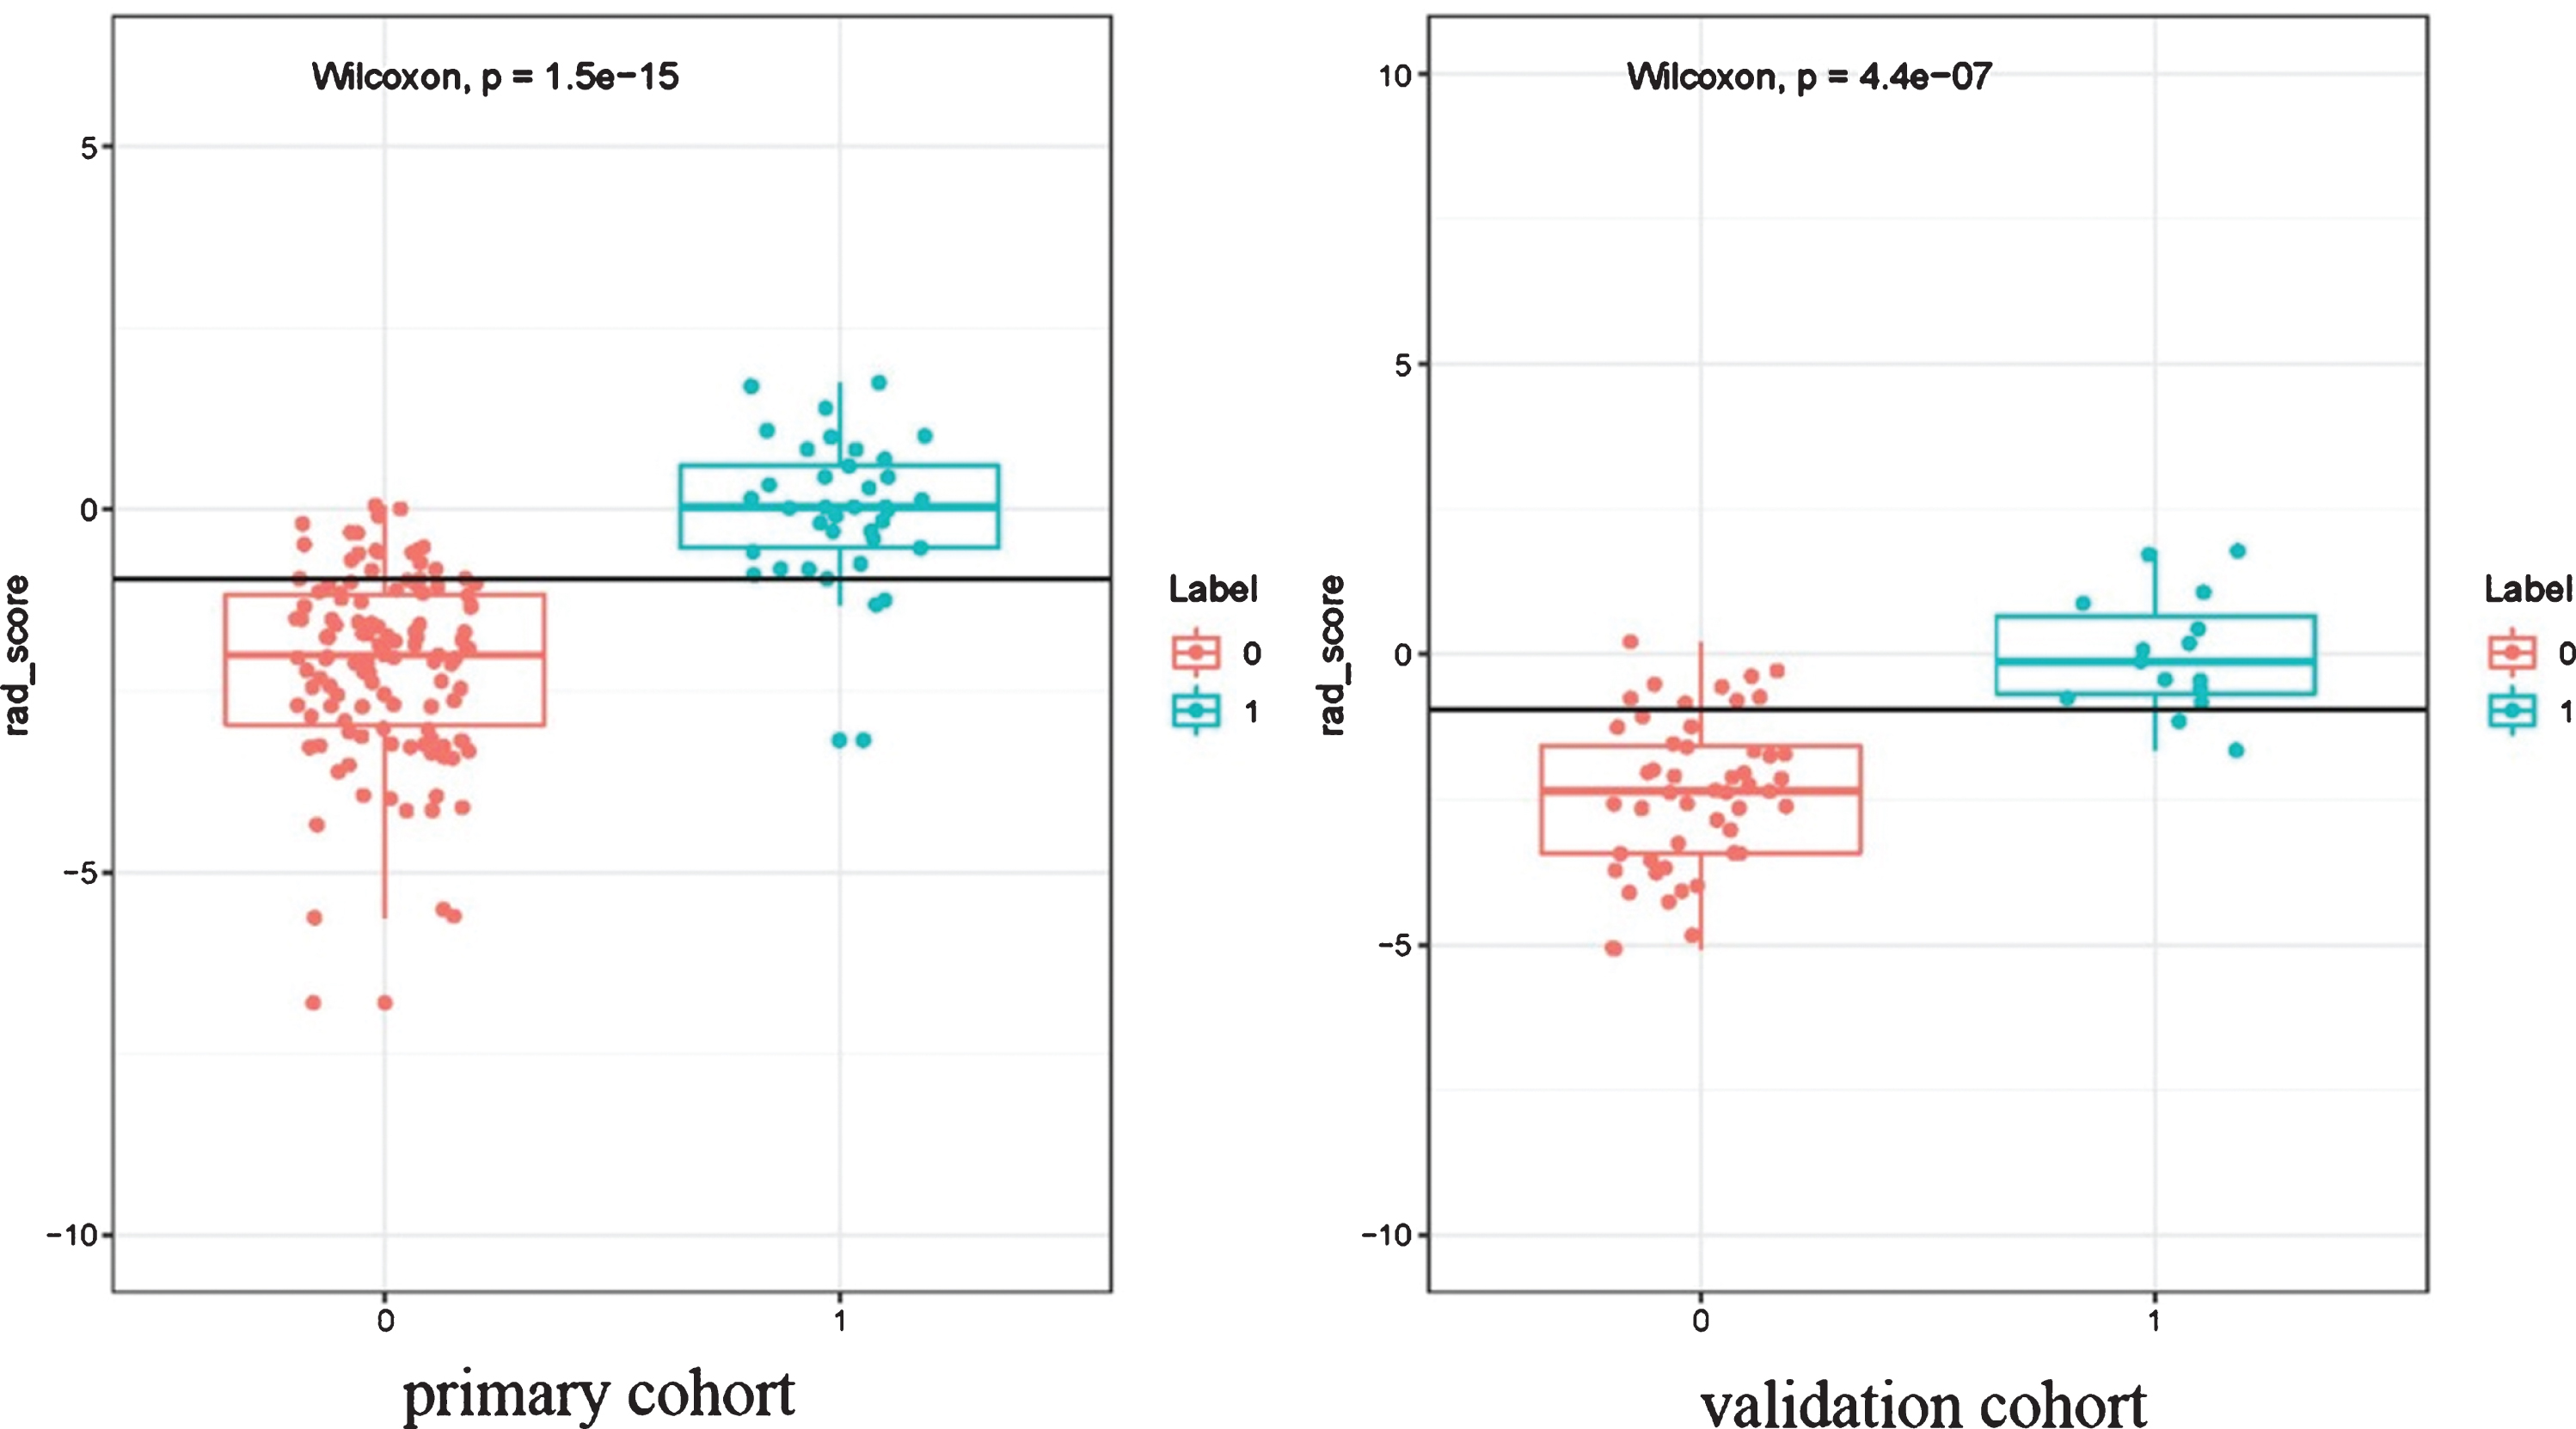
CT radiomics signatures score. Boxplots show the CT radiomics signatures in patients with MA were all much higher than the NMA group in both the training (a) and validation set (b). Each box represents 25th and 75th quartiles, the line inside each box represents the median, and the dots represent individual values.
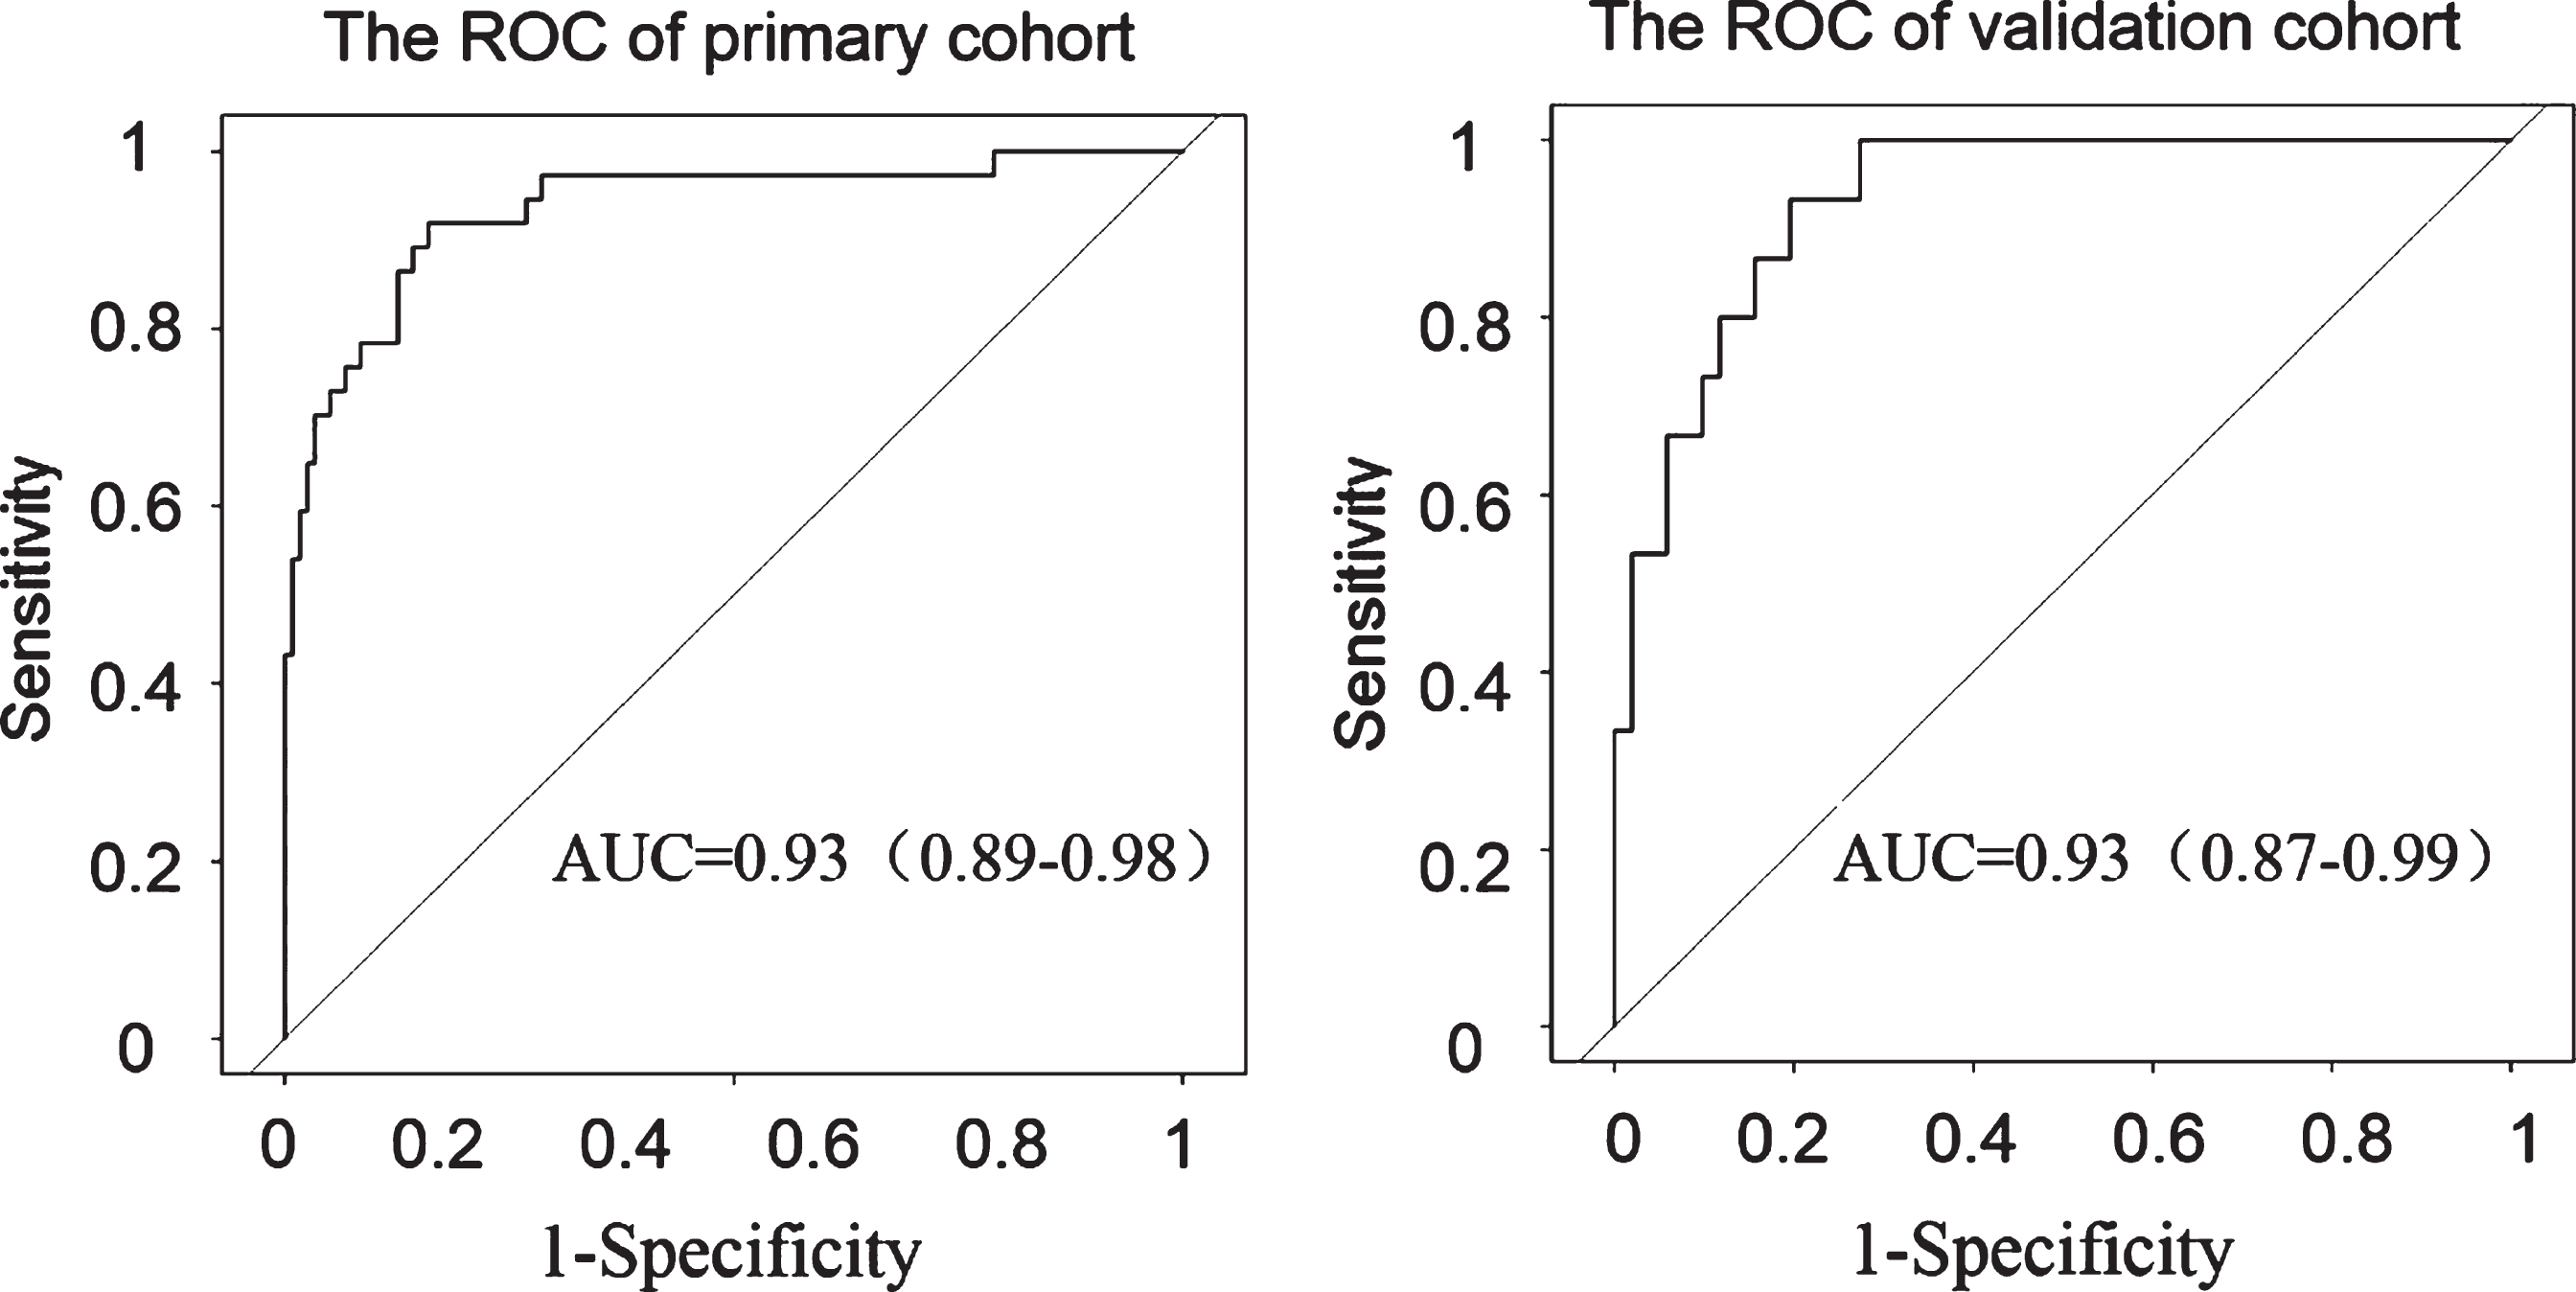
ROC curves of the radiomics signature. The ROCs of the radiomics nomogram in the training (a) and validation datasets (b), with the AUC of 0.93 in both groups.
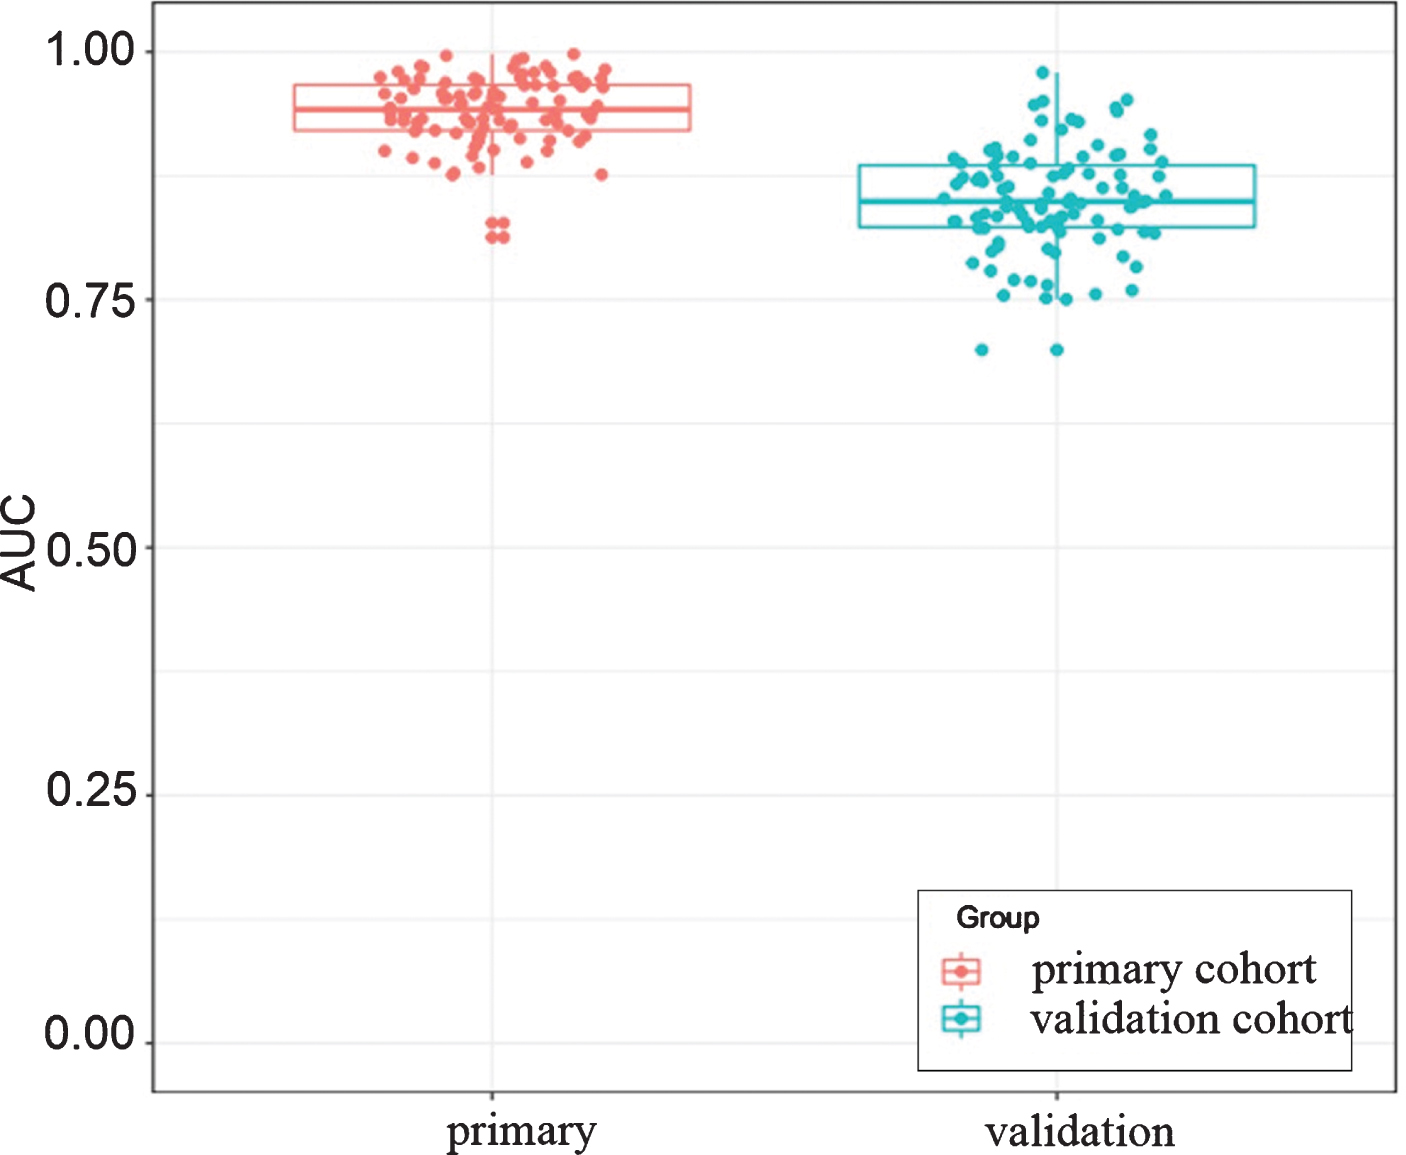
Boxplot of AUCs for LGOCV in primary cohort and validation dataset. 100 AUC values were obtained by LGOCV (leave group out cross validation). The mean AUC values for primary cohort and validation dataset was 0.94 and 0.85 respectively.
The decision curve showed relatively good performance for the model in terms of clinical application. While the probability of achieving ranges from 0 to 100%, using the proposed radiomics model to detect MA from NMA shows a greater advantage than either the scheme in which all patients are assumed to achieve MA or the NMA. The decision curve analysis result for the radiomics model was shown in Fig. 9.
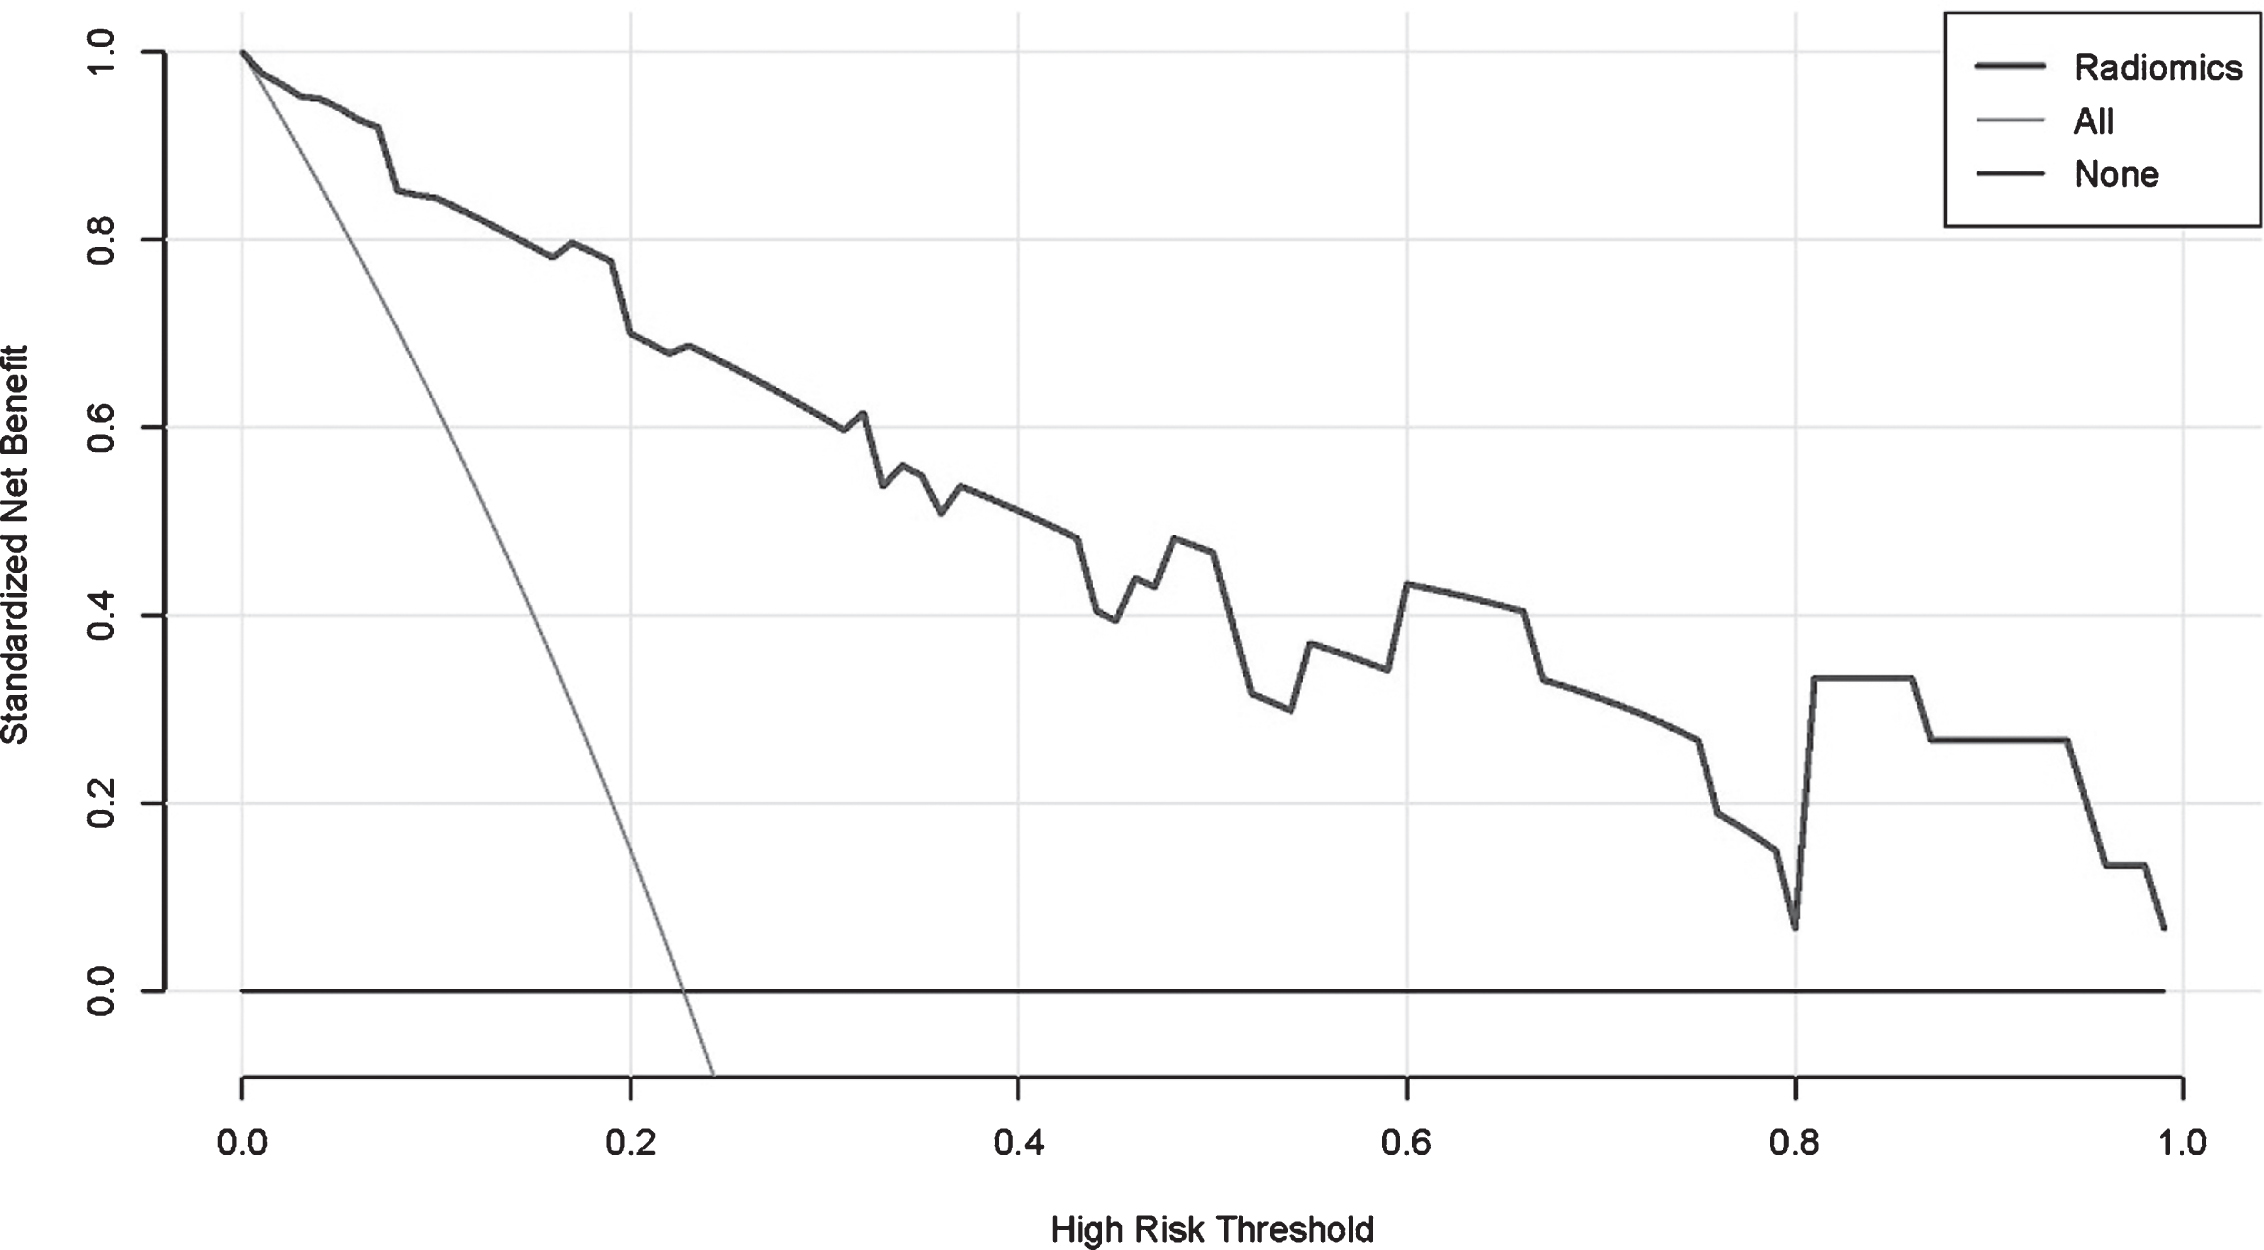
Decision curve analysis (DCA) for the radiomics nomogram. They-axis represents the net benefit. The x-axis represents the threshold probability. The blue line represents the radiomics nomogram. The grey line represents the assumption that all patients were MA. The black line represents the hypothesis that no patients were MA. The decision curve showed that using radiomics model to predict preoperative MA of rectal cancer would be beneficial.
In the present multicenter study, we investigated the ability of pretreatment contrast CT based radiomics analysis to predict MA to NMA in patients with rectal cancer. A radiomics model could achieve a better predictive performance in external validation cohorts than the conventional CT values, with an AUC of 0.93 and a relatively high sensitivity, specificity, PPV, and NPV. Furthermore, Decision curve analysis was also applied to confirm the clinical benefit.
Some radiological features by CT can be useful to differentiate MA from NMA according to papers of clinical experiments summary. MA showed higher percentage of occurrence of eccentric bowel-wall thickening and more areas with hypo attenuation. In addition, heterogeneous contrast enhancement was most common in MA [23]. Besides the three features above, Ko EY found that the solid portion of MA showed less enhancement than that of NMA and the overall specificity of CT features was 87% [24]. Of course, their results are based on subjective judgment, which may partly depend on the clinical experience of the observers’, and lack of quantitative observation indicators. In our study, we confirmed that CT values are useful to differentiate MA from NMA with a relatively high AUC value of 0.84 in contrast-enhanced portal. Yet the performance of pre-contrast CT values and D-values are still not satisfactory with an AUC of 0.75 and 0.78 respectively. In radiomics predictive model based on contrast CT image, the external validation cohorts showed a high specificity with 93.3% and a satisfactory AUC of 0.93.
The accuracy for MRI to identify MA and NMA seems to be excellent. Most MA showed a predominantly high signal intensity and a peripheral contrast-enhancement pattern [25]. Another report indicated that the accuracies of the diagnosis of MA were 96%–97% [26]. However, only 16 of their study were diagnosed with MA. Although MRI has shown satisfactory performance in differentiating MA from NMA, patients with contraindications cannot be performed MRI and what’s more, MRI in the pelvic could not be evaluated for distant metastases in other areas. However, in contrast, CT plays an important role in preoperative TNM staging of rectal cancer [27]. Due to the development of radiomics, the pathological type of rectal cancer can be identified by extracting CT image data. The present study showed the feasibility of the CT radiomics features for predicting MA in rectal cancer patients. In our study, 396 quantitative image features of tumors were extracted using portal venous phase CT image, which can provide high image quality and anatomic details in rectal cancer [19]. The current study showed a better predictive performance with a high AUC value of 0.93 in both the training and validation cohorts, which are useful to differentiate MA from NMA. More importantly, we applied a completely independent validation dataset from another institution to confirm the discrimination power of radiomics signature built in training dataset.
In all computed radiomics features, the gray-level histograms and texture features are useful in feature extraction and in classification. Lei Yang et. al proposed that CT-based radiomics signature is associated with KRAS/NRAS/BRAF mutations, of course, the three top features of the overall extracted features set were all the Gray Level Co-occurrence Matrix (GLCM) features [28]. A recent study on assessing the relationship between texture features extracted from contrast-enhanced and non-contrast-enhanced CT images of primary colorectal cancer to determine that if radiomics features can provide potential complementary information regarding outcome. They found that texture features had significant association with survival [29]. The texture features analysis on MR imaging was also proven to be encouraging in discriminating lymph node metastasis in patients with esophageal cancer in which 6 out of 9 extracted features were texture features [30]. Our results highlighted the value of the texture features and gray-level histograms from portal venous contrast CT, which were more discriminative than those other features. In our study, sixteen of 19 extracted radiomics features were texture features, other 3 features were all the first order features. The three top features selected from the overall feature set namely, SmallAreaEmphasis, ClusterShade_angle0_offset7, GLCMEntropy_angle135_offset1, were all the Gray-level histograms and texture features.
There are several limitations to this study. First, we only extracted the radomics features from CT image, and some multimodality medical images such as MRI, PET-CT are not included in this study. Second, as a retrospective study, CT imaging quality may not be satisfactory in some cases. The bias generated between different CT machines is difficult to control. Third, we only perform radiomics analysis on portal venous phase CT image, and perhaps pre-contrast CT images as well as arterial phase images could provide more useful radiomics information. Moreover, a larger multicenter database combining genomic and clinical information could potentially improve the confidence and performance of the current model.
In conclusion, this study demonstrated that applying CT radiomics feature-based classification models yielded a satisfactory predictive performance than using the conventional CT values, which indicated that CT radiomics features can be utilized as a noninvasive biomarkers to help identify patients with MA from NMA. As a result, it may benefit to realize the goal of individualized treatment of cancer patients.