



Abstract
OBJECTIVES:
This study aims to evaluate diagnostic performance of radiomic analysis using computed tomography (CT) to identify lymphovascular invasion (LVI) in patients diagnosed with rectal cancer and assess diagnostic performance of different lesion segmentations.
METHODS:
The study is applied to 169 pre-treatment CT images and the clinical features of patients with rectal cancer. Radiomic features are extracted from two different volumes of interest (VOIs) namely, gross tumor volume and peri-tumor tissue volume. The maximum relevance and the minimum redundancy, and the least absolute shrinkage selection operator based logistic regression analyses are performed to select the optimal feature subset on the training cohort. Then, Rad and Rad-clinical combined models for LVI prediction are built and compared. Finally, the models are externally validated.
RESULTS:
Eighty-three patients had positive LVI on pathology, while 86 had negative LVI. An optimal multi-mode radiology nomogram for LVI estimation is established. The area under the receiver operating characteristic curves of the Rad and Rad-clinical combined model in the peri-tumor VOI group are significantly higher than those in the tumor VOI group (Rad: peri-tumor vs. tumor: 0.85 vs. 0.68; Rad-clinical: peri-tumor vs. tumor: 0.90 vs 0.82) in the validation cohort. Decision curve analysis shows that the peri-tumor-based Rad-clinical combined model has the best performance in identifying LVI than other models.
CONCLUSIONS:
CT radiomics model based on peri-tumor volumes improves prediction performance of LVI in rectal cancer compared with the model based on tumor volumes.
Introduction
Colorectal cancer is the third most common cancer in the world [1]. In recent years, an increase incidence has been noted among population younger than 50 years [2], and the mortality rate is among the highest in malignancies. In rectal cancer, the survival rate has increased in recent decades, partly due to the early diagnosis of tumors, accurate staging, and the improvement of treatment [3]. Apart from T stages, lymphovascular invasion (LVI) is an important factor affecting the prognosis of rectal cancer [4]. LVI refers to the presence of tumor cells in the endothelium-lined luminal space outside the muscularis propria of the rectum or the destruction of the lymphovascular wall by tumor cells. The spread of cancer cells through lymphatic vessels or venules may be a key step in the early stage of lymph node metastasis [5, 6]. The National Comprehensive Cancer Network Clinical Practice Guidelines recommend preoperative chemoradiotherapy for patients with T3N0M0 and LVI-positive rectal cancer. Therefore, the evaluation of LVI preoperatively may contribute to improved patient care.
Considering LVI is identified in the pathology specimen after surgery, it does not play a role in preoperative treatment planning for patients with rectal cancer. MRI is traditionally a highly accurate and reproducible modality for preoperative identification of LVI [6]. However, evaluating the status of LVI is difficult, especially for inexperienced radiologists, because small vein invasion may be easily overlooked [7–9]. The overall accuracy of MRI LVI evaluation was as low as approximately 60% for inexperienced radiologists [9, 10]. Diagnostic performance be promoted by targeted training for inexperienced radiologists. However, training consumes much time and social resources.
Computed tomography (CT), as an important examination for TNM staging of rectal cancer preoperatively, is widely used in clinical assessment of distant metastasis [11]. However, limited by resolution on conventional CT images, evaluating LVI is difficult for radiologists, with a low accuracy of 59% [12]. Radiomics, a high-throughput post-processing technique capable of extracting large numbers of quantitative “features” from routinely acquired medical imaging, could potentially provide new insights into the underlying biologic tumor characteristics without increasing medical costs [13, 14]. In recent years, a handful of studies investigating radiomics for TNM stage, pathology, or response prediction in rectal cancer showed exciting results [15, 16]. In the CT images of rectal cancer, several quantitative information that could potentially predict LVI may be present, but those in the areas of primary tumor or the fat space around the primary tumor are likely to be ignored by the naked eye. However, radiomics based on CT images is still rarely used for LVI prediction.
In this study, the advantage of multimodal radiomics from CT images with two different lesion segmentations for individualized preoperative prediction of LVI in rectal cancer was explored.
Material and methods
Patients
This study was a multicenter study with patients retrospectively enrolled from two Chinese hospitals in different provinces of China, and it was approved by the Ethics Committee of the two participating hospitals, with the requirement for informed consent waived. From October 2015 to October 2019, 256 patients with primary rectal cancer were enrolled based on the following inclusion criteria: (1) the case was confirmed by operation and pathology as rectal cancer and (2) patients had received a standard contrast-enhanced pelvic CT < 30 days before operation. The exclusion criteria included (1) patients who received treatment (radiotherapy or chemotherapy) before CT (n = 33) and (2) unclear images or tumors that were too small to outline the boundaries (n = 7). Finally, the study population consisted of 169 patients. Figure 1 demonstrates a flow diagram of patient selection. The entire cohort was divided into a training cohort (n = 119) and an independent external validation cohort (n = 50) from another hospital. The training cohort with a larger number of cases from one hospital was used to build radiomic models, and the validation cohort with a small number of patients from another hospital was used to validate the models. The details of the clinical and histopathological characteristics are shown in Table 1.
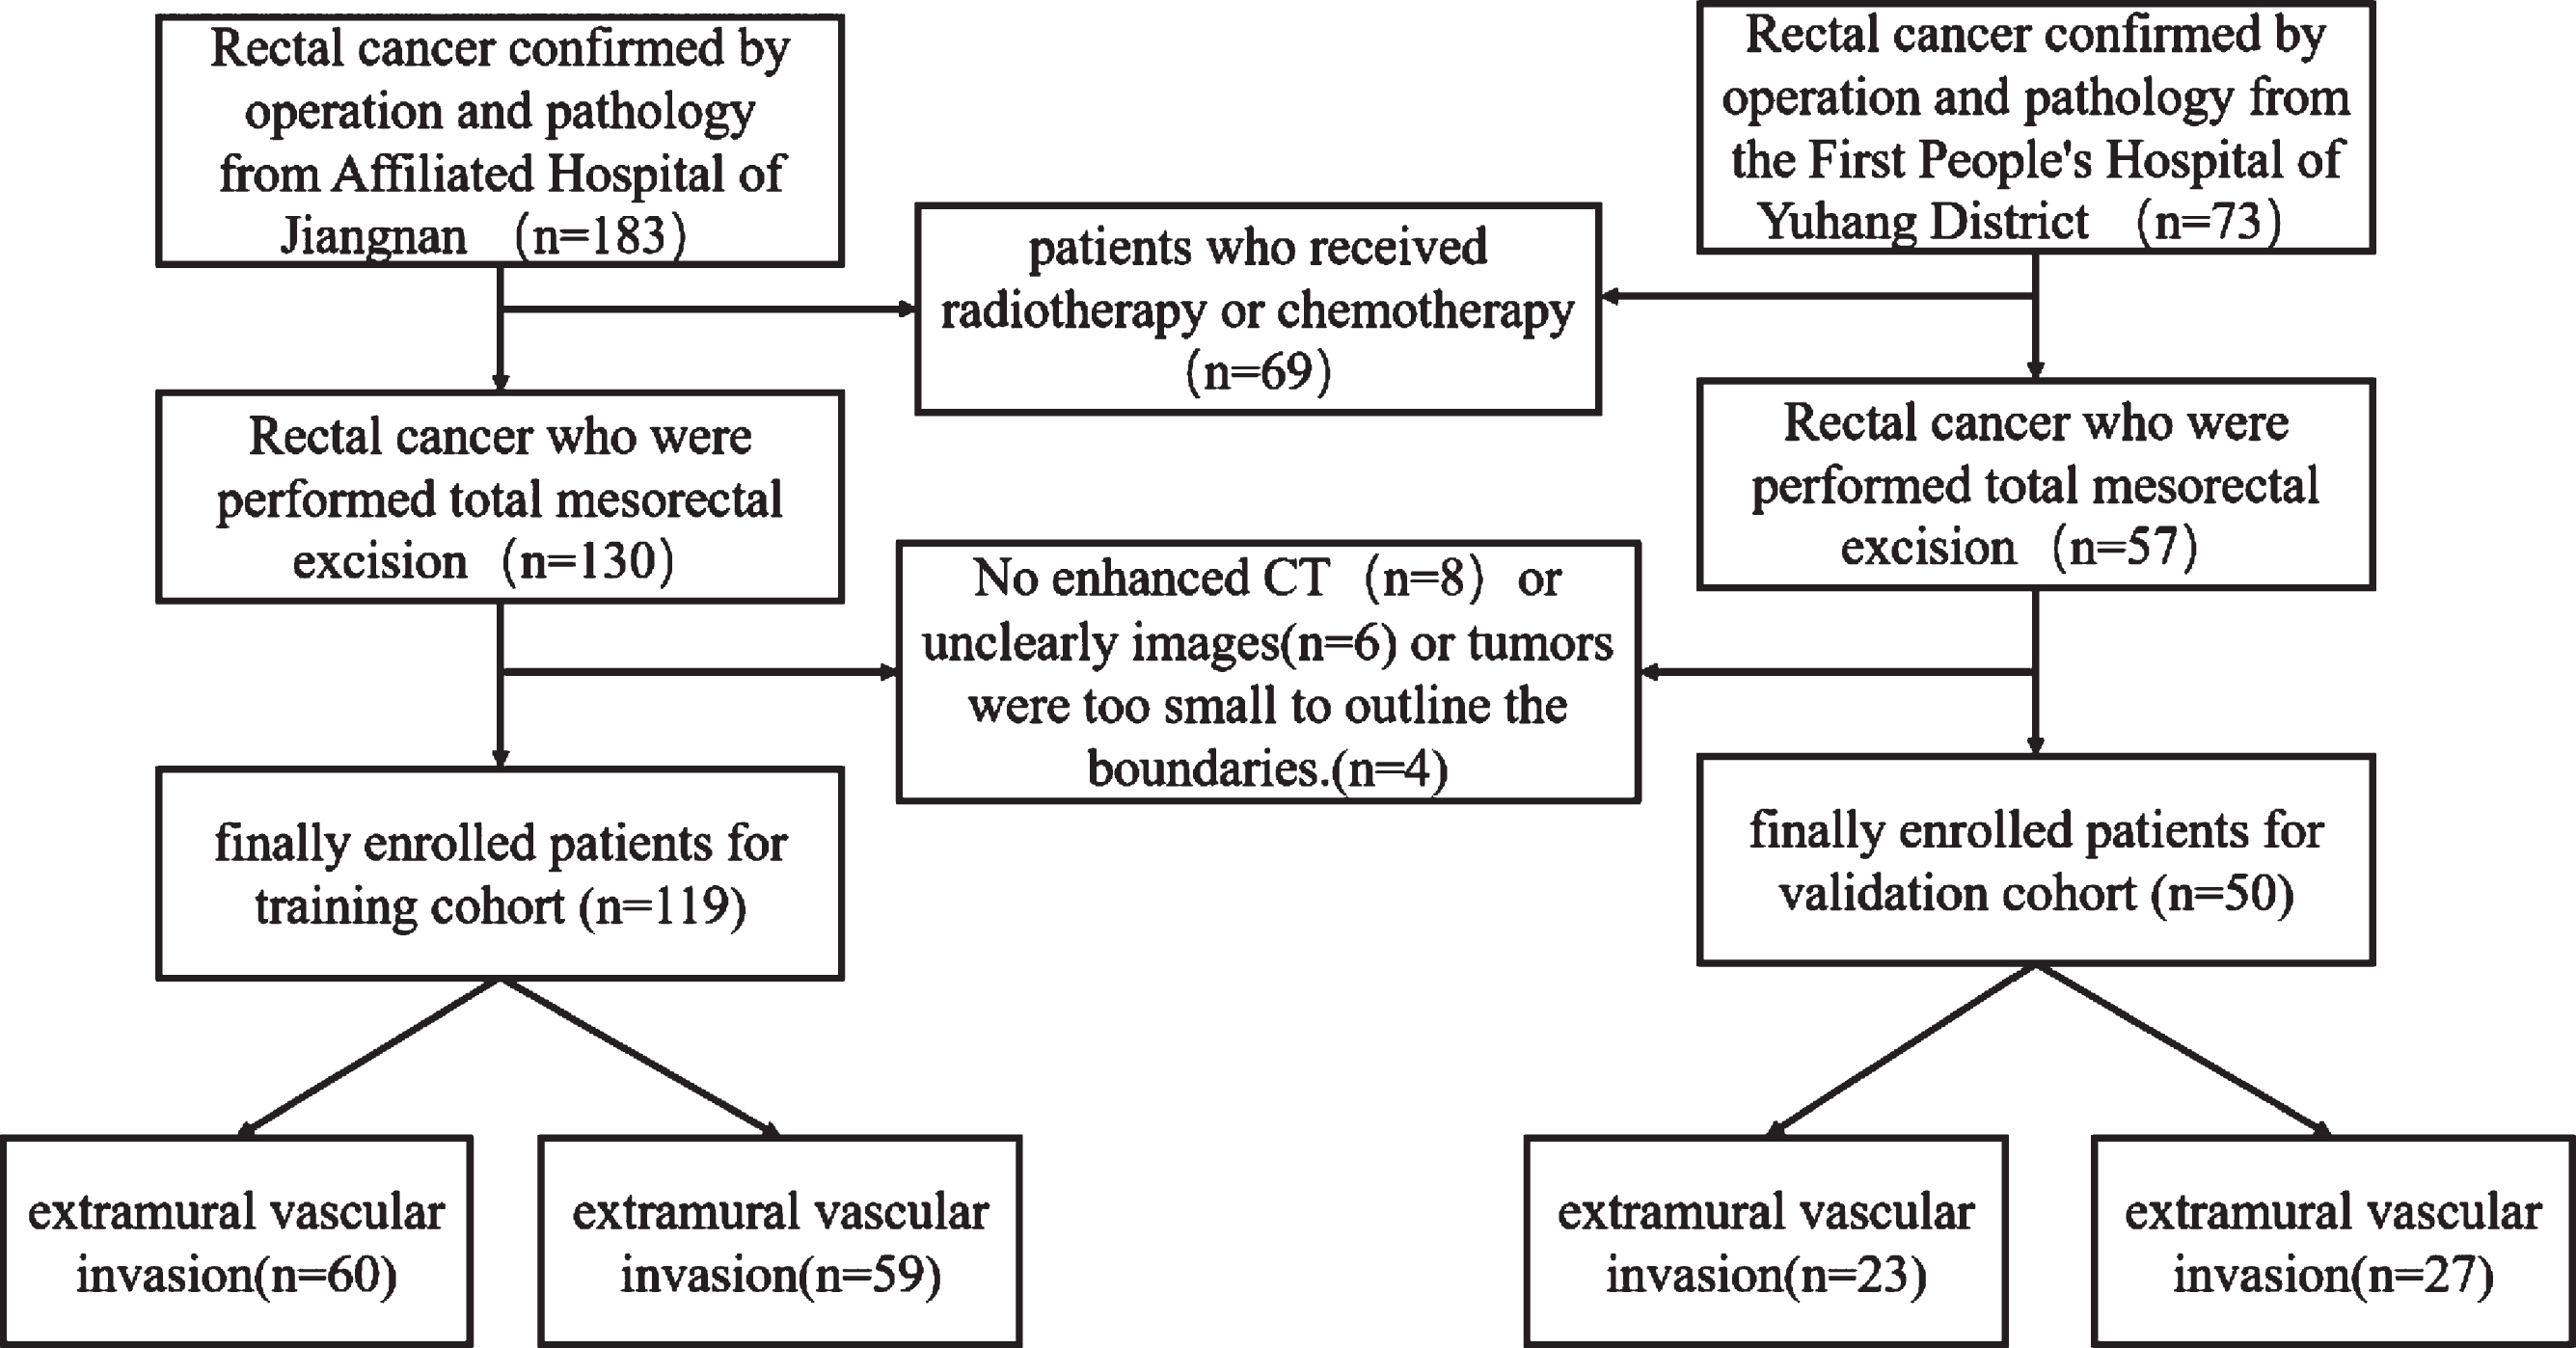
Flow diagram of patient selection.
Clinical characteristics of the training and validation cohort for lymphovascular invasion of rectal cancer
The patients were placed in supine position and asked to hold their breath to complete all scans. All CT images were acquired on Somatom Sensation 64 (Siemens Medical Solutions, Forchheim, Germany) or GE Optima CT660 scanner (GE Medical Systems, Milwaukee, Wisconsin) with slice thickness and spacing of 5 mm, tube voltage of 120 kV, tube current of 100 mA, matrix of 512×512, and pitch of 0.984 : 1. After the unenhanced image was scanned, 90 ml of contract agent ioversol (320 mgI/ml) was injected using an automatic high-pressure syringe through the median cubital vein at an injection speed of 2.5 ml/s. Then, enhanced images of the portal venous phase were obtained by delaying for 70 s after the injection. Figure 2 depicts a flowchart of this study.
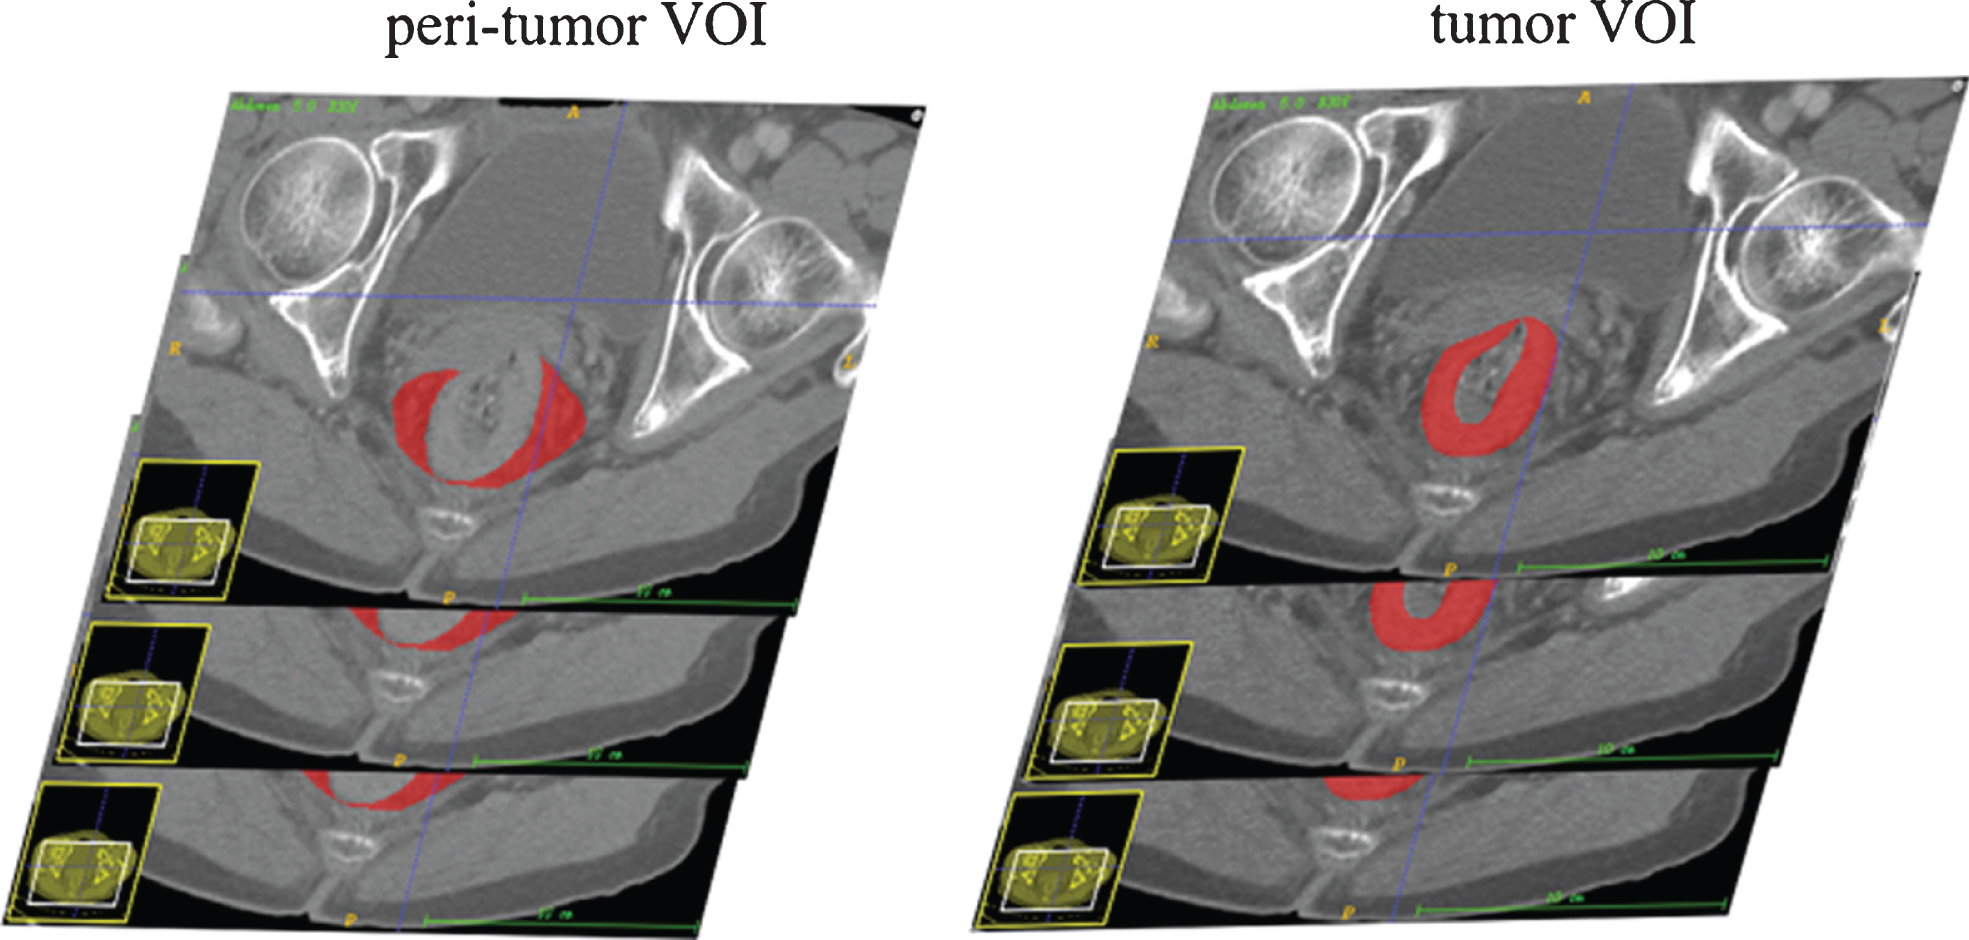
Different outlining methods for labeling tumor VOI and peri-tumor VOI.
Tumor segmentation was conducted using an open-source software package (ITK-SNAP, version 3.4.0, www.itksnap.org). Two independent radiologists (readers 1 and 2 with 12 and 8 years of experience in abdominal imaging, respectively) delineated the VOIs manually without knowing the clinicopathological results. Two different VOI segmentations, including tumor VOI and peri-tumor VOI, were drawn for each patient from the CT images on each tumor slice (Fig. 2). After the tumor VOI was delineated, the radiologists were required to draw the whole primary tumor, including the chords and burrs connected to the tumor but excluding the non-invaded rectal wall, intestinal lumen, vessel shadow, and perirectal fat. In the peri-tumor VOI, the adipose tissue around the tumor on each slice must be outlined along the outer edge of the tumor and the medial edge of the mesorectum fascia or peritoneum, including blood vessels and lymph nodes in the adipose tissue.
Radiomic feature extraction
VOIs were performed for the subsequent feature extraction by using a radiomic module (backed by Pyradiomics) embedded in the open-source software package 3D Slicer (version 4.9, http://www.slicer.org). The extraction features were divided into four groups, including morphological, gray scale statistic, texture, and Gabor wavelet features. After being normalized to a standard range, these features were used in the radiomic model for LVI status analysis of rectal cancer. The inter-observer reproducibility of the radiomic feature extraction was evaluated using intraclass correlation coefficients (ICCs). When ICC exceeded 0.80, it was considered as good agreement.
Feature selection and model building
Feature selection and model building were performed on R software (version 2.15.3 www.r-project.org). Two feature selection methods, namely, maximum relevance and minimum redundancy (mRMR) and least absolute shrinkage selection operator (LASSO) regression, were used to eliminate redundant and irrelevant features and select the most predictive features. The radiomic score was calculated by summing the selected features and then multiplying the corresponding coefficients for each patient. After univariate statistical tests were conducted, multivariate logistic regression analysis using backward stepwise selection was applied to develop the clinical model and select the significant clinical features. Rad-clinical models were constructed by combining the clinical factors and the radiomic score on two different VOI methods. Delong’s test was used to compare differences between the models.
Validation and nomogram construction
The areas under the receiver operating characteristic curves (AUCs) on two different VOIs were used to estimate the predictive performance of the Rad and Rad-clinical models on the validation cohort by using the features selected on the training cohort. A Rad-clinical prediction model was also developed with the selected radiomic features combined with the clinical characteristics. The Rad model was built with the selected radiomic characteristics alone. Calibration curves were drawn to depict the performance characteristics of the multimodal radiomic models. Radiomic nomograms were constructed depending on the multivariate logistic regression model. Hosmer–Leme and decision curve analyses were used to assess the goodness-of-fit of the nomogram and evaluate the clinical usefulness of the multimodal radiomics.
Statistical analysis
Statistical analysis was performed using SPSS 23.0 (IBM) and R software (version 3.4.2, http://www.Rproject.org). The differences in clinical characteristics between the primary cohort dataset and the validation cohort dataset were analyzed using cross tabulations for categorical variables and t test for continuous variables conforming to the normal distribution and homogeneity of variance. The consistencies of the measurements between the two observers were tested using ICCs. Mann–Whitney U test was conducted for common comparisons of patients’ characteristics and the radiomic features for continuous variables between LVI positive and negative. Univariate statistical tests and multivariate regression analysis for prediction model building were performed on R software. Receiver operating characteristic (ROC) analysis was used to compare the diagnostic capabilities, and Delong’s test was adopted to compare the difference in AUCs between the two models. P < 0.05 indicated a statistically significant difference.
Results
Clinical findings
A total of 169 patients from two different hospitals were recruited for analysis. Eighty-three cases were confirmed by pathology as LVI positive, and 68 cases were confirmed to be LVI negative. The cases from the institution with a large number of cases were used for training (119 cases), while the cases from the other institution were used for validation (50 cases). No differences were observed between the primary and validation cohorts in terms of patient age, gender, T stage, N stage, CEA, and pathological differentiation (all p values > 0.05, Table 1).
Radiomic features
The inter-observer reproducibility of radiomic features was satisfactory with ICCs more than 0.80 for all the extracted features. In addition, mRMR and LASSO regression analyses comparing the LVI-positive and LVI-negative groups were performed on the training cohort to reduce overfitting and select the most informative radiomic features to develop a prediction model. The results showed that in the tumor VOI group, 13 out of 396 radiomic features were retained for establishing a radiomic model with calculated Rad score. In the peri-tumor VOI group,10 out of 396 radiomic features were included.
Radiomic model conduction and comparison
The Rad score for the tumor model based on tumor VOI was calculated by summing the selected features weighted by their coefficients (Fig. 3). The final formula for the Rad score is as follows:
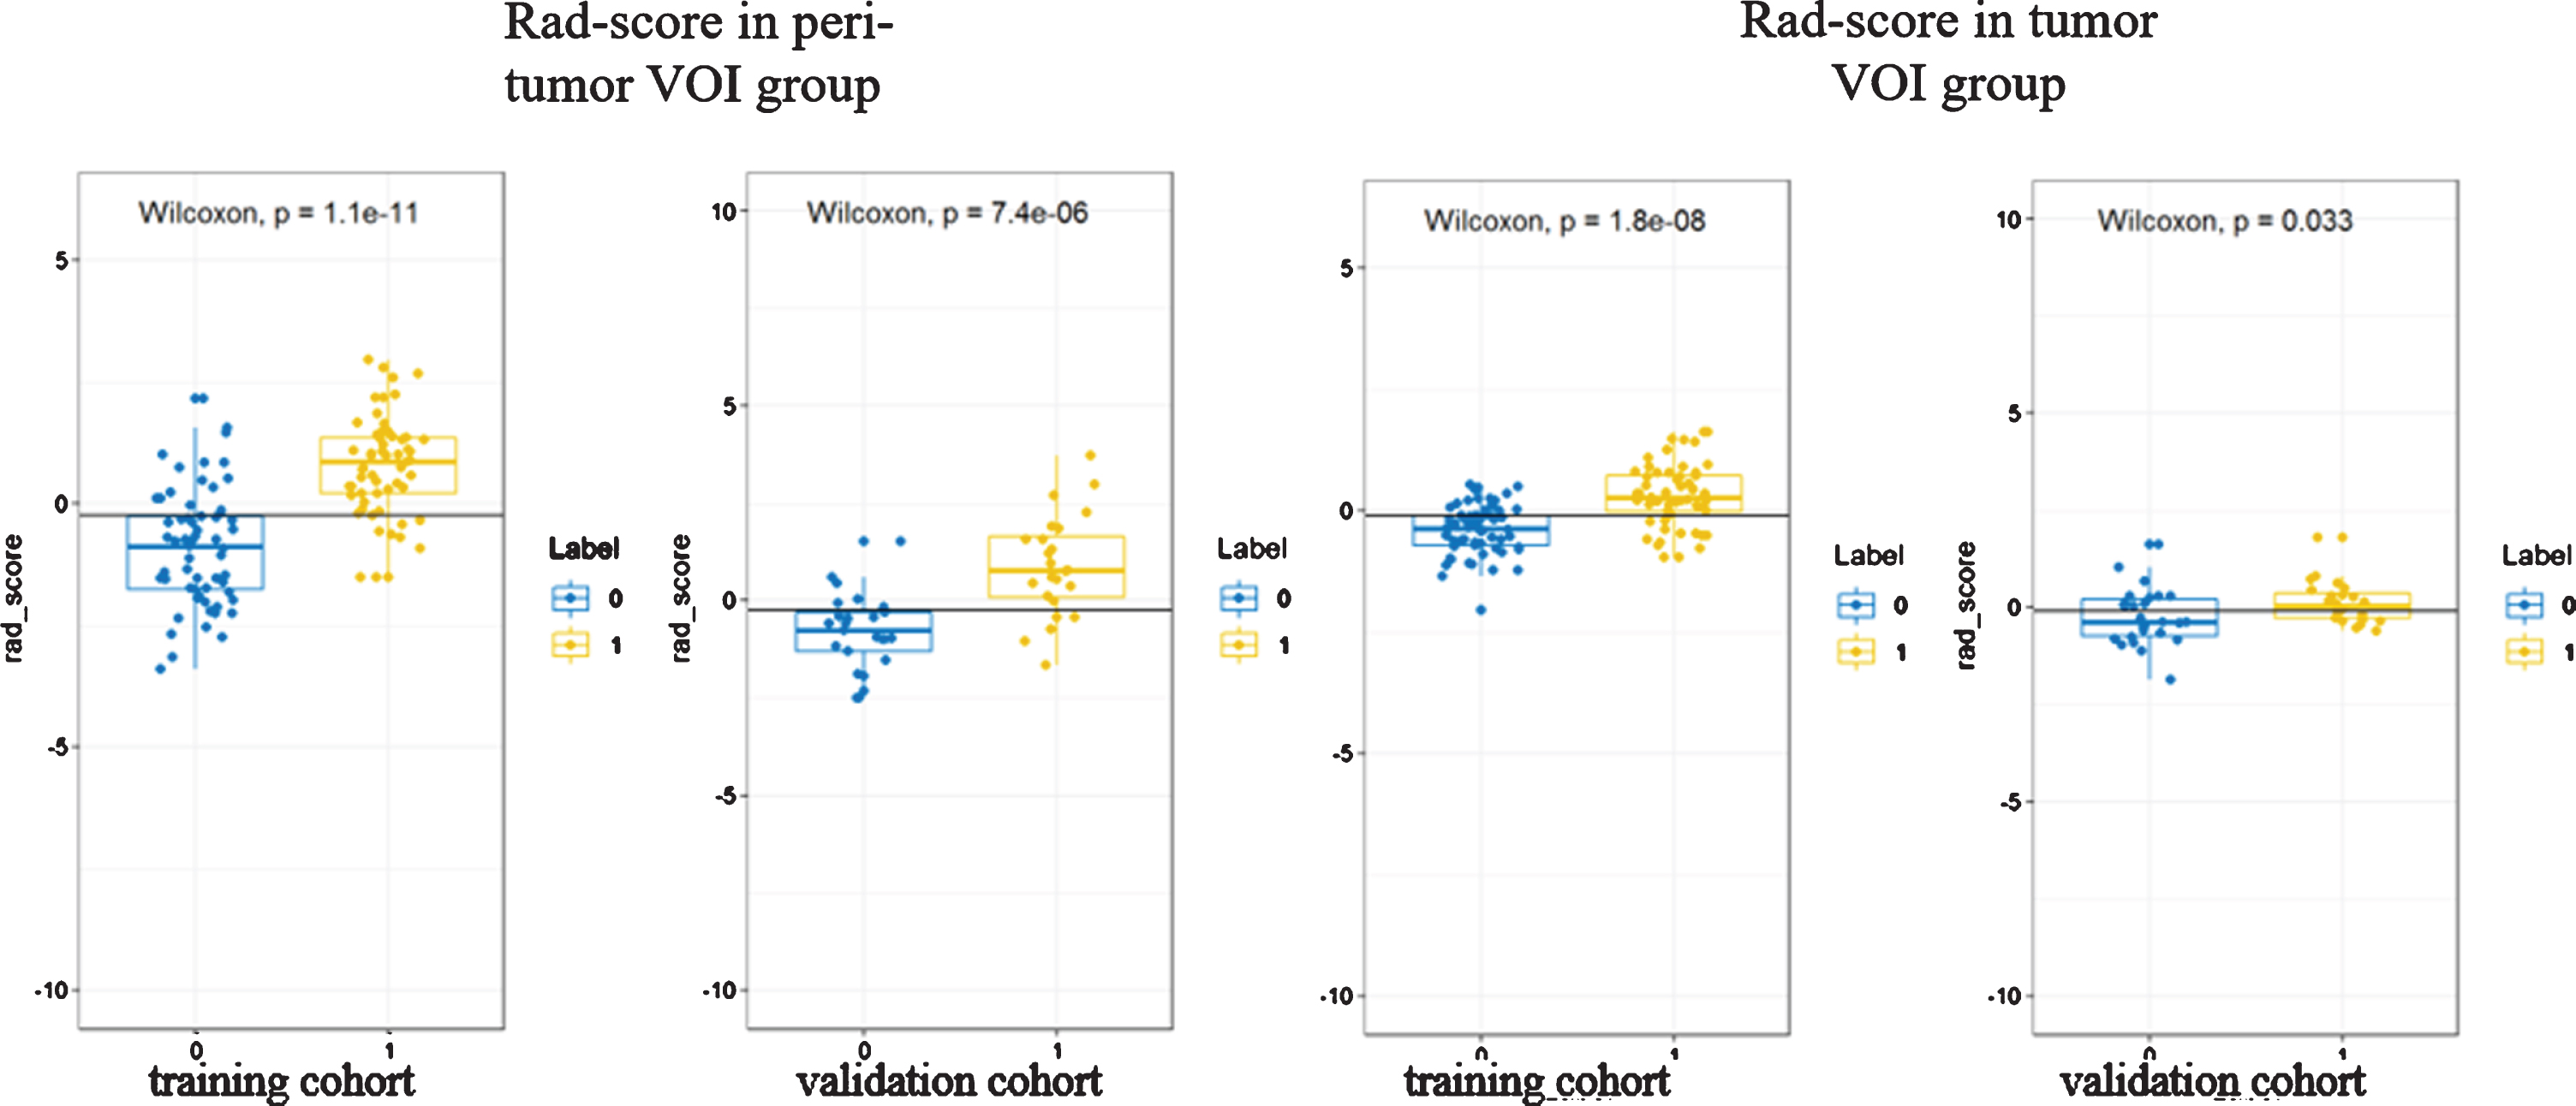
Comparison of Rad-scores between tumor VOI group and peritumor VOI group in training and validation groups.
tumor Rad score = 0.325×wavelet-LLL_glcm_Imc2 – 0.085× wavelet-HHH_glszm_GrayLevelNonUniformityNormalized + 0.035×log-sigma-5 – 0 mm –3D_firstorder_Median + 0.065×wavelet-HHL_first_order_Median – 0.248× wavelet-LLL_gldm_DependenceVariance + 0.188× wavelet-LHH_glszm_LargeAreaLowGrayLevelEmphasis + 0.204× wavelet-HHH_glszm_SmallAreaLowGrayLevelEmphasis – 0.003×log-sigma-5 – 0 mm –3D_gldm_ DependenceVariance + 0.035×wavelet-LLH_firstorder_Kurtosis – 0.11× original_shape_Elongation – 0.16×log-sigma-5 – 0 mm-3D_glszm_SmallAreaEmphasis + 0.343×log-sigma-4 – 0 mm-3D_glszm_SmallAreaLowGrayLevelEmphasis + 0.014× wavelet-LLL_firstorder_90Percentile – 0.052.
The Rad scores between the LVI-positive and -negative groups on the training and validation cohorts are shown in Fig. 2. The AUC values for the radiomic signature based on the tumor volume were 0.80 (95% CI:0.72–0.88) in the primary cohort and 0.68 (95% CI: 0.52–0.83) in the validation cohort, respectively, as shown in Fig. 3. The predictive performance details of radiomic signature are enumerated in Table 2.
The performance of each models in the train and validation cohorts
The Rad score for the peri-tumor model based on peri-tumor VOI (Fig. 3) was obtained using the following integration formula:
peri-tumor Rad score = 0.525×original_shape_Elongation + 0.506×log-sigma-1–0 mm- 3D_glrlm_LongRunLowGrayLevelEmphasis – 0.426×log-sigma-1–0 mm- 3D_glszm_SmallAreaEmphasis + 0.048×wavelet-LLL_glcm_Correlation + 0.154× wavelet-LLH_gldm_LargeDependenceEmphasis – 0.454× original_glrlm_GrayLevelNonUniformityNormalized + 0.199× wavelet-LLH_glrlm_RunEntropy + 0.302×wavelet-LLL_firstorder_RootMeanSquared + 0.083×wavelet-HHH_glszm_SmallAreaHighGrayLevelEmphasis + 0.13× wavelet-LLL_gldm_DependenceEntropy – 0.089.
The AUC values for the radiomic signature based on the peri-tumor volume were 0.86 (95% CI: 0.79–0.93) in the primary cohort and 0.85 (95% CI: 0.74–0.96) in the validation cohort (Fig. 4). The predictive performance details of radiomics signature are shown in Table 2. The Delong test showed that the AUC value for the peri-tumor VOI model was significantly higher than that for the tumor VOI model (0.85 vs. 0.68) in the validation cohort. (z = 2.58, p = 0.01).
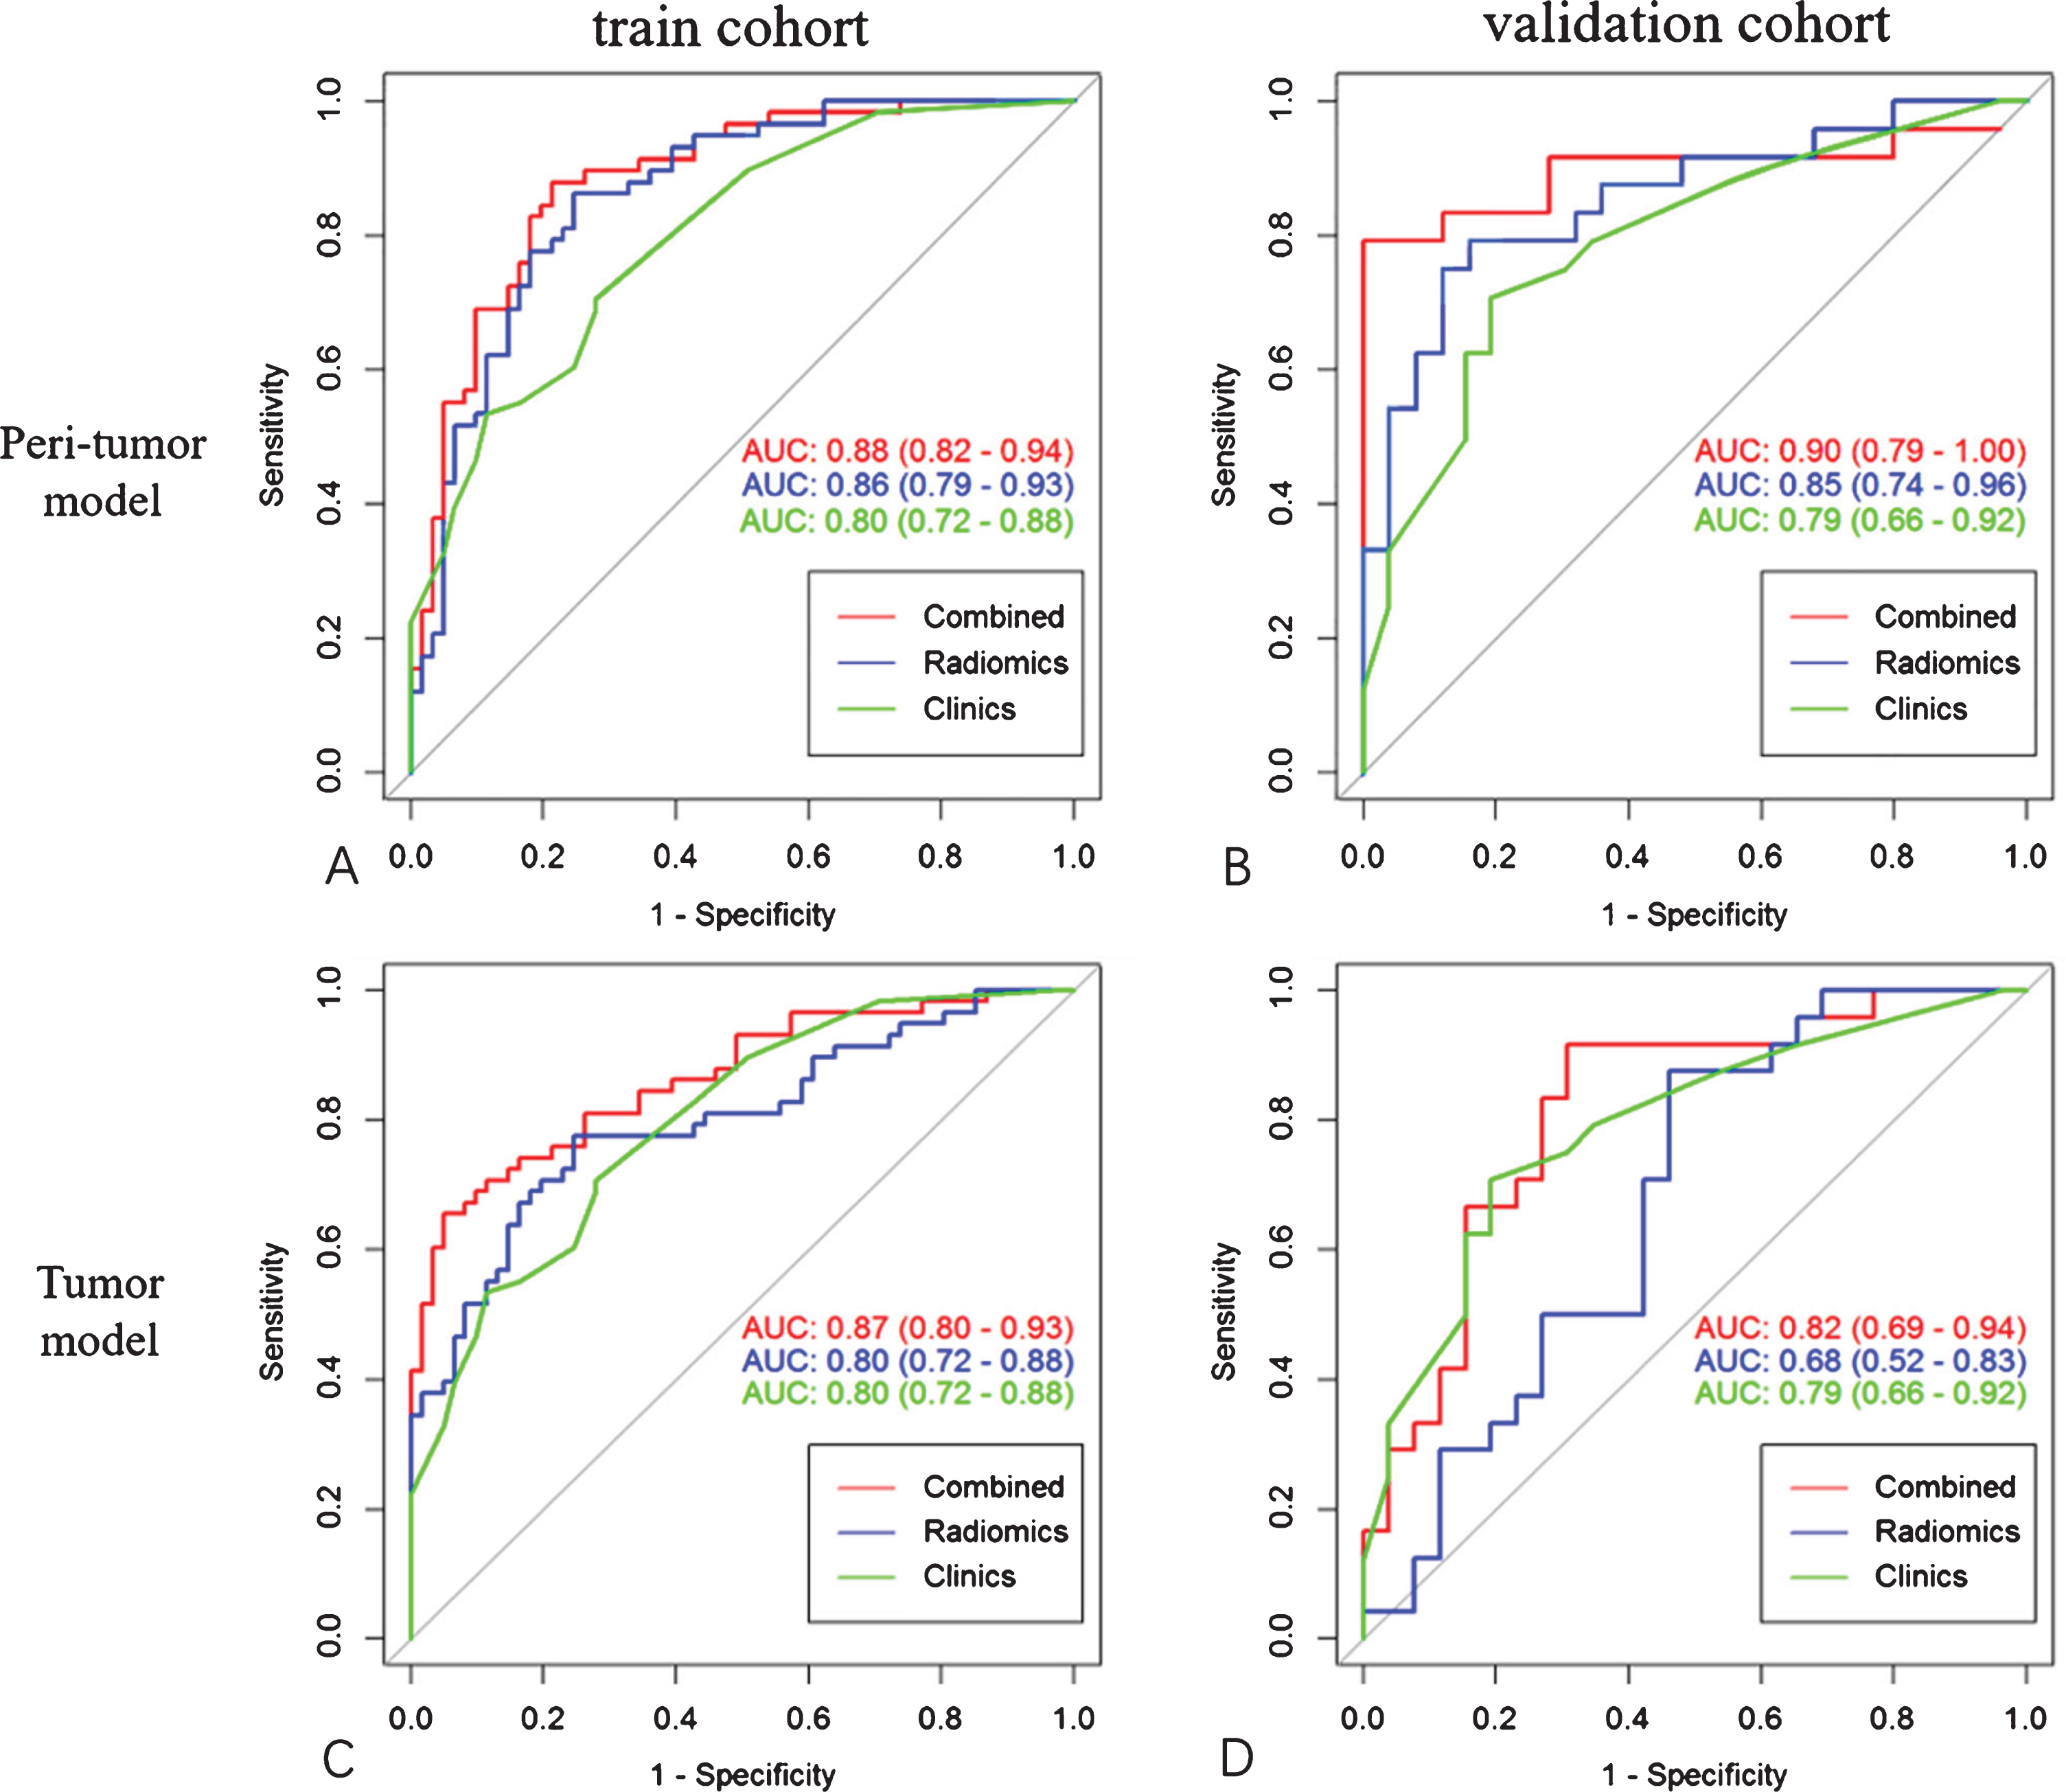
Area under the ROC curves of each radiomics model.
Four of the six features were retained after univariate analysis. Subsequently, four factors (including patient age, CEA, T stage, and N stage) were selected using multivariate logistic regression model, while gender and degree of differentiation were not selected for the construction of clinical model for LVI prediction. The AUC values for the clinical model were 0.80 (95% CI: 0.72–0.88) in the primary cohort and 0.79 (95% CI: 0.66–0.92) in the validation cohort (Table 2).
Rad-clinical combined models for LVI estimation were established by applying multivariate logistic regression analysis on the basis of the selected clinical and radiomic features. The AUC value for the combined model in the peri-tumor VOI group was significantly higher than that in the tumor VOI group, with 0.90 versus 0.82 in the validation cohort (z = 2.01, p = 0.04). The AUC values of all models are shown in Fig. 4.
Model calibration and clinical utility
The combined model was also presented as a form of nomogram on peri-tumor VOI (Fig. 4). The calibration curves showed that the predicted risks were consistent with the observed outcomes of LVI (Fig. 5). The decision curve showed relatively good performance for the model with Rad-score than without Rad-score in terms of clinical application in peri-tumor VOIs. The decision curve analysis result for the radiomics model was shown in Fig. 6. The nomogram had higher clinical utility than the clinical model at the threshold ranging from 0.10 to 0.85.
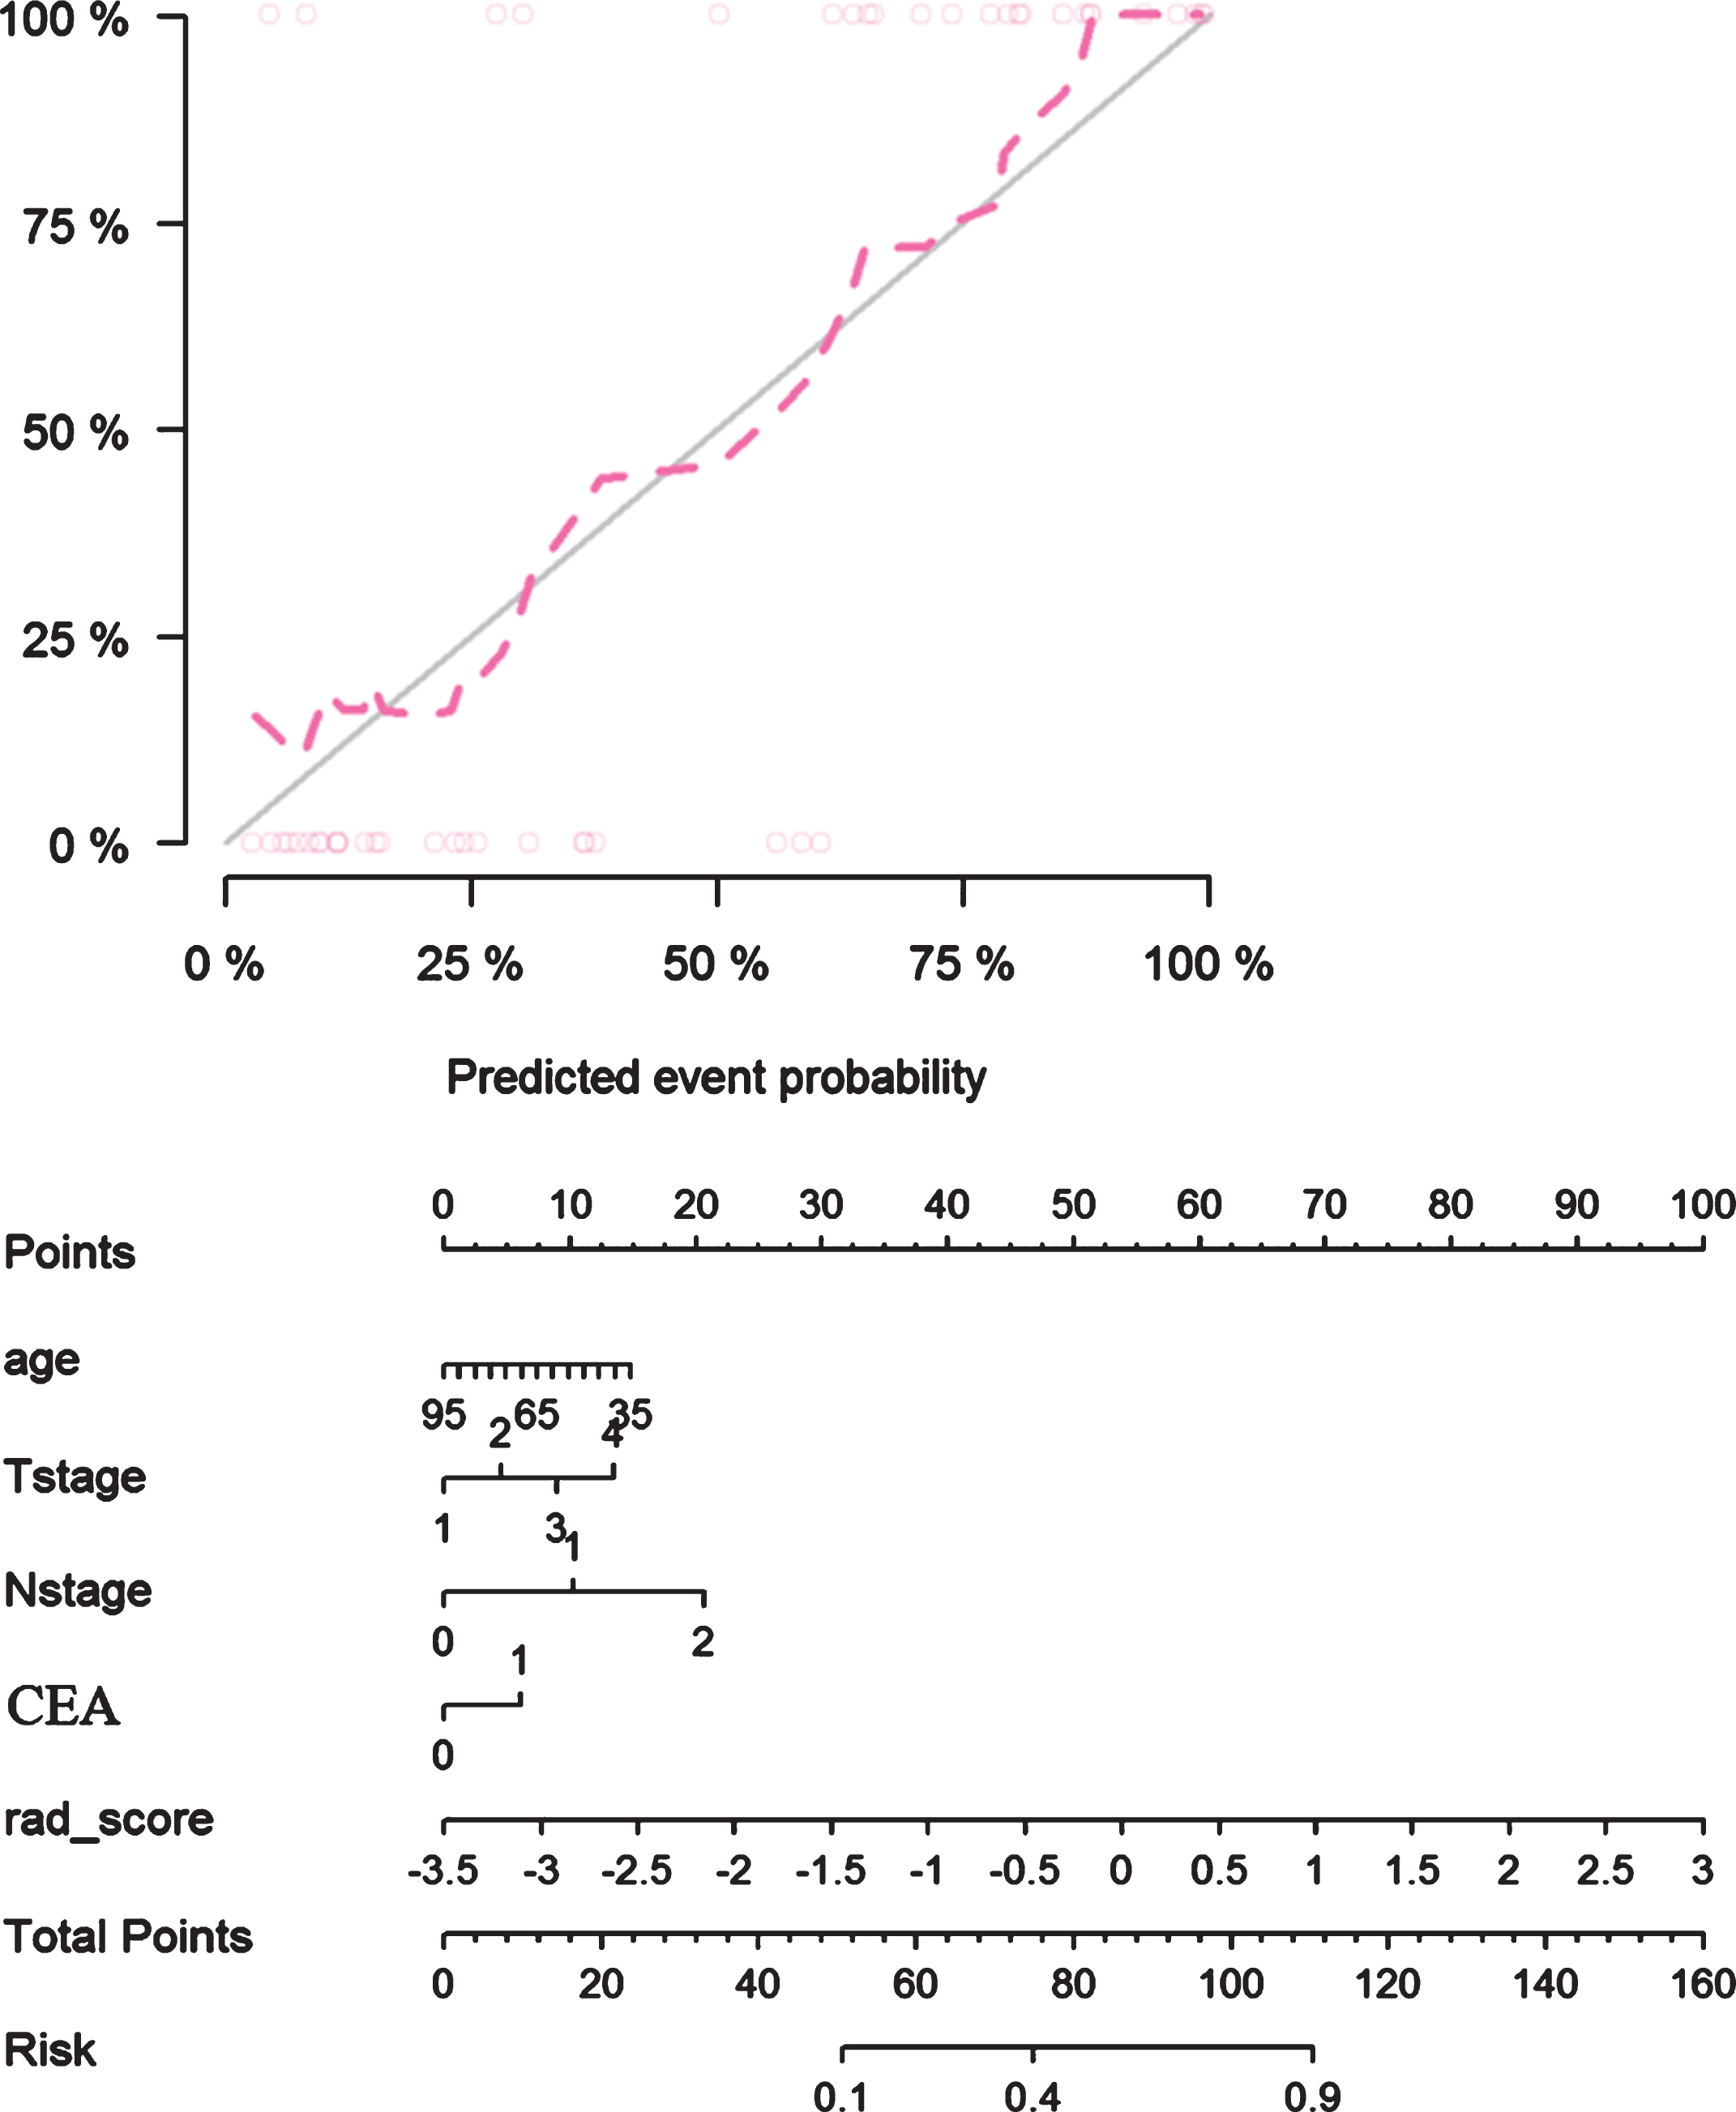
Calibration curves of the nomogram in the validation cohort of Rad-clinical combined models based on peri-tumor VOI and radiomics nomogram was developed.

Decision curves analysis of Rad-clinical model on peri-tumor VOI performed in the validation cohort.
LVI is essential for rectal cancer clinical staging, treatment options, and prognostic assessment. In this multicenter study, the ability of two radiomic models based on the tumor and peri-tumor VOI of contrast CT to predict LVI in patients with rectal cancer preoperatively was investigated. The peri-tumor radiomic model was superior to the tumor model regardless of whether clinical factors were added. The predictive power of the combined model was enhanced with a higher AUC in the validation cohort when the useful clinical factors were added to the model. Furthermore, decision curve analysis was applied to confirm the clinical benefit of the Rad-score model compared with that without Rad score in terms of clinical application in peri-tumor VOIs.
High-resolution MRI has been considered as a promising and reproducible technique to identify LVI, with moderate-to-high sensitivity and specificity [9, 18]. The evaluation of MRI LVI is highly dependent on the radiologist’s subjective judgment. Although the overall diagnosis accuracy for MRI could be improved to more than 80% through targeted training, the consistency between observers is not satisfactory, with a poor to moderate interobserver agreement (ICC ranging from 0.37 to 0.79) [10]. The radiomic model based on peri-tumor volume of contrast CT images in the present study was superior to the inexperienced radiologists, showing a relatively high accuracy and observer consistency.
Few literature reports on CT radiomics predicted pathological LVI. Yiying Zhang et al. developed a multimodal radiomic model to predict LVI in rectal cancer by using radiomic features from MR and CT [19]. They found that the AUC value was 0.82 when CT features were used alone and when combined with MRI features, the AUC value increased to 0.88. In the present study, when the peri-tumor radiomic features and the clinical features were combined, the model could reach an AUC value of 0.90 in the validation cohort. Therefore, the combination of clinical features is more helpful in predicting pathological LVI than radiomics alone, and more benefit was confirmed by the decision curve. When MRI is not accessible to patients, CT radiomics, as a reasonable and helpful method, could be used to predict pathological LVI, with similar accuracy as the radiomic model of the combination of CT and MR.
The effectiveness of the two different VOIs in predicting pathological LVI was evaluated.
The peri-tumor model was superior to the tumor model, indicating that the perirectal space may contain more useful information than the whole tumor for predicting LVI. Several small nerves and blood vessels exist in the space around the rectum. They could be observed on T2WI images when tumor cells invade along the peripheral venules of the rectum. Data and features determine the upper limit of machine learning. In the space around the rectum, in addition to a first-order feature and a shape feature, several high-level features, including Gray-Level Run-Length Matrix and Gray-Level-Size-Zone Matrix, were screened out, and they were better than those extracted using tumor VOI. Therefore, the radiomic model based on the perirectal tissue could better reflect the pathological LVI.
CT radiomics based on portal venous phase performed a satisfactory preoperative evaluation of TNM staging in patients with rectal cancer [20, 21] and identification of pathological types [22], most of which were tumor-based ROI. Differences in the delineation of VOIs have been shown to affect radiomic analysis, such as in the prediction of metastasis in nasopharyngeal carcinoma and sentinel lymph node metastasis in breast cancer [23] and pancreatic cancer [24]. The present study demonstrated that the delineation of VOIs could lead to considerable differences between LVI prediction models. Thus far, this study is the first to use peritumoral tissue VOI to predict pathological LVI in rectal cancer. The peri-tumor radiomic model achieved a higher AUC than the tumor model (0.85 vs. 0.68), and when clinical features such as age, T stage, N stage, and CEA were added, the AUC value of the combined model in the validation cohort was up to 0.90.
This study has some limitations. First, the number of participants was not large enough. Future studies using larger sample size on validation cohorts are required. Second, only the radiomic features from CT images were extracted, and MRI images were not included. Third, this study is a retrospective study with inevitable deviation.
In conclusion, the effectiveness of radiomic models in predicting pathological LVI in rectal cancer was compared using two different VOIs. The results demonstrated that the differences in the delineation of VOIs could lead to considerable differences, and the peri-tumor radiomic model was superior to the tumor model. When clinical factors were added, the predictive power of the combined model was enhanced. Adding this essential finding on rectal cancer could help towards a standardized decision making for offering neoadjuvant or adjuvant treatment, particularly for patients with node-negative rectal cancers. Such radiomic models of LVI may be helpful for therapeutic decision stratification.
Declaration of competing interest
All authors have read and approved the submitted manuscript. There are no conflicts of interest. The manuscript has not been submitted elsewhere nor published elsewhere in whole or in part. All relevant ethical safeguards had been met.
Footnotes
Acknowledgments
This study was supported by the grants from the foundation of Appropriate Technology from Wuxi City (No. T202036).