
Abstract
BACKGROUD AND OBJECTIVE:
The control of clinical manifestation of vestibular system relies on an optimal diagnosis. This study aims to develop and test a new automated diagnostic scheme for vestibular disorder recognition.
METHODS:
In this study we stratify the Ellipse-fitting technique using the Video Nysta Gmographic (VNG) sequence to obtain the segmented pupil region. Furthermore, the proposed methodology enabled us to select the most optimum VNG features to effectively conduct quantitative evaluation of nystagmus signal. The proposed scheme using a multilayer neural network classifier (MNN) was tested using a dataset involving 98 patients affected by VD and 41 normal subjects.
RESULTS:
The new MNN scheme uses only five temporal and frequency parameters selected out of initial thirteen parameters. The scheme generated results reached 94% of classification accuracy.
CONCLUSIONS:
The developed expert system is promising in solving the problem of VNG analysis and achieving accurate results of vestibular disorder recognition or diagnosis comparing to other methods or classifiers.
Keywords
Introduction
According to the National Institute of Health (NIH) [1], Vestibular disorder (VD) constitute 85% of Vertigo cases [2]. About 7 million patients are affected by dizziness and vertigo, which are the most common causes of Ear, Nose and Throat (ENT) emergency assist. The dysfunction affects the vestibular structure which decreases the correct functionality of the head and eye movements. The damage or change in vestibular ocular response (VOR) is manifested by a loss of sensory receptors within the end inner ear, or within the nerve itself. Fortunately, the severe phase of vertigo symptoms will take many hours. Nevertheless, they may continue for days, weeks and even years in the particular cases. Based on VNG technique, Vertigo is always evaluated in order to give clinical observations of vestibular functions and central nervous system (CNS). Multiple examinations integrated in VNG system used kinetic and caloric tests for inner ear canals analysis. The employed evaluations were a promising mechanism in distinguishing the affected from normal subjects. Until now, several techniques have been performed in this field where practical treatments of VD are still a challenging task for ENT experts. Nystagmus vibration measurements applied on endured patients may stand as an interesting tool for the vestibular system analysis.
Patients with VD usually show signs of varied horizontal nystagmus which allows for the localization the vestibular dysfunction. On the other hand, the assessment of this disease is still a difficult task since the usual signs of VD can be hidden. Thus, in some cases the peripheral VD may incorrectly be identified as a central lesion [3]. Furthermore, in some cases, ocular nystagmus and visual tests [4] seen to be normal but they can hide peripheral vestibular dysfunction. Although multiple works [5, 6] have been carried out on this issue, the clinical examination methods of peripheral vestibular disorders have their own deficiencies. In the diagnostic process, recording the eye movement needs a lot of attention from doctors to be able to study and analyze nystagmus. Indeed, it allows the expert not only to detect the low amplitude of nystagmus, but also to quantify with great resolution the amplitude of spontaneous and induced eye movements that can result from a unilateral or bilateral vestibular dysfunction. In order to evaluate the real vestibular response (VOR) included in peripheral vestibular function, the fast and slow phases must clearly be detected from nystagmographic recordings as essential factors in clinical analysis of vestibular disorders. The biggest difficulty in the evaluation of VNG analysis of vertigo is that there is no decisive diagnostic reference to be compared with the alternative diagnosis. In Fig. 1, for eye movement measurement and component separation, it is necessary to verify that nystagmus was correctly identified by examining the trace and establishing the two phases. The extracted parameters from both phases such as amplitude, frequency, and duration of nystagmus can be employed as an effective support for a perfect therapy evaluation.
Furthermore, a diagnosis of VD is hard to carry out without complete neurological opinion or integrated diagnostic conditions, and thereby no clear signs are detailed. Hence, the evaluation of VNG tests depends in reality on the individual variability of the VOR response. Thus, the usual signs of this VD disease do not indicate significant information from a simple study of eye movement. Nowadays, there are many methods presented in the literature which can overcome eye movement noise and give features to detect nystagmus disorder. In the work of Curthoys et al. [7], authors proposed a new approach that can resolve the problem of blinking motion and fast phase of nystagmus in VNG sequences. Compared to previous filtering methods [8, 9], K. Ohzeki et al. [10] involved a block matching algorithm combined with a Kalman filter to avoid the problems of eye position artifacts. Despite the efficiency of this work, it is still difficult to use this method in clinical applications.

Graphical description of the proposed VNG analysis method for eye movement evaluation.
In addition, only slow phase is needed in order to compute the real VOR response [8]. however, in some cases [5, 6], the slow phase velocity measurement provides erroneous evaluation that requires additional characteristics for an accurate clinical prognostic of VD. In fact, several parameters from both slow and fast components (FC, SC) based on amplitude, frequency, foveation periods, and duration of nystagmus can be used in medical strategies decision. However, major methods [11, 12] used manual procedure to separate the two phases of rotational eye movement waveform. In addition, multiple analysis methods provide insufficient parameters which cannot give definite conclusion about the case of vestibular disease. By dividing the two-phase components (SC, FC), Faucheux et al. [13] developed a method that tracks the direction of SC, although the instants of nystagmus deviation are fixed manually by the doctor. This system does not provide an accurate performance of eye motion detection after each FC.
Clinical acquisition conditions and regular detection of blink artifact are the major problems that can affect the eye movement analysis in the segmentation process. Nevertheless, a polynomial function based on least-square minimization procedure is used to ellipse estimation in pupil edge. Zhang et al. [14] proposed a location access for the pupil center using Hough transform method (HT). This algorithm needs to be improved in terms of segmentation accuracy and convergence speed. In addition, alternative applications are implemented to relieve manual intervention in VNG analysis. Furthermore, Wang et al. [15] detected the external boundaries of eye region based on the geometry of pupil-shape estimation. The major drawback is the over-segmentation that can be generated by the incorrect camera orientation. Zhu DJ et al. [16] projected pupil curvature estimation algorithm in order to eliminate the eyelids noises. This approach indicates fault assessment results produced by the curvature transition of the eyelid. Parameters optimization is required to ensure the best boundary localization and reduce the noise sensitivity of this algorithm. From the work of Daugman et al. [17], a novel pupil detection algorithm is applied for tracking pupil oscillation. The main problem of this method is the difficulty to track the nystagmus fast phases. Hence, for nystagmus detection, many methods were employed for eye tracking using iris pattern. The cross-correlation method [18] is usually adopted in clinical practice. Consequently, the major problem of this approach is the manual selection of iris area and the computation complications in evaluating pupil rotation angle. Also, the efficiency of this method is moderately altered by experimental environment.
Trying to remediate all these problems, we propose a new automatic VNG sequence analysis for quantitative evaluation of VD. The proposed approach consists of a combined segmentation and classification of VNG dataset. First, the pupil region is detected using an ellipse-fitting algorithm which was not considered in earlier nystagmus analysis works. Then, we proposed phase separation algorithm between the slow and fast components of nystagmus that takes into consideration the temporal and frequency features from the segmented pupil region. In addition, a hybrid model combining the multilayer neural network (MNN) and the Fisher’s linear discriminant (FLD) is presented. Furthermore, the classification process is greatly enhanced using the proposed preprocessing system and its accuracy in providing pertinent nystagmus feature for vestibular disorder recognition. The performance of this method is demonstrated, compared to existing segmentation and classification methods as well as to the ground truths given by experts.
The remaining part of the paper is organized as follows: Section 2 describes in details the proposed data collection and features selection procedure. Section 3 is specifically devoted to the presentation of experimental results on two large datasets of VD and normal patients. After that the proposed approach is compared to other recent methods in terms of accuracy. Finally, conclusions and future works are provided in Section 4.
In this work, we used the VNG recording for 139 subjects with a mean age of 42 years (ranging between 24– 65 years) among 237 patients admitted into the Charles Nicolle Hospital in the Ear, Nose and Throat (ENT) department, between April and September 2018. The available dataset contains 183 subjects. With the aim of removing redundant data, only 139 cases have been used in this study. 98 patients of them are assessed with a vertigo symptom that had an abnormal saccadic movement response and 41 seen normal.
The dataset was collected from a VNG Ulmer (Synapsis French), a technique that allows the evaluation of sensory and balance disorders. The examination can be performed by a simple infrared CCD camera with 30 fps frame rate using a light source to create a cornea reflection on the eye, mounted on a pair of goggles for eye movements tracking using computer vision algorithm [19]. In fact, this technology includes several tests for oculomotor exploitation, kinetics test and caloric irrigation of peripheral vestibular structure. In the clinical analysis of vertigo, the vestibular assessments are perceived by preponderance and reflectivity measurements taking into account only slow phase velocity nystagmus. However, these evaluations are still a challenge task that needs more significant features for a best control of vestibular diseases.
In this paper, a peripheral vestibular disorder (VD) is employed for the nystagumus parameters classification in order to enhance the diagnosis of this disease. There are three principal stages that can be used for the proposed process. In fact, it is necessary to define the temporal and frequency features extraction development (stage a) from pupil region in regard to eye motion. Note that the second stage (stage b) decreases considerably the obtained features in terms of pre-processing system. A classification process (stage c) can be consumed to differentiate topics: normal or vestibular disorder (VD).
Temporal and frequency features extraction, which represents the first stage, include pupil region segmentation in VNG dataset. Besides, the rotation angle waveform extraction from eye movement is applied to the obtained characteristics using separation between slow and fast phases. At the end, features computing is the most decisive step in this work emphasizing current estimation parameters.
Segmentation of pupil region using ellipse-fitting algorithm
This section focuses on pupil boundary detection. First, Otsu segmentation method [20] is applied on VNG sequences to minimize the intra-class variance and maximize the inter-class variance of the total variance in order to separate pixels corresponding to the object (pupil region) of the remainder background. Morphological operators offer an efficient result in the field of filtering motion detection removing a few pixels error caused by the infrared light.
Different segmentation methods [21], developed a circular form for pupil region detection. This algorithm is characterized by the simplicity of its application. However, the method gives moderately efficient segmentation results only in the frontal view. Nevertheless, an ellipse-fitting algorithm can be applied to resolve the problem of circular detection proposed in the work of Daugman et al. [22]. Mathematically, this method is based on a rotation and translation of estimated ellipse which can be used for both non-frontal and frontal pupil region. The ellipse parameters are presented by the following equation:
For the processing of subsequent image frames, the pupil region is selected based on the current frame segmentation result. In fact, to remove the influence of background artifacts and to limit the computation time of the contour evolution, the initial curve is searched based on the current result.
Inspired by the idea of cross correlation [24], but without manual selection of iris template for cross collection, we extracted the effective angle of eye movement using only the pupil position in two subsequent frames. The rotation deviation of nystagmus is calculated as the following equation:
The proposed separation algorithm is focused on the extraction of the slow phase by detecting the first point of the fast component; the linear spline interpolation is used to calculate selected phases (i.e fast phase and the remainder slow phase). This method presented in our previous work [25] is simply based on straight lines which relate successive points. The extraction of the fast phase consists of the detection of the first point of fast phase which is considered as the last instant t0 of the previous slow phase and the second point t1 which represents the first instant of the following slow phase.
Features reduction and classification using (FLD-MNN)
In order to characterize pertinent information within VNG datasets, this study proposes the recognition of VD. The concept of studied features extraction from the nystagmus eye movement is a critical task in the field of vestibular evaluation. In this step, we define a Fisher criterion J [26, 27] as the ratio between the inter-class and the intra-class variance of each feature. Moreover, it is necessary to use data normalization task with zero average and constant variance. In the previous work of Ben Slama et al. [25], it has been confirmed that PCA-MNN is a high-quality tool for vestibular disorder recognition.
With the aim of reducing features number selected from pupil deviation angle and improving discrimination between peripheral vestibular dysfunction and normal patients, the Fisher-MNN system is proposed in this task. To create the training dataset of the network, we selected the most discriminate extracted features from nystagmus waveform. Due to the overlap presence in the included features, FLD is used to analyze the training dataset and to produce c-1 independent components which are generally more suitable for classification purposes than PCA, where c is the number of classes. Moreover, the FLD preprocessing for further classification by the MNN classifier should give different results when compared with the PCA preprocessing because the methods assume diverse optimization conditions.
Thirteen attributes were extracted from nystagmus oscillation representing the mean, maximum, and minimum of all components. Because the similarity and correlation of features in VNG training dataset, a preprocess step is applied in order to get uncorrelated variables for the classification stage. The training VNG dataset is composed of three temporal and two frequency features instead of thirteen. In fact, characteristics used in the validation set are dissimilar from those in the training set. Learning features set is composed of four components: frequency, period of nystagmus, velocity and duration of slow and fast nystagmus phases. A comparative study is exhibited using Fisher-MNN algorithm and other classifiers; MNN, SVM, PCA-SVM, PCA-MNN, and CNN in order to estimate the performance of the classifier system.
Results and discussion
To prove the success of the proposed segmentation approach, experimental results are presented in each step and compared with a segmentation method from the literature [34]. The Ellipse-fitting model is firstly compared with Principal Component Analysis (PCA) and Hough Transform (HT) algorithm in terms of pupil region detection and time consumption. Finally, the classification performance is introduced using Fisher-MNN method based on the efficiency of the optimal feature selection from rotation angle of pupil waveform.
Segmentation results using ellipse-fitting
In order to demonstrate the performance of our approach, the ellipse-fitting, PCA and HT methods were tested on 30 images chosen randomly and compared to the segmentation results given by experts. In this work, the assessment measures are the region accuracy (RA). The region measure is used to provide the difference between the contour detection results MR [28] and the ground-truth regions MR (constructed manually by experts).
The region segmentation accuracy is RA defined as:
For an improved qualitative Analysis, a statistical measurement could be used to measure the quality of image segmentation. In our work, Jaccard coefficient (JC) and Dice similarity coefficient are used to evaluate the performance of the proposed segmentation method.
As shown in Table 1, the performance of ellipse-fitting model is compared to those of PCA, HT and ground truth, where the latter is given by three experts. In fact, ellipse-fitting method is very promising in terms of region segmentation accuracies from used the used VNG dataset. It provides an average region accuracy of 95.7%, whereas region accuracy rate is about 92.3 % using PCA method, and 85.45% applying the HT method. In addition to the region segmentation accuracy using Jaccard coefficient and Dice coefficient, we also evaluated our segmentation model using a region measure. While DSC and JC are respectively about 95.44% and 94.38% using the ellipse-fitting model, PCA and HT method give an average rate of (DSC, JC) about (94.58%, 90.75) and (86.78%, 81,47), respectively. Besides, ellipse-fitting method improves the mean convergence speed of 1.29 seconds to detect the boundary of pupil region in each image frame. However, the ellipse acquired in 30 frames randomly selected from VNG sequence dataset takes a mean processing time of 50.12 seconds, compared to 54.43 seconds and 67.24 seconds using respectively PCA and HT approach.
Performance comparison of the ellipse-fitting, PCA and HT segmentation method in terms of segmentation accuracy, Dice Similarity Coefficient (DSC), and Jaccard Coefficient (JC) on the database of 30 Video Nystagmo Graphy (VNG) images
After many experiments, we conclude that the ellipse-fitting segmentation method gives an efficient segmentation result (see the first three rows in Fig. 2) and an adequate convergence time when compared with the PCA and HT algorithm by presenting serious problems in term of boundaries detection (see Fig. 2).
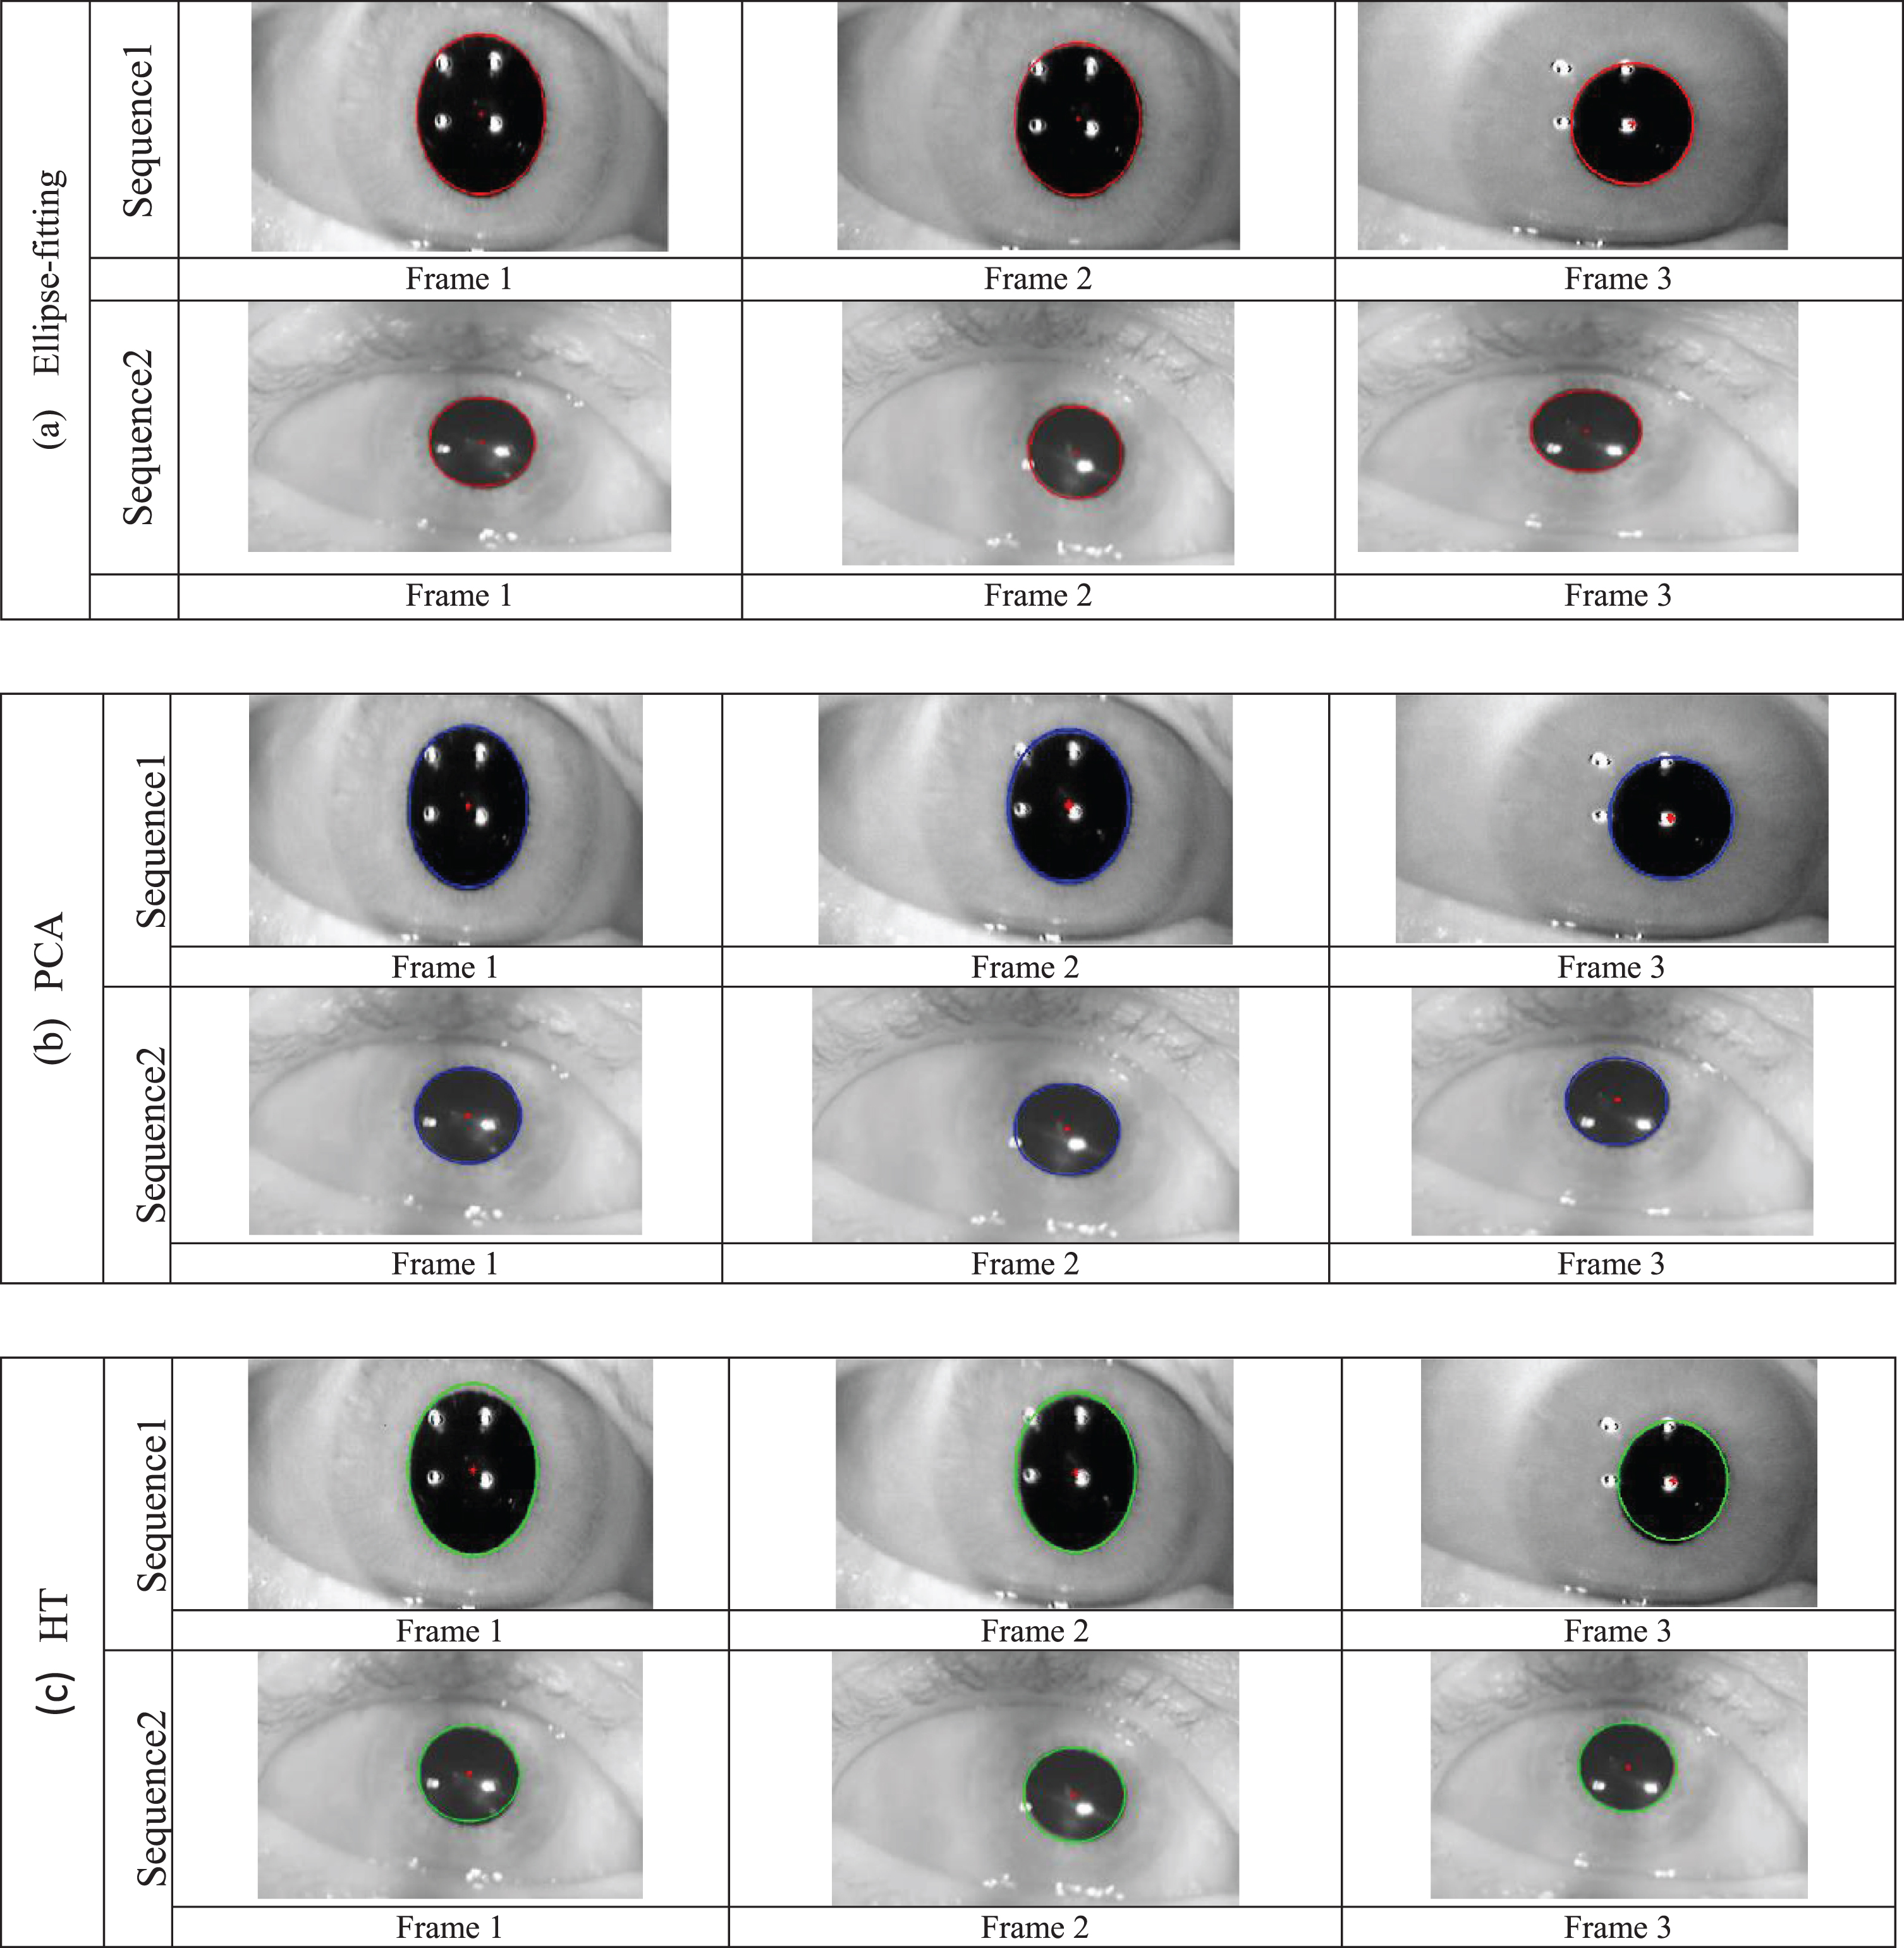
Contour detection results of VNG image sequences using three different algorithms (a) Ellipse-fitting (b) PCA, (c) HT.
Different temporal and frequency features were selected using pupil rotation angle. The extracted velocity of the two phases (see Fig. 3) is based on the derivative function using the difference between the subsequent points of nystagmus signal. The computed parameters here are the mean, maximum and minimum frequency nystagmus noted respectively (MnFrq), (MaxFrq), (minFrq), and the standard deviation of both frequency and period nystagmus, noted respectively (SFN and SPN).
From the derivative signal, we compute the mean, maximum and minimum velocity of fast (FV) and slow (SV) phases respectively (MnFV, MaxFV, minFV, MnSV, MaxSV, and minSV) and the duration of slow and fast phase respectively (DS) and (DF). Besides, the FLD algorithm is applied in order to estimate the most discriminative features for VD diagnosis. The ratio of the “inter-class” variance to the “intra-class” variance is calculated in order to determine the characterization degree values. Here, “J” value superior to 1 is allowed to perceive the most significant features.
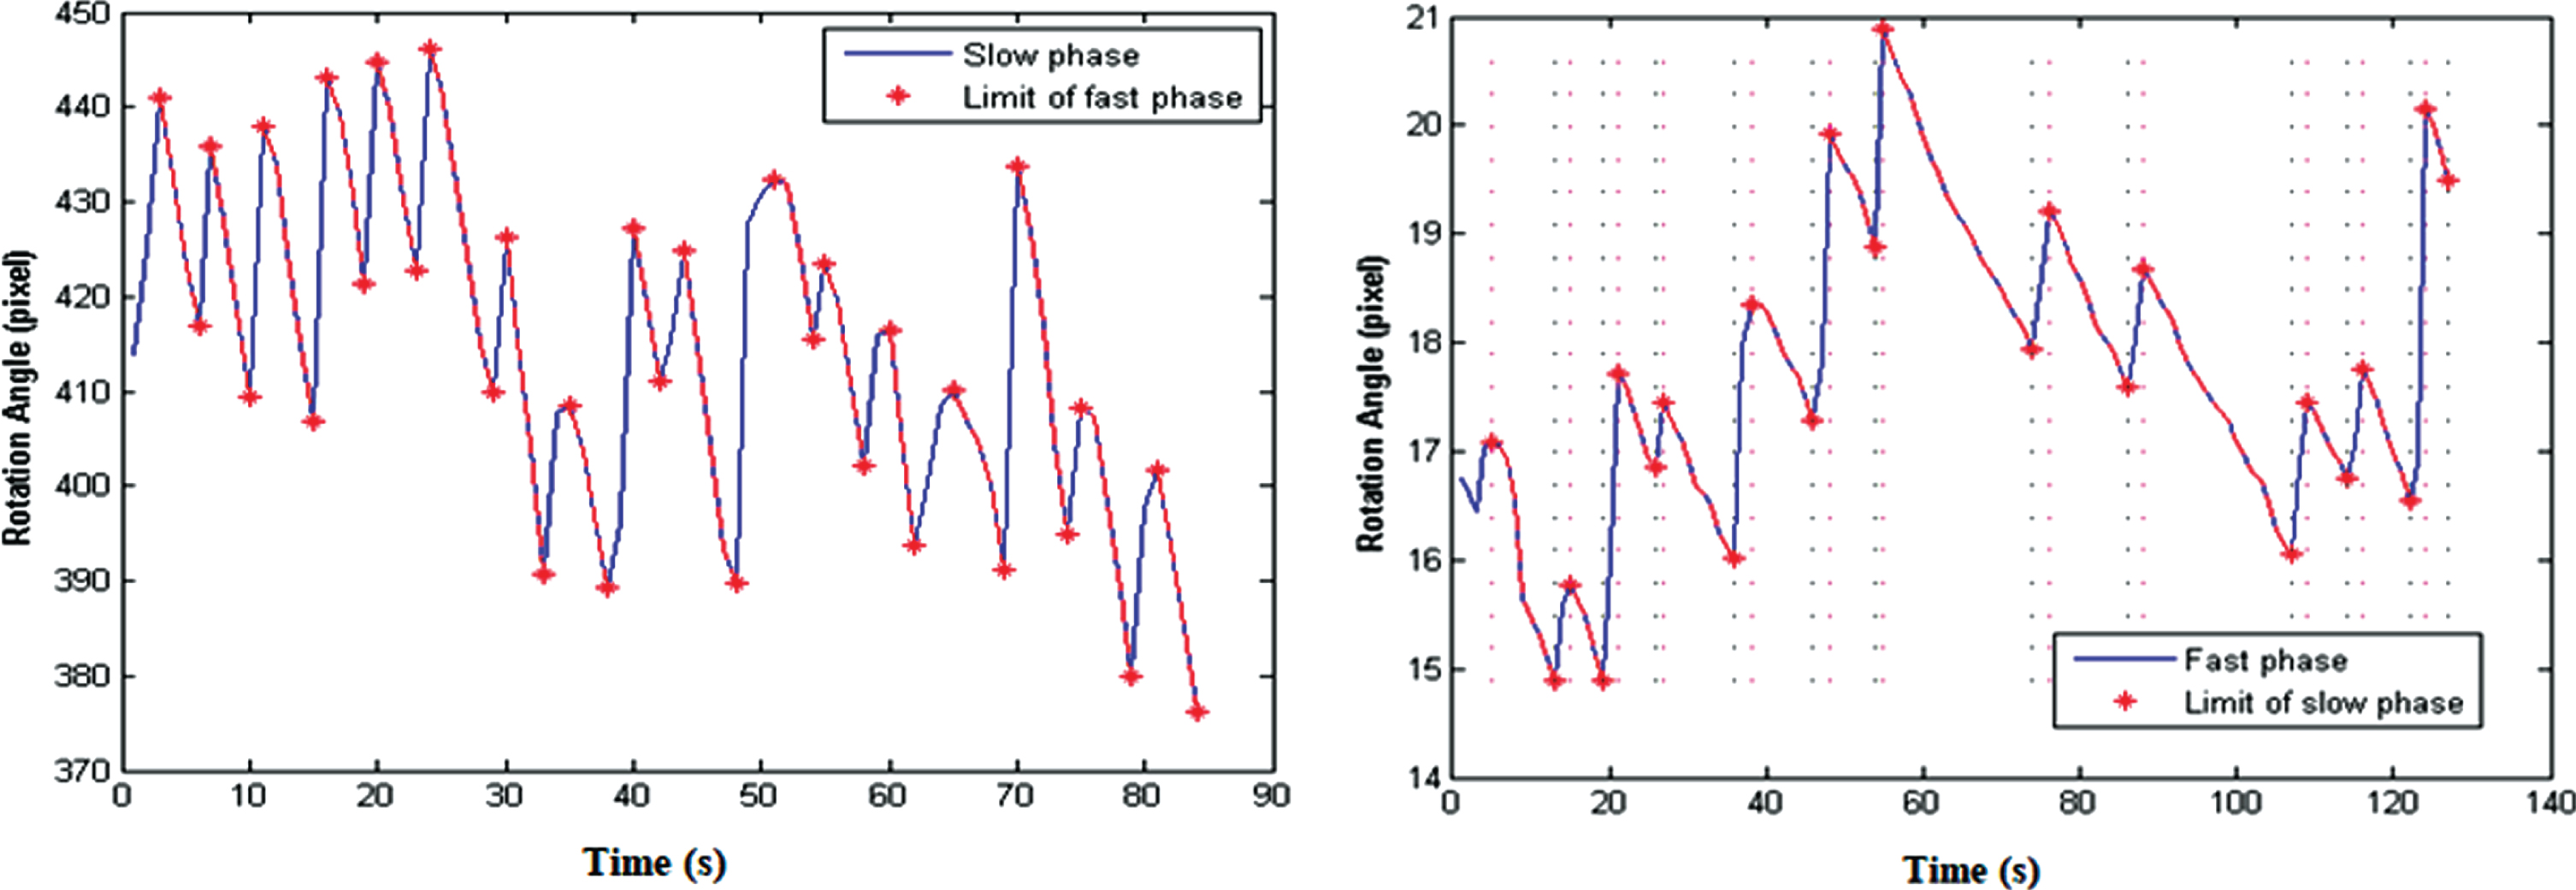
Two separation phases using linear interpolation from pupil rotation angle of two patients affected by peripheral VD.
Figure 4a shows the importance of the separation phase where feature distribution in the first graph represents an overlap between the fast and slow component characterized by minSV and maxFV; compared to Fig. 4b which demonstrates the most discriminate features where subjects are clearly separated using two features that characterize slow phase noted DS and MaxSV and MaxFrq.
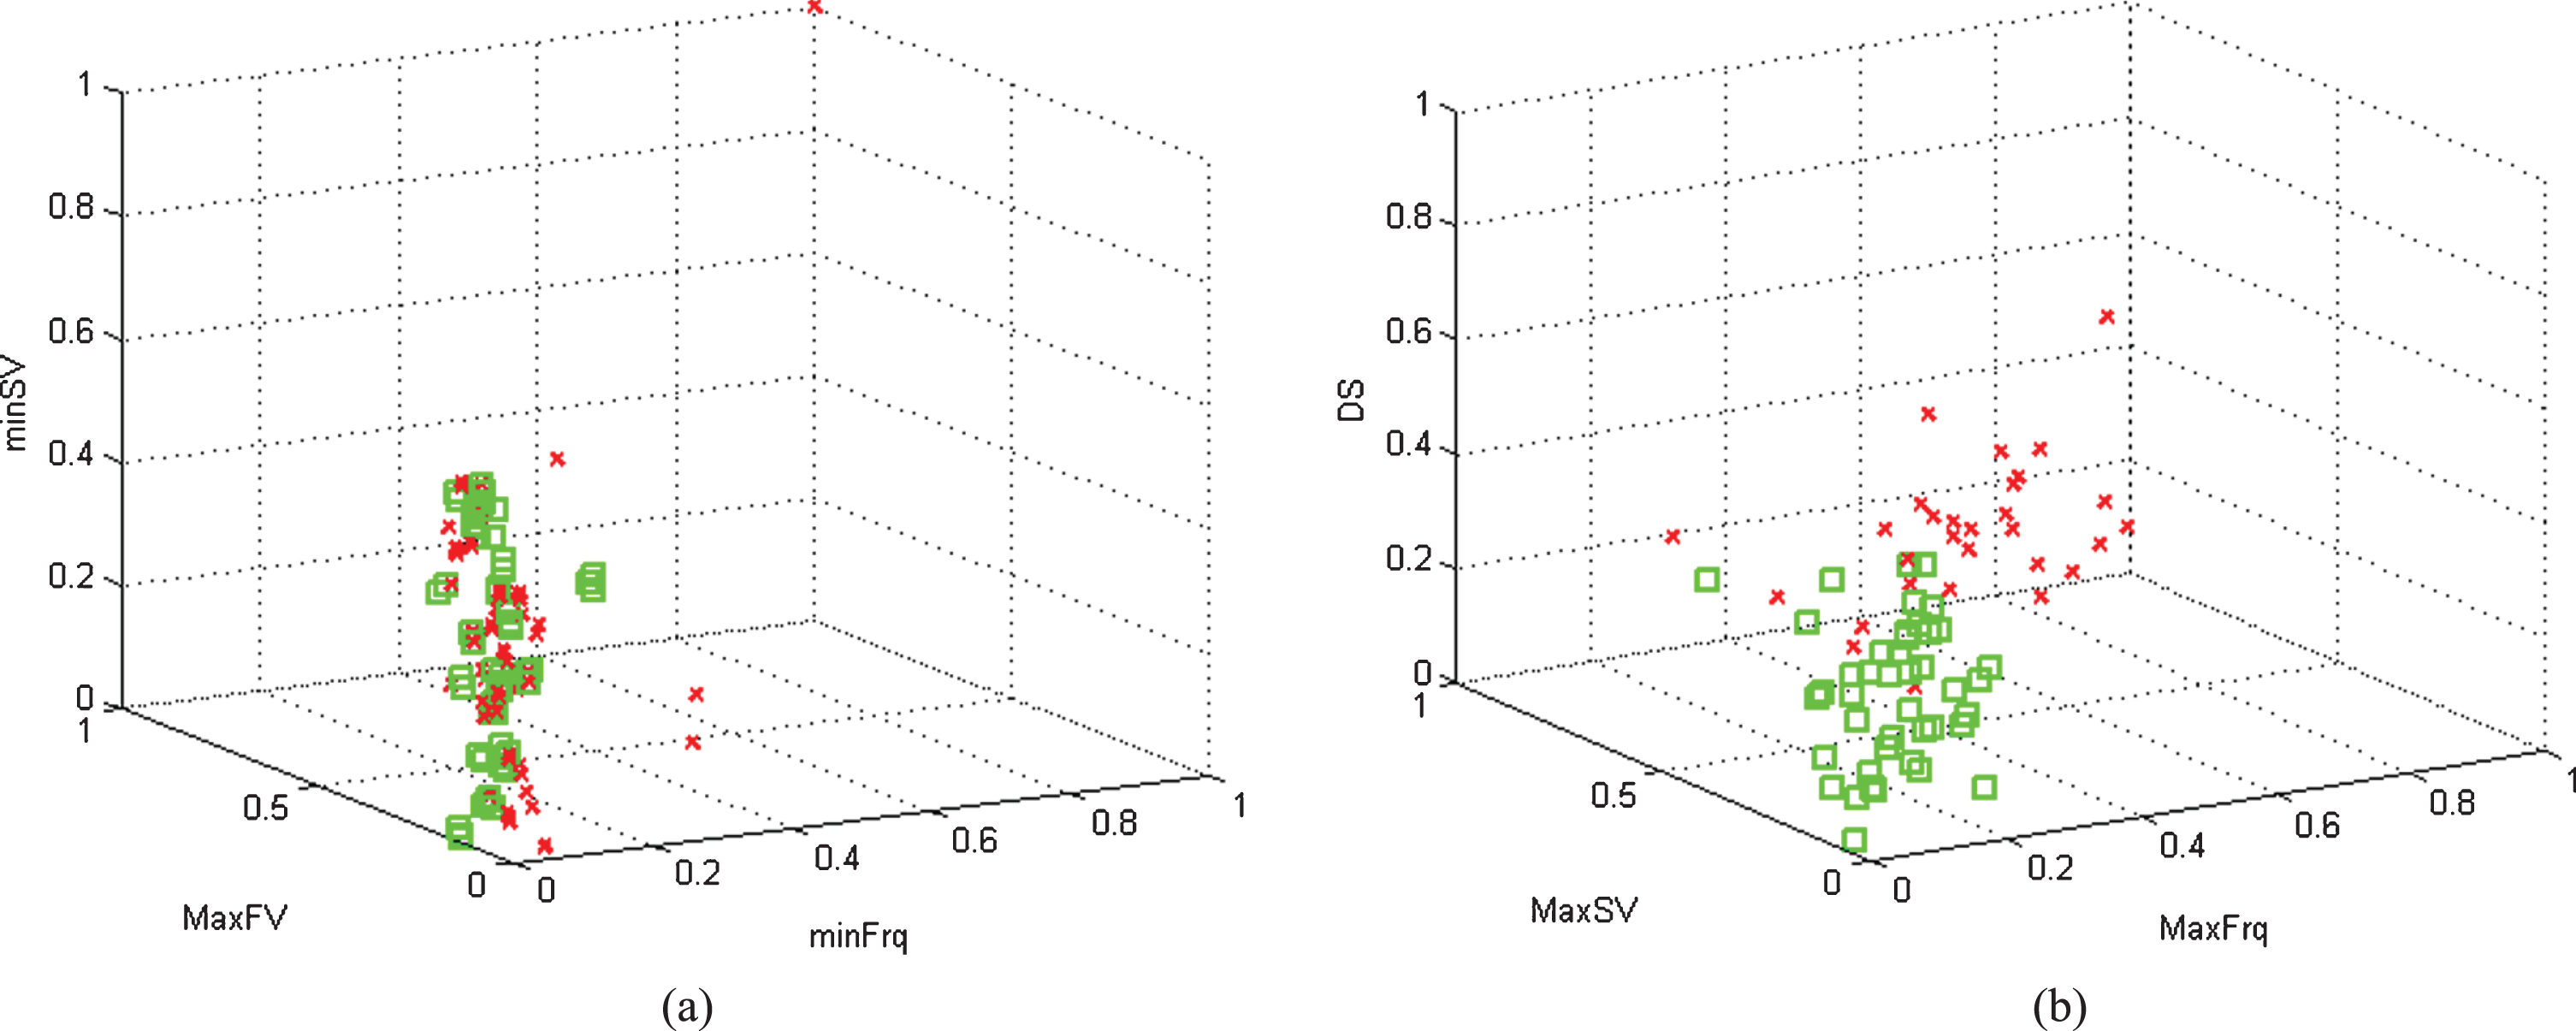
Three dimensional distributions of: (a) the lowest features discrimination. (b) the highest features discrimination.
In this section, we define the features vector composed of five temporal and frequency parameters, the multilayer neural network (MNN) is applied to classify a set of patients into two categories: Positive (VD topics) and negative (normal topics). The proposed methodology is developed in order to estimate the classification results which emphasize an efficient way in improving the diagnosis of this disease. As shown in Table 2, A comparative study is applied in terms of validation error rate using six-fold cross-validation technique [25–30]. To compute the mean validation error on the training features selected by FLD algorithm, the selective features are separated into six equally-sized folds. Thus, six iterations are performed for the training and validation stage. For each given training subset, we also conducted six-fold cross-validation experiments to select the optimal number of hidden nodes.
Performance comparison of the Training and Validation error rates (%) classification methods using six-fold cross-validation for the entire training datasets
Performance comparison of the Training and Validation error rates (%) classification methods using six-fold cross-validation for the entire training datasets
TE: Training error. VE: Validation error.
In Table 2, we present the classification accuracy between FLD-MNN and other classifiers; MNN, SVM, PCA-SVM, PCA-MNN, and CNN in terms of testing error (TE) and validation error (VE) using six folds. We applied Monte Carlo tests [35] to compare the FLD-MNN algorithm with that of neural network-based classifiers and standard classifiers. It is clear that the proposed classification method (FLD-MNN) is more accurate than the other classifiers for the two training datasets. It provides the smallest average validation error (about 5.27×10⁻² for the dataset) Note that the PCA and the FLD preprocessing significantly improve the performance of the MNN classifier, which is close in term of validation error to the standard ensemble methods for the two datasets. However, the FLD-MNN classifier is still superior to PCA-MNN [25] in the two cases, since the FLD analysis not only considers the between-class variation as well as PCA, but FLD also exhibits within-class variation of the whole learning set. From these results, we conclude that the FLD-MNN method gives stable and high classification accuracy for both training and validation experiments, which is the best in terms of robustness compared to the other studied classifiers (less than 6%).
The methods of classification aim at identifying the two classes to which belong objects from some descriptive parameters. They apply to a large number of human activities and agree in particular to the problem of the automated decision-making. The classification procedure will be extracted automatically from a set of examples: 98 abnormal (affected by vestibular diseases) and 41 normal patients. An example is the description case with the corresponding classification. A learning system must then, from this set of examples, extract a classification process; it is necessary to extract a general rule on the basis of observed features data.
The generated method will need to correctly classify the examples of the sample (the five features among thirteen selected with top priority; (MaxFrq, SFN, MaxSV, SPN and DS) and have a robust predictive power for correctly- classifying new descriptions. The classification process based on FLD-MNN classifier is collected from two different phases: (i) taking into account that the training parameters dataset is divided into six subsets, given that the training sets are higher than 50% of the database for both normal and abnormal patients (104 subjects randomly chosen). Contrarily to validation sets that represent only 25% of database while (ii) the test of the network is prepared with a smaller part of the database (35 remaining subjects).
The network is evaluated in view of error found between the desired and the actual output. It is equal to ‘+0.95’ for positive cases and ‘– 0.95’ for negative cases. Considering the defined three layers: five features are used in the input layer, a single hidden layer including 100 nodes selected by testing several experiments, with a unique output layer. By applying Quasi-Newton algorithm, and after 200 epochs of training, the error decreases to 10-5 and convergence is reached [25]. The validation method is employed to select the optimum proposed MNN structure. In this way, the number of input nodes is reduced, after applying the FLD method, from thirteen to five compared to the MNN bloc inputs’ number which is kept to 13. The used hyper-parameters of the FLD-MNN classifier are resumed in Table 3.
Hyper-parameters of the FLD-MNN classifier
The used parameters are presented by the following equations:
As illustrated in Fig. 5, we obtain promising classification results of the VD cases using the FLD-MNN classifier [27]. 94.73% is achieved as classification accuracy and the experiments demonstrate the highest performance of the proposed method compared with those obtained respectively by SVM, PCA-SVM, FLD-SVM, and MNN, PCA-MNN and CNN classifiers. In addition, the classification results provided by the proposed method in each case are very close to the results given by experts.

Performance comparison of MNN, SVM, PCA-SVM, FLD-SVM, PCA-MNN and FLD-MNN and CNN in terms of accuracy (AC), sensitivity (SE) and specificity (SP) on the classification of temporal and frequency extracted features with different experiments.
Compared to previous studies, the proposed methodology provided efficient extraction stage of the most relevant features and clearly distinguished the vestibular diseases from the healthy subjects. As shown in Table 4, the proposed approach was able to classify the VNG datasets with 94.73% of accuracy. It presents an interesting classification results when compared with other considered methods from the literature.
Comparison of classification efficiency by previous works from the literature
With these presented results, we can conclude that the proposed classification scheme can reliably be employed to help ENT doctors by providing a second decision for unlimited cases that require further attention.
For our results to be statistically valid, we administered a statistical analysis using Student’s t– test in order to evaluate the difference in features between two classes of subjects (patients with VD diseases and normal cases). In vestibular disorder assessment, the performance of a classification algorithm usually depends on sensitivity and robustness. A receiver operating characteristic (ROC) curve was used to validate the classification results. The specificity (Sp), the sensitivity (Se), positive predictive values (PPV), negative predictive values (NPV), the area under the ROC curve (AUC) was computed [35]. A p– value (p < 0.05) was considered significant.
The database is divided into two sub-sets: one for training (containing 70% of the samples), and the other for test (containing 30% of the samples). Thus, experimental results are performed and statistical measures are computed from FLD-MNN classifier. From the datasets, the Positive Predictive Value (PPV) of the test using the FLD-MNN classifier for common vestibular disorder is 92.12 and the Negative Predictive Value (NPV). The confidence interval for both PPV and NPV is 90– 95%. Figure 6 presents the ROC curve analysis method of our proposed strategy.
It is clear in Table 5 that FLD– MNN classifier gives accurate results of sensitivity (SE) and specificity (SP) respectively with mean average of 93.14%, 93.78%, and the area under curves (AUC) equal to 0.875. We should notice that these results show the significant features of VNG dataset and validate the effectiveness of our strategy.

Validation of the proposed method using ROC curves.
Results of the computer-assisted common vestibular evaluation on the complete VNG dataset
Pertinent features selected by the FLD preprocess (mean±Std)
Note- MaxFrq: Maximum Frequency Nystagmus; MaxSV: Maximum Slow Velocity; DS: Duration Slow phase; DF = Duration Fast phase; SPN = Standard deviation Period Nystagmus; SFN = Standard deviation Frequency Nystagmus. (p < 0.001): the differences are highly significant.
As shown in Table 6, the statistical difference between the result of the patients affected by VD and normal ones were very significant giving a p value of 0.001. It is important to note that the range of (MaxSV) value is appreciably increased as indicated by the comparison in (mean±standard deviation (std)) between normal subjects (19.4167±7.87) and Vestibular disorder (VD) patients (11.248±5.56). For instance, the range of (MaxSV) value is appreciably increased where we compare normal subjects (19.4167±7.87) to Vestibular disorder (VD) ones (11.248±5.56). However, for the duration slow (DS) and Standard deviation of nustagmus frequency (SFN), we find significant p value (p < 0.02). Because the disorder side of a patient perturbs the vestibular function of the intact side, the latter p-value should be taken into consideration even though it is not as significant as the one indicated above (p < 0.001). This is because the slow component of nystagmus has to compensate for the reduced response of the dysfunction side. In this case, the characteristic of (DS) and SFN of nystagmus movement can clearly be a helpful parameter and should be introduced in the process of VD classification.
Furthermore, from defined results, we can conclude the high precision of the proposed segmentation method on the VNG database images. Compared to the ground truth given by experts [36, 37], the proposed method was able to detect pupil region with an interesting accuracy result in the total images database. We can conclude that the proposed VNG analysis method can consistently be used to assist doctors by providing a second opinion that involves more attention [38–40].
In this study, we developed and tested a fully automatic method which can be used for vestibular disorder in VNG sequences. First, an Ellipse Fitting model was applied for pupil region detection and to improve the segmentation quality of VNG dataset. The proposed model gives high-quality estimation and smooth borders when compared to existing contour detection technique. Second, we proposed an advanced method that can precisely separate the normal and patients affected by VD disease. Temporal and frequency features are extracted from the nystagmus eye movement centers and then employed to recognize the VD cases for the separation task. The included VNG sequences are classified into two categories according to their Ocular nystagmus information using a multilayer neural network (MNN) combined with Fisher linear discriminant (FLD) preprocessing to get the final division results. We compared the proposed method with the existing advanced intelligent algorithm in order to demonstrate improvement of separation accuracy. The experiments show that the introduced process can constantly classify normal and abnormal data even in fast medical assessment cases. In contrast, the performance of this method provides a solid foundation for computer-assisted VD evaluation system of an expert diagnosis process.