
Abstract
BACKGROUND:
Triple-energy computed tomography (TECT) can obtain x-ray attenuation measurements at three energy spectra, thereby allowing identification of different material compositions with same or very similar attenuation coefficients. This ability is known as material decomposition, which can decompose TECT images into different basis material image. However, the basis material image would be severely degraded when material decomposition is directly performed on the noisy TECT measurements using a matrix inversion method.
OBJECTIVE:
To achieve high quality basis material image, we present a statistical image-based material decomposition method for TECT, which uses the penalized weighted least-squares (PWLS) criteria with total variation (TV) regularization (PWLS-TV).
METHODS:
The weighted least-squares term involves the noise statistical properties of the material decomposition process, and the TV regularization penalizes differences between local neighboring pixels in a decomposed image, thereby contributing to improving the quality of the basis material image. Subsequently, an alternating optimization method is used to minimize the objective function.
RESULTS:
The performance of PWLS-TV is quantitatively evaluated using digital and mouse thorax phantoms. The experimental results show that PWLS-TV material decomposition method can greatly improve the quality of decomposed basis material image compared to the quality of images obtained using the competing methods in terms of suppressing noise and preserving edge and fine structure details.
CONCLUSIONS:
The PWLS-TV method can simultaneously perform noise reduction and material decomposition in one iterative step, and it results in a considerable improvement of basis material image quality.
Keywords
Introduction
X-ray computed tomography (CT) plays an essential role in diagnostic radiology and image-guided procedures by providing dependable insight into anatomical structures of the human body. However, conventional CT cannot identify materials or provide quantitative tissue information of the examined objects [1–5]. Tissues with different material compositions can show same or very similar intensity in a reconstructed CT image. To overcome this limitation, dual-energy CT (DECT) was developed as an alternative solution [6–11]. Compared to conventional CT, DECT can obtain x-ray attenuation measurements with two energy spectra, which can be used to decompose the examined object into different basis material images [12–14]. As a simple technical approach, DECT has achieved considerable success in advanced CT applications, including in automated bone removal in CT angiography, ischemia areas detection in perfusion CT imaging, urinary stone characterization, atherosclerotic plaque removal, and virtual monoenergetic imaging [15]. However, the measurements obtained from DECT are comprised only of two energy spectra information on the examined object, which limits the discrimination capability of the DECT to only two materials without consideration of additional constraints. Therefore, adding a third energy spectrum in the DECT imaging (i.e., three energy spectra) may help further improve the accuracy of material decomposition. Triple-energy computed tomography (TECT) technique has been employed in many applications wherein the discrimination of more than two materials is necessary [16–19]. Using measurements acquired at three different energy spectra, TECT can generate three basis material images that provides the material composition information of the examined object. However, given the noisy TECT measurements, the basis material image quality would be severely degraded when material decomposition is performed directly using matrix inversion method [16, 20–25]. To achieve accurate material discrimination, it is imperative to develop superior material decomposition methods for TECT.
Material decomposition in TECT can be divided into direct decomposition, projection-based, and image-based methods. Direct decomposition reconstructs basis material images from measured TECT projections using the given x-ray spectrum [13, 26–28]. This method has the advantage that the physical model of an x-ray transmission is treated exactly, and therefore, prior information of the basis material image can be incorporated into the decomposition process. However, the computational load of direct decomposition methods would be a challenge for practical application because of the repeated forward and backward projection operations in the decomposition process [21, 27]. A projection-based method first decomposes the TECT measurements into sinograms of the basis material images, and then, it performs image reconstruction for each of the material-specific sinogram. This methods can effectively avoid beam-hardening artifacts in basis material images as sinograms of the basis material images are obtained before image reconstruction [29, 30]. The main challenge to projection-based methods is the need to calibrate the model of x-ray transmission, which is highly nonlinear and computationally expensive. Image-based methods decompose TECT images into basis material images using the linear approximation of the material decomposition process [11, 31–34]. This method is practical and is performed in the reconstruction of each projection followed by a material decomposition step. Compared to projection-based methods, which can suffer from data inconsistency, image-based methods can be readily applied to clinical settings because they are directly performed on images obtained from commercial CT scanners. The basis material images can be obtained simply by direct matrix inversion decomposition; however, this method is sensitive to the noise in CT image because of the overlap between the different energy spectra [20, 35]. Thus, the image quality of basis material will be severely degraded, and this can compromise the material discrimination ability of TECT.
In this study, we present a new strategy for noise suppression in image-based material decomposition for TECT using a penalized weighted least-squares (PWLS) criteria with total variation (TV) regularization (PWLS-TV). We analyzed the noise statistical properties of the image-based material decomposition process, where the inverse of the estimated noise variance of the TECT images serve as the weight in the weighted least-squares (WLS) term. TV regularization enforces the smoothness of the basis material image by penalizing the differences of local neighboring pixels. We proposed an alternating optimization algorithm for minimize the objective function of the PWLS-TV decomposition, and compared the PWLS-TV method with direct matrix inversion method [36], TV filtration for the direct matrix inversion result [20], and the mean squared difference method [16]. The novelty of the proposed PWLS-TV material decomposition method is threefold. First, we incorporated the noise statistical properties of the TECT images into material decomposition process to improve the quality of basis material image. Second, PWLS-TV method enables noise suppression and material decomposition simultaneously in one iterative step. Third, an efficient alternating optimization algorithm was developed to minimize solve the objective function of the PWLS-TV method.
Methods and materials
Image-based basis material decomposition for TECT
In image-based basis material decomposition, the linear attenuation coefficient (LAC) of each pixel in a CT image can be formulized as a linear combination of the basis material images [16, 37]. The image-based basis material decomposition for TECT can be written as
In Equation (3),
Based on Equation (2), the basis material image can be calculated by direct matrix inversion as
We assume that the CT images are independent Gaussian random variables [20]
The negative log-likelihood function of independent fEi,k can be written as
Based on the aforementioned noise model, we propose a PWLS-TV basis material decomposition method. The cost function of the PWLS-TV basis material decomposition is written as
To solve the cost function in Equation (12), we alternatively minimize
The purpose of this two-step minimization is straightforward. We first obtain an initial solution from Equation (13), which may be very noisy. Then, TV regularization is used to suppress the noise and artifacts, thereby effectively improving the quality of the basis material image.
Equation (13) is a quadratic optimization problem, and its solution can be obtained from the optimal condition
Equation (15) admits a closed-form solution
Although Equation (16) is an exact analytic solution, the enormous size of the matrix
The minimum of the problem in Equation (14) can be solved by the Chambolle gradient projection (CGP) algorithm [44]. In CGP algorithm, we first solve the following constrained optimization problem
The iterative scheme for computing
The implementation of the PWLS-TV material decomposition method is described in the following steps: Initialization: Initialization: β1, β2, λ, and k : =0 While stop criterion is not met; Solve the problem in Equation (14): Solve the problem in Equation (15): End if criterion is satisfy.
In Step 1, the initial images
Parameter selection
Selection of penalty parameters β1 and β2
There are two penalty parameters (β1 and β2) in the PWLS-TV material decomposition method. These parameters determine the smoothness of the decomposed result, and the values of β1 and β2 depend on the noise level of the measured TECT images. Clearly, a considerably small penalty parameter would result in a very noisy result, whereas a considerably large penalty parameter will unavoidably lead to an over smoothed result. Searching for the optimal penalty parameters remains a difficult task in CT imaging [45–49].
In the experimental studies, we found that decomposed basis material images are less sensitive to the value of penalty parameter β1 within the range of 1.0 × 10⁻⁴ ≤ β1 ≤ 1.0 × 10⁻³. The value of β2 considerably affects the smoothness of the basis material images; further, the value of β2 is highly related to the noise level of the TECT images, and thus, it needs to be determined case by case.
Selection of iteration numbers for CG and CGP steps
The iteration numbers for each sub-iteration step is an essential factor for achieving high-quality basis material images. Although lager iteration numbers can obtain a convergent solution, the computational process may take a long time. Considering the characteristic of the alternating optimization algorithm, an adequate iteration number of CG steps is usually enough to generate a satisfactory result for the following CGP step. In this study, for all experimental data, the iteration numbers of CG and CGP steps are set to 2 and 10, respectively.
Stopping criterion
In this study, the relative error (RE) is used as the stopping criterion for the PWLS-TV material decomposition method. The RE is written as
Digital phantom
The proposed PWLS-TV material decomposition method was first evaluated using a digital phantom as shown in Fig. 1. This phantom is composed of four materials: soft tissue (#1), Gadolinium (#2), bone (#3), and water (#4). The TECT images were obtained at 70 kVp, 100 kVp, and 140 kVp. The x-ray spectra of the corresponding energy were generated by the TASMIC method [50]. The normalized x-ray spectra are shown in Fig. 2. A total number of 1.0 × 10⁵ incident photons are assumed to be emitted from the tube of a fan-beam CT scanner. The x-ray source to the detector distance is 949 mm, and the rotation center to the detector distance is 408 mm. The detector has 888 channels with a size of 1.0 mm. A total number of 984 projection views are evenly acquired from a full scan. The TECT images are reconstructed by a conventional filtered back-projection (FBP) algorithm with a ramp filter. The dimension of the reconstructed image is 256×256, and the physical size is 1.0 mm for each pixel.
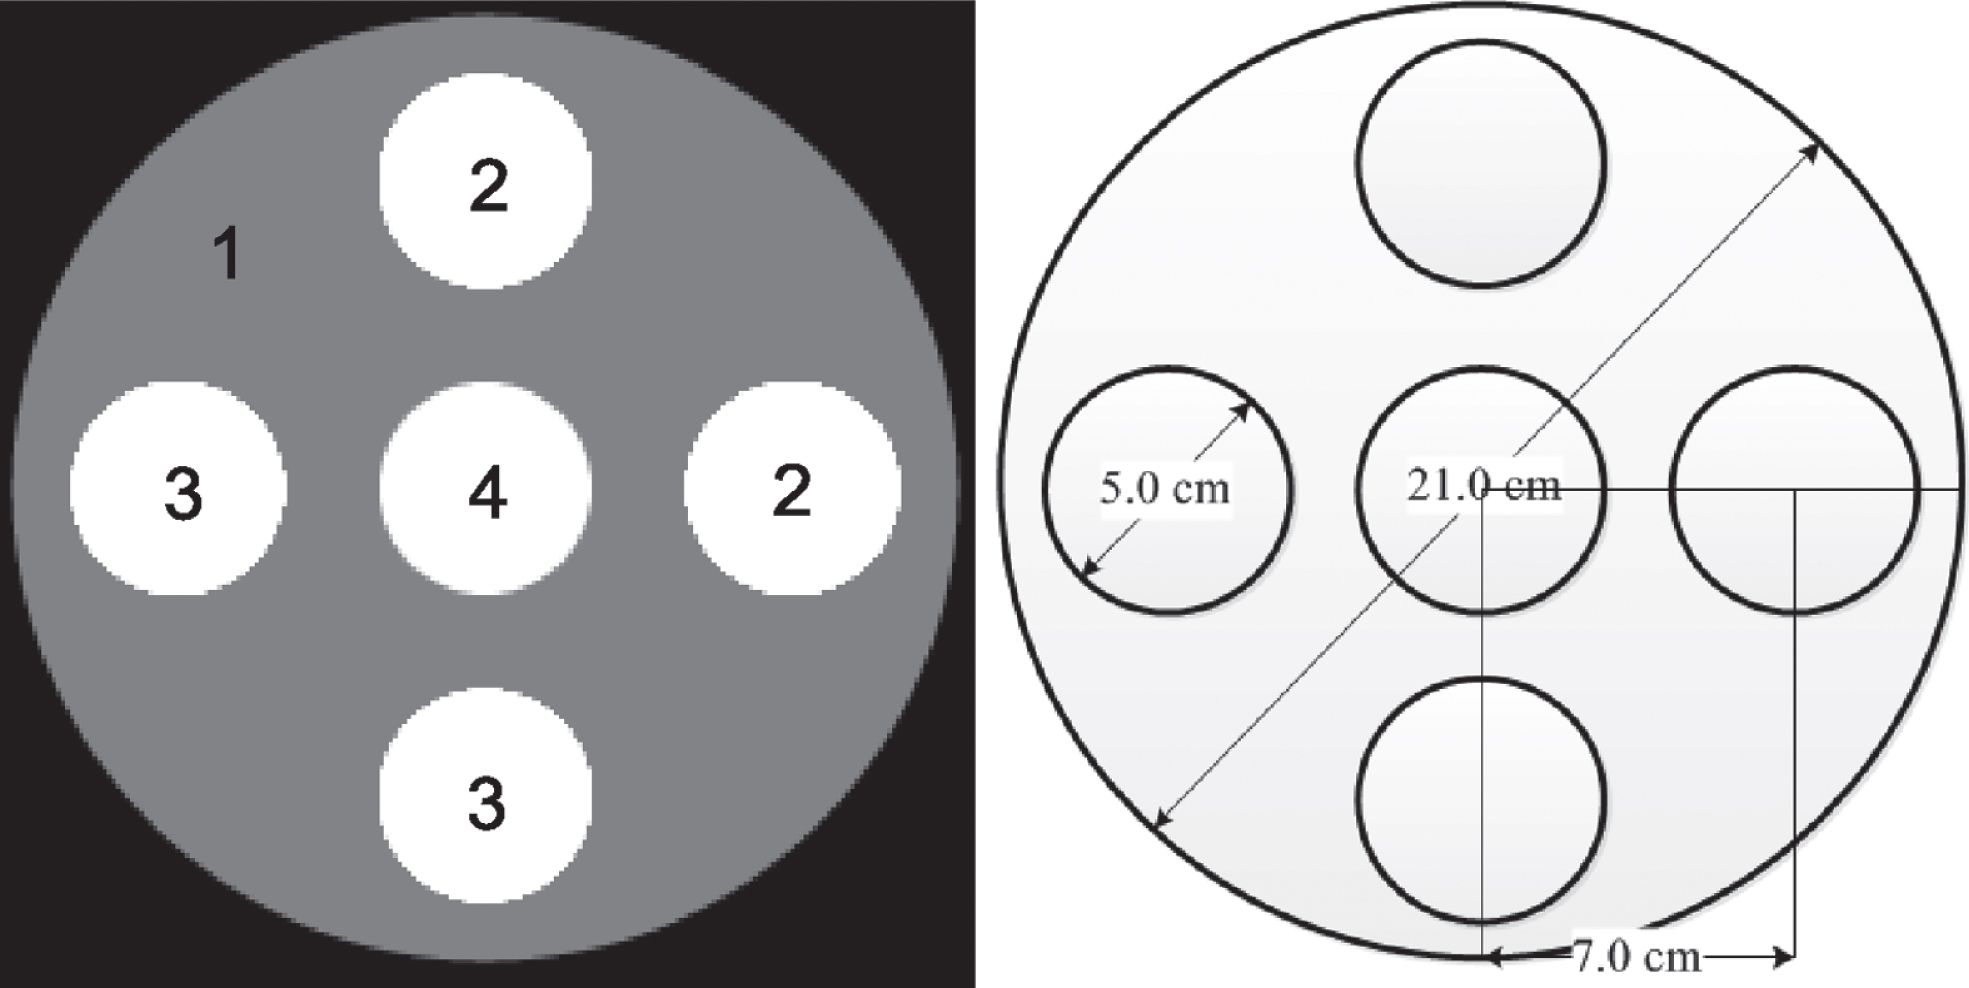
Digital phantom (left) with six objects and the geometric setting (right) of the phantom.
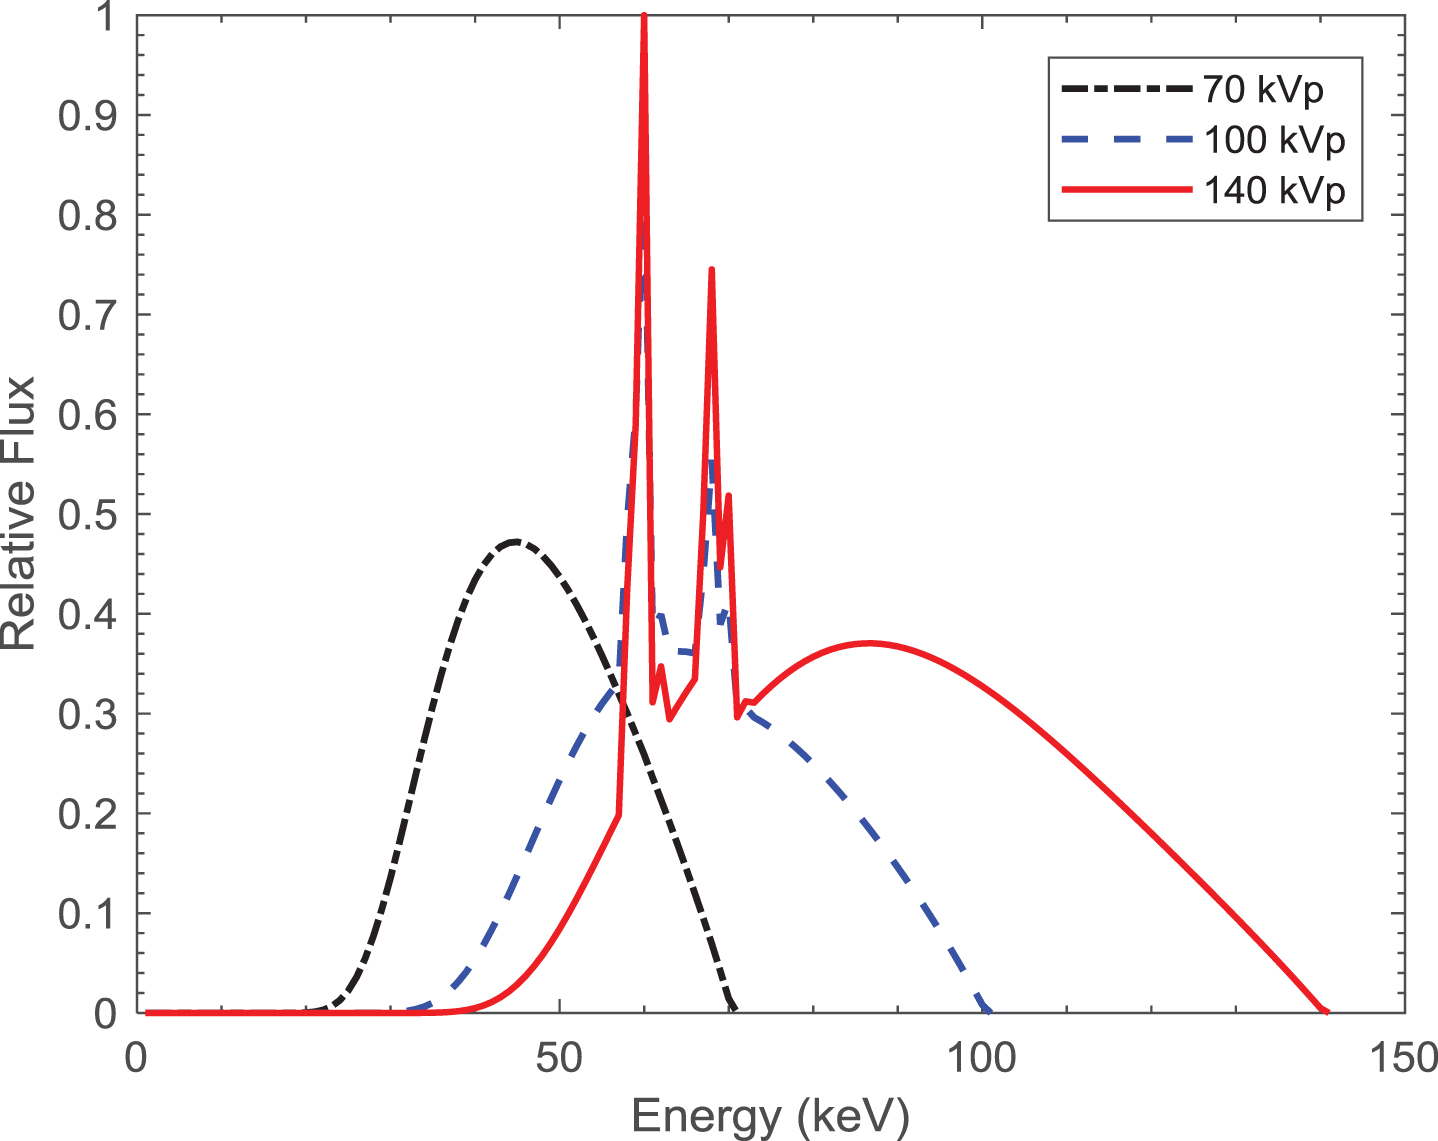
X-ray spectra used in the digital phantom study.
The proposed PWLS-TV material decomposition method was evaluated using a realistic mouse thorax phantom [51], and 2.0% iodinated contrast agent (see Fig. 3). The x-ray spectra of the three different energies were generated by the TASMIC method [50]. The corresponding normalized x-ray spectra are shown in Fig. 4. A total of 5.0 × 10⁴ incident photons are assumed to be emitted from the tube of a fan-beam CT scanner. The imaging geometry of the CT scanner is the same as the digital phantom. The dimension of the reconstructed TECT image is 256×256 with the pixel size of 1.0×1.0 mm.
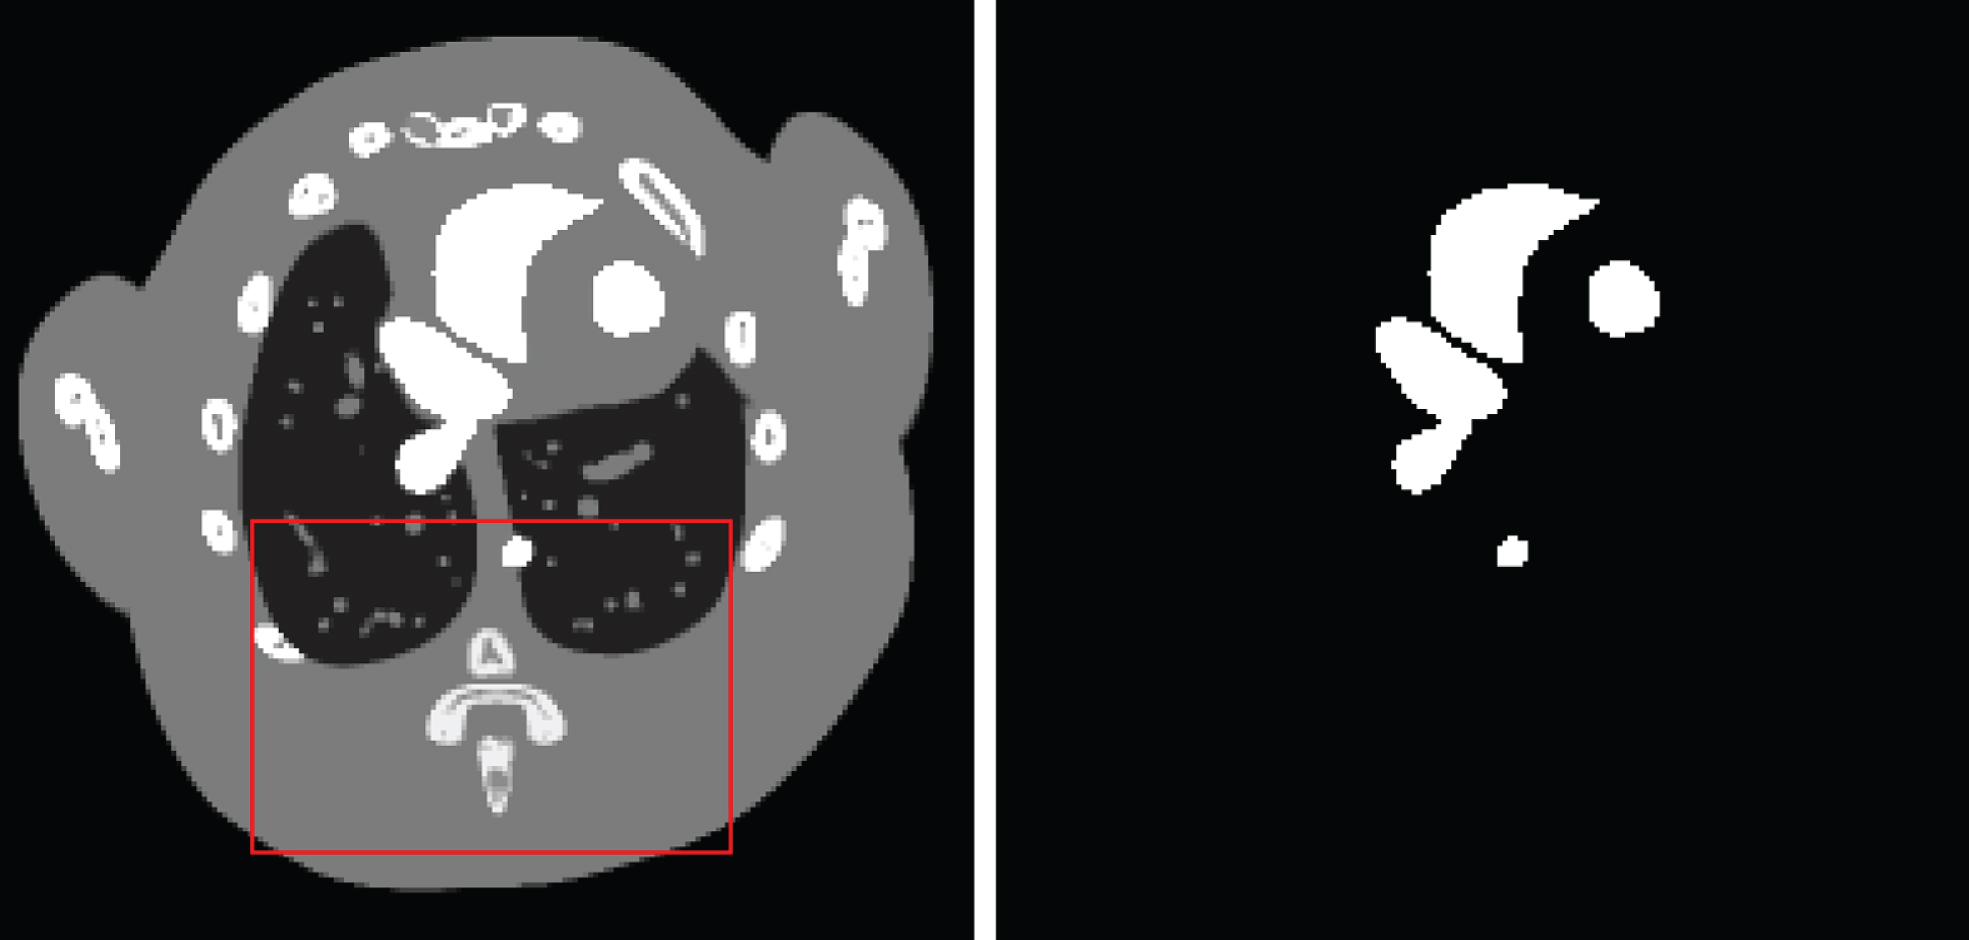
A slice of the thorax phantom (left) and iodinated contrast agent (right) distribution of this phantom.
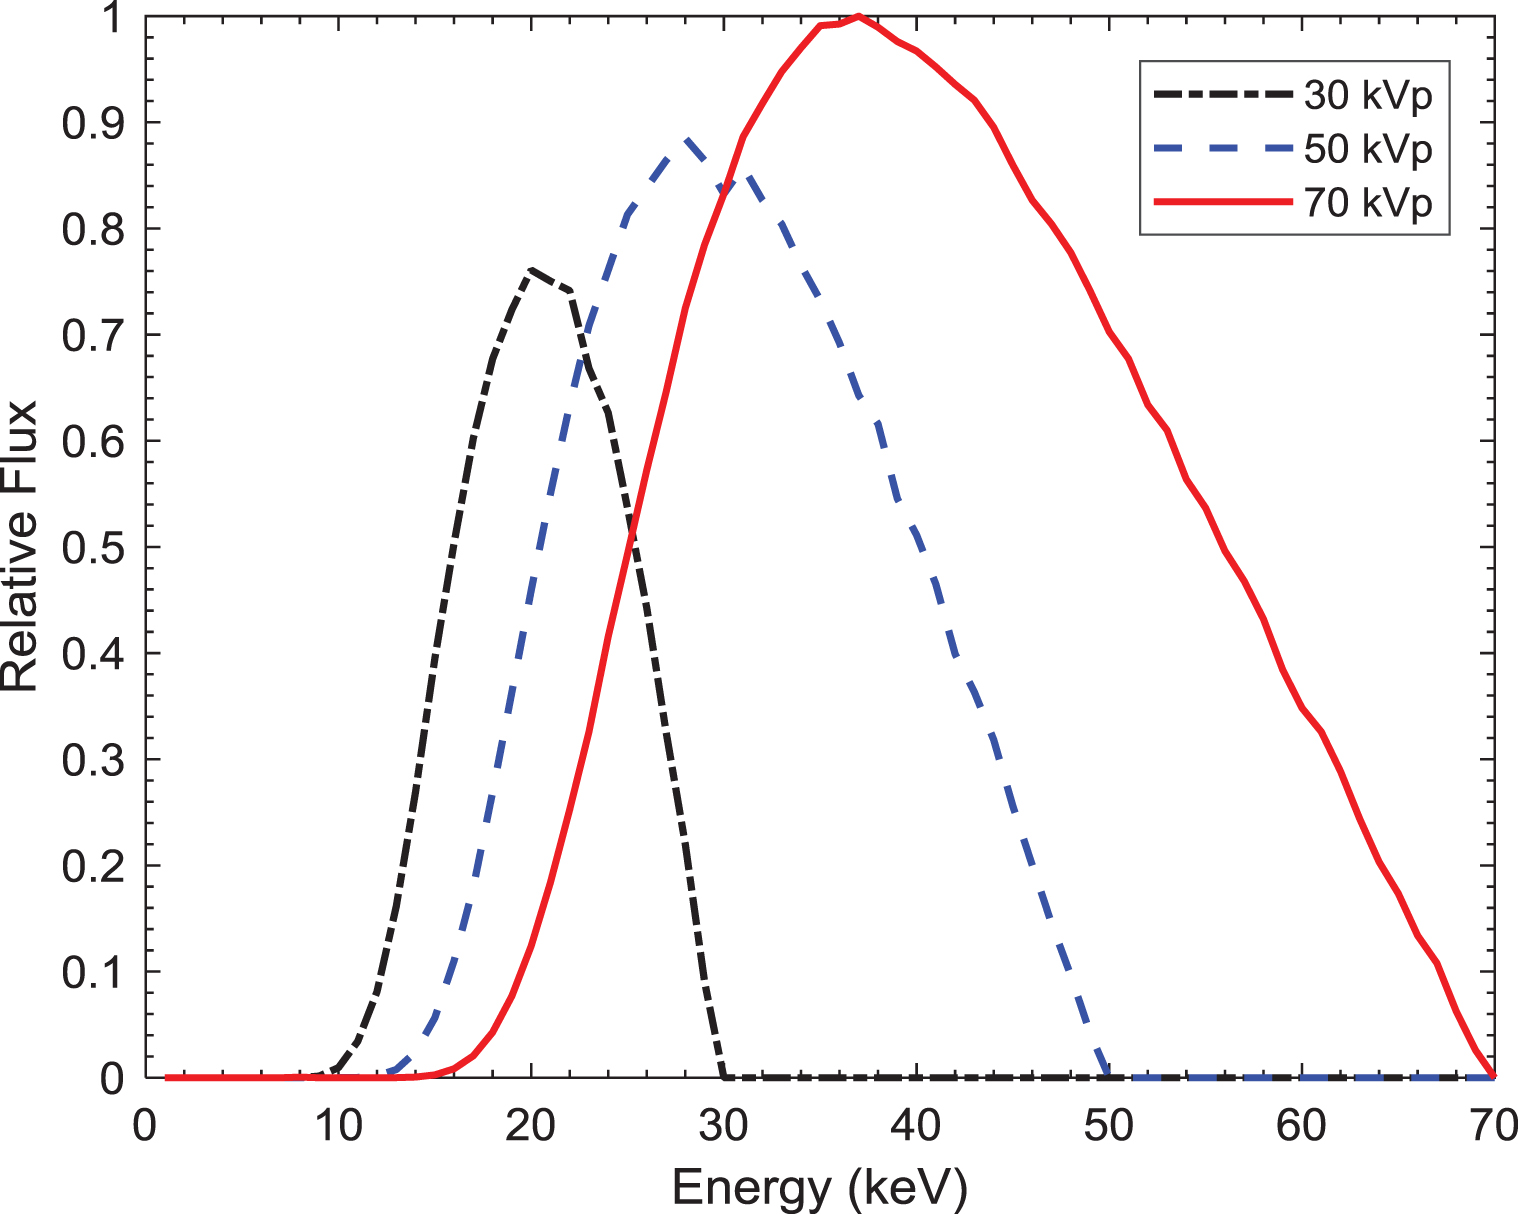
X-ray spectra used in the mouse thorax phantom study.
Material decomposition accuracy
In this study, relative root mean square error (RMSE) is used to measure the material decomposition accuracy. RMSE can be expressed as
Structural similarity (SSIM) [52] and feature similarity (FSIM) [53] are two widely used image quality assessment metrics, and they are used to measure the similarity between the decomposed results and the reference. The values of SSIM and FSIM range from 0 to 1; a larger value indicates a better similarity between the decomposed basis material image and the reference. In this study, we used the default parameters described in the corresponding references to calculate SSIM and FSIM, respectively.
Comparison methods
To further validate and evaluate the performance of the PWLS-TV material decomposition method, we compared it with the direct matrix inversion (DMI) method described in Equation (5), the TV filtration method for DMI decomposition results (TV-DMI), and the mean squared difference (MSD) method [16]. The TV-DMI method for material decomposition can be formulated as
Digital phantom study
Visual evaluation
Figure 5 shows the reconstructed TECT images of the circle phantom with 70, 100, and 140 kVp x-ray tube voltages, respectively. The four circular objects show similar or same x-ray attenuations, which are considerably difficult to distinguish for different objects. In this section, we choose three basis materials namely, soft tissue, bone, and gadolinium contrast agent. Figure 6 shows the decomposed results, with columns 1–4 showing three basis material images and the corresponding color image, respectively. The results decomposed from the phantom by MSD method were viewed as the references. It can be observed that these two methods result in high noise level in decomposed results, especially in the soft tissue and color images. The noise has been effectively reduced compared with the basis material images decomposed using DMI and MSD methods; however, some undesired noise and artifacts (as indicated by the arrows in Fig. 6) still exist in TV-DMI results. The fifth row depicts decomposed results from TECT images by the proposed PWLS-TV method, where the severe noise is reduced while the edges information is well preserved. The presented PWLS-TV material decomposition method achieves the best performance in terms of noise suppression and edge detail preservation compared to the other methods.
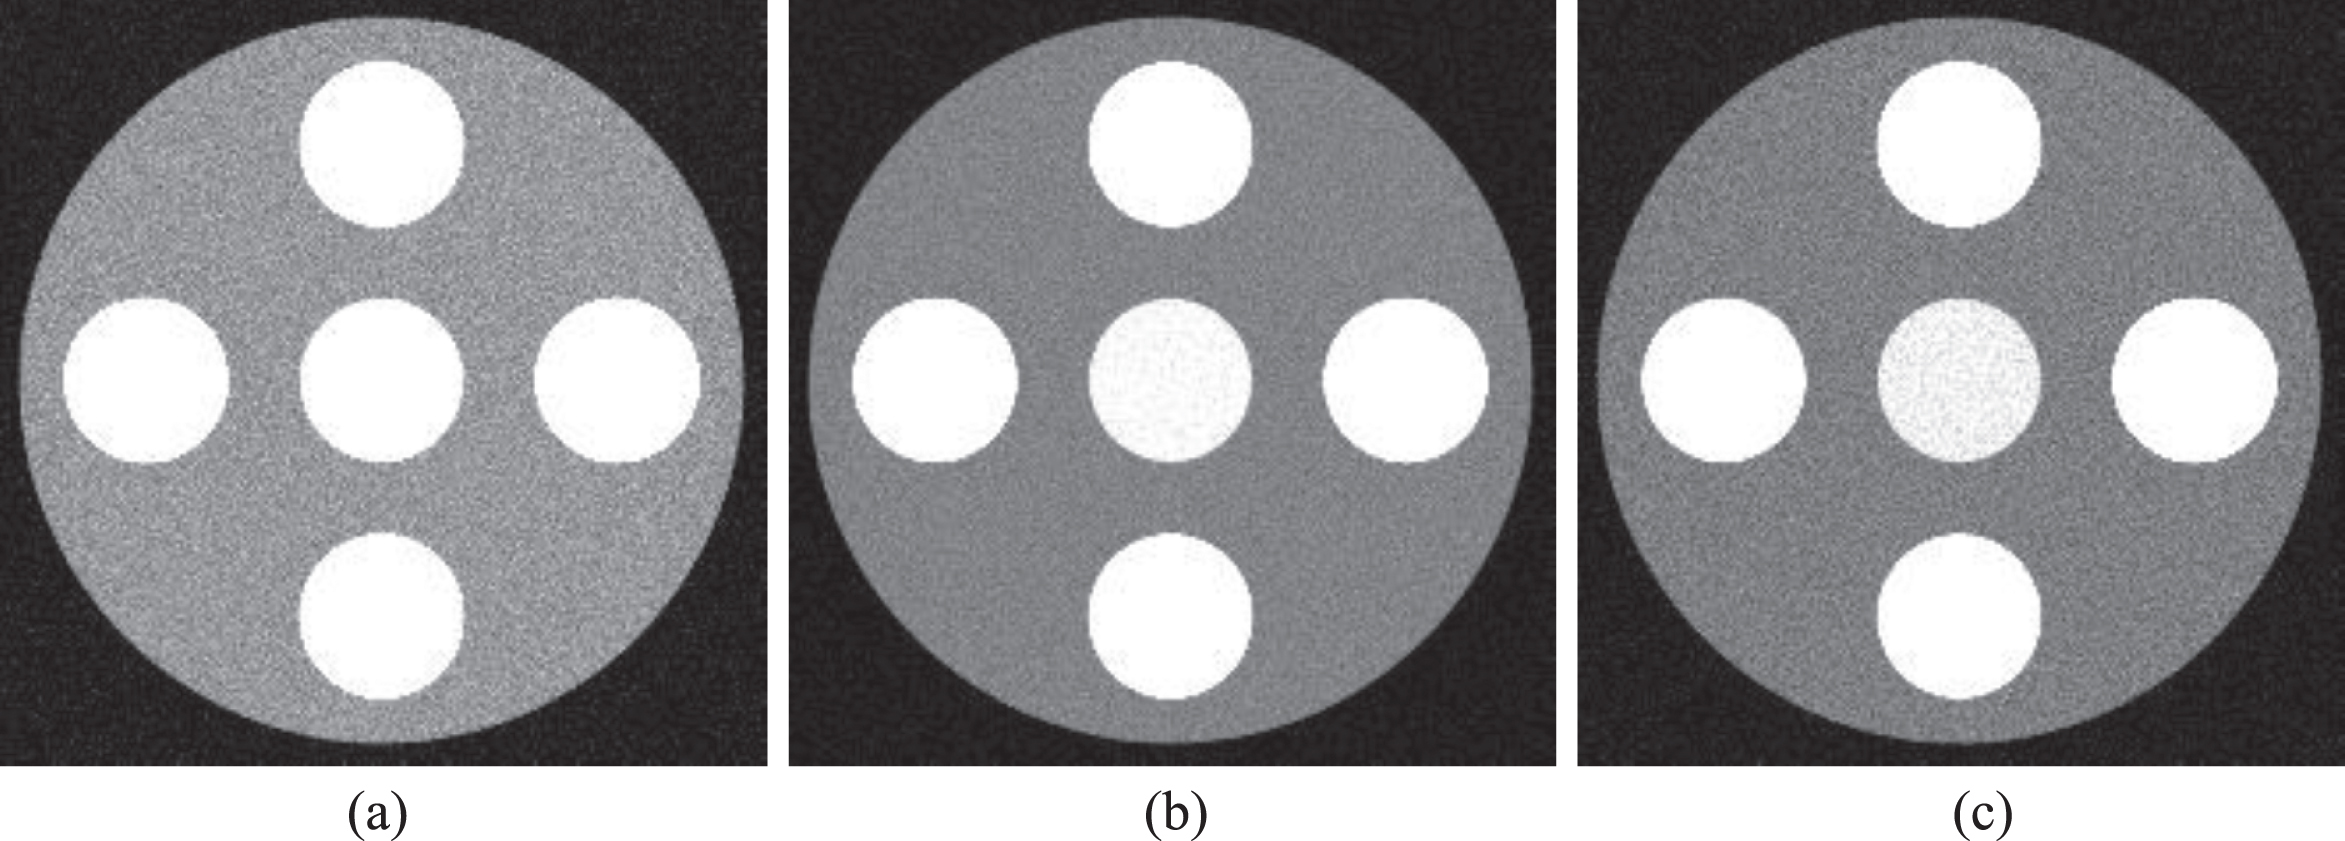
TECT images of the digital phantom: (a) 70 kVp; (b) 100 kVp; and (c) 140 kVp. From left to right, the display winds are [0, 0.05], [0, 0.045], and [0, 0.04] mm–1, respectively.
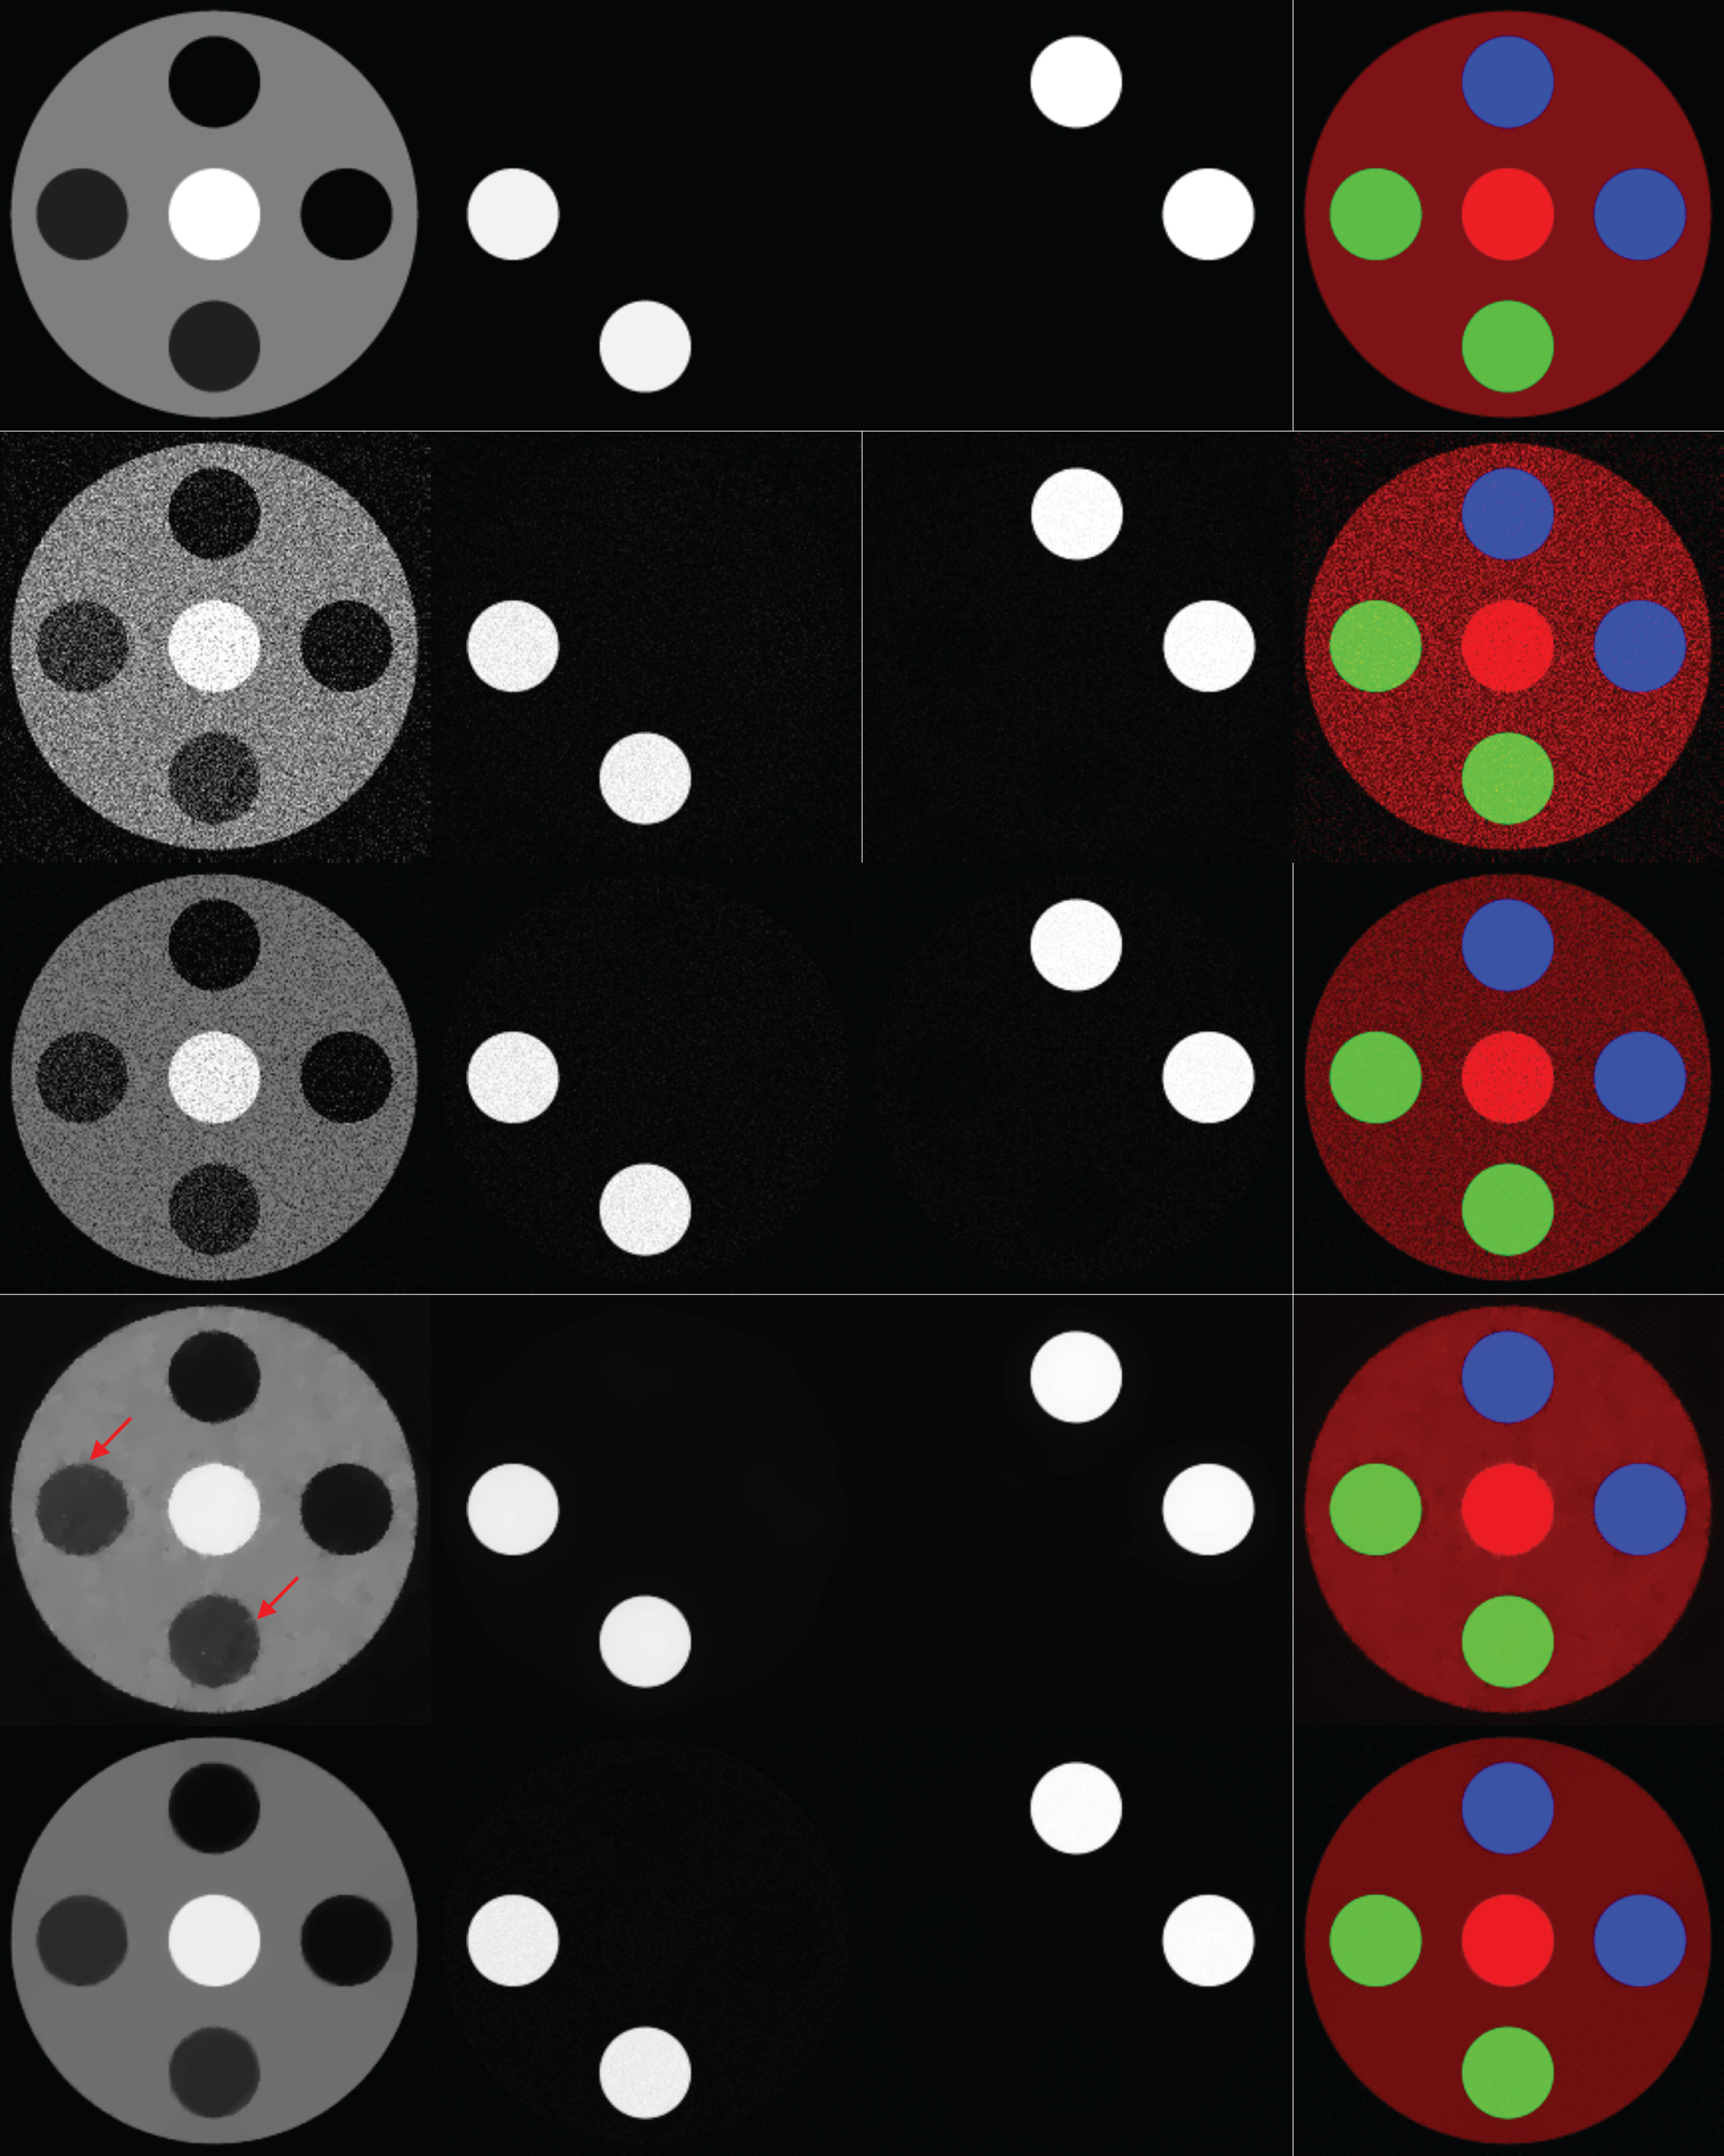
Basis material images from the digital phantom. From the left to right, the first three columns are soft tissue, bone, and gadolinium images, respectively. The fourth column is the color image where red, green, and blue components correspond to the three basis materials: soft tissue, bone, and Gadolinium, respectively. The first row is the results decomposed from phantom by MSD method. From the second to bottom rows, the results were decomposed by DMI, MSD, TV-DMI, and PWLS-TV methods, respectively.
To quantitatively evaluate the performance of these different material decomposition methods, the RMSE values of the decomposed results are depicted in Fig. 7. Figure 7 indicates that the PWLS-TV decomposition has the smallest RMSE value, and DMI decomposition has the largest RMSE value. The average RMSE values of the three basis material images decomposed by the DMI, MSD, TV-DMI, and PWLS-TV methods are 20.85%, 15.87%, 9.58%, and 8.06%, respectively. The results illustrate that the PWLS-TV material decomposition method achieves considerable gains compared with the DMI, MSD, and TV-DMI methods in the aspect of noise suppression.
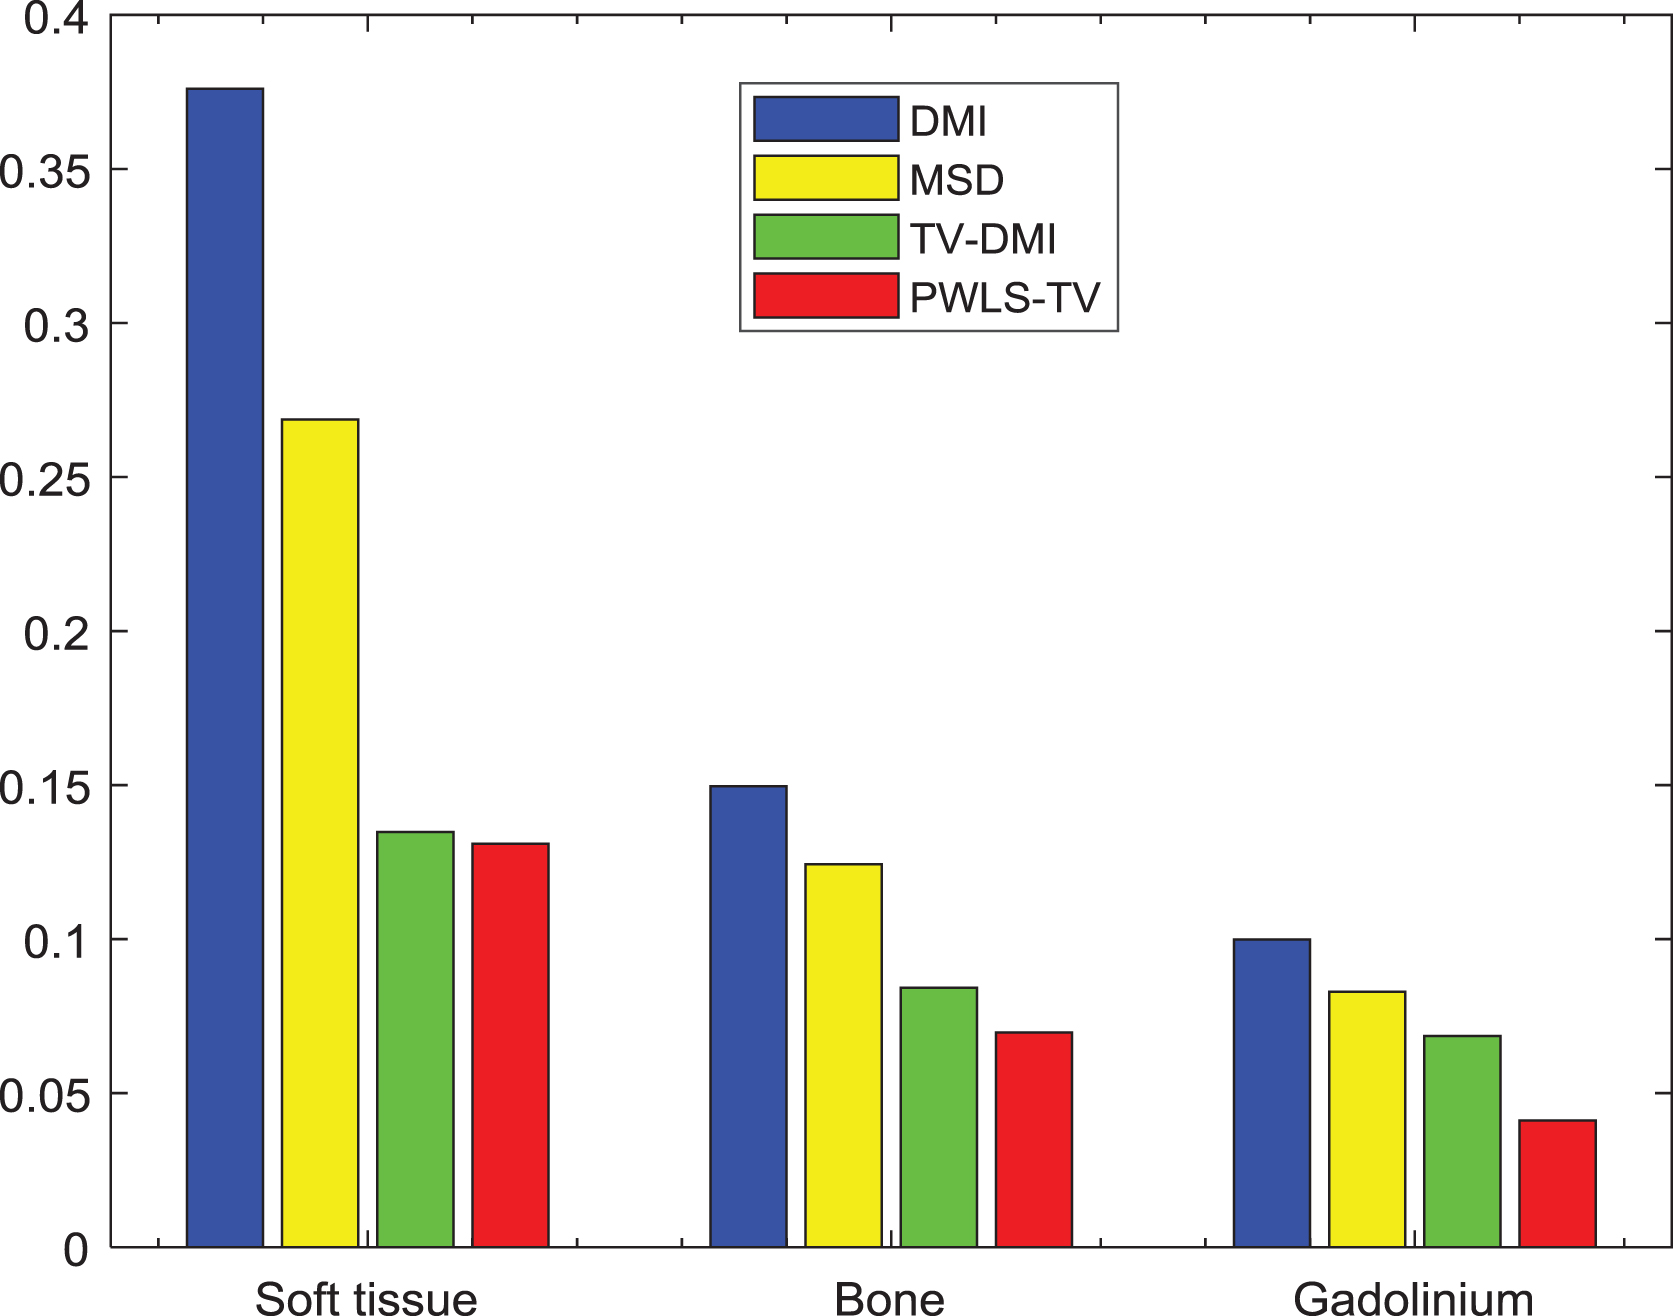
RMSE values of the decomposed results from digital phantom.
The SSIM values of the decomposed results are shown in Fig. 8 in which PWLS-TV method has the largest SSIM value, and DMI method has the smallest SSIM value. The average SSIM values of the three basis material images decomposed by the DMI, MSD, TV-DMI, and PWLS-TV methods are 0.25, 0.52, 0.45, and 0.77, respectively. The results demonstrate that PWLS-TV method achieves the best image quality over the DMI, MSD, and TV-DMI methods in terms of structure similarity.

SSIM values of the basis material images from digital phantom.
The FSIM values of the decomposed results are shown in Fig. 9. It can be seen that PWLS-TV decomposition has the largest FSIM value, followed by the TV-DMI and MSD methods, and DMI decomposition has the smallest FSIM value. The average FSIM values of the three basis material images decomposed by the DMI, MSD, TV-DMI, and PWLS-TV methods are 0.50, 0.62, 0.81, and 0.97, respectively. We confirm that PWLS-TV material decomposition method has the best performance in terms of feature similarity.

FSIM values of the decomposed results from digital phantom.
Figure 10 shows the convergence curves of the PWLS-TV decomposition with respect to RE and RMSE. Figure 10(a) and (b) depict the RE and RMSE curves with respect to iteration number, respectively. This figure indicates that the errors decrease gradually and remain stable after enough iterations.
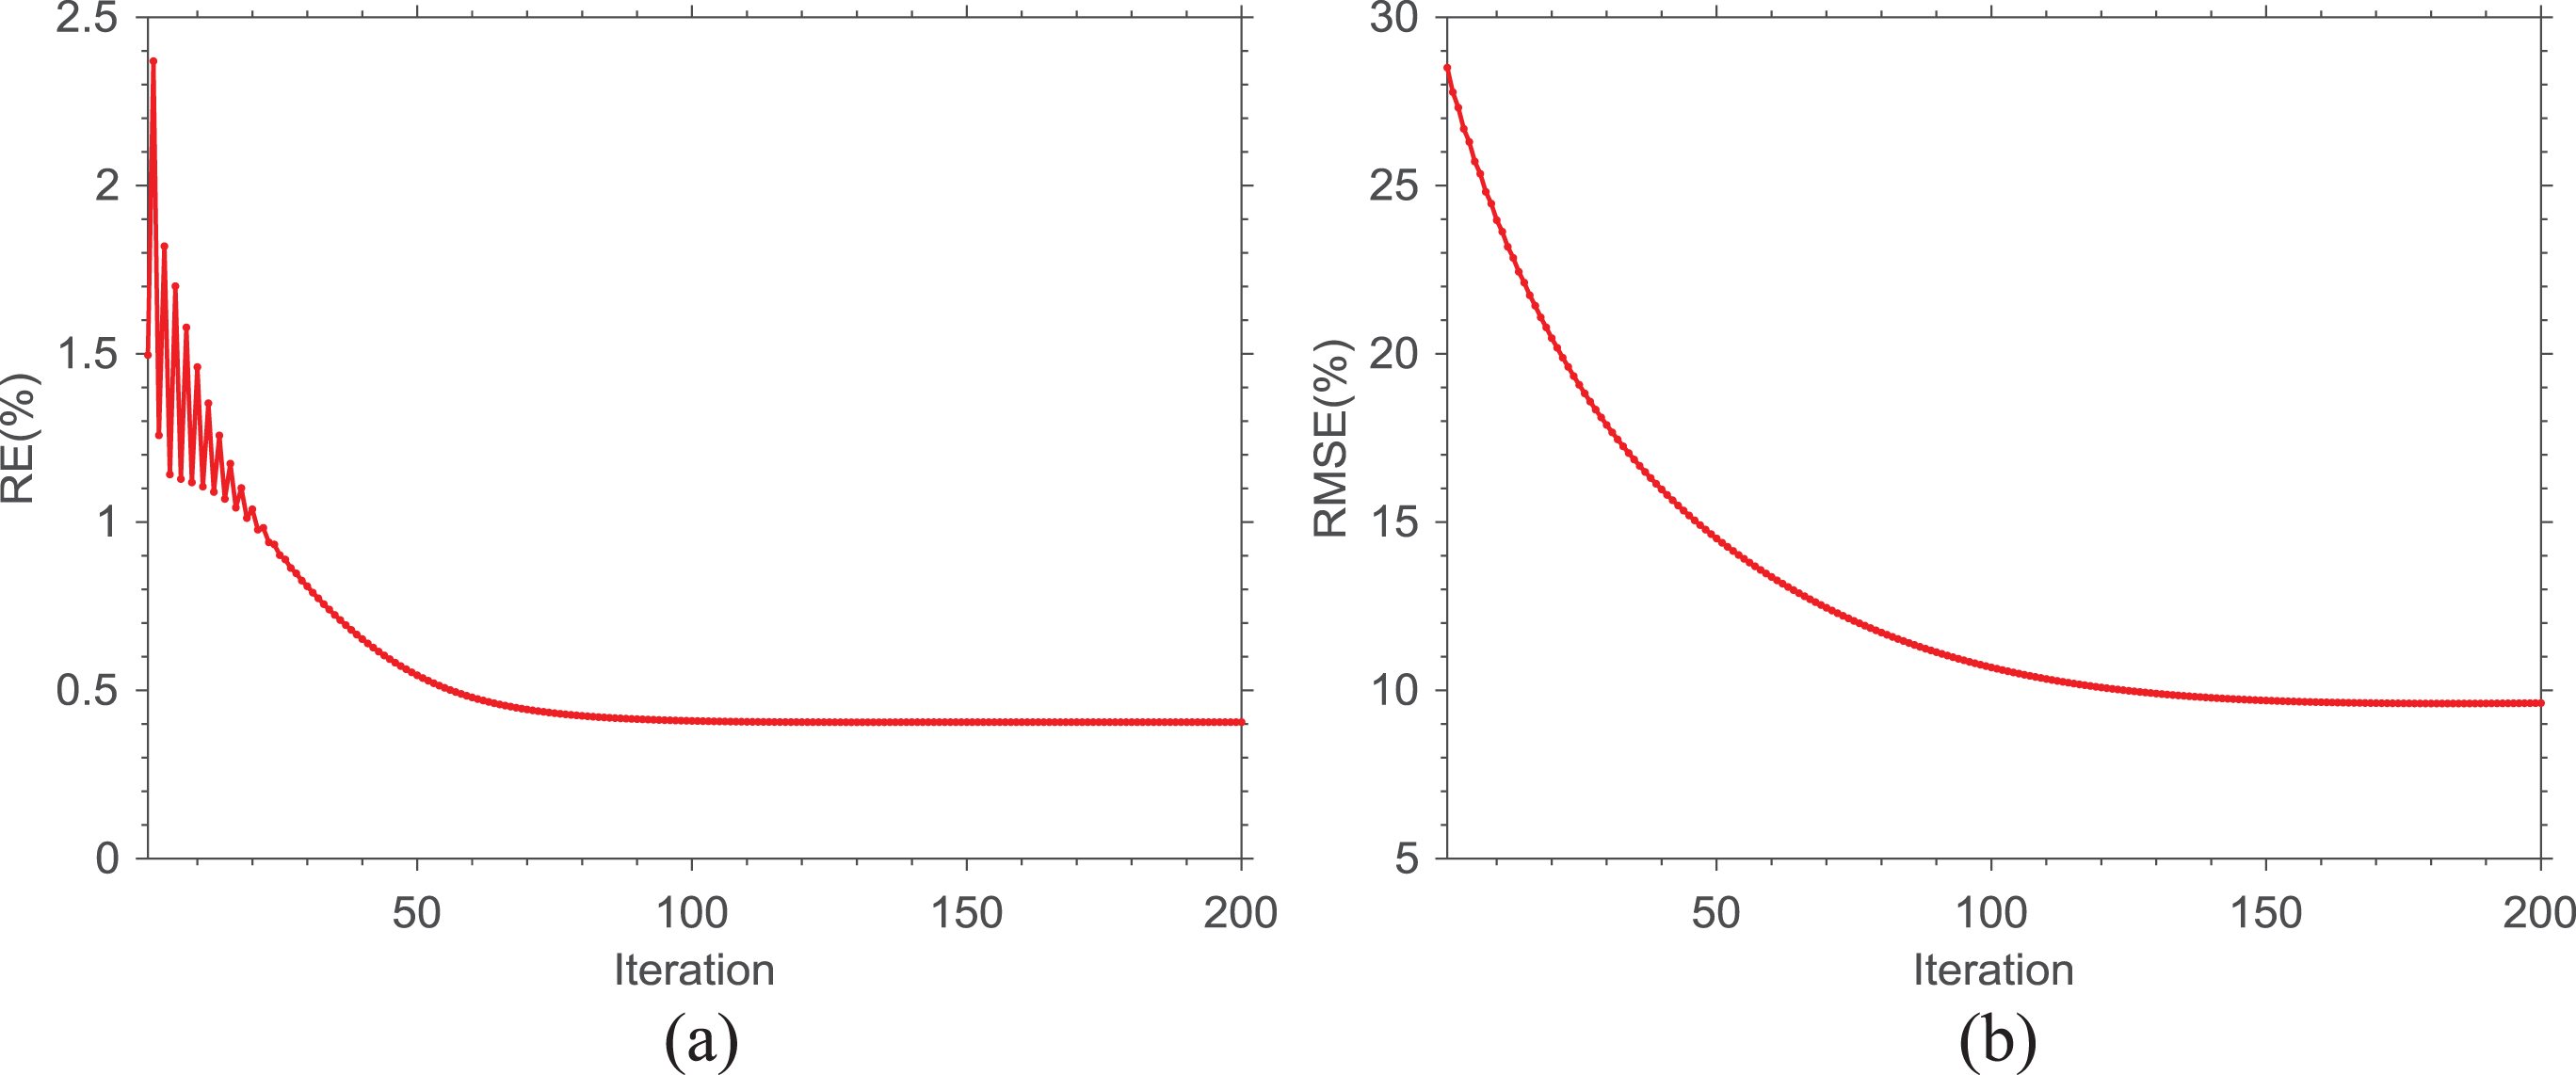
Convergence curves of the PWLS-TV decomposition: (a) RE values versus iteration number; (b) RMSE values versus iteration number.
Visual evaluation
Figure 11 shows the TECT images of the mouse thorax phantom at 30, 50, and 70 kVp x-ray tube voltages, respectively. In this section, we choose soft tissue, bone, and iodinated contrast agent as the basis materials. Figure 12 shows the decomposed results, with columns 1–4 showing three basis material images and the corresponding color image, respectively. The first row depicts the decomposed results from the phantom by the MSD method, which is used as the reference. The second row shows the decomposed results from TECT images by DMI method, which results in high noise level in the decomposed results, especially in the soft tissue image, where fine structures in lung (as indicated by the red arrows in Fig. 12) is hardly distinguished from noise. The third row represents the decomposed results from TECT images by the MSD method, which suffers from severe degradation of image quality. Moreover, many pixels in the bone images (as indicated by the white arrows in Fig. 12) decomposed by DMI and MSD methods are misclassified as containing bone. The fourth row shows the decomposed results from TECT images by the TV-DMI method. The noise in these basis material images is effectively reduced; however, the edge of the resulting bone image are oversmoothed (as indicated by the blue arrow in Fig. 12). The fifth row shows decomposed results from TECT images by the proposed PWLS-TV method; not only is the severe noise reduced, but the edge and fine structure are well preserved. The abovementioned results reveal that PWLS-TV decomposition can obtain much better basis material images as compared to the result of the competing decomposition methods. The observation is consistent with our previous results in the digital phantom study.

TECT images of the mouse thorax phantom: (a) 30 kVp; (b) 50 kVp; (c) 70 kVp. From left to right, the display winds are [0, 0.16], [0, 0.07], and [0, 0.055] mm–1, respectively.
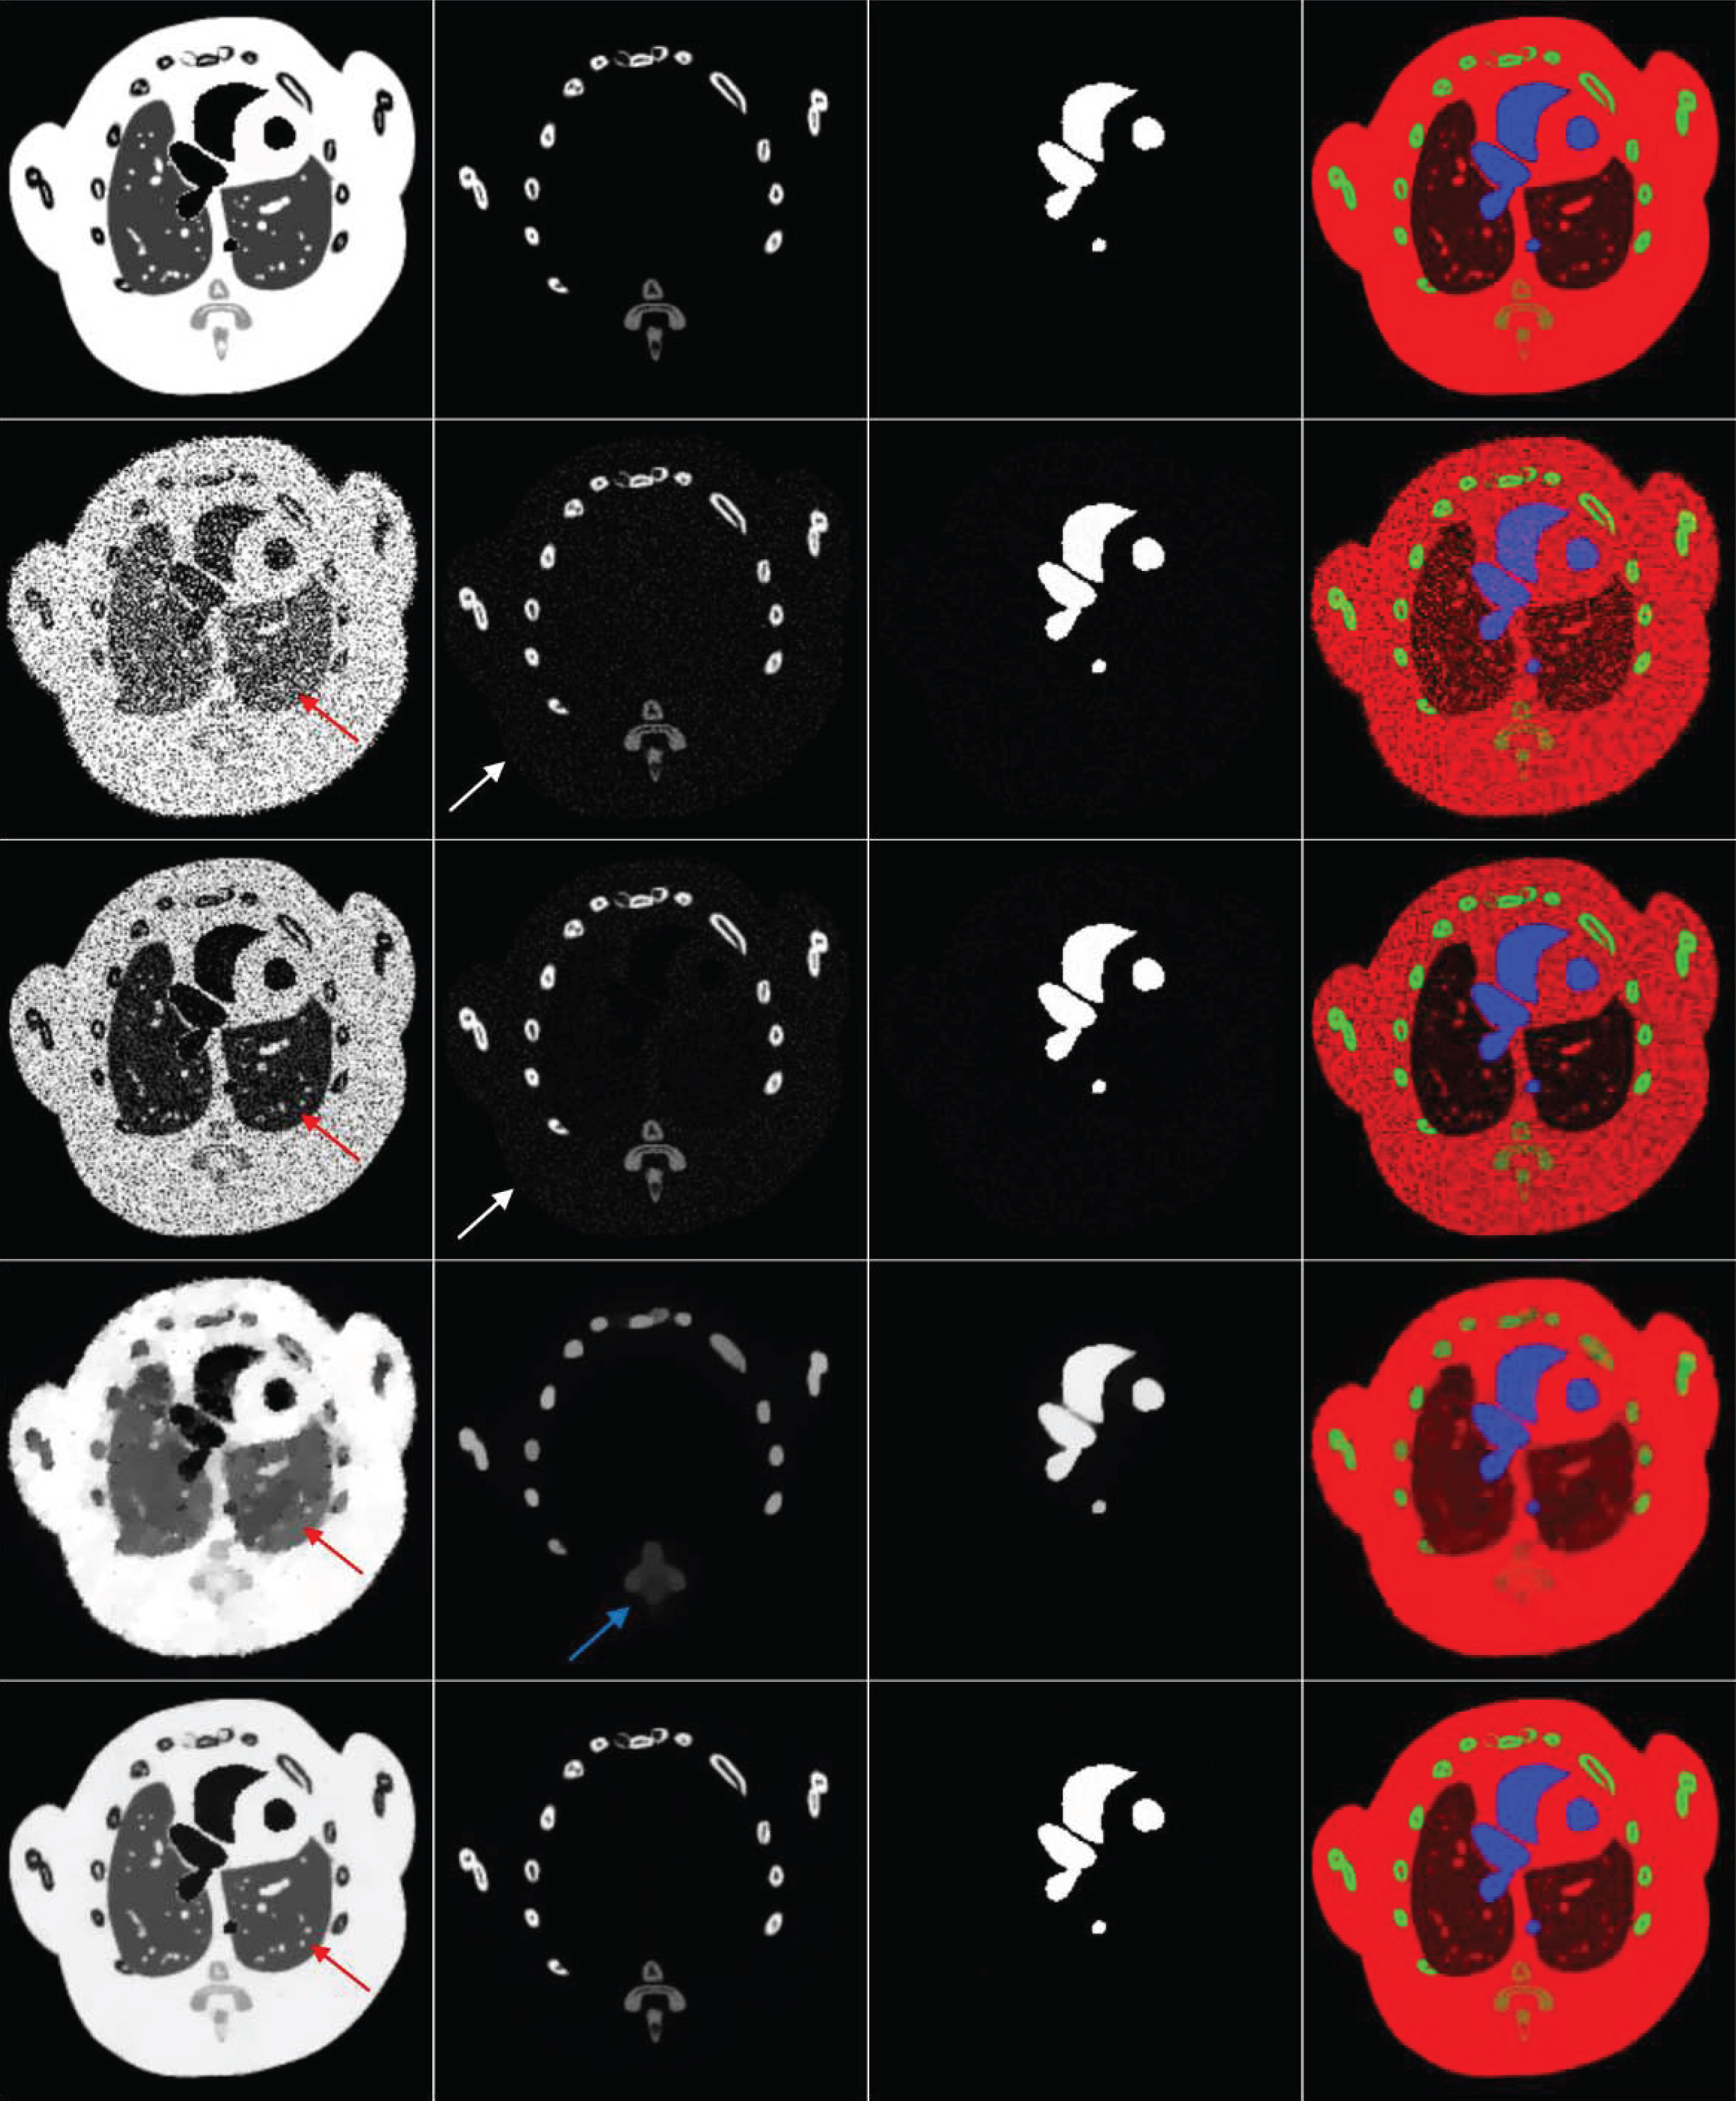
Basis material images from the mouse thorax phantom. From the left to right, the first three columns are the soft tissue, bone, and iodine images, respectively. The fourth column is the color image where red, green, and blue components correspond to the three basis materials: soft tissue, bone, and iodine, respectively. The first row is the results decomposed from phantom by MSD method. From the second to bottom rows, the results were decomposed by DMI, MSD, TV-DMI, and PWLS-TV methods, respectively.
Figure 13 shows the RMSE values of the basis material images in Fig. 12. It can be seen that PWLS-TV decomposition has the smallest RMSE value. The average RMSE values of the three basis material images decomposed by the DMI, MSD, TV-DMI, and PWLS-TV methods are 29.03%, 25.73%, 26.33%, and 8.49%, respectively. That is, the material decomposition accuracy of TECT is greatly improved by the PWLS-TV method compared with DMI, MSD, and TV-DMI methods.

RMSE values of the decomposed results from the Mouse thorax phantom.
To further illustrate the differences between decomposed results, a zoomed ROI (indicated by the red square in Fig. 3) is shown in Fig. 14. The corresponding SSIM values of the zoomed ROI are shown in Fig. 15. For each basis material, PWLS-TV decomposition has the largest SSIM value, and the SSIM value decreases gradually from TV-DMI decomposition, MSD decomposition, to DMI decomposition. The average SSIM values of the three basis material images from DMI, MSD, TV-DMI, and PWLS-TV methods are 0.26, 0.33, 0.75, and 0.89, respectively. The results indicate that PWLS-TV decomposition has the best performance in terms of structure similarity.

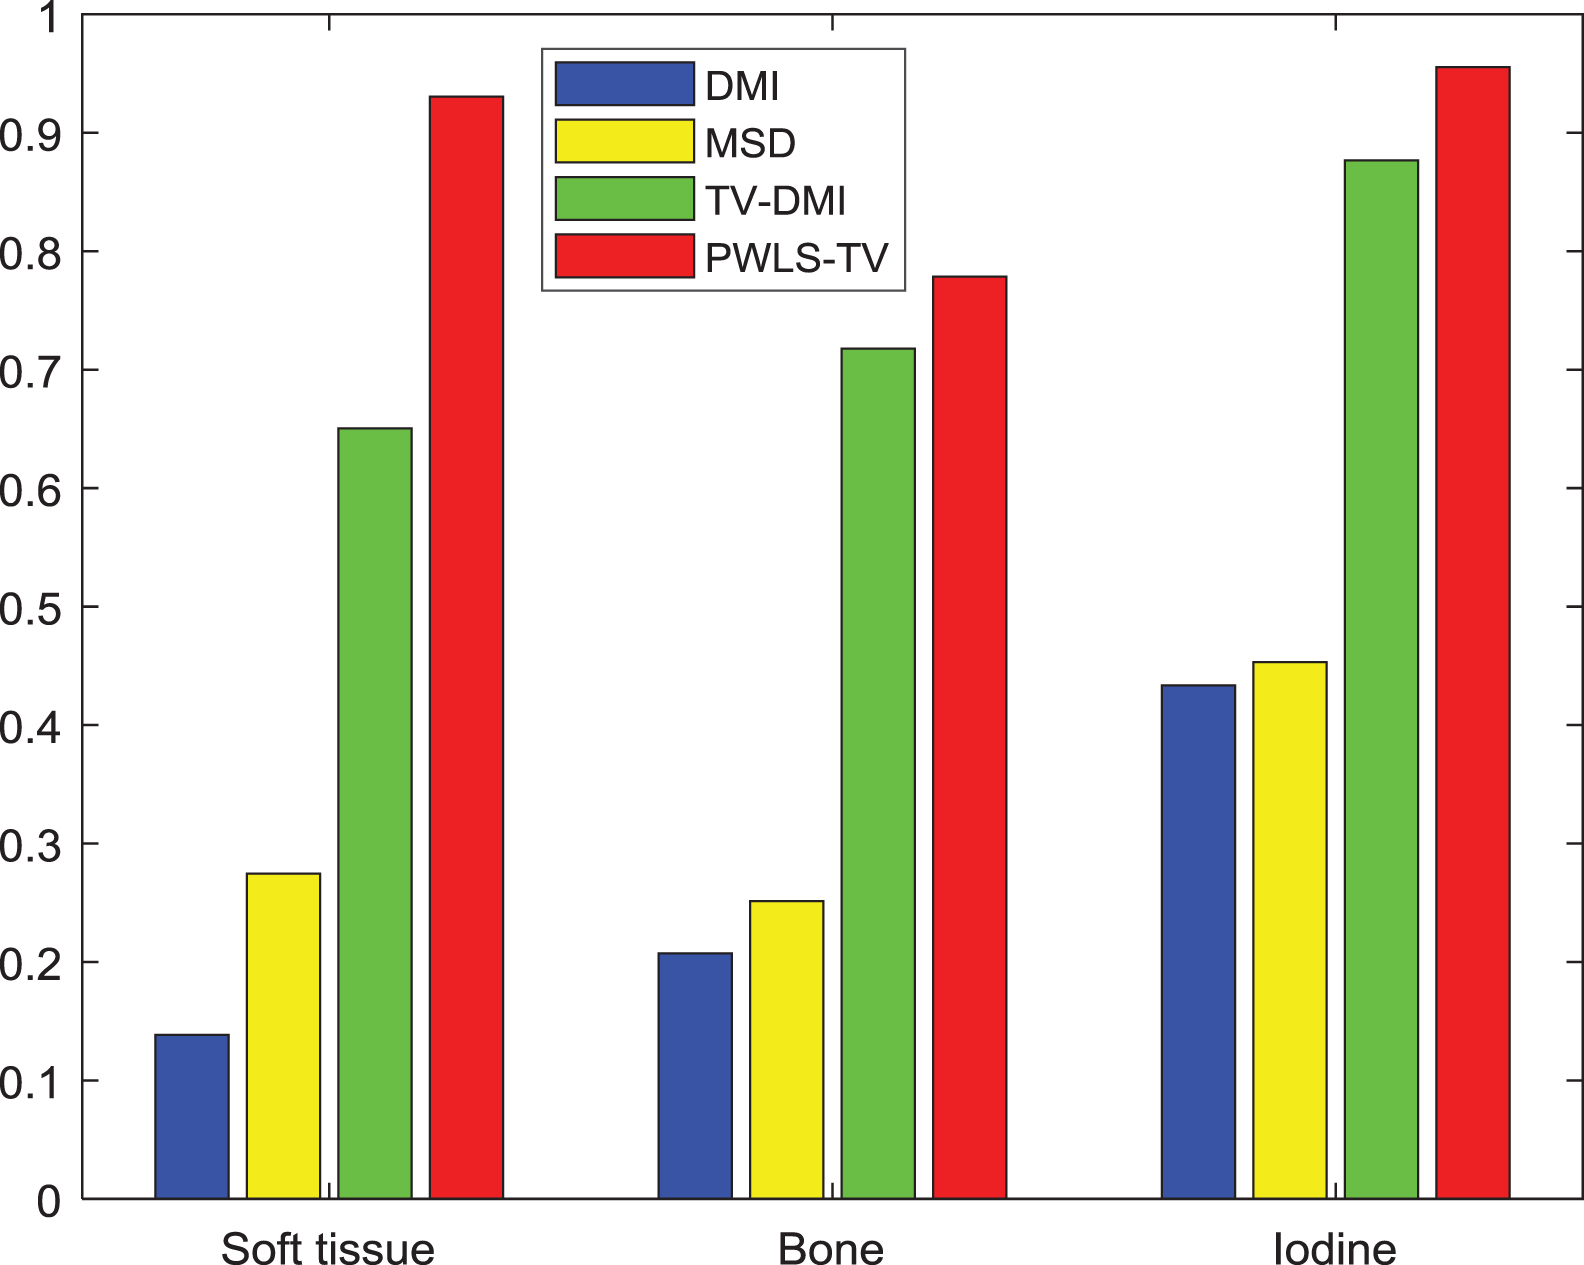
SSIM values of the images in Fig. 14.
The FSIM values of the zoomed ROI are shown in Fig. 16. It can be find that the PWLS-TV decomposition has the largest FSIM value, followed by the TV-DMI and MSD methods, and DMI decomposition has the smallest FSIM value in all basis materials. The average FSIM values of the three basis material images from DMI, MSD, TV-DMI, and PWLS-TV methods are 0.58, 0.65, 0.85, and 0.96, respectively. The results indicate that PWLS-TV decomposition achieves the best image quality over the DMI, MSD, and TV-DMI methods in terms of feature similarity.
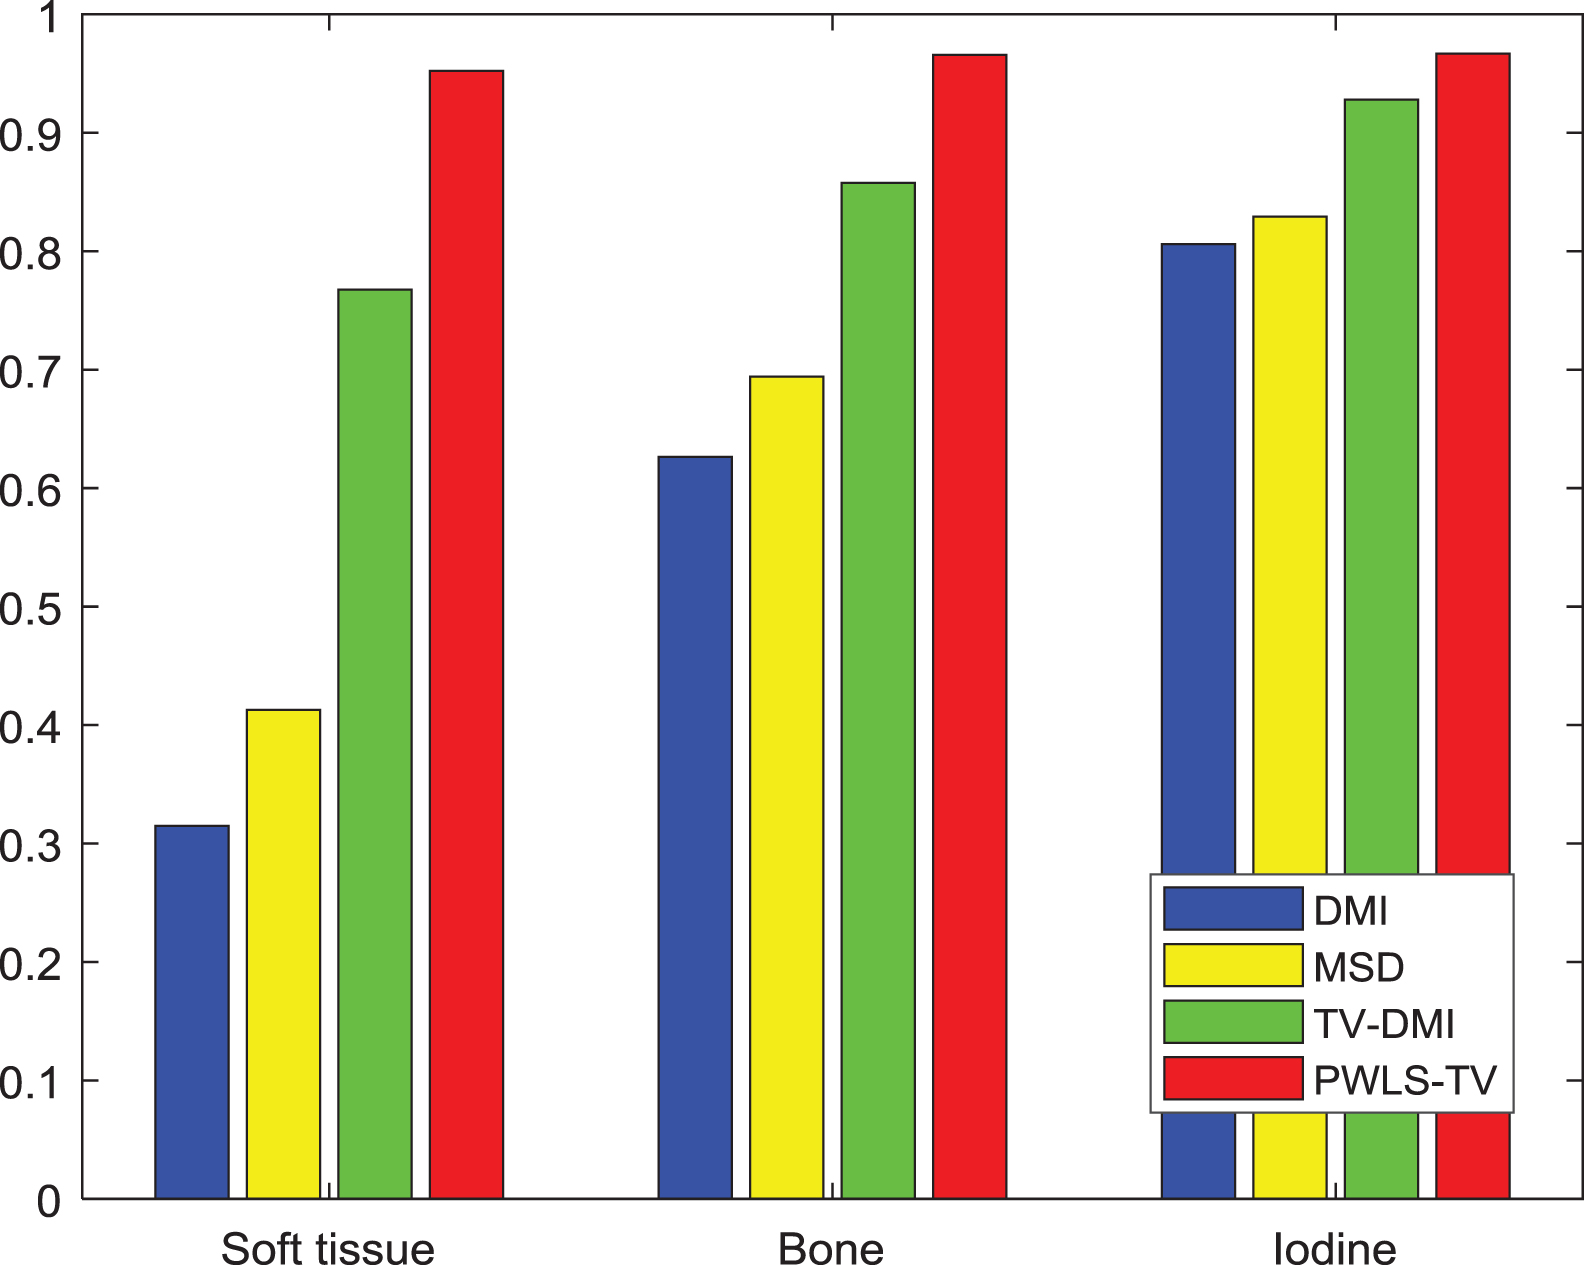
FSIM values of the images in Fig. 14.
In this study, we presented an image-based material decomposition method for TECT using PWLS criteria with TV regularization. In contrast to existing material decomposition strategies, the PWLS-TV method enables simultaneous material decomposition and noise suppression in an iterative process. Moreover, the noise statistical properties of the image-based material decomposition process were fully exploited to enhance the quality of basis material images. The results from experimental studies demonstrate that the presented PWLS-TV method shows superior performance in noise reduction without sacrificing edge and fine structure details in the decomposed results.
In the digital phantom study, the PWLS-TV decomposition greatly improved material decomposition accuracy of TECT compared with DMI, MSD, and TV-DMI methods. In terms of the visual evaluation, PWLS-TV decomposition greatly reduced the noise in basis material images and generated satisfactory color images. The corresponding quantitative evaluation (RMSE, SSIM, and FISM studies) further showed the superior performance of PWLS-TV decomposition. In the mouse thorax phantom study, PWLS-TV method provided the most accurate basis material and color images compared with DMI, MSD, and TV-DMI methods. The PWLS-TV decomposition effectively reduced magnified noise and generated satisfactory results inside of the lung and boundary of the spine (see magnified view in Fig. 14) with visual inspection. For quantitative evaluation, the results of PWLS-TV decomposition were consistent with that of digital phantom study.
The convergence analysis in digital phantom study illustrated that the PWLS-TV decomposition will converge to a satisfactory solution with reasonable parameter settings. In the PWLS-TV decomposition, there are five main tuning parameters: the iteration number of the CG algorithm, the iteration number of the CGP algorithm, the step size λ of the CGP algorithm, β1, and β2. The iteration number of each sub-iteration plays an essential role in obtaining satisfactory results within an efficient time. A large iteration step can obtain a convergent solution; however, it may take a considerable amount of time to execute. In this study, for all experimental data, the iteration steps of the CG algorithm and the CGP algorithm were set to 2 and 10, respectively. It can be seen that satisfactory basis material images were obtained in the results section, which shows that the selected iteration step for each sub-iteration is suitable for PWLS-TV decomposition. The step size λ in the CGP algorithm can be determined according to the approach suggested in a previous study [44]. The penalty parameters β1 and β2 are highly related to the smoothness of the basis material images; a large one will generate over smoothing results, while a small one will obtain a noisy result. In this study, we first chose a large penalty value and then gradually decrease it to obtain a satisfactory result. This approach can be viewed as a trial-and-error process. Accurately determining the appropriate value for each parameter remains a challenge in CT imaging [45, 54]. The strategy to adaptively determine the penalty parameters can be conducted to further improve the performance of the PWLS-TV decomposition.
In this study, the statistical weight was determined by the noise variance of the TECT images. In the implementation, we assumed a uniform distribution of the noise in TECT images, and calculated the noise variance of a manually selected ROI. Such an assumption has also been used in some previous image-domain based decomposition studies [20, 21]. Determining the exact distribution of the noise in TECT images remains a challenge, as it depends on a number of factors such as reconstruction algorithms. The performance of PWLS-TV decomposition method could be further improved using a pixel-dependent noise variation in the implementation of PWLS-TV decomposition. In the past few years, theoretical studies on computing pixel-dependent noise variance from CT images have been conducted. For example, Wunderlich and Noo developed a novel approach to analytically calculate the noise variance between pixel values in reconstructed CT images [55]. Based on the noise distribution of the projection data, Li et al. presented a computationally efficient method to reconstruct the noise map in the CT images [56]. Incorporating the pixel-dependent noise variance estimation into the presented PWLS-TV decomposition method will be an interesting topic for future study.
In summary, we developed a PWLS-TV material decomposition method to improve the quality of basis material images. The PWLS-TV method can simultaneously perform noise reduction and material decomposition in one iterative step. The PWLS-TV method effectively explores the noise statistical properties of the material decomposition process, and it results in a considerable improvement of basis material image quality.
Footnotes
Acknowledgments
This work was supported in part by the National Natural Science Foundation of China (11701097, 11661007), Training Plan for Excellent Young Talents in Jiangxi Province (20192BCB23019), Jiangxi Double Thousand Plan, Science and Technology Innovation Talent Program of Ganzhou, Project of Jiangxi Key Laboratory of Numerical Simulation Technology, US National Institutes of Health (R01 EB020366), Cancer Prevention and Research Institute of Texas (RP160661).