
Abstract
OBJECTIVES:
To investigate whether the baseline apparent diffusion coefficient (ADC) can predict survival in the hepatocellular carcinoma (HCC) patients receiving chemoembolization.
MATERIALS AND METHODS:
Diffusion-weighted MR imaging of HCC patients is performed within 2 weeks before chemoembolization. The ADC of the largest index lesion is recorded. Responses are assessed by mRECIST after the start of the second course of chemoembolization. Receiver operating characteristic (ROC) curve analysis is performed to evaluate the diagnostic performance and determine optimal cut-off values. Cox regression and Kaplan–Meier survival analyses are used to explore the differences in overall survival (OS) between the responders and non-responders.
RESULTS:
The difference is statistically significant in the baseline ADC between the responders and non-responders (P < 0.001). ROC analyses indicate that the baseline ADC value is a good predictor of response to treatment with an area under the ROC curve (AUC) of 0.744 and the optimal cut-off value of 1.22×10⁻³ mm2/s. The Cox regression model shows that the baseline ADC is an independent predictor of OS, with a 57.2% reduction in risk.
CONCLUSION:
An optimal baseline ADC value is a functional imaging response biomarker that has higher discriminatory power to predict tumor response and prolonged survival following chemoembolization in HCC patients.
Keywords
Introduction
Hepatocellular carcinoma (HCC) is one of the most frequently diagnosed cancers and a common cause of cancer death worldwide [1]. Patients who are not candidates for curative treatments may be eligible for Intra-arterial therapy, such as chemoembolization. It significantly delays tumor progression and vascular invasion [2].
Assessing early HCC response to therapy is necessary to individualize therapy and tailor future treatment strategies. Enhancement approaches, rather than any size criteria, are better anatomic criteria for categorizing distinct responses in trials assessing the survival of patients with HCC following chemoembolization [3, 4]. MR imaging has several advantages over CT, including the lack of ionizing radiation. Functional magnetic resonance imaging (MRI) response after initial intra-arterial therapy showed improved overall survival (OS) [5]. Functional MR was superior to current anatomic imaging and biochemical (alpha-fetoprotein (AFP) level) response criteria [5].
As common clinical liver functional imaging methods, diffusion-weighted (DW) magnetic resonance (MR) imaging and the apparent diffusion coefficients (ADC) have been introduced as biomarkers for assessing the early treatment effects of locoregional therapies in HCC with uniformly increasing ADC values during therapy onset, preceding anatomic size changes. However, to our knowledge, it remains to be determined whether baseline ADC can provide prognostic information for patients with HCC following chemoembolization. The present study aimed to investigate whether baseline ADC of HCC before treatment can be used to predict responses and validate the optimal cut-off value to predict overall survival in patients with HCC following chemoembolization.
Methods
Patients
The institutional Ethics Committee of the performing hospital approved this retrospective study. We retrospectively analyzed data from all patients who received chemoembolization as initial treatment for HCC in our hospital from January 2011 to December 2017. The inclusion criteria were as follows: (a) HCC proven histologically or diagnosed by noninvasive criteria [6], (b) initiation and follow-up treatment carried out in our hospital, (c) a baseline DW-MRI obtained before treatment, (d) a baseline contrast-enhanced computed tomography (CT)/MRI scan obtained before treatment and at least one contrast-enhanced CT/MRI scan obtained after treatment. The exclusion criteria were as follows: (a) lack of baseline DW-MRI; (b) secondary treatment with liver transplantation, surgical resection, or radical ablation; (c) patients with poor MR image quality (e.g., excessive motion artifacts, severe magnetic susceptibility artifact, low signal-to-noise ratio, etc.); (d) loss to follow-up; (e) no contrast-enhanced imaging before and/or after treatment.
DW-MRI
MRI was performed using a 1.5-T MRI scanner (GE Signa HD scanner or Siemens, Erlangen, Germany). All MRI examinations were performed before chemoembolization within 2 weeks. Images of the liver for all patients included (1) breath-hold fast spoiled gradient (FSPGR) echo T1-weighted sequence (TR/TE, 180/4.2 ms; flip angle, 85°; slice thickness, 7 mm; slice gap, 1 mm); (2) a breath-hold single-shot fast spin echo (SSFSE) sequence T2-weighted sequence (TR/TE, 2000/83.2 ms; slice thickness, 7 mm; slice gap, 1 mm); and (3) a breath-hold single-shot echo-planar technique axial diffusion-weighted imaging (DWI) (TR/TE, 1500/51.6 ms; section thickness, 5 mm; slice gap, 1 mm; number of acquisitions, 2; 166.67 kHz receiver bandwidth). Diffusion weighting was applied in all directions with b = 0 and 600 s/mm2. ADC maps were automatically calculated. ADC values for the largest measurable lesion were measured by a radiologist with 5 years of experience in abdominal imaging interpretation. The reader was blinded to the procedural outcome. Regions of interest circumscribing the entire lesion were drawn, and the mean and standard deviation of the lesion’s ADC value were recorded. After acquiring conventional MR images (including T1-weighted and T2-weighted imaging) and diffusion-weighted MR images, Gadolinium-contrast medium enhanced MR imaging were performed.
Treatment
Chemoembolization was performed according to the following protocol: A selective 5-F catheter was introduced, and visceral angiography was carried out to assess the arterial blood supply to the liver and to confirm patency of the portal vein. According to tumor location and tumor size, a distal, super-selective catheterization of the hepatic arteries was probed using a coaxial technique and microcatheters (2.8 F; Terumo Corporation, Tokyo, Japan). Hepatic artery infusion chemotherapy was performed using cisplatin 60 mg and Floxuridine 1,000 mg. Next, chemoembolization was performed using drugs that were mixed with a 2:1 ratio of epirubicin 60 mg and nonionic contrast material (6–30 mL) to lipiodol (3–25 mL), the dose of which depended on the tumor size.
Assessment of initial treatment responses
Pretreatment contrast-enhanced MRI was performed within 2 weeks prior to the first course of chemoembolization, and posttreatment contrast-enhanced liver MRI or CT after two courses of chemoembolization was performed 4–6 weeks after the start of the second course of chemoembolization. Tumor response was assessed by comparing pretreatment and posttreatment contrast-enhanced images using mRECIST guidelines.
Follow-up and further treatment
After chemoembolization and assessment of the initial response to treatment, all patients were evaluated monthly. When there were local recurrence or distant recurrence, alternative therapeutic approaches were performed according to tumor stage, liver function reserve, and the wishes and general condition of the patients.
Statistical analysis
Independent sample t-tests for the data with a normal distribution or the non-parametric Mann–Whitney U test for the data without the assumption of a normal distribution were used to detect significant differences in the pre-ADC between the responders and non-responders.
Receiver operating characteristic (ROC) curve analysis was performed to evaluate the diagnostic performance of the baseline ADC to predict the response to treatment and determine the optimal cut-off values. The optimal cut-off value was defined as the point that yielded the best sensitivity and specificity based on the Youden index for the differentiation.
Survival data were calculated from the time of the first chemoembolization to the date of death or the time of analysis (December 2019). Cox regression and Kaplan–Meier survival analyses were used to explore the differences in overall survival (OS) between the responders and non-responders, according to mRECIST and the baseline ADC criteria. The Cox proportional model was employed to estimate the hazard ratio (HR) of each category compared to the non-responders in each method, respectively. P < 0.05 was considered statistically significant. SPSS software version 22.0 (IBM, Armonk, NY, USA) was used to perform the statistical analyses.
Results
Patient baseline characteristics
Between January 2011 and December 2017, a total of 123 HCC patients underwent chemoembolization as initial treatment. Of these, 37 patients were excluded because of receiving secondary surgical resection (n = 16), liver transplantation (n = 2), and radical thermal ablation treatment (n = 19); 12 patients were excluded because of no DW-MRI scans before treatment (n = 10) and insufficient image quality caused by motion and susceptibility artifacts (n = 2); four patients were excluded because of loss to follow-up. Thus, a cohort of 70 patients (53 men and 17 women, mean age 55.5±11.3 years) met all of the inclusion criteria and none of the exclusion criteria (Fig. 1). The patients’ detailed characteristics are summarized in Table 1.
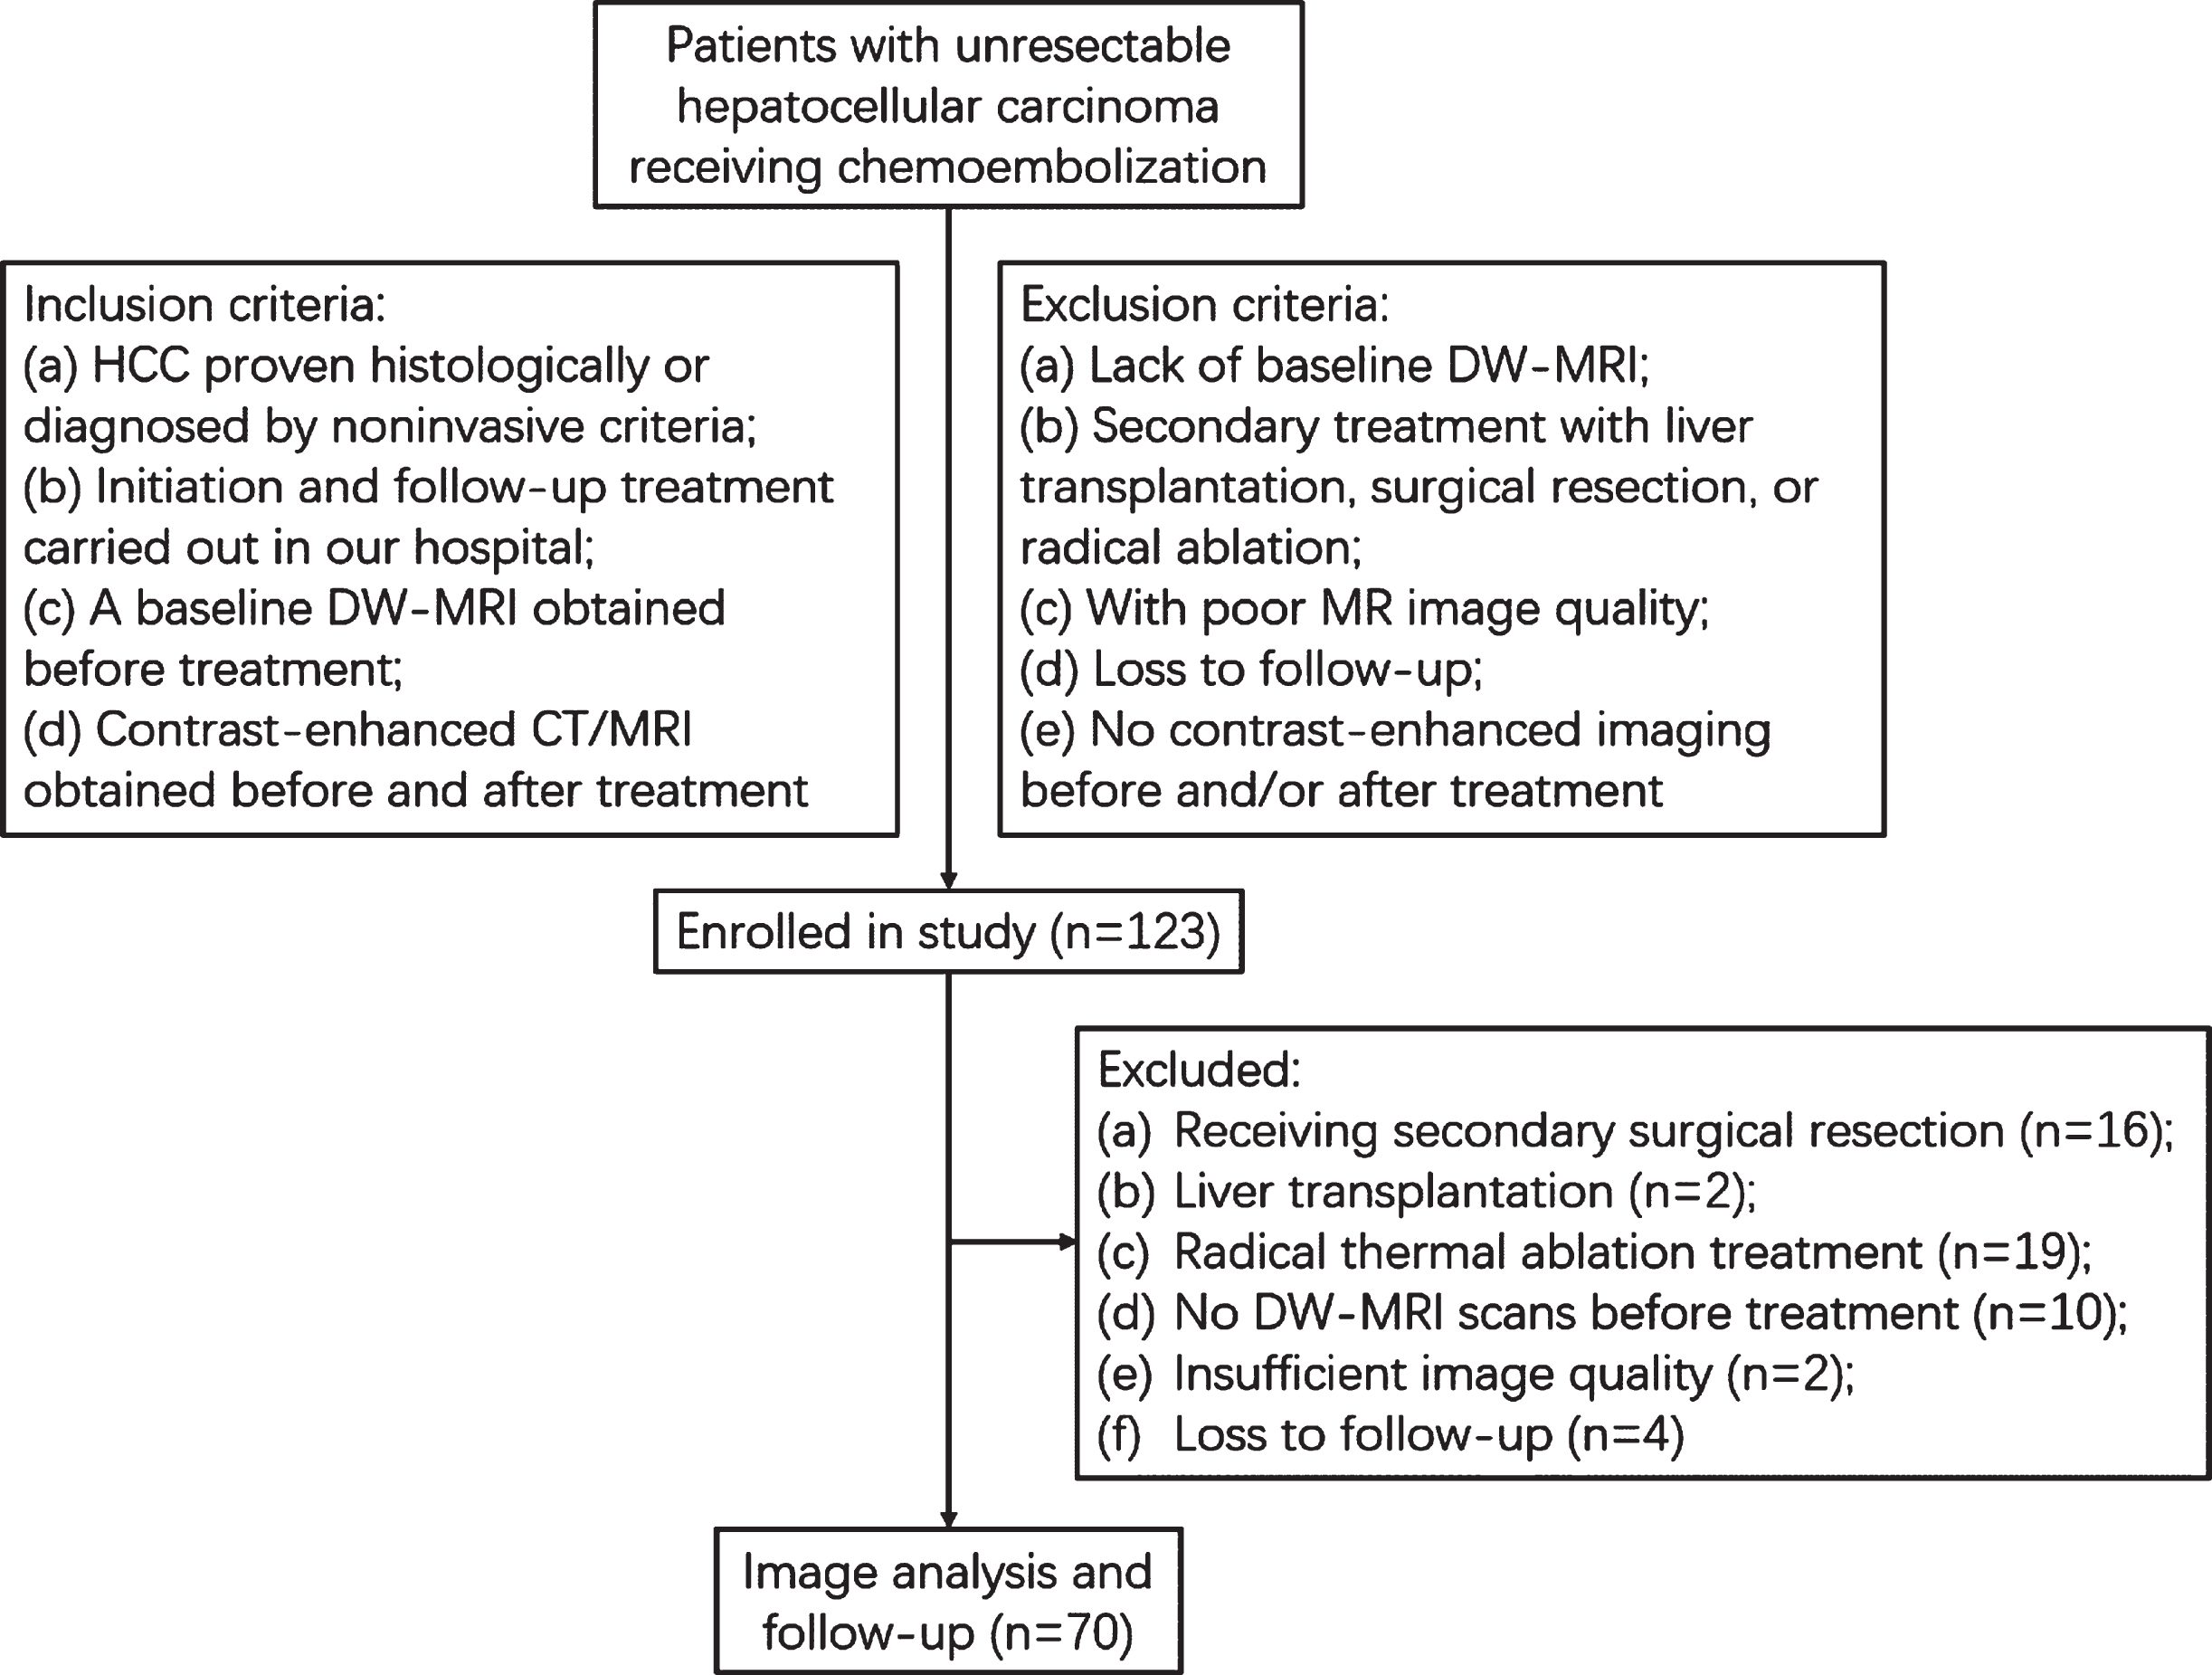
Flowchart of the patient selection process.
Patient demographic and tumor characteristics
NOTE: Values are expressed as median (range) or number (%) unless indicated otherwise. AFP: alpha-fetoprotein; ADC: apparent diffusion coefficient.
Evaluated by mRECIST target lesions response criteria, 46 patients (65.7%) with PR were considered responders, and the others (24/70, 34.3%) were categorized as non-responders; In the responders, the mean baseline ADC value of the largest lesion was 1.21±0.135×10⁻³ mm2/s, and the mean baseline ADC value of the largest lesion was 1.26±0.115×10⁻³ mm2/s in the non-responders. There was no statistically significant difference (t-test, P = 0.142).
Evaluated by mRECIST overall response criteria, 45.7% (n = 32) of patients were categorized as responders, and 54.3% (n = 38) of patients were considered non-responders. In the responders, the mean baseline ADC value of the largest lesion was 1.16±0.095×10⁻³ mm2/s, and the mean baseline ADC value of the largest lesion was 1.28±0.133×10⁻³ mm2/s in the non-responders. The difference was statistically significant (Mann–Whitney U test, P < 0.001).
The result of ROC analysis showed that the baseline ADC can be used to predict the response to treatment, with an area under the ROC curve (AUC) of 0.744 (95% CI: 0.613, 0.857, P < 0.001). Using the optimal cut-off value of ≤1.22×10⁻³ mm2/s, the diagnostic sensitivity was 78.1%, the specificity was 60.5%, and the Youden index was 0.386.
Association with survival
The overall cumulative survival rates at 1, 2, and 5 years were 88.6%, 45.7%, and 2.86%, respectively. The median survival for the responders and non-responders for each evaluation method were calculated by the Kaplan–Meier method and appear in Table 2 and Fig. 2. The association between each evaluation method and OS was determined by Cox regression, and the statistical difference was determined (Table 2). A significant reduction in OS was observed between the responders and non-responders for mRECIST target response, overall response, and the baseline ADC criteria. The reduction in risk compared with non-responders for mRECIST target responders, overall responders, and baseline ADC criteria were 59.5%, 74.9%, and 57.2%, respectively.
Kaplan–Meier survival and the Cox regression of responders and nonresponders, according to the mRECIST and pre-ADC criteria, respectively
Kaplan–Meier survival and the Cox regression of responders and nonresponders, according to the mRECIST and pre-ADC criteria, respectively
OS: overall survival; CI: confidence interval; mRECIST: modified Response Evaluation Criteria in Solid Tumors; HR: hazard ratio; ADC: apparent diffusion coefficient.
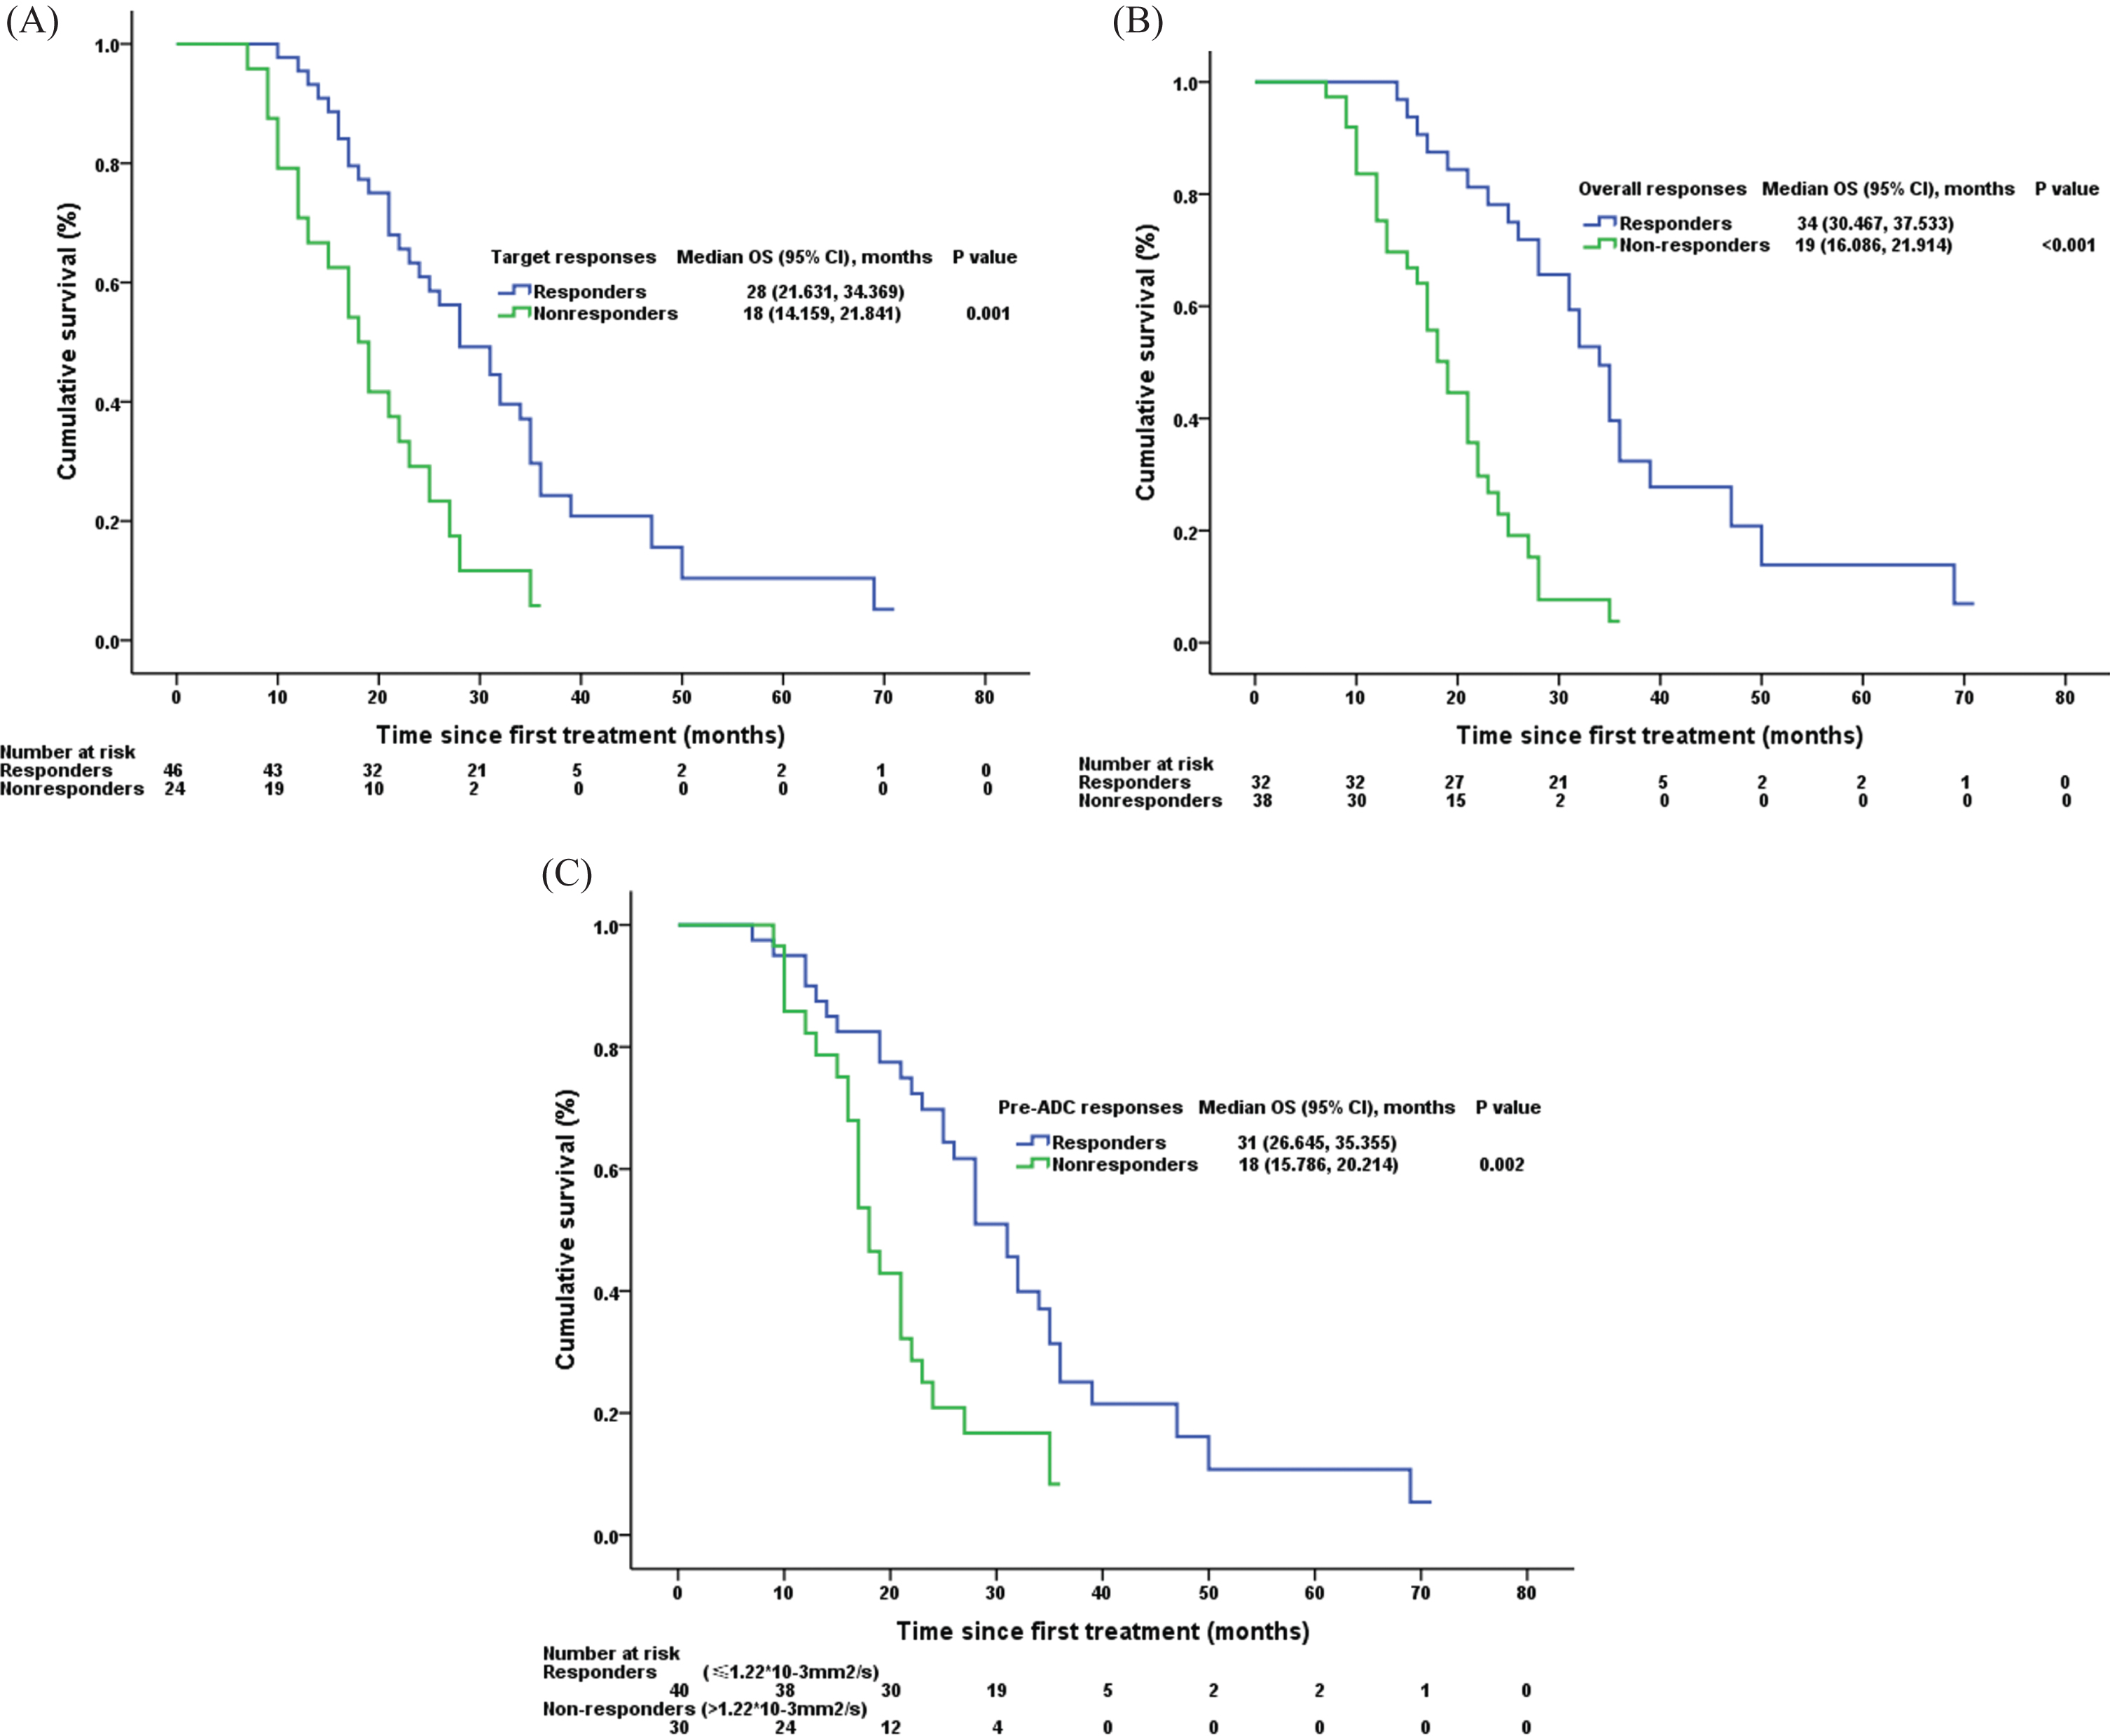
Kaplan-Meier curves show comparison of overall survival between the responders (complete and partial response, blue curve) and non-responders (stable and progressive disease, green curve) at 4–6 weeks after the start of second course of chemoembolization imaging as assessed by means of (A) mRECIST target response criteria, (B) mRECIST overall response criteria, and (C) the baseline ADC value response criteria. P values are provided in the figures.
Finally, univariate analysis confirmed the following as significant prognosticators of survival (Table 3): age and tumor distribution. Using these factors, we applied backward selection to construct three multivariate models. The first model examined the association of the mRECIST target response with survival, the second examined the association of mRECIST overall response with survival, and the third examined the association of pre-ADC response with survival (Table 4). mRECIST overall response and baseline ADC response were independent risk factors for survival. mRECIST overall responders had a 64.4% reduction in risk compared with non-responders, and baseline ADC responders had a 54.3% reduction in risk.
Univariate analysis carried out to determine the association between survival and clinical characteristics
OS: overall survival; CI: confidence interval; HR: hazard ratio; AFP: alpha-fetoprotein.
Multivariate models constructed to determine whether mRECIST target, overall responses, and pre-ADC response were associated independently with survival
OS: overall survival; CI: confidence interval; mRECIST: modified Response Evaluation Criteria in Solid Tumors; HR: hazard ratio; ADC: apparent diffusion coefficient.
As one of the common functional imaging techniques in clinical practice, DWI and its ADC have been reported as early predictors of response to therapy and an independent predictor of progression-free survival (PFS) in patients with HCC who underwent chemoembolization [5]. In this retrospective study, the baseline ADC of HCC was an independent predictor of overall survival of HCC patients who underwent chemoembolization.
Several researchers had investigated the role of the pretreatment ADC value in predicting the response to chemoembolization with varying results [7–13]. Three of these studies have shown that tumors with lower baseline ADC values were more favorable to treatment response than those with higher ADC values [7–9]. No significant difference in the baseline ADC value was observed between the responders and non-responders assessed by the mRECIST target response criteria. A significant lower baseline ADC value was found in the overall responders compared to the overall non-responders. The current study is consistent with the abovementioned studies, although several studies with inverse results showed that low ADC correlates with poorer treatment response [10] and an independent predictor of poorer immediate odds ratio (OR) and index lesion–specific PFS in HCC patients [11]. Other studies found no correlation between pretreatment ADC values and treatment outcomes [12, 13].
In this study, the median OS of the responders was longer than that of the non-responders evaluated by mRECIST target response criteria, mRECIST overall response criteria, and the baseline ADC criteria. The Kaplan–Meier analysis results showed that the difference of OS between the responders and non-responders evaluated by each criterion were statistically significant. The Cox regression analysis results showed that the reduction of risk of the baseline ADC responders, the mRECIST target responders, and the mRECIST overall responders compared to the non-responders were 57.2%, 59.5%, and 74.9%, respectively. In addition, the results of the multivariate analysis of the association between OS and each response criterion demonstrated that the baseline ADC and mRECIST overall response criteria were independent prognostic factors. This result is consistent with Kokabi’s [7] and Dong’s [8] studies.
The potential underlying biologic mechanism of lower baseline ADC value as a predictor of response to chemoembolization can be postulated. First, a lower baseline ADC value of non-necrotic HCC tissue has been shown to correlate with the nature of higher cellularity and cell division rate, resulting in increasing susceptibility to anticancer agents [14]. Conversely, a higher baseline ADC value of non-necrotic HCC tissue is associated with lower levels of baseline cellularity, which has been linked with less responsiveness to ischemic and chemotherapeutic actions [15]. Second, it is well-known that the calculation of the ADC, using the mono-exponential model, is prone to influence by the microcirculation of blood. It is postulated that HCC with a high degree of vascularity has lower ADC value, making it a more ideal target for intra-arterial therapy. Third, a higher baseline ADC value of HCC tissue is also associated with a higher degree of tumor necrosis and loss of cell membrane integrity. The presence of these changes before treatment might indicate a more aggressive tumor phenotype. The effectiveness of chemoembolization is incomplete because it is not only poorly perfused, but also because it works in an acidic and hypoxic environment, diminishing the effectiveness of chemotherapy in tumors with necrosis [16]. In Niekamp’s study, the low baseline ADC value was an independent survival predictor in patients with HCC undergoing chemoembolization or radioembolization, but correlated with poorer outcomes [11]. These authors hypothesized that ADC values calculated from DW-MRI were inversely correlated with the tumor’s micro-environmental property of tumor interstitial pressure (TIP) [17]. Elevated TIP is a fundamental barrier to cancer therapy [18]. The concept of ADC maps as a surrogate for TIP provides a biological rationale for this study’s findings that low tumoral ADC is associated with worse immediate OR and PFS. In fact, the HCC response to locoregional chemoembolization by intra-arterial therapy generally depends more on the cellularity, cell division rate, and the degree of vascularity than on tumor interstitial pressure.
There are several limitations in this study. First, because it is a retrospective study, we only analyzed the baseline ADC value that affected the overall cumulative survival. It needs further study to determine whether the change of ADC values between baseline and post-treatment may yield much higher prediction performance (AUC values). Second, we only computed ADC values for the largest measurable lesion in patients (30/70, 42.9%) with multifocal HCC distribution in this study. In further study, we also can compare the prognostic values by pre-treatment ADC value according to number of target lesions (assessing the longest 1, 2, 3, 4, 5, and all targets) for predicting OS of patients with HCC. Finally, the current study results have not been seen consistently in previously published reports [11, 19–21]. The potential, underlying biological mechanism is postulated and there is no histologic confirmation of tumor cell microstructure with higher or lower baseline ADC value.
In summary, this study shows that a baseline ADC value of ≤1.22×10⁻³ mm2/s is a functional imaging biomarker that predicts tumor response and prolonged survival in hepatocellular cancer patients treated with chemoembolization. The present study revealed that DWI, as a functional imaging technique, has the potential to help guide clinical decisions regarding the most appropriate treatment choice.