
Abstract
OBJECTIVE:
In order to solve the blurred structural details and over-smoothing effects in sparse representation dictionary learning reconstruction algorithm, this study aims to test sparse angle CT reconstruction with weighted dictionary learning algorithm based on adaptive Group-Sparsity Regularization (AGSR-SART).
METHODS:
First, a new similarity measure is defined in which Covariance is introduced into Euclidean distance, Non-local image patches are adaptively divided into groups of different sizes as the basic unit of sparse representation. Second, the weight factor of the regular constraint terms is designed through the residuals represented by the dictionary, so that the algorithm takes different smoothing effects on different regions of the image during the iterative process. The sparse reconstructed image is modified according to the difference between the estimated value and the intermediate image. Last, The SBI (Split Bregman Iteration) iterative algorithm is used to solve the objective function. An abdominal image, a pelvic image and a thoracic image are employed to evaluate performance of the proposed method.
RESULTS:
In terms of quantitative evaluations, experimental results show that new algorithm yields PSNR of 48.20, the maximum SSIM of 99.06% and the minimum MAE of 0.0028.
CONCLUSIONS:
This study demonstrates that new algorithm can better preserve structural details in reconstructed CT images. It eliminates the effect of excessive smoothing in sparse angle reconstruction, enhances the sparseness and non-local self-similarity of the image, and thus it is superior to several existing reconstruction algorithms.
Introduction
Computed Tomography (CT) is important for clinical detection and radiation therapy in modern medicine. It uses X-rays to illuminate an object at multiple angles to obtain projection data, and then reconstructs the tomographic image of the object using a specific mathematical method [1]. CT images can clearly show the structural characteristics and pathological changes of human organs, and provide a scientific basis for the correct diagnosis of the disease [2]. It is widely used in the diagnosis and treatment of clinical diseases.
However, in the tumor examination and radiotherapy plan, CT scan is often needed many times, and the human body inevitably receives X-ray irradiation. However, excessive X-ray exposure will greatly increase the incidence of malignant tumors, hereditary diseases and leukemia [3, 4]. In recent years, with the development of radiography, low dose CT image reconstruction has received more attention.
Reducing the radiation dose of patients in CT examination has become a key issue to be solved in the current CT imaging field [5, 6]. At present, there are two commonly used methods to reduce the dose of CT radiation. First, it reduces the exposure dose of each scanning angle by reducing the tube voltage or tube current. However, reducing the tube voltage will reduce the X-ray penetration, can result in beam hardening artifacts in reconstructed images. Reducing the tube current will increase the photon noise in the projection data, can result in obvious noise patches in the reconstructed image. Second, sparse angle projection is used to increase the scanning interval to reduce the number of projections, a small amount of projection data is used to achieve image reconstruction. But sparse angle CT reconstruction does not satisfy Nyquist sampling theorem. Although this under sampling scanning method will degrade the quality of reconstructed image, it can effectively shorten the exposure time of X-ray tube and greatly reduce the dose of CT radiation. Therefore, it is very important for clinical treatment and patient health to carry out research on sparse angle image reconstruction in low-dose CT imaging.
Sparse angle projection can reduce CT radiation dose effectively. However, due to the lack of a large number of projection data, traditional analytical algorithms such as filtered back-projection (FBP) algorithms will cause significant artifacts and excessive noise in the reconstructed image [7]. Many iterative algorithms [8] can overcome the problem of incomplete data in tomography which leads to poor reconstruction image quality. For example, the simultaneous algebra reconstruction technique (SART) algorithm [9] has achieved good reconstruction results, but still has large image noise, unclear structure, geometric artifacts and other issues. Therefore, it is necessary to add some prior information of the image to be reconstructed as a regularization term during the iteration process to reduce the solution space and improve the reconstruction quality [10].
Compressed sensing (CS) theory has proved in 2006 that the original signal can be accurately reconstructed using measurement data which far below the Nyquist sampling frequency [11]. Sidky et al. proposed a sparse angle CT image reconstruction algorithm based on convex set projection, called TV-POCS algorithm [12]. The reconstructed CT image quality using TV-POCS algorithm has been greatly improved, but the effects of over-smoothness and blocky steps often appear [13].
At present, dictionary learning (DL) based methods have attracted much attention. Compared with traditional pixel-by-pixel processing technology, the dictionary-based method uses block-by-block processing. In this method, the CT image to be reconstructed is decomposed into overlapping image patches, which can be represented sparsely by an over-complete dictionary (a matrix whose number of columns is far greater than the number of rows, and each column is called the atom of this dictionary). Compared with TV sparse transform, dictionary learning based sparse representation can keep more fine structures while suppressing noise. A Low-Dose X-ray CT Reconstruction via Dictionary Learning algorithm was proposed by Xu et al. [14], which uses sparse representation as a constraint for dictionary learning. Shen Y et al. [15]. proposed a dictionary learning algorithm based on compressed sensing theory. Zha Z et al. [16]. introduced adaptive sparse non-local regularization into image reconstruction. However, there are two limitations in the traditional sparse representation based on image patches. First, dictionary learning is a very complex nondeterministic polynomial problem, which usually requires high computational complexity. Second, in dictionary learning and sparse coding, each image patch is usually considered separately, which ignores the self-similarity and essential relations between similar patches and results in inaccurate sparse coding.
In order to optimize the traditional dictionary learning reconstruction algorithm, Zhang et al. uses a set of similar non-local image patches in the search window as the basic unit of sparse representation, and established a new sparse representation model of natural image, called Group-Sparsity Regularization (GSR) [17]. Peng Bao et al. [18] introduced this model into sparse angle CT image reconstruction, and obtained high-quality reconstruction image. Mo J et al. [19] introduced SSIM into the concept of adaptive Group-Based Sparse Representation Modelling and achieved good results in image restoration. Peng Bao et al. [20] added convolutional sparse coding (CSC) into dictionary learning and used gradient regularization constraints to reconstruct images. Adelman Z, et al. [21] uses the existing baseline scan data, a user-defined ROI, and a new sparse repeat scan to compute a high-quality repeat scan ROI image with a significantly reduced radiation dose. Chen Z, et al. [22] used attenuation coefficients of the object to be reconstructed and prior information application in the forward-projection process to reconstruct CT images from sparse-view projection data.
However, most of the existing image reconstruction algorithms with group-sparsity regularization achieve the better reconstruction effect by setting the size of the fixed similar group. In addition, they use regular constraints to suppress noise and introduce the same smoothing effect into the low contrast information region of the image. This kind of over-smoothing effect reduces the spatial resolution of the image and loses the detail information of the image.
Inspired by the research on group sparse regularization [17–22], A sparse angle CT reconstruction with weighted dictionary learning algorithm based on adaptive Group-Sparsity Regularization is proposed in this paper. This method not only uses Euclidean distance to measure the structural difference between two image patches, but also introduces the covariance into the similarity calculation formula, so as to select more similar image patches groups as the basic unit of sparse representation. The constraint weight of the regular term of this method for each image patches is no longer all 1, but the residual error of the image patches and its dictionary sparse representation is introduced into the calculation formula in the algorithm model, so as to apply different smoothing effects to different regions and improve the spatial resolution and imaging quality of the reconstructed image.
Materials and methods
CT imaging model
The mathematical model of CT imaging can be expressed as a discrete linear system as:
Among them, b denotes the measured projection data, can be written as: b = [b1, b2, b3, . . . , b
M
], x is the image to be reconstructed, can be written as x = [x1, x2, x3, . . . x
N
] A is a system matrix, which contains M×N elements. When system matrix A and projection data b are known, image x can be solved by iterative algorithm. Due to the noise in b, the solution of equation (1) is generally converted to minimize the following objective function by iterative algorithm:
In SART algorithm, the correction value of each pixel is the average of all ray correction values passing through the pixel in the same projection angle. Its essence is to smooth the noise, which enables SART algorithm to better suppress the band artifacts and get a smoother reconstructed image compared with ART. The image update formula is:
Where ω is a relaxation factor, which is used to control the convergence speed. j is the number of the pixel, and i is the number of the ray. A ij is the length of the line segment that the j-th pixel is penetrated by the i-th ray. k represents the number of iterations.
However, solving x directly from the projection data b is a NP-hard problem, which will cause the reconstructed image to contain noise. Therefore, it is necessary to further combine the constraint terms of the known prior information to improve the image quality.
Sparse representation (SR) uses a large amount of redundant information in digital images to sparsely represent the redundant information through a complete dictionary. Using the Lagrange method, the SR model can be expressed as:
where x denotes a image to be reconstructed, D denotes dictionary, α is the sparse representation of image patch based on dictionary D. | · |0 is used to calculate the non-zero number of vectors. λ is the regular term parameter. SR uses a trained dictionary D to seek a sparse vector α that can accurately represent x. That is, under the constraint of l0 norm, the sparse coefficient matrix α has the smallest target error function. Depending on the strategy of dictionary update, some classic algorithms are proposed, such as MOD, K-SVD.
However, the traditional sparse representation image reconstruction algorithm divides the image into small patches that overlap each other and encodes based on a single image patch. It does not fully consider the non-local relationship between different image patches. Therefore, the GSR is proposed, and the non-local similarity constraint is introduced into SR.
Considering the local sparseness and non-local self-similarity of natural images, the unit of sparse representation in this paper is the group structure. Each group is composed of a matrix of image blocks with similar structural textures. As shown in Fig. 1.
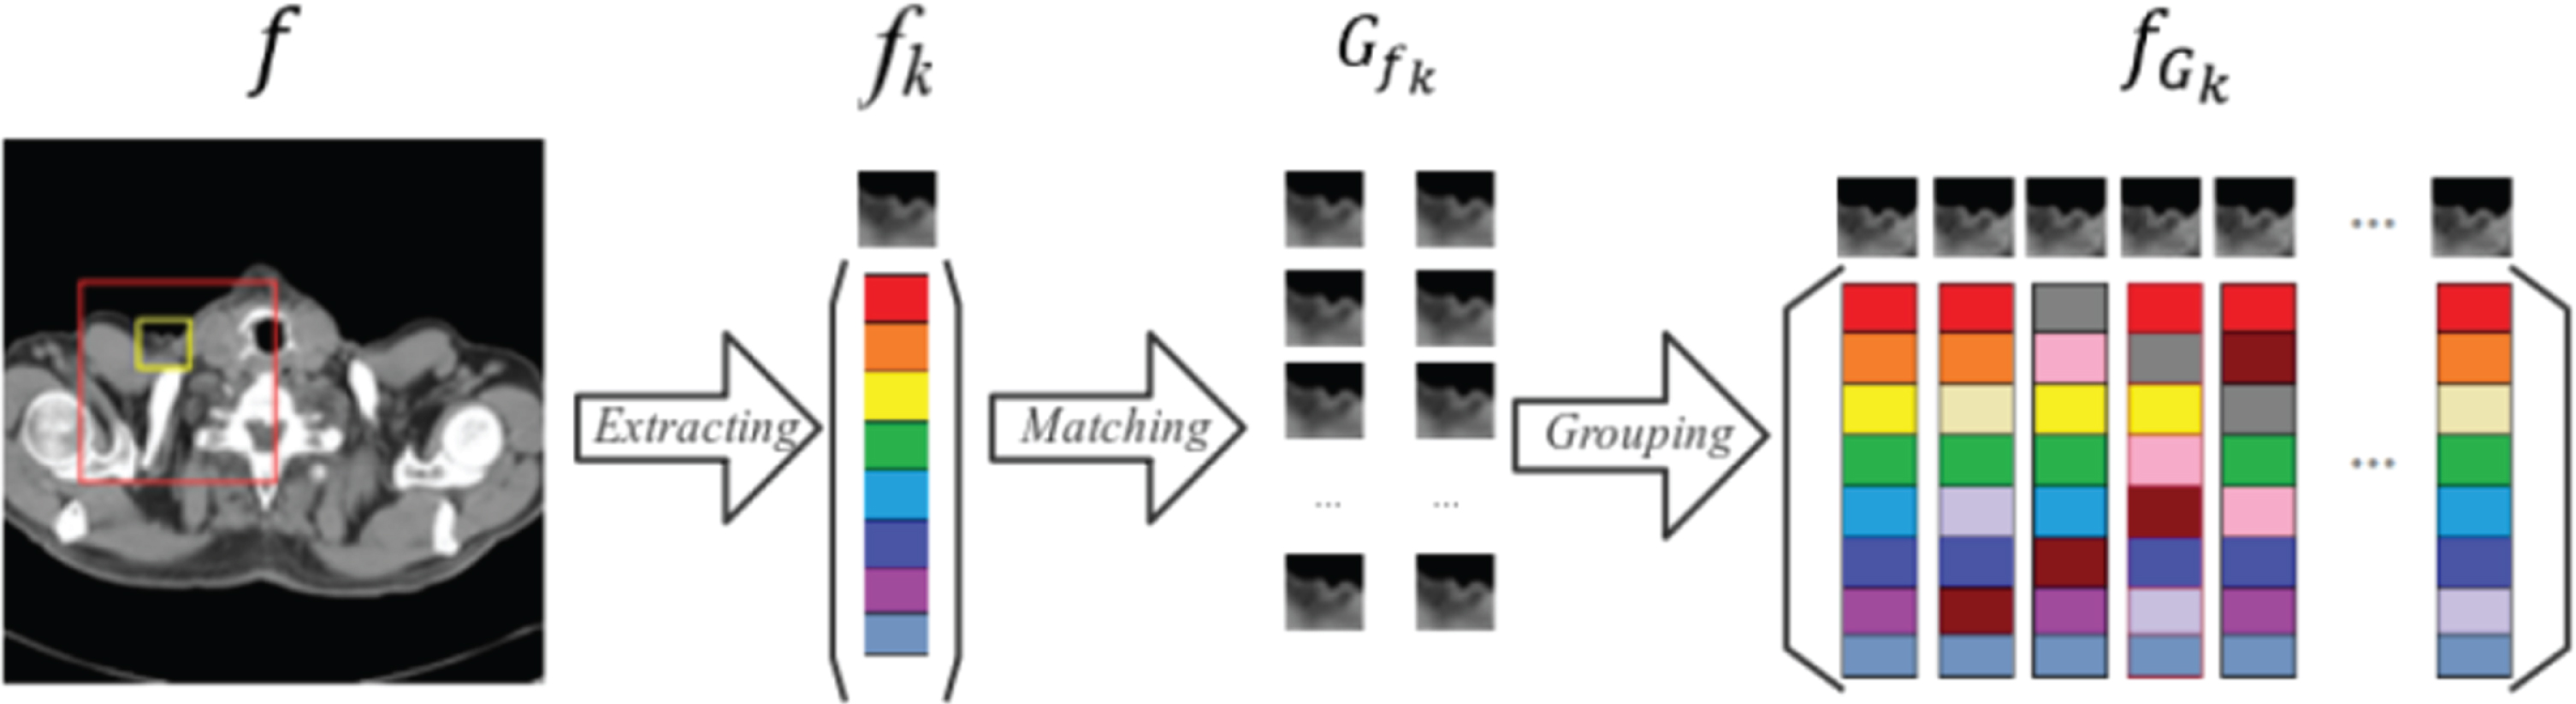
Group sparse representation model. f k represents an image patch extracted from the image f. G fk represents the matrix consisting of the most similar f k in the search window, fGk, is a group formed by expanding the G fk into a vector.
Among them, f represents the image to be reconstructed, the yellow square in Fig. 1 represents the image patch f k at position k, k = 1,2,3... n. In the search window of size L×L shown in the red square, select m image patches that are the smallest Euclidean distance with f k to form a set G f k . Then, all the patches in G f k are unfolded into vectors and arranged into a matrix of size Ps×m, denoted by f G k . Matrix f G k is treated as a group of similar patches. Based on the dictionary learning of each f G k , the dictionary of the image patch matrix can be obtained and the sparse vector can be solved.
In the dictionary learning reconstruction algorithm with Group sparse representation, we divide the image f into n aliased image patches of size
where
Then, SVD decomposition is performed on the estimated value e of each group f
G
k
to obtain the adaptive dictionary D
Gk
:
where β
Gk
={ βeGk*1, βeGk*2, . . . , βeGk*c }, ∑
Gk
= diag (β
eGk
) is a semi-definite positive diagonal matrices. UGk*i denotes the columns of U
Gk
, and
Next, the GSR model seeks a sparse vector α
Gk
={ αGk*1, αGk*2, . . . , αGk*c }, f
G
k
can be expressed by a dictionary D
Gk
as:
The entire image f can be solved by the following formula:
GSR-SART reconstruction algorithm consists of two independent steps. First, it uses the SART algorithm to solve the Equation (1) and an intermediate image u is reconstructed. Second, take u as the initial value and use GSR model to regularize it, so as to eliminate the edge effect and strip artifacts caused by insufficient projection data.
By calling the SVD method on the estimated value e of f, an adaptive dictionary DG can be obtained by:
Among them, the solution of e is shown in Equations (6) –(7). Since solving Equation (10) directly is an NP problem. Therefore, call SBI algorithm. The steps are:
By setting the right end of Equation (11) to zero, we can get the approximate solution.
where E is an identity matrix. When f is known, α
G
can be calculated using:
Because the GSR-SART reconstruction algorithm uses a fixed size m of similar groups and selects the same number of similar groups for different texture and structural areas of the image, it is not conducive to obtain the overall optimal reconstruction effect. In this paper, the group-sparsity regularization (GSR) is improved and the adaptive group-sparsity regularization (AGSR) is proposed. In addition, the GSR-SART algorithm uses regular constraints to suppress noise, and it also introduces the same smoothing effect in the low contrast information region of the image. This kind of over-smoothing effect reduces the spatial resolution of the image and loses the detail information of the image. This paper introduces a weighting factor based on the residuals into the formula (14) in the above framework. The image after sparse reconstruction is modified to speed up the convergence.
Adaptive group
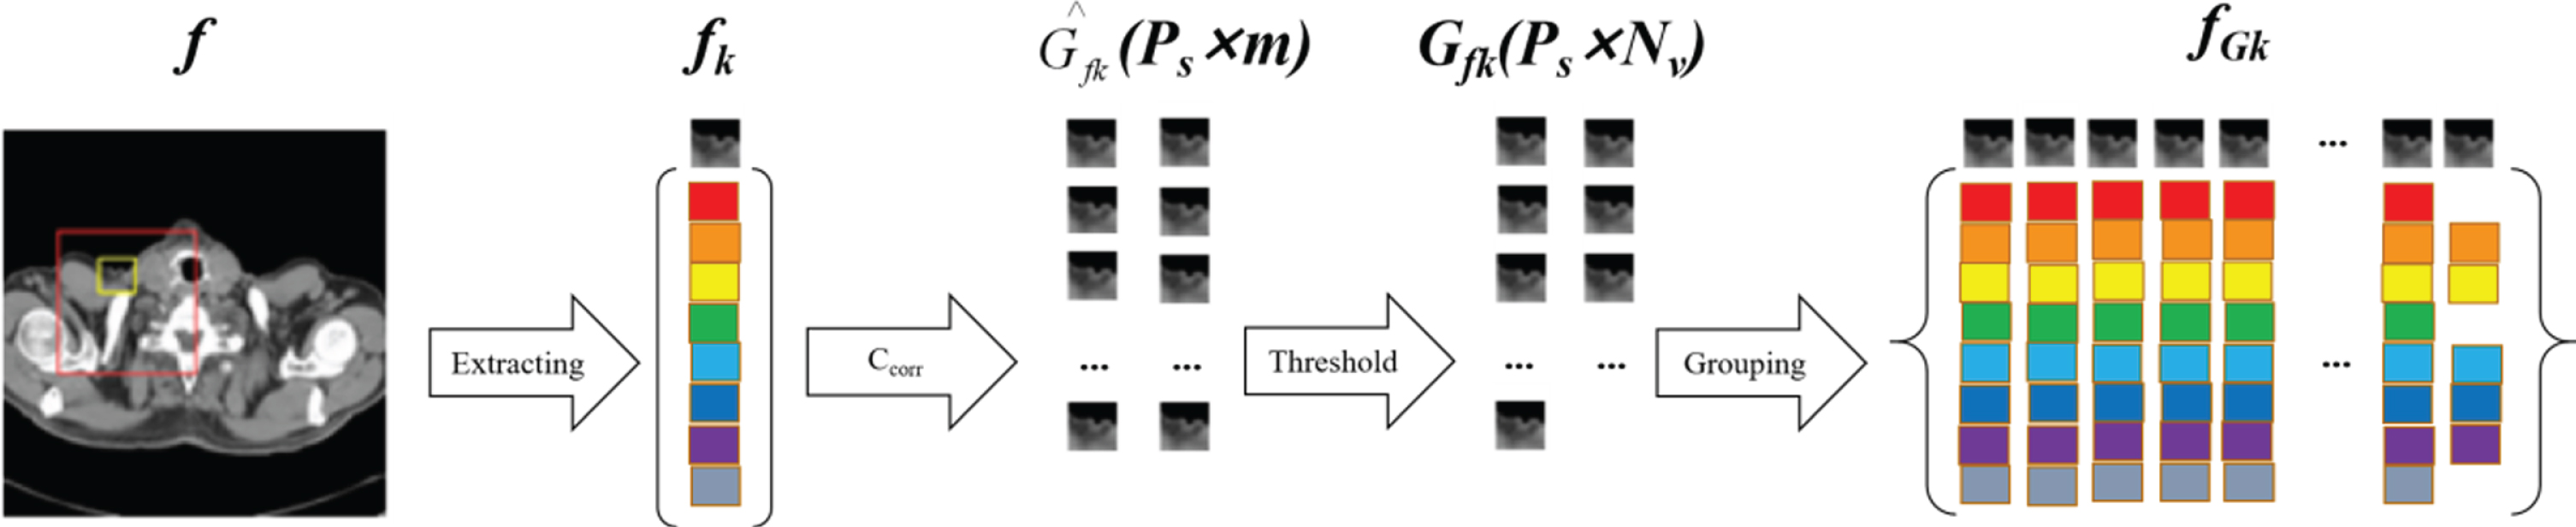
In general, in a CT image, different image regions contain different image details. The texture area has a complex structure and contains more redundant information. The smooth area structure is relatively simple. Therefore, for the image patch fk in Fig. 3, if it is located in the texture area, the image patch contains more similar image patches in the search window. If it is in a smooth area, the image patch may only contain few similar image patches in the search window. In the traditional group sparse representation model, when it constructing an image patch matrix f G k , the number of similar image patches in the selected structural group G f k is fixed m. For image areas with different structures and textures, it is easy to introduce error information. Therefore, the number of similar patches in the structural group should be adaptively selected for different regions. This paper improves the group-sparsity regularization (GSR) model in the above framework and proposes an adaptive group-sparsity regularization model (AGSR).
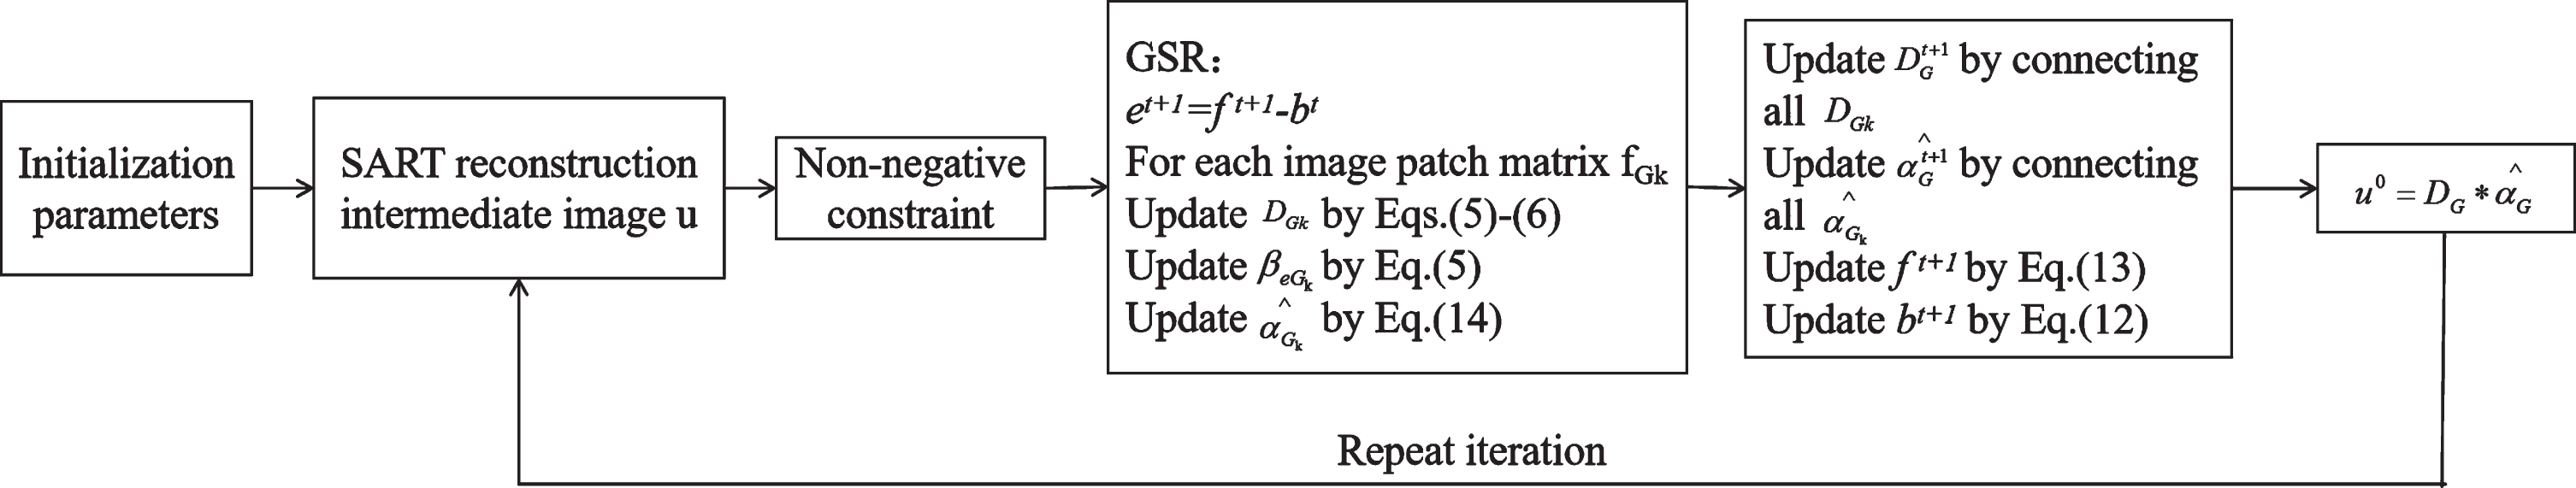
GSR-SART reconstruction algorithm framework.
Adaptive group-sparsity regularization (AGSR).
In addition, the traditional group sparse representation model uses the Euclidean distance to select the group of most similar patches. It only considers the gray value of the image blocks. Therefore, a new similarity measurement method is established in this paper based on the correlation of the image patches. The covariance between image patches is introduced into the similarity calculation between the current image patch f
k
and the search image patch
Among them,
To control computational complexity, the selection rules for the number of adaptive similar patches are as follows: First, calculate the Ccorr between the current image patches and all neighboring image patches in the search window, arrange them in descending order, and select the first m similar image patches. Then, the similar image patches with Ccorr less than the threshold (ɛ = 1) in the similar image patches are removed, and the number of NV similar image patches is finally obtained. These similar image blocks form a set of adaptive groups G f k . Then, all image patches in the adaptive group G f k are expanded into vectors, it form a matrix f G k , which size is Ps×NV, participating in dictionary update and sparse vector calculation.
In the formula (10), for different image patches, the weights of the regular constraint terms are the same, so the smoothing effect of the image on the different regions during the iterative update process is also the same. It cannot retain the image details information effectively while suppressing the noise. In order to effectively suppress the noise while retaining the details of the CT image, a weighting factor is chosen to give different smoothing effect according to the amount of edge detail information contained in the image patch. The more detailed information the image patch contains, the smaller the weighting factor is.
Since the residual between the reconstructed image and its group-sparsity regularization of the dictionary can indirectly reflect the amount of detailed information, the larger the residual is, the more detailed information the image patch contains. Therefore, in this paper, the inverse proportional function of the residual of the previous iteration is selected to be multiplied by the residual of the result of this iteration. As the weight factor for this iteration, the calculation expression is:
Where a is the sum of the residuals of sparse represented by the dictionary. a is a balance parameter, and its role is to make the currently calculated weight factor not affect the value of the regularization parameter λ in the objective function, The role of eps is to prevent the denominator from being zero. t is the number of iterations. Before each iteration, the weighting factor is automatically updated according to the results of the two iterations. Image patches with more detailed information tend to get a smaller weight, so that the low-contrast information of the image is better retained. Due to the addition of weighting factors, Eq. (10) changes as follows:
By calling SVD decomposition on the estimated value e, a dictionary DG can be obtained. Thus, Equation (18) translates into:
Then, according to SBI algorithm,
Formula (12) is changed to:
Formula (13) is changed to:
By setting the right end of Equation (20) to zero, we can get the solution for f as:
Where E is the identity matrix, the α G sub-problems is the same as the GSR-SART algorithm.
Due to the introduction of adaptive groups, the complexity of the algorithm is greatly increased. In order to speed up the convergence speed, this paper by reducing the difference between the estimated value and the intermediate image, the iterative image is optimized to accelerate the convergence speed. After each dictionary update is completed, the image is modified as follows:
Among them, f represents the reconstructed image, u represents the SART algorithm to reconstruct the intermediate image, and the initial value of t1 is set to 0.
The AGSR-SART algorithm proposed in this paper is mainly composed of two steps: (1) First, the SART algorithm is used to reconstruct the intermediate image u that meets the data consistency requirements and non-negatively corrects it. (2) The adaptive group-sparsity regularization (AGSR) is introduced into CT reconstruction, the SVD decomposition algorithm is used to update the sparse representation α, the residual-based weighted dictionary learning method is used to optimize the image, finally the dictionary is modified, and it is repeated until the iteration termination condition is meet. The algorithm flowchart is shown in Fig. 4.
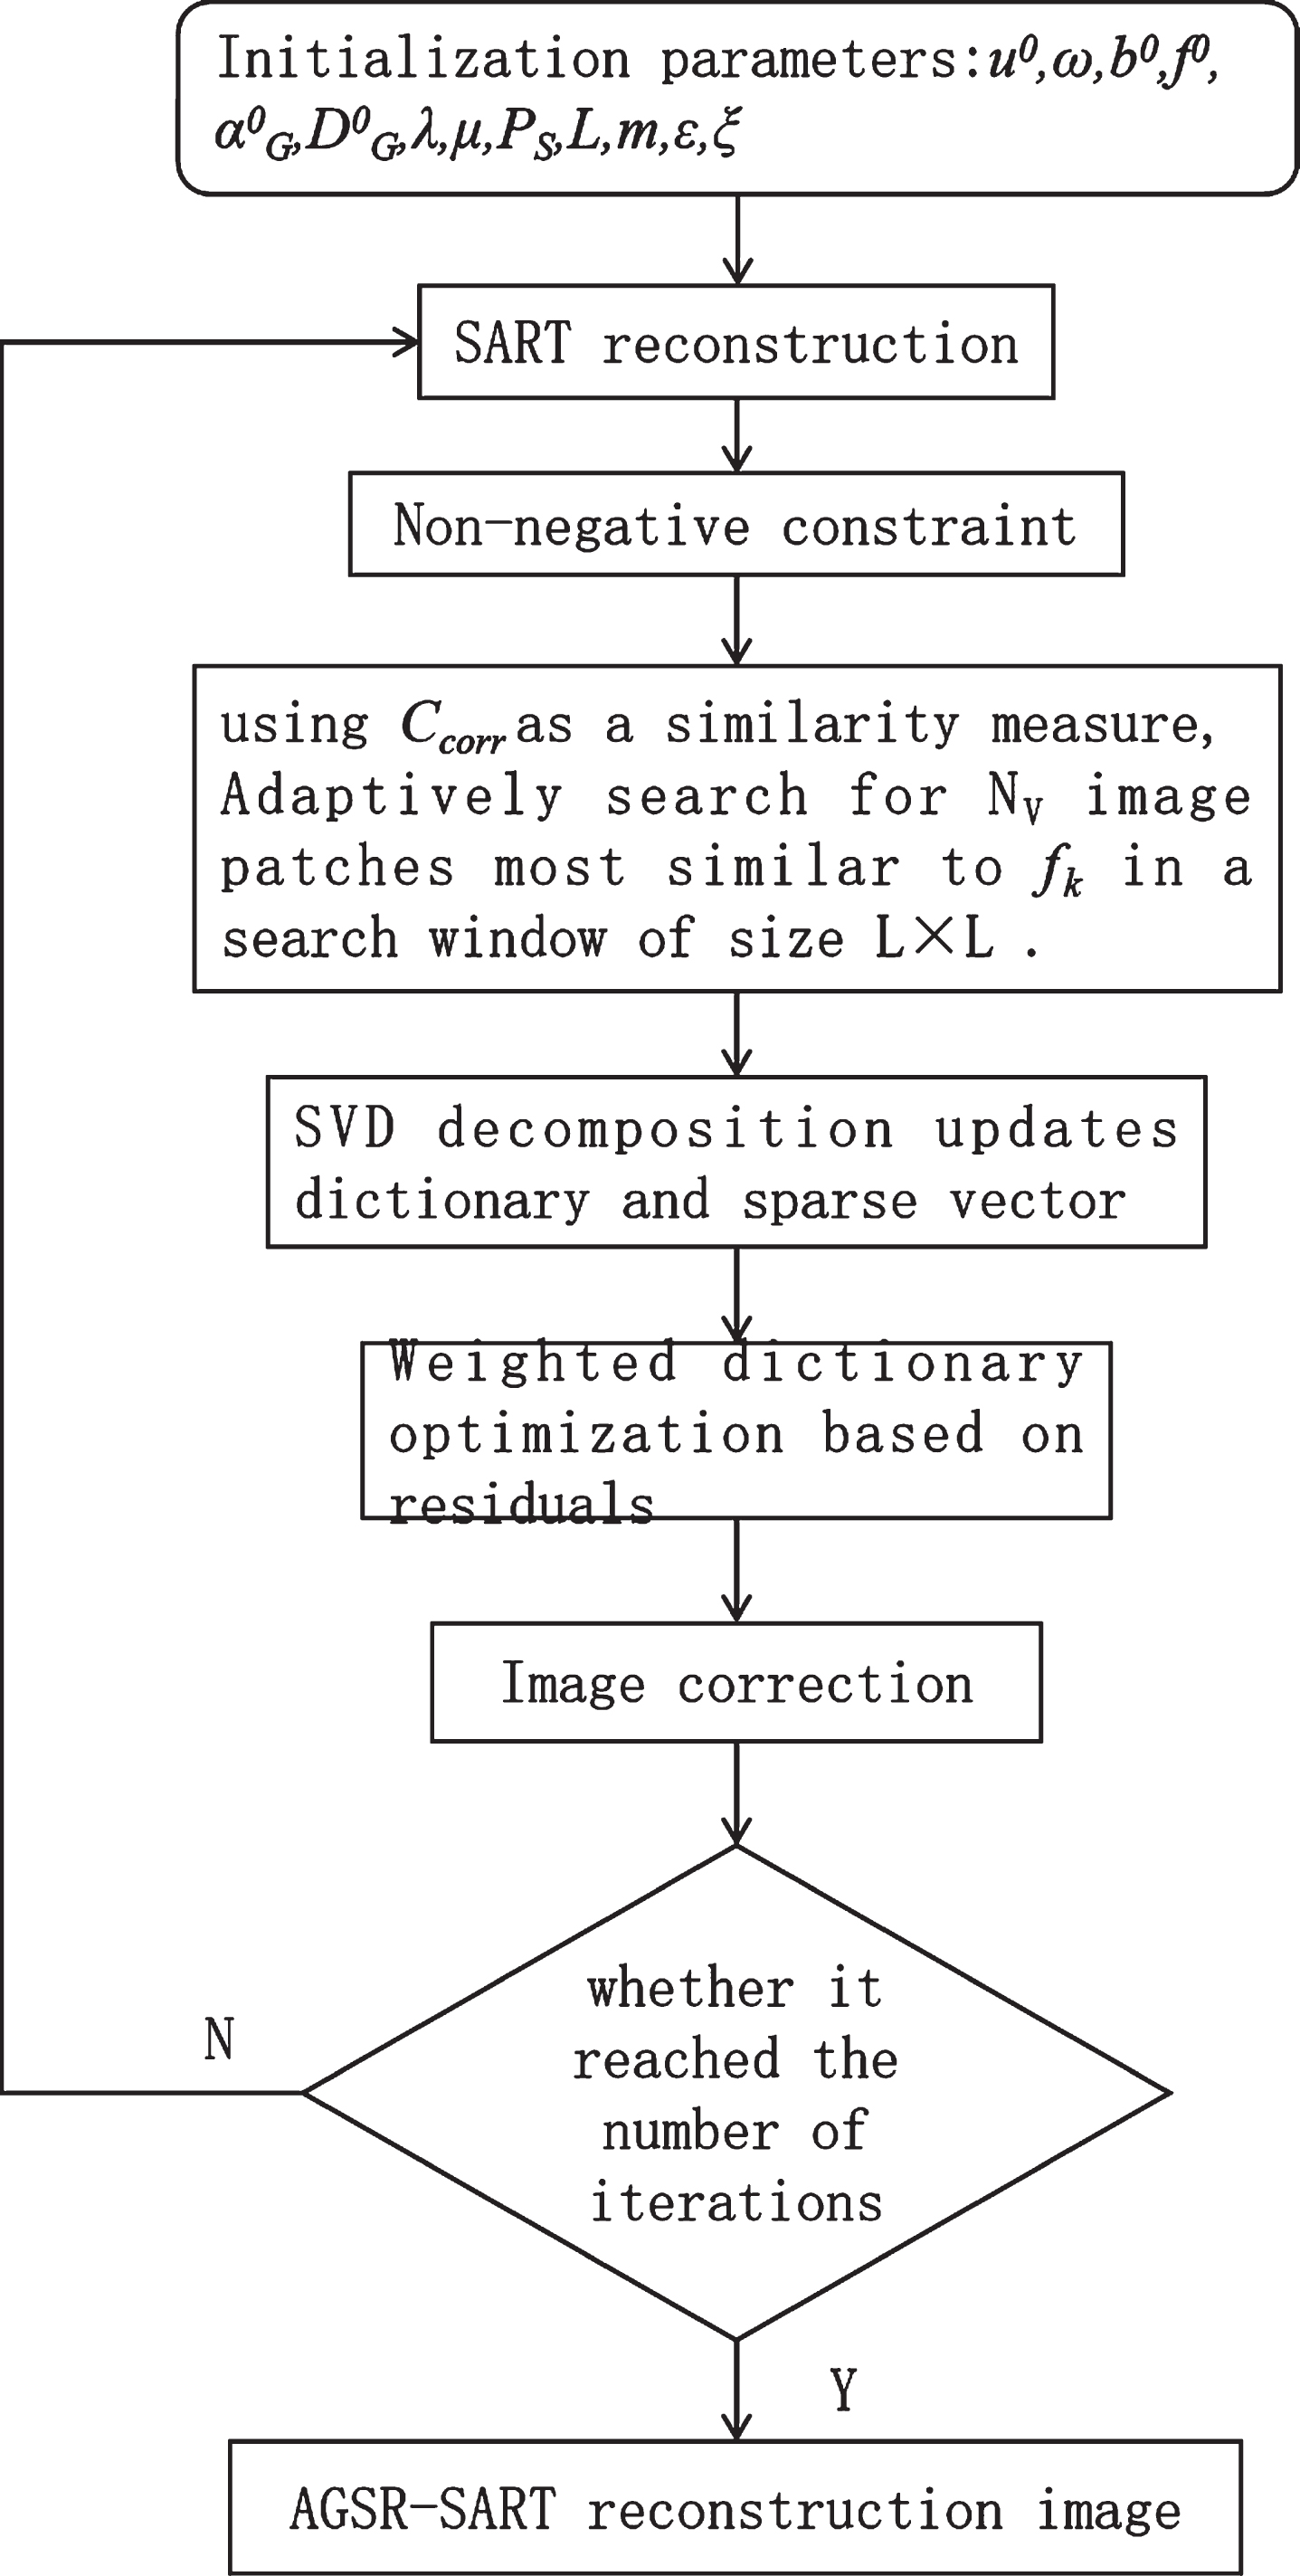
AGSR-SART reconstruction algorithm flowchart.
The evaluation criteria for reconstructed CT images are selected as follows: Peak Signal Noise Ratio
where fi denotes a reconstructed image value, fi* represents an original image value. In theory, the higher the value of the SNR is, the smaller the noise level of the reconstructed image is, and the better the image quality is. Mean Absolute Error
The MAE is closer to 0, the higher the quality of the reconstructed image is. Root Mean Square Error
The closer the RMSE is to 0, the higher the quality of the reconstructed image is. Structural Similarity
Among them, μ
x
is the average of x and μ
y
is the average of y, is used to estimate the brightness of the reconstructed image. Universal Quality Index The Universal Quality Index (UQI) [23] is used to measure the similarity of reconstructed and original images. The associated mean, variance and covariance over the interest region can be calculated as:
The formula for calculating UQI is:
where the UQI value belongs to [0, 1] and the closer it is to 1, the greater the similarity is.
The specific parameters are set as follows the distance from the X-ray source to the rotation center is 400 mm, the distance from the rotation center to the detector is 400 mm, the length of the detector is 512 mm, and the number of detection elements is 512. Abdominal, pelvic, and thoracic images is used as the research object to validate the effectiveness of the AGSR-SART algorithm. All the images from real human bodies were downloaded from the National Cancer Imaging Archive, and the image size was 256 × 256. Siddon’s light-driven algorithm [24] was used to obtain the system projection matrix, sparse angle CT projection data were scanned by sampling 64 views over 360° range. The number of AGSR-SART iterations is set to 300, in which the number of SART iterations is set to 500 during each iteration. The experimental machine uses Intel (R) Core (TM) i7-4790CPU 3.60GHz, 8GB memory.
Abdominal image
For abdominal images, Setting the patch size to 8 × 8, which is Ps = 64, the search window size L was set to 40, and λ = 1e-5, μ = 0.1. The display window is [–150 250] HU.
The effect of abdominal image reconstruction of each algorithm on 64 sparse projection data are showed in Fig. 5. It shows that the traditional FBP and SART algorithms have serious artifacts and noise. Although the TV-POCS algorithm eliminates the effects of noise, it appears that there are over smoothing and step artifacts. Both the GSR-SART algorithm and the AGSR-SART algorithm can reconstruct high-quality images and better preserve the texture and details of the images simultaneously. But the AGSR-SART algorithm can more effectively eliminate the interference of non-similar patches and accurately construct similar groups. While effectively suppressing the over-smoothing effect on the edges of the image during the iteration process, the ability to suppress noise is retained, so that the reconstructed image has better sharpness, it is closer to the contour of the real image, and the details are maintained well.
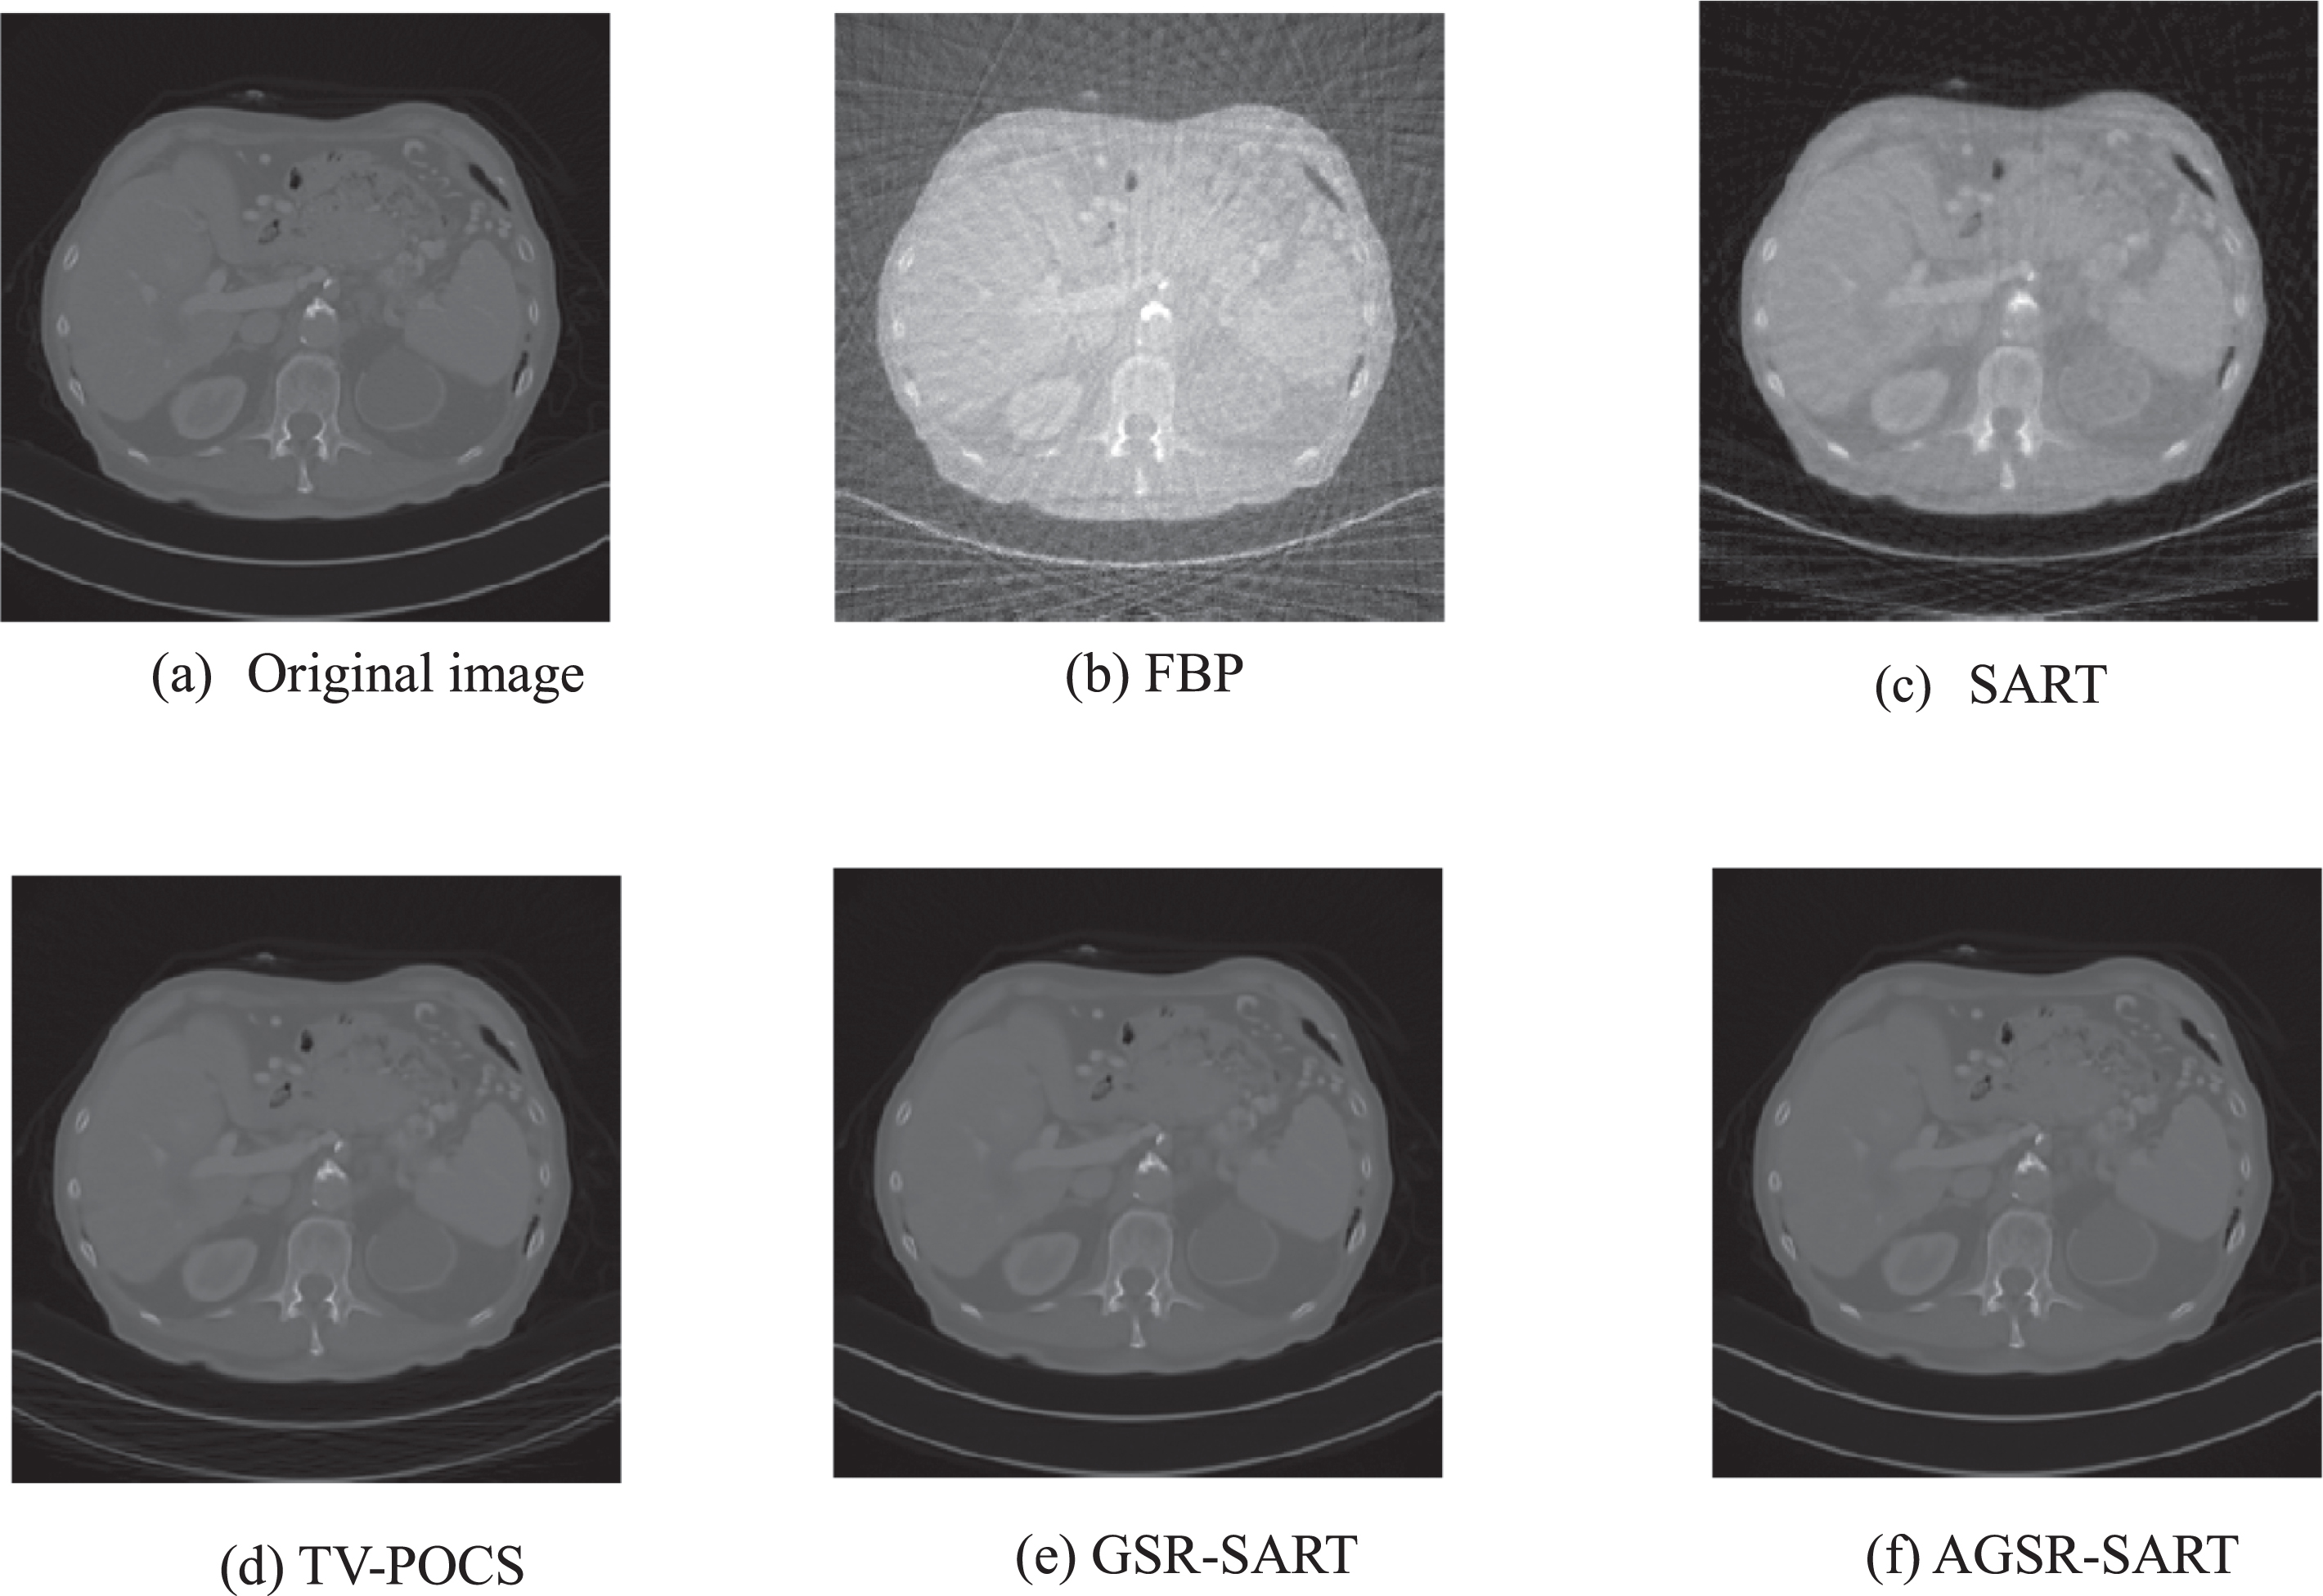
Reconstructed results of abdominal image. (a) Original image and results obtained by (b) FBP, (c) SART, (d) TV-POCS, (e) GSR-SART and (f)AGSR-SART.
To further demonstrate the superiority of the AGSR-SART algorithm, Fig. 6 plots the horizontal profile of three reconstruction algorithms: TV-POCS (green curve), GSR-SART (blue curve) and AGSR-SART (red curve). It shows the gray value distribution of the reconstructed image of three algorithms and the original image (black curve) in rows 120 through 180 to 200 and 230 rows in 135 to 150. It can be seen that the grayscale value of the TV-POCS algorithm is close to the true value in the uniform area, but the part where the gray value transformation in the edge area is relatively large differs from the true value. The value of GSR-SART is more consistent with the true value in most areas, but there is still a difference in the corner detail area. Compared with the other two algorithms, the reconstruction value of the algorithm in this paper is more consistent with the real value in the edge area, uniform area, and detail part, and the reconstruction effect is more accurate.
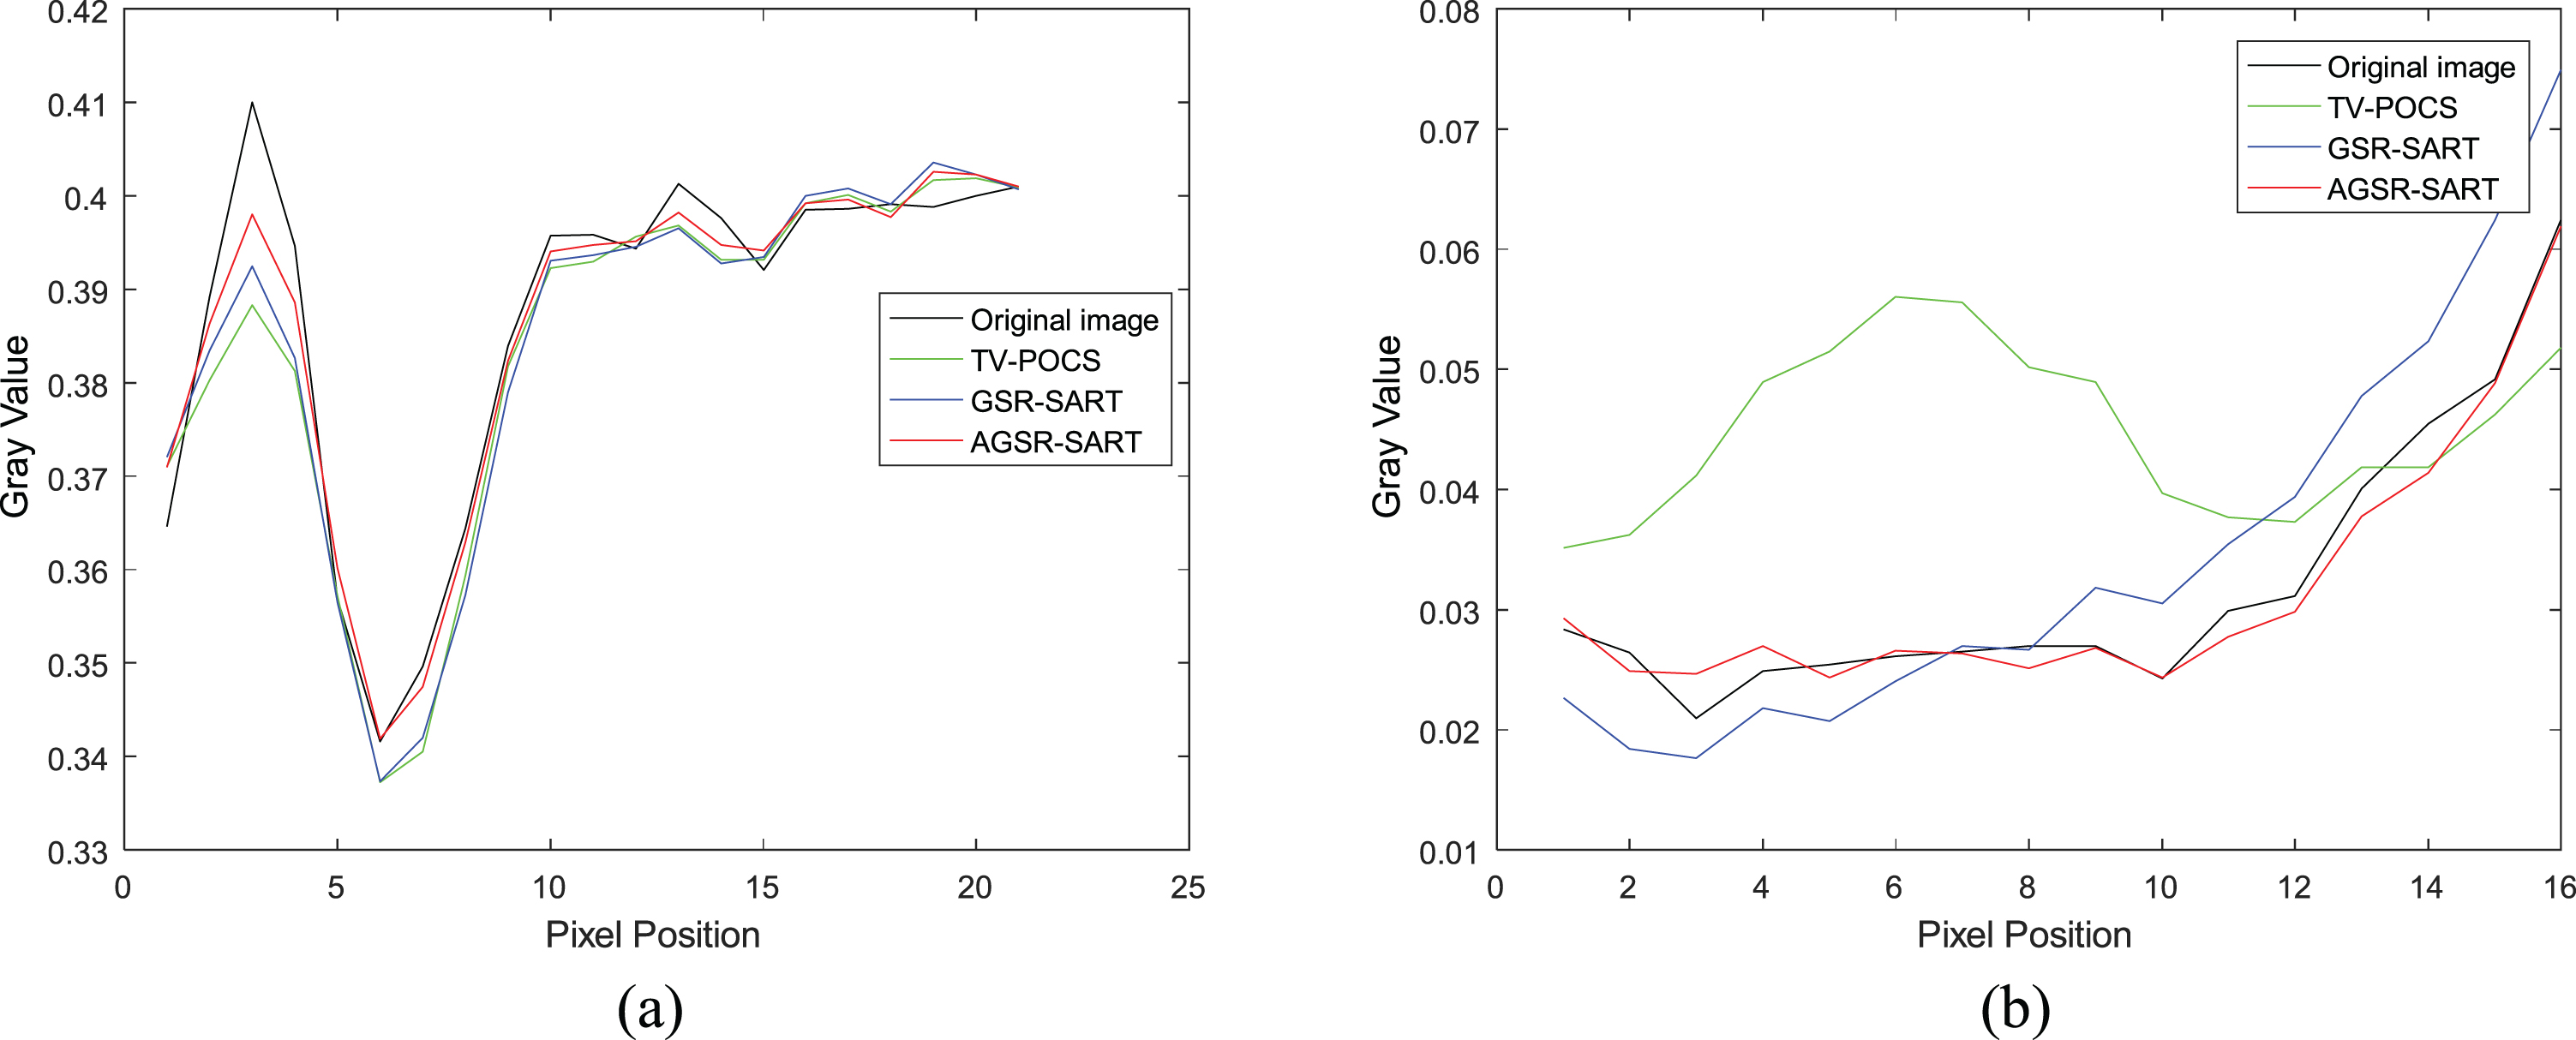
Horizontal profile of abdominal reconstructed images by different algorithms. (a) 120 rows, 180 to 200 columns (b) 230 rows, 135 to 150 columns.
The five evaluation standard values are shown in Table 1. It can achieve a lower Mean Absolute Error, as low as 0.0030, which is 16.67% lower than the MAE of the GSR-SART algorithm. Obviously, the AGSR-SART algorithm does best in all measures, which proves that the AGSR-SART algorithm can better reduce artifacts and maintain detailed structures compared with other algorithms, as well as has a better reconstruction effect.
Evaluation criteria for different algorithms for abdominal images
For the pelvic image, Setting the patch size to 8 × 8, which is Ps = 64, the search window size L was set to 40, and λ = 5e-5, μ = 0.1. The display window is [–150 250] HU.
The original pelvic image and reconstruction results are shown in Fig. 7. It shows that the AGSR-SART algorithm achieves the best visual reconstruction rendering, which removes the most noise and artifacts and better preserves tissue structure. In order to further prove the performance of AGSR-SART, Fig. 8 shows the difference image of each algorithm relative to the original image. Figures 8 (a) and (b) show that the FBP and SART algorithms lose more structural information than other algorithms, and the reconstruction results still have artifacts. As can be seen in Figs. 8 (d) and 8 (e), the image reconstruction artifacts of the two algorithms are well suppressed, while the AGSR-SART algorithm in this paper can retain more minute details, especially visible at the bottom of the image.
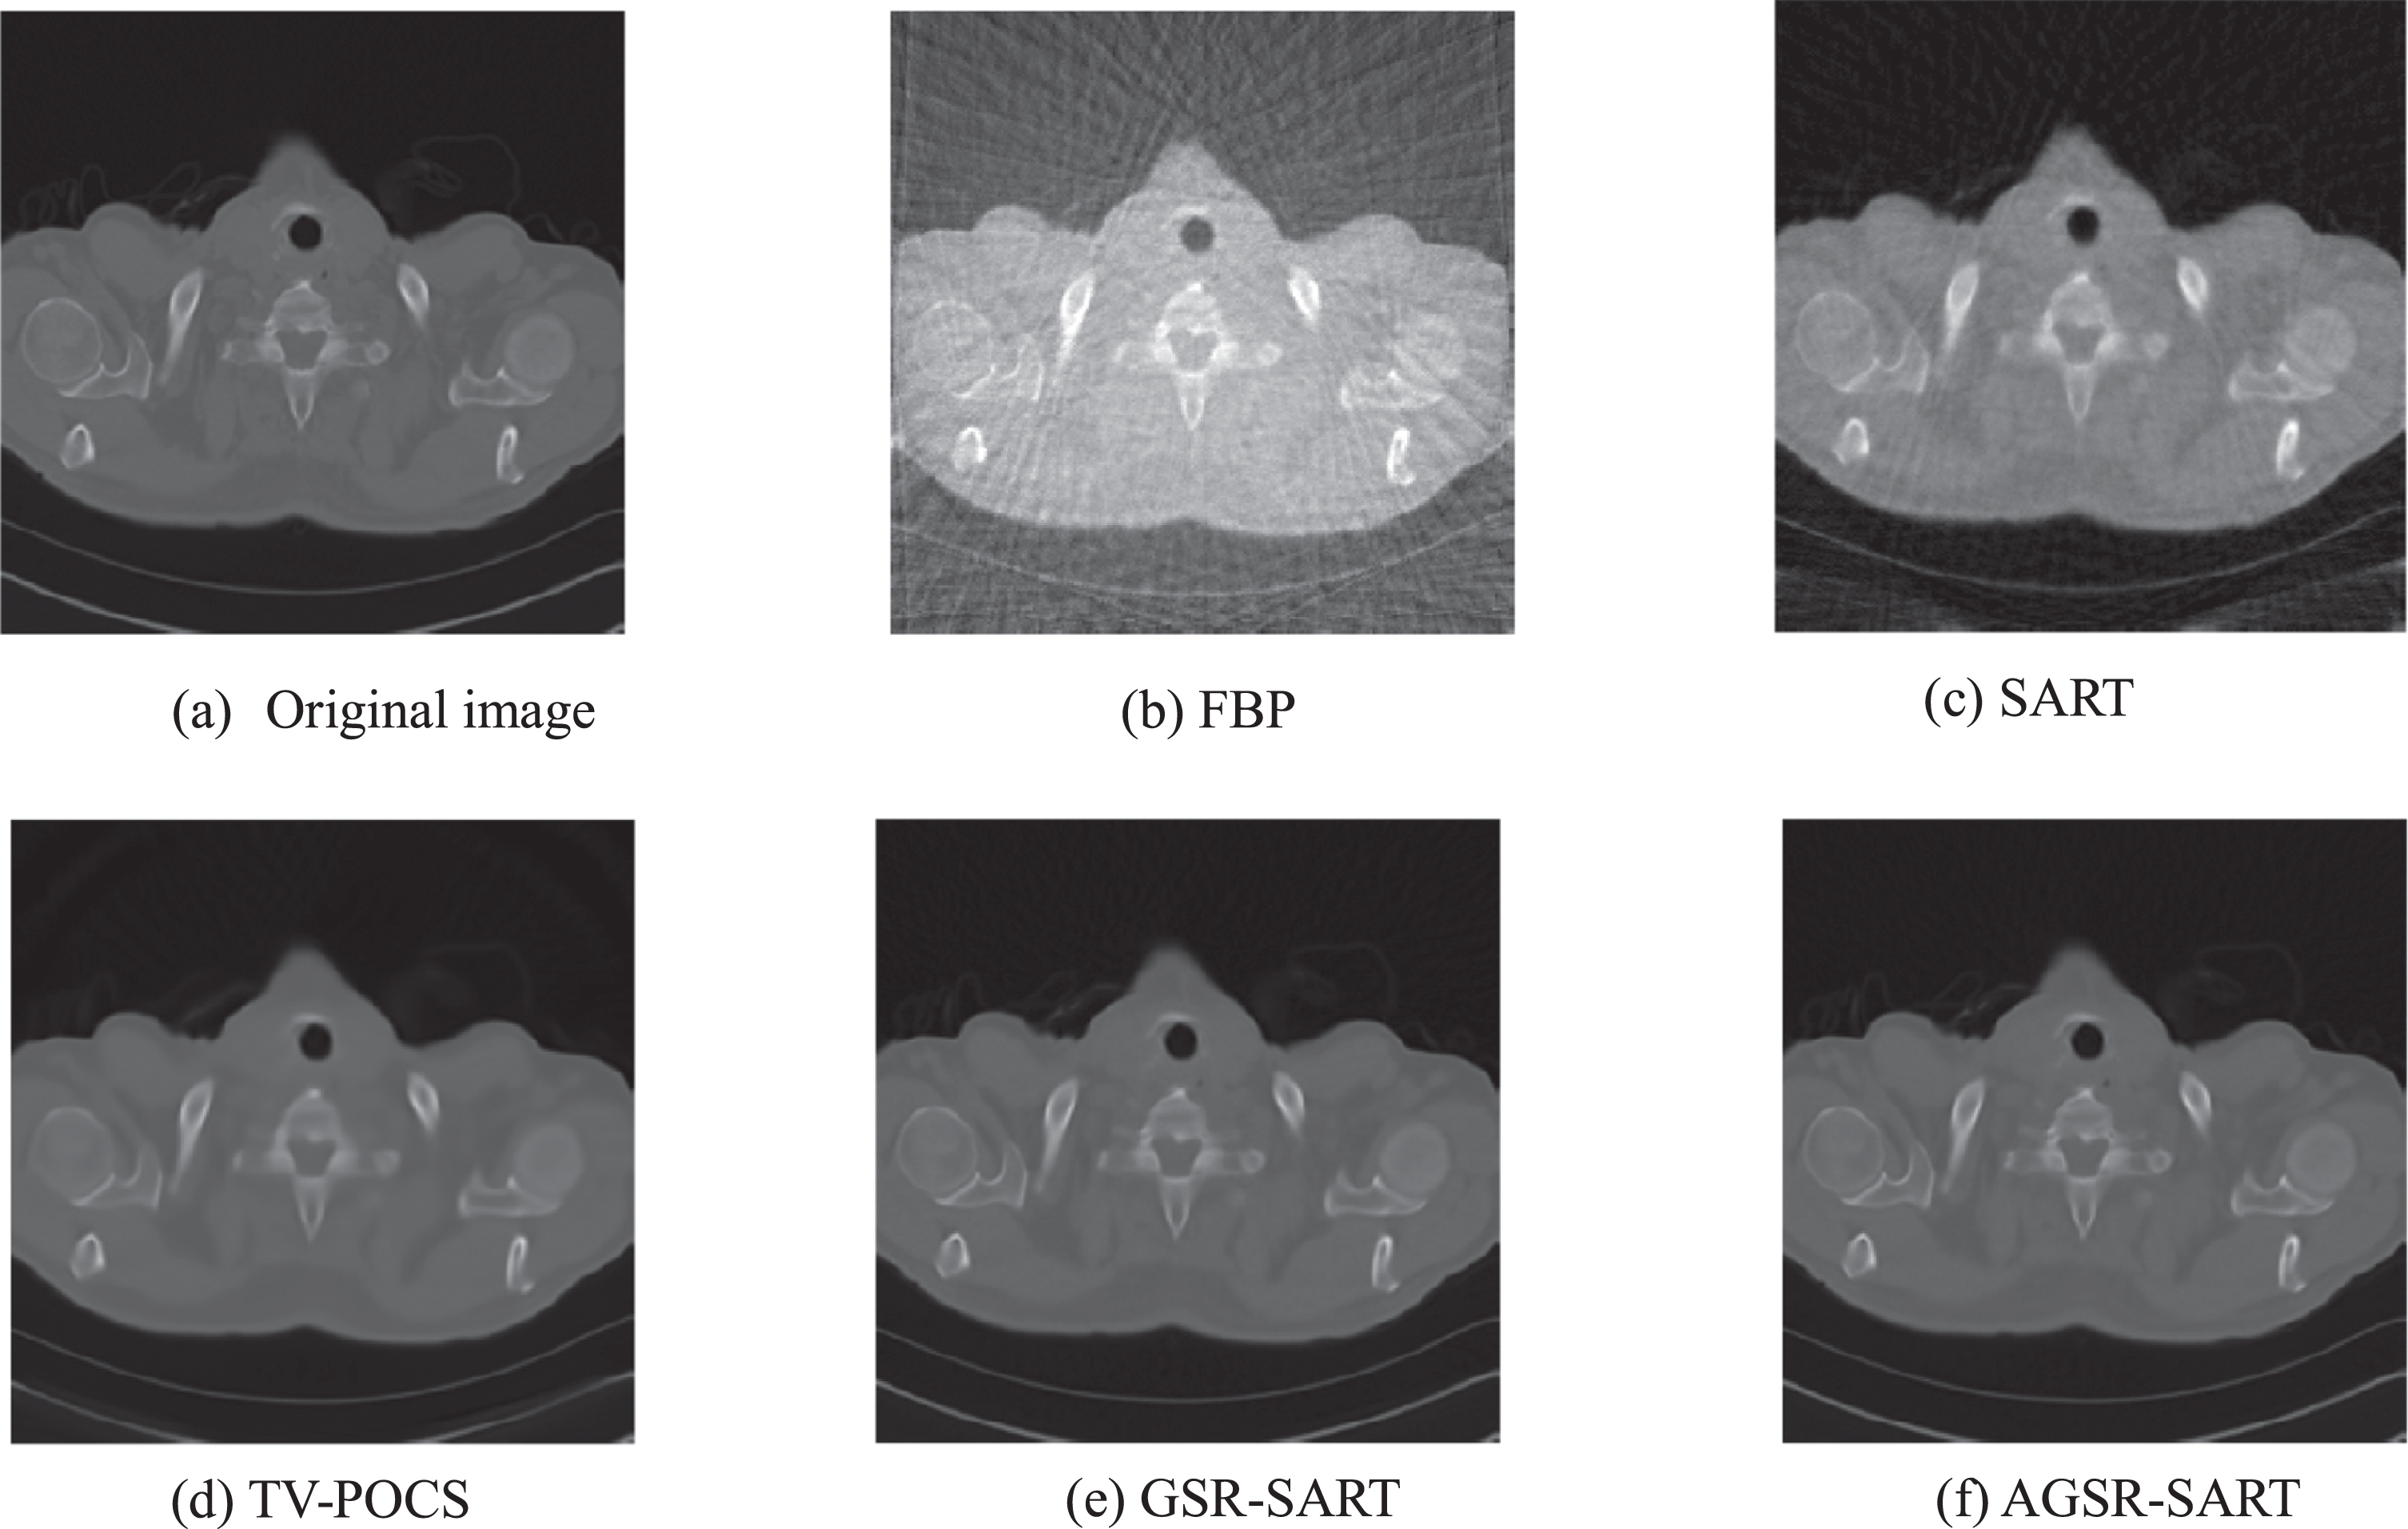
Reconstructed results of pelvic image. (a) Original image and results obtained by (b) FBP, (c) SART, (d) TV-POCS, (e) GSR-SART and (f)AGSR-SART.
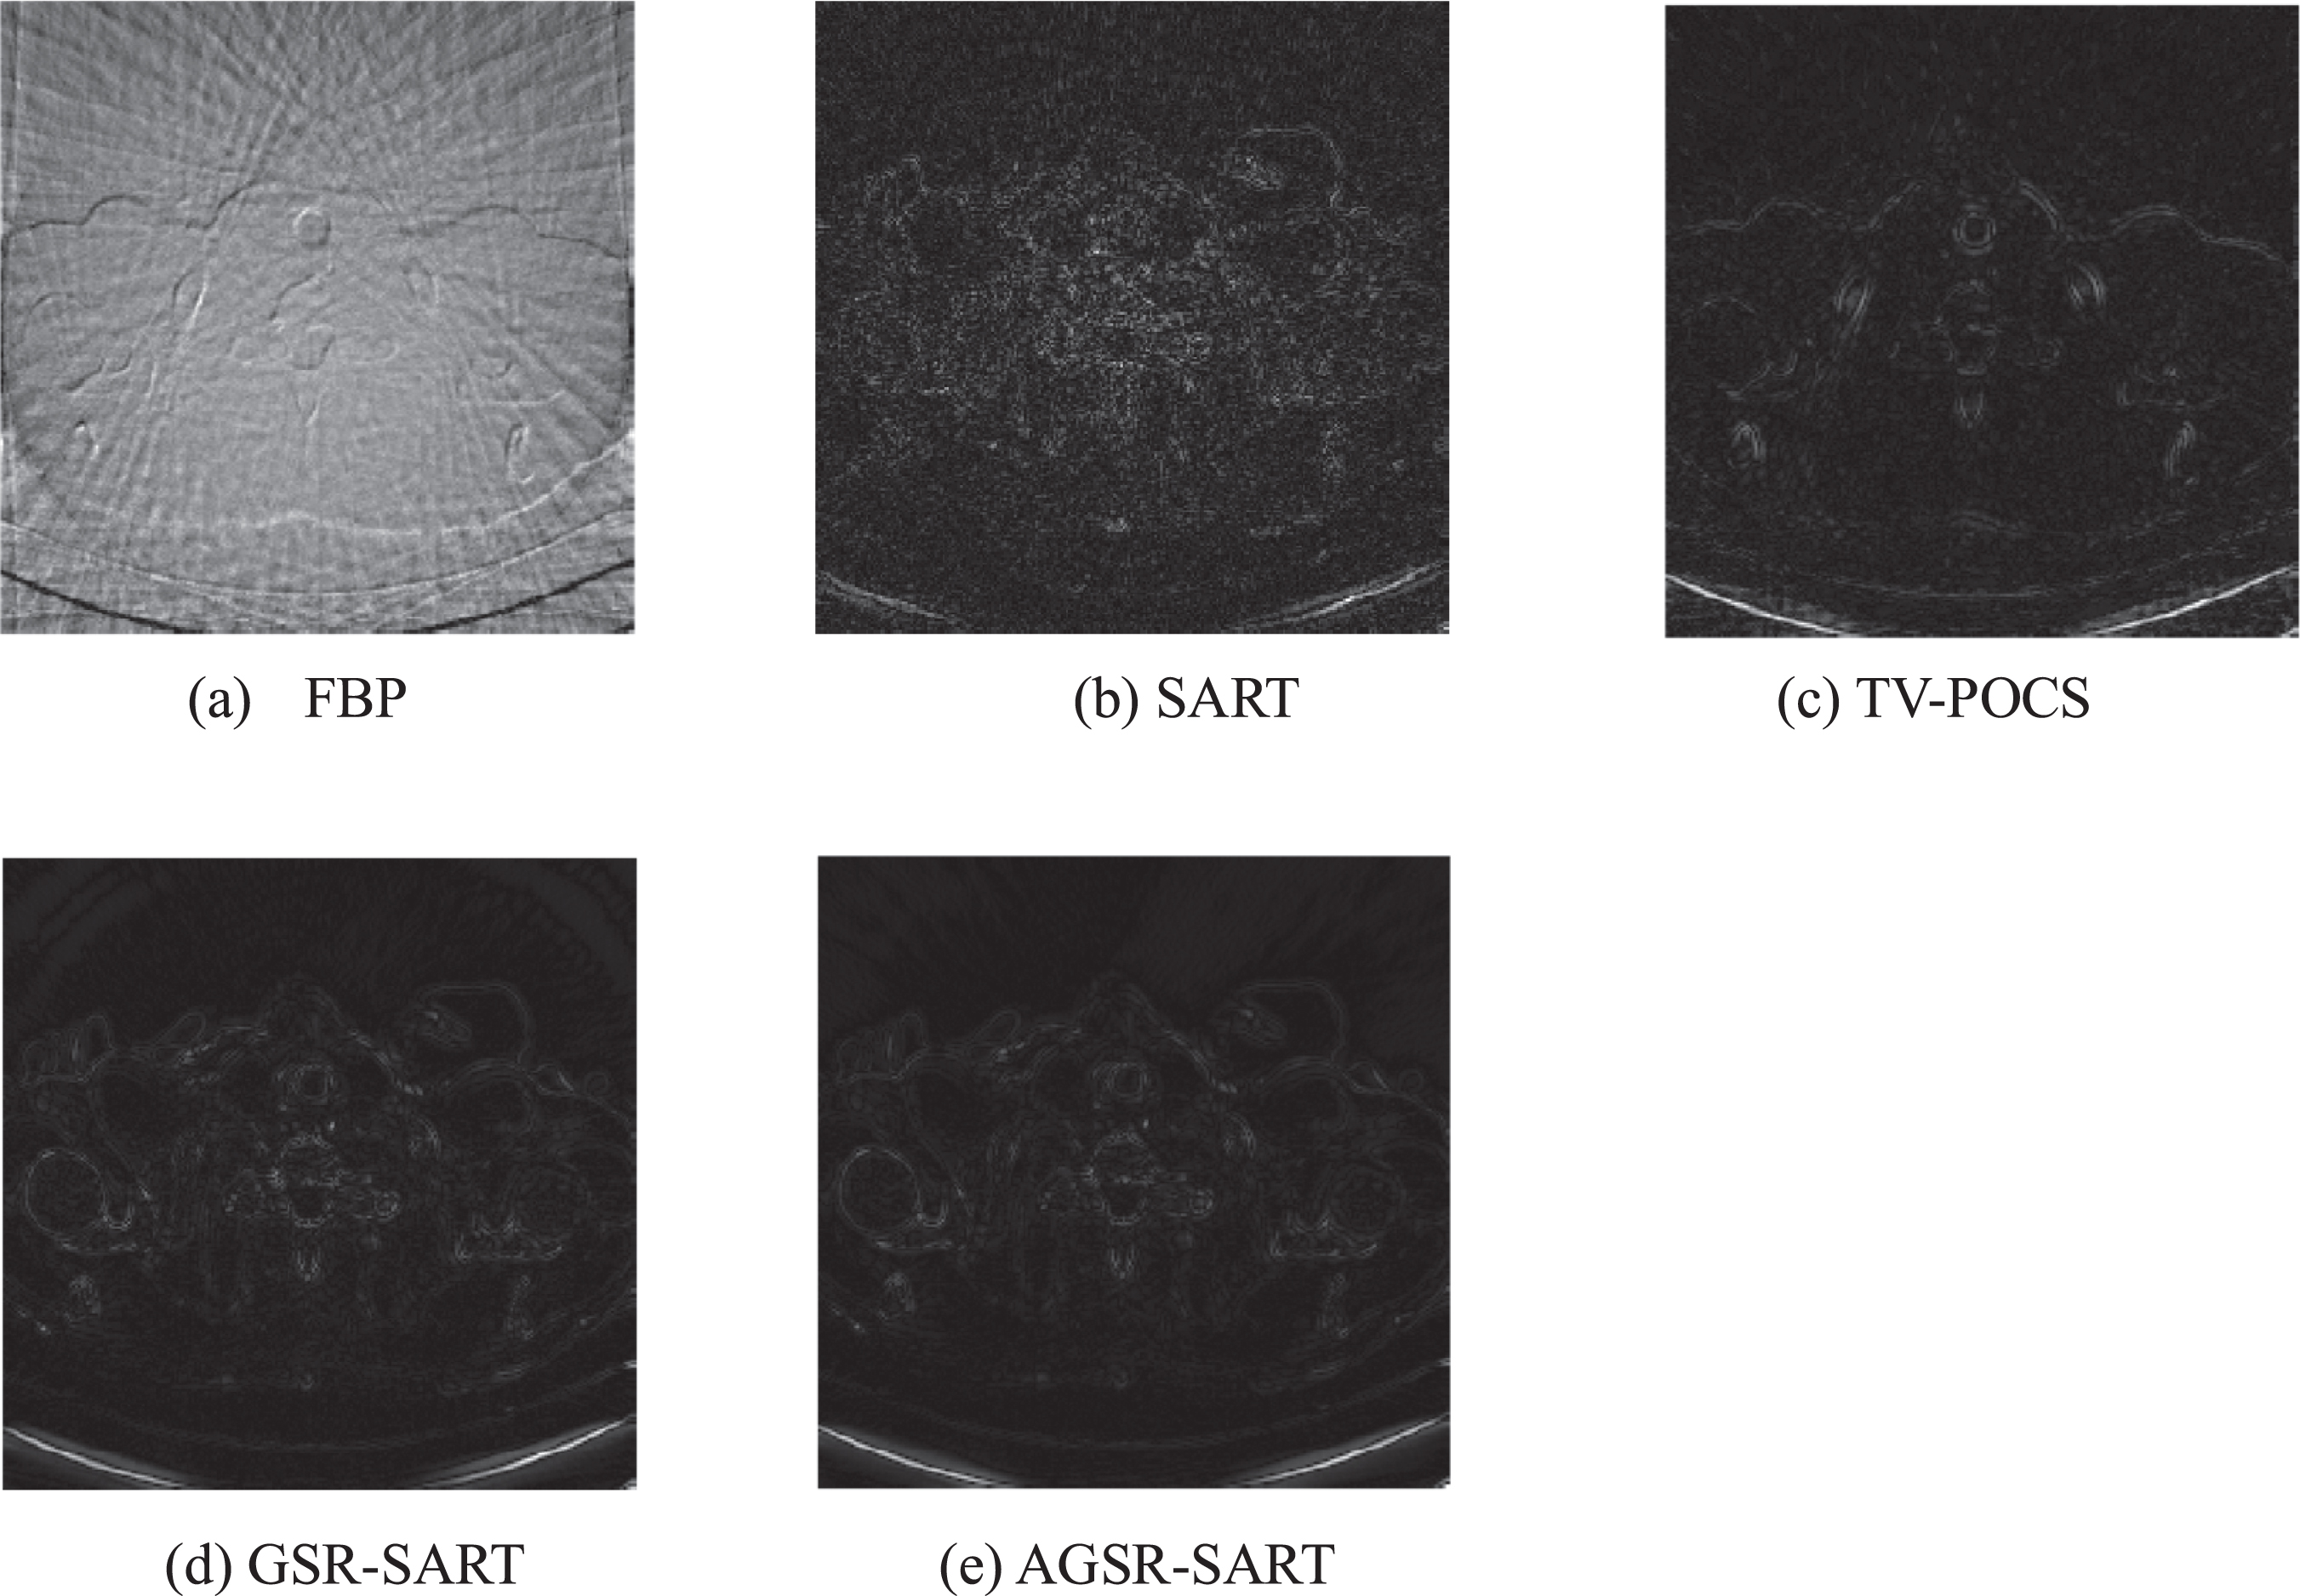
Differences between the reconstructed image and the original image (a) FBP, (b) SART, (c) TV-POCS, (d) GSR-SART and (e) AGSR-SART.
Table 2 shows that the AGSR-SART algorithm proposed in this paper has greater advantages. It can achieve a higher Signal Noise Ratio, up to 48.20dB, compared to the GSR-SART algorithm, PSNR is increased by up to 5.38%, MAE is reduced by up to 22.22%, and RMSE is reduced by at least 25%. SSIM is increased by up to 0.50%, UQI is increased by up to 6.81%.
Evaluation criteria for different algorithms for pelvic image
For thoracic images, Setting the patch size to 8 × 8, which is Ps = 64, the search window size L was set to 40, and λ = 1.5e-5, μ = 0.08. The display window is [–1000 250] HU.
Figure 9 is a reconstruction result of the thoracic image. The enlarged image of red box area in the original image is shown in Fig. 10. In Figs. 9 (b) and 10 (b), the entire image is full of streak artifacts, and the structure of the red box area in the thoracic image is very blurry and cannot be identified. Figures 9 (c) and 10 (c) show that although the SART algorithm removes some artifacts, the details in the red box are still not ideal. Figures 9 (d) and 10 (d) show that TV-POCS reconstructs most of the details of the thoracic vessels, but the local magnified area has an over smooth effect. Figures 9 (e) and 9 (f) show that both algorithms can more clearly reconstruct high-quality images. However, it can be seen from Figs. 10 (e) and 10 (f) that the AGSR-SART algorithm proposed in this paper in the red square area has a higher similarity at the edges of small organs than the original image, as indicated by the red arrow.
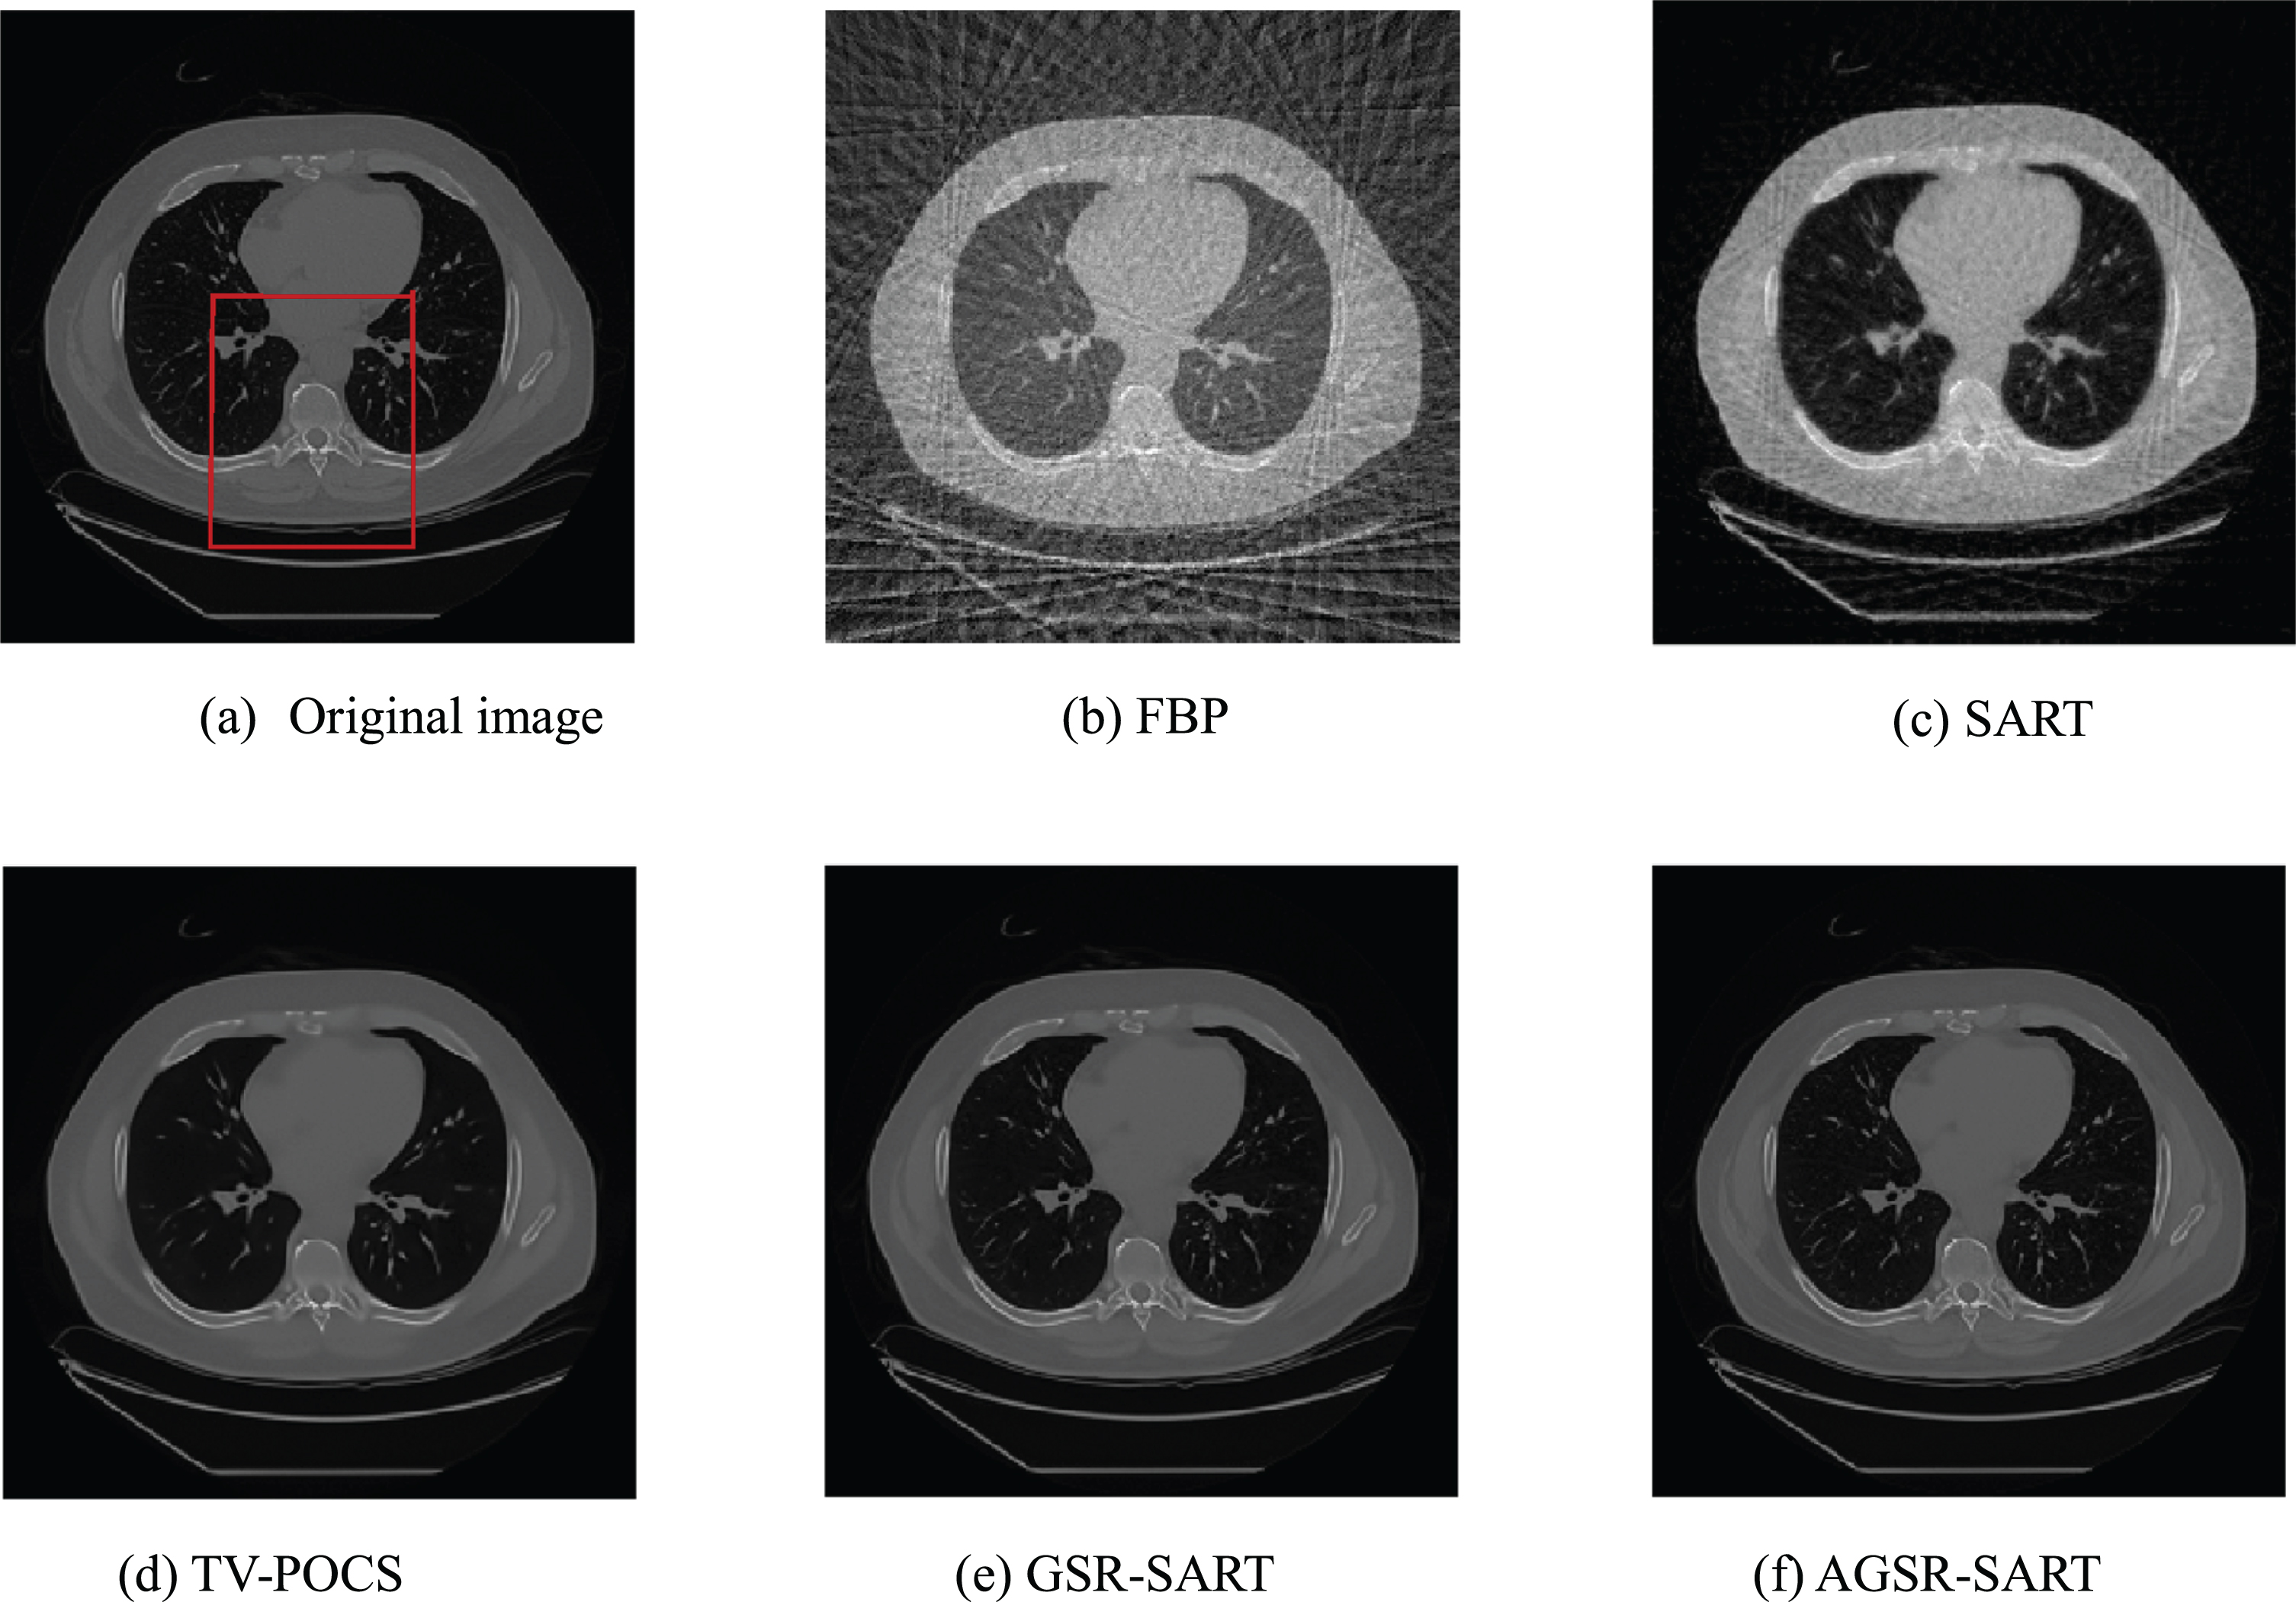
Reconstructed results of thoracic image. (a) Original image and results obtained by (b) FBP, (c) SART, (d) TV-POCS, (e) GSR-SART and (f) AGSR-SART.
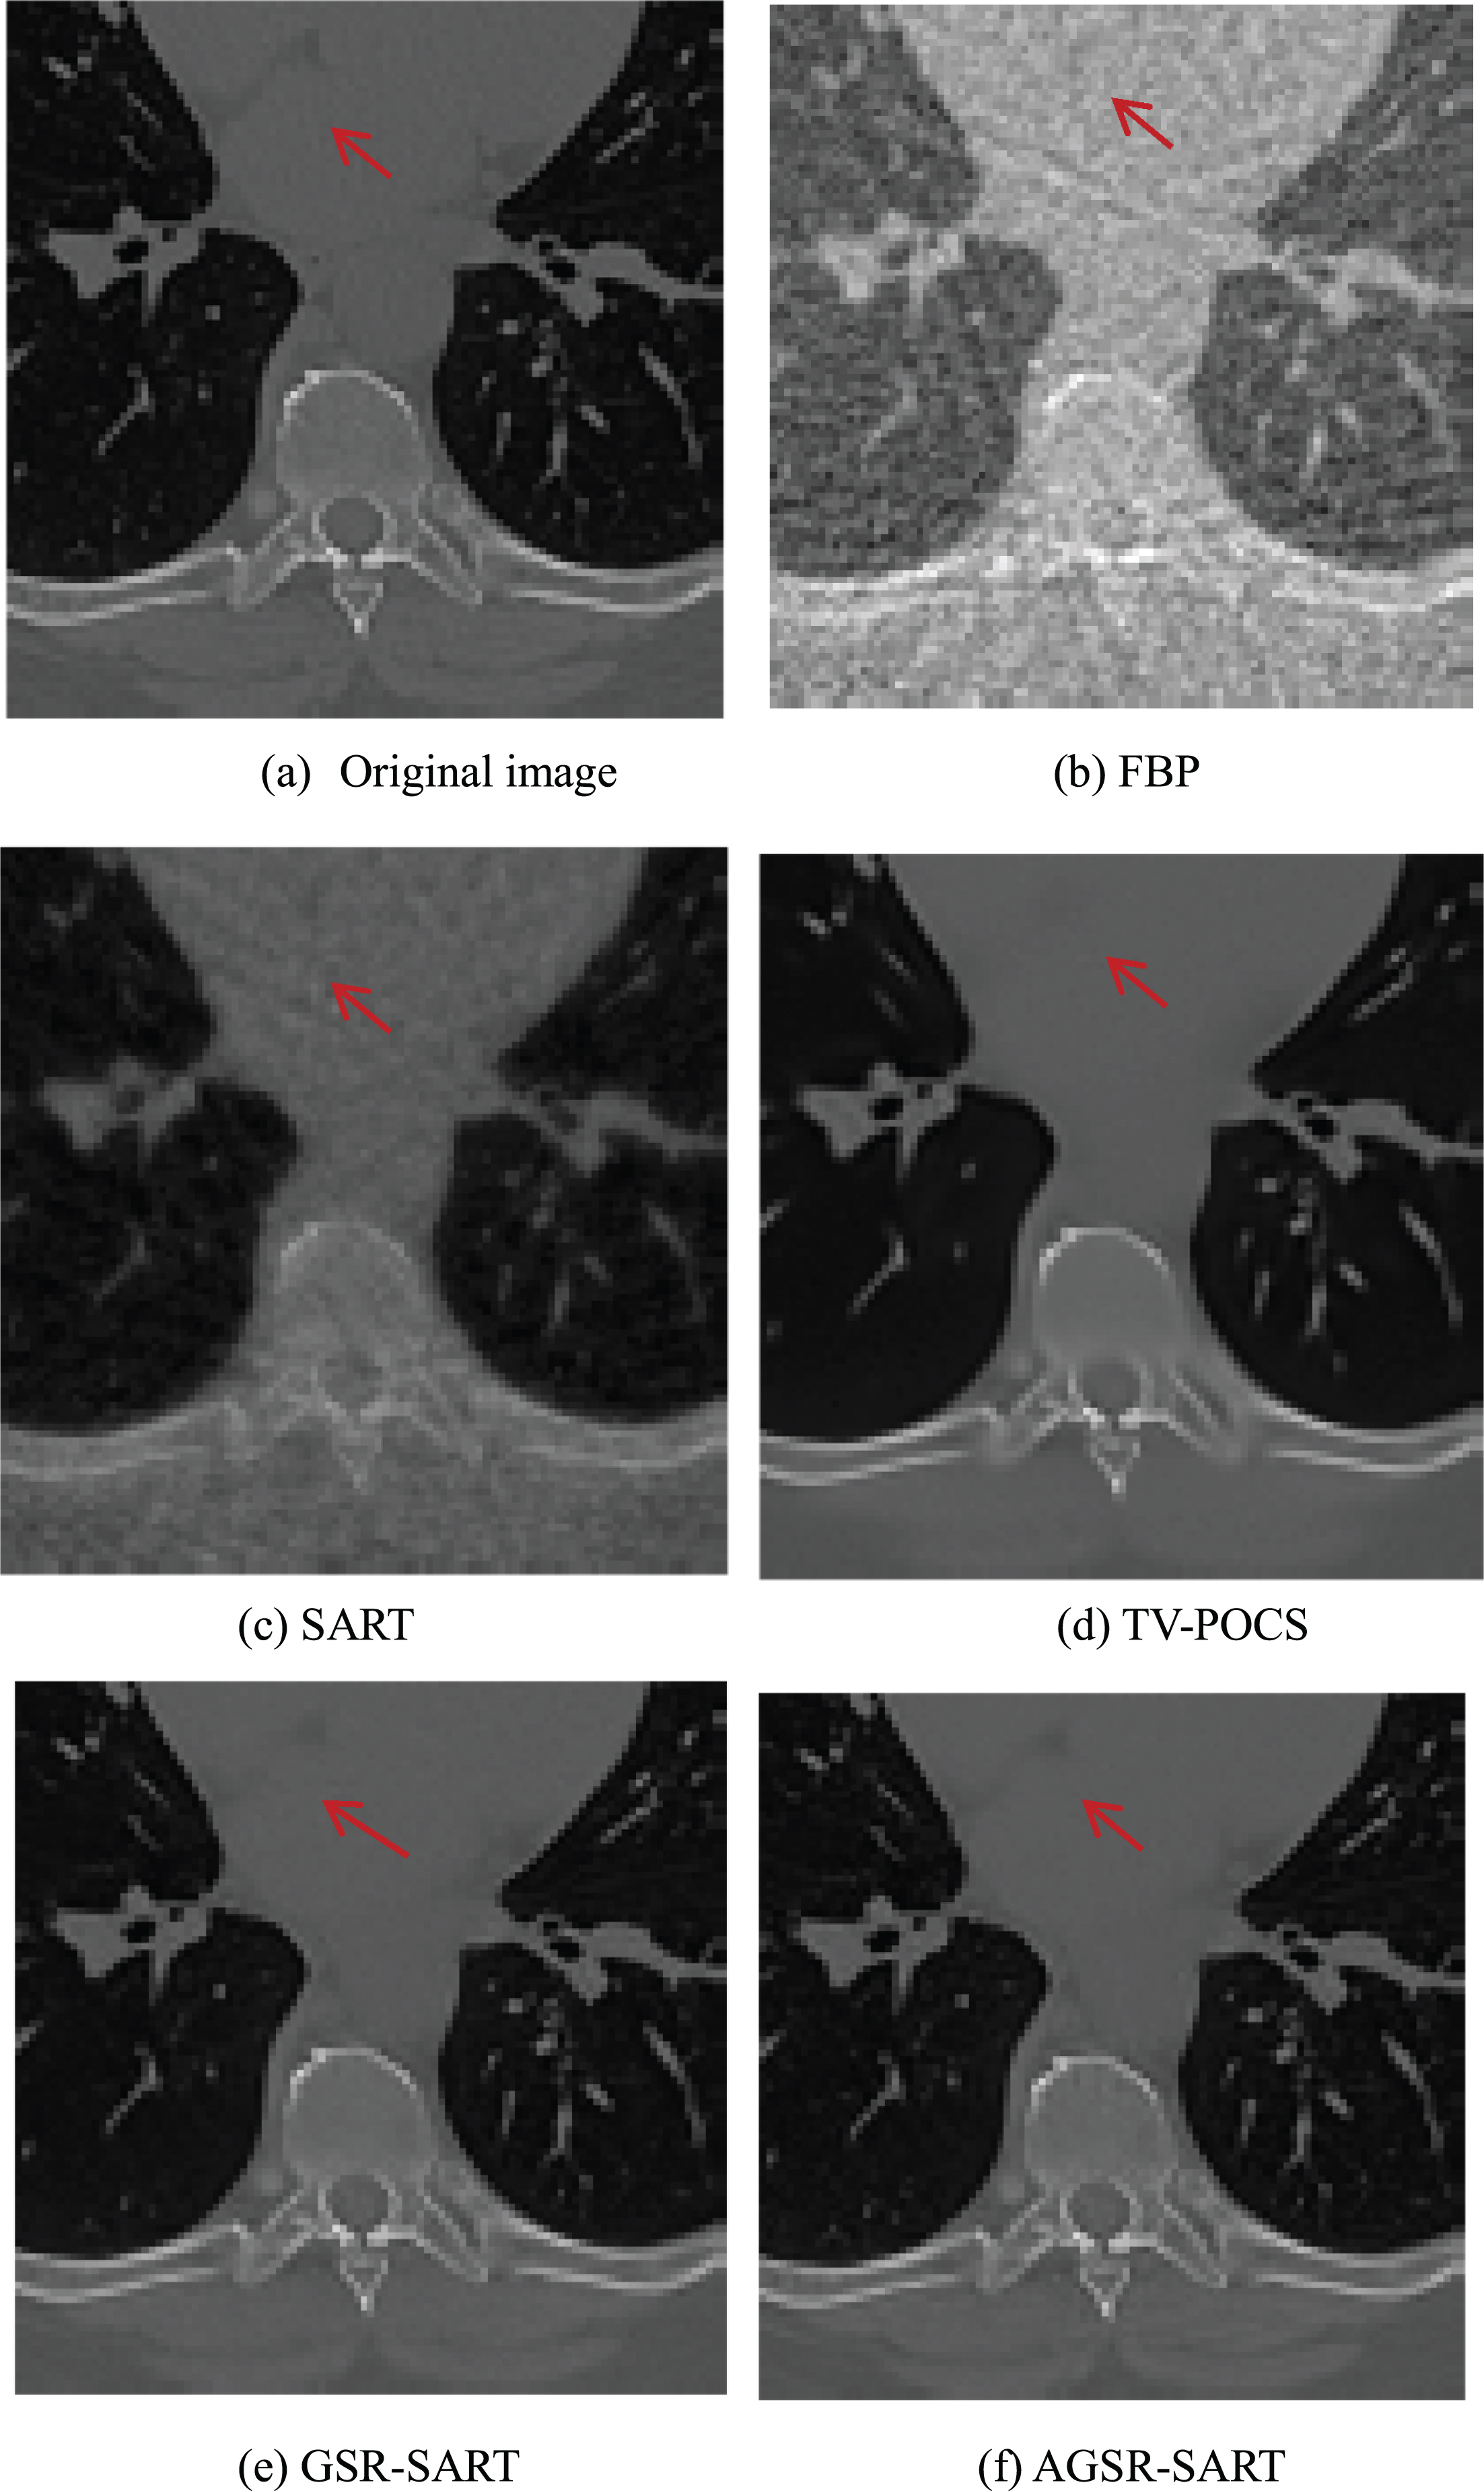
Enlarged region in the reconstructed images of thoracic image: (a) original image (b) FBP, (c) SART, (d) TV-POCS, (e) GSR-SART and (f)AGSR-SART.
From Table 3, the SNR, SSIM and UQI of the AGSR-SART algorithm is much higher than the other algorithms, the MAE and RMSE which are close to zero. The reconstruction effect is the best among several algorithms.
Evaluation criteria for different algorithms for thoracic images
In this paper, the main contributions are as follows: Weighted dictionary learning algorithm based on adaptive Group-Sparsity Regularization is proposed for sparse angle CT reconstruction. (1) By introducing the covariance between image patches into the calculation of Euclidean Distance, the new similarity measure can more accurately measure the structural difference between two image patches. At the same time, by setting threshold to determine the number of optimal similar plaques in different structures and texture regions, an adaptive Group-Sparsity Regularization of the dictionary learning algorithm is realized. (2) Dictionary learning is performed by adding residual-based weighting factor to automatically distinguish noise and image detail information, the algorithm can suppress the smooth effect of low contrast information area in the image and retain the edge information of soft tissue. (3) The sparse reconstructed image is modified according to the difference between the estimated value and the intermediate image in order to speed up the convergence. The experimental results show that the AGSR-SART algorithm are superior to FBP, SART, TV-POCS, and GSR-SART in various evaluation standards. The pelvic reconstructed images obtained by using FBP, SART, TV-POCS, GSR-SART and AGSR-SART method, have PSNR of 21.56, 32.02, 37.32, 45.74 and 48.20, respectively, RMSE of 0.1030, 0.0142, 0.0065, 0.0036 and 0.0028, respectively, and SSIM of 0.1681, 0.4239, 0.5400, 0.6656 and 0.7109, respectively. When there are complex structure and texture information in the reconstructed image, the proposed algorithm can still achieve ideal reconstruction results.
Conflict of interest
The authors declare no conflict of interest.
Footnotes
Acknowledgments
This study was supported by the key specialized research and development program of Henan Province [Grant No.202102210170], National Science Foundation of China (61871176).