
Abstract
Multi-modal image fusion techniques aid the medical experts in better disease diagnosis by providing adequate complementary information from multi-modal medical images. These techniques enhance the effectiveness of medical disorder analysis and classification of results. This study aims at proposing a novel technique using deep learning for the fusion of multi-modal medical images. The modified 2D Adaptive Bilateral Filters (M-2D-ABF) algorithm is used in the image pre-processing for filtering various types of noises. The contrast and brightness are improved by applying the proposed Energy-based CLAHE algorithm in order to preserve the high energy regions of the multimodal images. Images from two different modalities are first registered using mutual information and then registered images are fused to form a single image. In the proposed fusion scheme, images are fused using Siamese Neural Network and Entropy (SNNE)-based image fusion algorithm. Particularly, the medical images are fused by using Siamese convolutional neural network structure and the entropy of the images. Fusion is done on the basis of score of the SoftMax layer and the entropy of the image. The fused image is segmented using Fast Fuzzy C Means Clustering Algorithm (FFCMC) and Otsu Thresholding. Finally, various features are extracted from the segmented regions. Using the extracted features, classification is done using Logistic Regression classifier. Evaluation is performed using publicly available benchmark dataset. Experimental results using various pairs of multi-modal medical images reveal that the proposed multi-modal image fusion and classification techniques compete the existing state-of-the-art techniques reported in the literature.
Introduction
With the recent advancements in imaging techniques, the internal structure of human brain can be easily visualized. Each image modality provides unique information about the human brain. Computed Tomography (CT) images provide information about the structure of the bones and the Magnetic Resonance Imaging (MRI) images give information about the soft-tissues [25]. Fusion of these two images provides excellent information that can be used for reliable tumor diagnosis. The key steps involved in the brain disease detection are registration [7, 20], fusion [10, 35] and classification [15, 21].
Image registration was done using deep learning and affine transformation in [7]. Here, multiple ConvNet units were stacked to achieve registration. Both affine and deformable image registration was achieved in this paper. A survey on different registration techniques was presented in [20]. Analysis was done based on 9 different registration criteria like dimensionality, domain, registration basis, transformation, interaction, object, modalities, subject and optimization. A scheme for optimization of registration was given in [19]. The proposed optimization technique was based on the modified particle swarm optimization technique. A technique for medical image fusion was proposed in [18]. Here, conjugate gradient technique was used to optimize the coefficients. CT and MRI image fusion using fuzzy logic was presented in [35]. Image was decomposed to low and high bands by using discrete wavelet transform. Fuzzy logic was used for fusion of low bands and average fusion was used for the high frequency bands. Both traditional and hybrid fusion system was presented in [20]. All the techniques were analyzed using fusion metrics like entropy, gradient, etc. Image fusion based on CNN was presented in [30]. This system used both NSST and spiking cortical model for the fusion of CT and MRI images. Segmentation of abnormal intensities from brain structures is accomplished to extract tumour properties like size, shape and location [14, 38]. Tumor classification using MRI images was proposed in [21]. Here, feature extraction was done using discrete wavelet transform. The extracted features were classified using SVM [24]. A hybrid approach for medical image classification was proposed in [15]. Here features were extracted using DWT, feature reduction was done using genetic algorithm and classification was done using SVM.
The main contributions of this paper are A new medical image classification methodology based on image fusion is presented. A novel image enhancement technique using Energy based CLAHE (ECLAHE) is proposed. A novel weighted medical image fusion algorithm based on Siamese Neural Network and Entropy (SNNE) is proposed. Classification of fused medical images using logistic regression modelling is presented. Quantitative evaluation using various metrics is presented using publicly available dataset.
In earlier work only single modality image considered, in this work fused images are used to improve disease detections.
Literature survey
A framework for the fusion of MRI [28, 36], and CT images was proposed by Hou et al. [10]. The authors employed convolutional neural network architecture for the fusion. In addition, a dual-channel spiking model was also employed in this paper. The entire image was decomposed using Non-Sub sampled Shearlet Transform (NSST). At first, source image was decomposed at three levels. Then the low-frequency components were fused using convolutional neural network architecture. Later, using the convolutional neural network, a weight map was generated. The weights in the weight map were designed based on the activity level measurements. The high frequency band coefficients were fused using dual-channel spiking model. The dual-channel was employed to raise the performance of detail extraction in the dark image regions. Finally, the fused image was obtained by using the inverse NSST transform.
Huang et al. [11] proposed frog leaping algorithm for image fusion using. In this paper, two schemes were combined to form a fusion technique. The first scheme comprised of shuffled frog leaping scheme and the second was the pulse coupled neural network structure. The SPECT input image was decomposed into hue, saturation and intensity. The intensity image was then decomposed using NSST transform. However, NSST transform was directly applied to the CT image. Finally, inverse NSST was applied to get the intensity layer. Then, inverse HIS operation was used to get the final fused image. In the frog leaping algorithm, the fitness of each frog was computed and arranged in the descending order. This system produced good fusion results Xia et al. [13] proposed a scheme for the detection of brain tumor using medical image fusion. In this paper, two types of features were used. The first type was the multi-scale transform features and the second type was the deep convolutional neural features. The input image was decomposed into sub-images using two filters namely, the Gauss Laplace filter and the Gaussian filter. The initialization of the kernel for convolution was performed using Hek technique. Using the initialization, the basic unit was generated. The basic unit was then trained using the back-propagation technique. Many such units were stacked together to form a deep stacked structure. Finally, the fused coefficients were used to generate the fusion result. Following is a summary of the previously related studies in this research topic reported in the literature.
Proposed methodology
The proposed methodology comprises of steps like image pre-processing (filtering and enhancement), registration, fusion, segmentation, extraction of relevant features and final classification. This is depicted in Fig. 1. The noisy MRI and noisy CT images are first obtained. These data are pre-processed using filtering and enhancement. Filtering is done using modified 2D Adaptive Bilateral Filters (M-2D-ABF). We aim to reduce the image noises such as Gaussian random noise by using the modified bilateral filters in such way that the image are smoothened however, while preserving the edges. And Enhancement is done using Energy-based CLAHE (ECLAHE) algorithm. These noiseless images are then registered using mutual information. The registered MRI and CT images are combined using the proposed Siamese Neural Network and Entropy (SNNE)-based image fusion algorithm. Then from the fused image, segmentation is done using clustering and thresholding. Then, from the segmented regions, the features are extracted and finally fused image classified into two cases, benign and malignant.
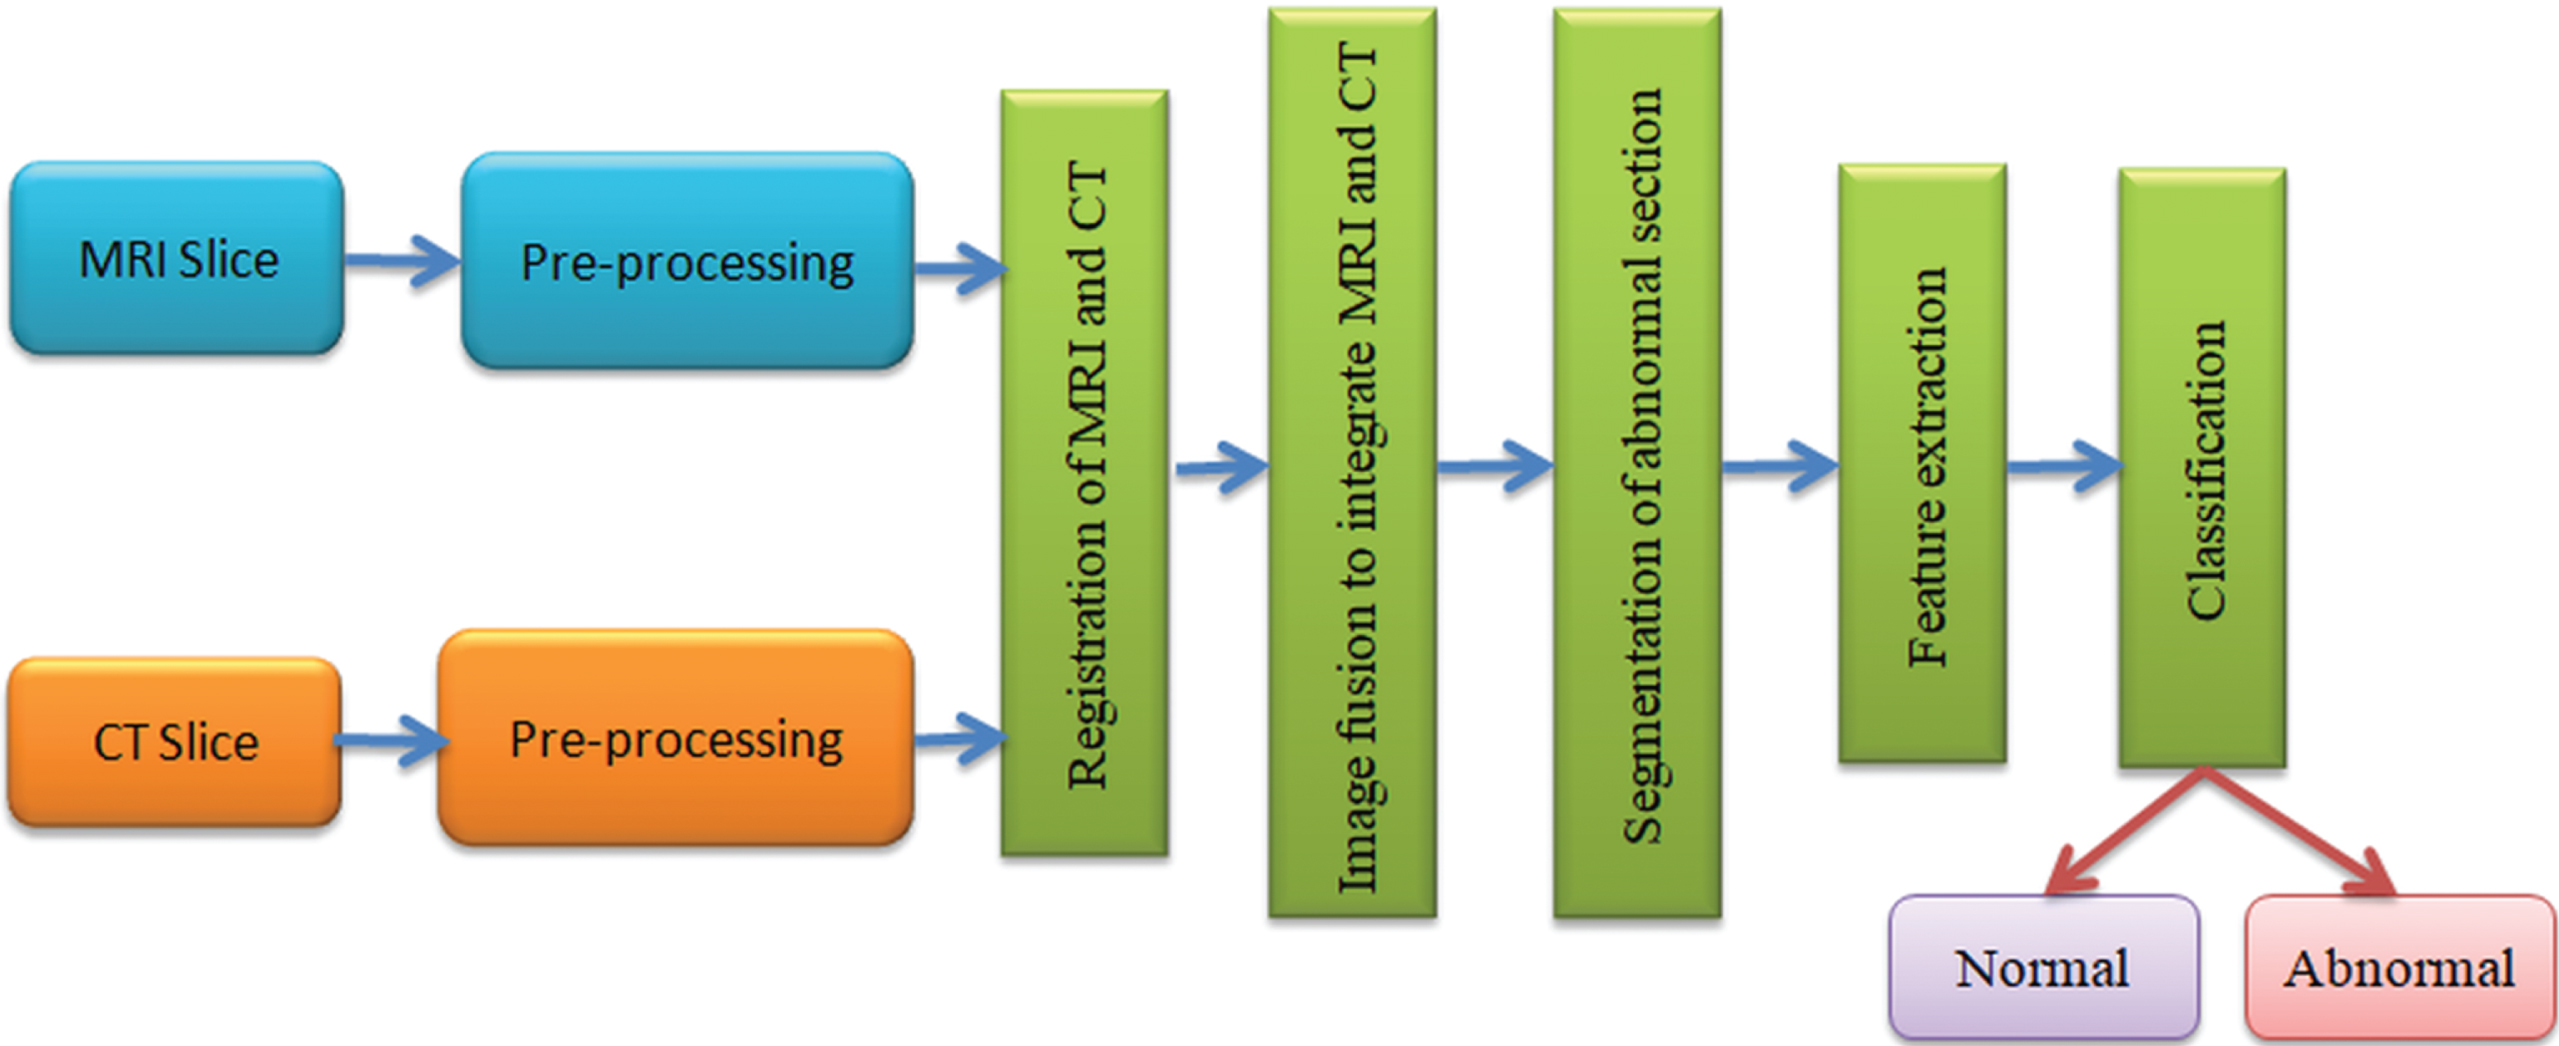
Flow chart of proposed methodology.
The main advantage of this paper is the proposal of a novel image enhancement technique based on Energy-based CLAHE (ECLAHE) algorithm. The main drawback of CLAHE algorithm that is the degradation of edge component due to uniform histogram equalization. This drawback is avoided in this paper. Here, the histogram equalization was applied only to the non-edge regions, so that the edge component is preserved. Another main advantage of the proposed scheme is the incorporation of DCNN and entropy features. The DCNN fusion weights for the fusion of MRI and CT images were determined based on the Siamese network and pixel entropy was computed by finding entropy value of 5×5 block surrounding a particular pixel. Based on these weights, fusion [39] weight was computed using which fusion was performed.
Pre-processing was performed using two steps namely, filtering and enhancement. Image filtering was performed using modified 2D Adaptive Bilateral Filter (M-2D-ABF) and enhancement was performed using a novel Energy-based Contrast Limited Adaptive Histogram Equalization (ECLAHE) algorithm.
Image filtering using modified 2D Adaptive Bilateral Filters (M-2D-ABF)
The input image X ∈ RU×V was filtered with modified 2D Adaptive Bilateral Filter (M-2D-ABF). The output obtained is F ∈ RU×V. The operation of 2D Adaptive Bilateral Filter (2D-ABF) is given by
where x [u, v] represents the input image and f [u, v] refers to the filtered output. Also, H
d
and H
r
represents domain and range filters respectively. These domain and range filters are given by
where [u0, v0] represents the center pixel.
The above two equations were modified by [45] by including an offset component. Thus, the modified 2D Adaptive Bilateral filters (M-2D-ABF) are defined as
The sharpness of the image is controlled by the value of ς. If the value of ς moves close to mean, the image gets more blurred and if the value of ς is moved away from the mean, the image gets sharper.
The filtered images were then enhanced using a novel Energy-based CLAHE (ECLAHE) algorithm. The steps involved in the proposed algorithm are given in Algorithm 1. In traditional CLAHE algorithm, the histogram equalization is performed in a uniform manner, such that the edge components of the image get affected. The idea behind the proposed ECLAHE algorithm is to preserve the edge regions by retaining the regions containing more energy values. That is the image is divided into four groups namely the border blocks (BB), corner blocks (CB), high energy blocks (HEB) and low energy blocks (LEB). Here, the four corner blocks and the border blocks are retained without any histogram normalization similar to CLAHE algorithm. The blocks containing high energy more than a pre-defined threshold are also retained. However, the remaining blocks with low energy are alone processed for histogram equalization.
Registration of MRI and CT images
The pre-processed images cannot be fused directly as they may not have the same alignment and orientation. Registration is a crucial step especially in the case of medical image fusion because the MRI and CT images are captured when the patients are made to lie in a still position [26]. Due to practical conditions both the images may not be perfectly aligned with each other. This misalignment may cause errors in image fusion if proper image registration is not performed. Registration is the method involved in finding a geometric transformation that can align the two input images. Here one image is called moving image and the other is called stationary image. The moving image is aligned with respect to the stationary image [4]. In this work, MRI image is taken as moving image and CT image is taken as stationary image. The transformation of moving image is performed using
where (p, q) are the original coordinates of the moving image and (x, y) are the transformed coordinates. In this work, we have employed mutual information [5] as a metric for finding the transformation matrix for the transformation of the coordinates of the moving image. Mutual information aims at aligning the voxels whose values processes similar probabilities of occurring in the two images.
In this work, we propose a novel image fusion methodology based on the Deep Convolutional Neural Networks (DCNN) and image entropy features. The proposed fusion algorithm is called Siamese Neural Network and Entropy (SNNE) based image fusion algorithm. Here, the DCNN fusion weights for the fusion of MRI and CT images were determined based on the Siamese network and pixel entropy. Siamese network is used for generating fusion scores. The Siamese neural network (SNN) has four convolutional layers, one concatenation layer, two fully connected layers and a final SoftMax layer. The output of the SoftMax layer produces a score value. Let the score value for the Siamese network for MRI and CT images be S M (q, r) and S C (q, r) for pixels at location (q, r). The entropy-based weights at (q, r) are computed by finding entropy value of 5×5 block surrounding pixel at location (q, r). These weights are denoted as E M (q, r) and E C (q, r). Using these two sets of weights, fusion is performed as in Algorithm 2.
For instance, assume that the score value of SNN for MRI image be S
M
(q, r) =8 and that of CT image be S
C
(q, r) =2. Also, assume the entropy value at location (q, r) for MRI image be E
M
(q, r) =18 and for CT image be E
C
(q, r) =6. Then, combined weight for MRI and CT images are T
M
(q, r) =26 and T
C
(q, r) =8 respectively. Then, the fusion weights are computed as
Thus, the fusion is performed using,
In this way, every pixel in the MRI and CT images are fused based on SNN score and entropy values.
The Siamese neural network (SNN) has four convolutional layers, one concatenation layer, two fully connected layers and a final SoftMax layer. The four convolutional layers have a Kernel size of 3×3. The two fully connected layers have a dimension of 256 and 2 respectively. The fully connected layers have a Kernel size of 8×8. The SoftMax layer employed was a 2-way SoftMax function.
The system was trained using 273 input training images. These images were divided into 4×4 overlapping patches and used for training. The training dataset comprised of around 250000 positive training patches and 250000 negative training patches. The training batch size was set as 128 in this work.
Minimization of the loss gradient was performed using Stochastic Gradient Descent function. Loss function optimization was performed using all the 500000 training patches. The variation of loss function for number of iterations is given in Fig. 2. From Fig. 2 we observe that optimization is achieved after 70000 iterations.

Variation of loss function with iteration number.
The fused images contain more information than the individual images. The next step in the proposed methodology is segmentation. In this study, segmentation is performed using clustering and thresholding.
Clustering using Fast Fuzzy C Means Clustering Algorithm (FFCMC)
Fuzzy C Means Clustering (FCMC) is a popularly used technique for segmentation of images since the accuracy of segmentation is better than other segmentation techniques. However, this technique is very slow. In order to overcome this drawback, Fast FCMC [43] was proposed. In this technique, image histogram was used instead of raw image pixels. The objective function is given by,
where, H i refers to the histogram, F iq refers to the fuzzy membership between pixel x i and histogram of cluster with center θ q , D (i, θ q ) refers to the distance between pixel x i and histogram of cluster with center θ q .
Otsu threshold [22] is a popularly used image thresholding technique. This technique identifies a single global threshold that can be used to split the image pixels into two groups namely, the foreground and the background. All image pixels whose values are greater than this threshold are rendered as foreground and the other pixels are rendered as the background pixels.
Feature extraction
In this work, we have extracted intensity histogram based features [34] and Gray-Level Co-Occurrence Matrix features [46]. The intensity histogram-based features included mean, variance, skewness, kurtosis and entropy. GLCM feature exploits the special relationship between two pixels that are spaced by a particular distance in an image. The GLCM feature has a rapidly changing value in fine texture regions and a slowly changing value in the coarse texture regions. It is computed as
From the GLCM matrix, several statistical features like contrast, energy, homogeneity, correlation were extracted.
Using the segmentation results, classification of the segmented brain images is performed using Logistic Regression [33] model. We have employed ten-fold cross validation technique in which the dataset is divided into ten equal parts and evaluation is done. During the training phase, a logistic regression model is generated using the training dataset. The classification is then performed using the testing dataset and the trained classification model. In logistic regression, a feature vector v = (v1, v2, … v
q
) is classified to a class label l ∈ {0, 1} using
where β = (β1, β2, …, β q ) represents the weight vector and β0 represents the intercept value. A test data sample is classified to a particular class by first evaluating the two probabilities namely the, P (l = 0/v) and P (l = 1/v) and then assigning to the class that has a higher probability.
Parameter settings
The proposed system was simulated using MATLAB software running on windows intel i3 core processor with 8GB RAM. Four different MRI and CT image pairs were considered for analysis in this study. The value of threshold α in Algorithm 1 was selected as 0.8. The value of block size b in the Algorithm 1 was set as 5. To evaluate the classification performance, metrics like overall accuracy, recall, precision, specificity and F-score were employed. For evaluation of the classification algorithm, we employed the Anatomical Tracings of Lesions After Stroke (ATLAS) dataset [17] that consists of 304 images. The dataset can be accessed at http://atlas.cern/resources/opendata. We performed 10-fold cross validation in which 273 images were used for training and 31 images were used for testing. The entire process was repeated 10 times until all the images were tested.
Simulation results
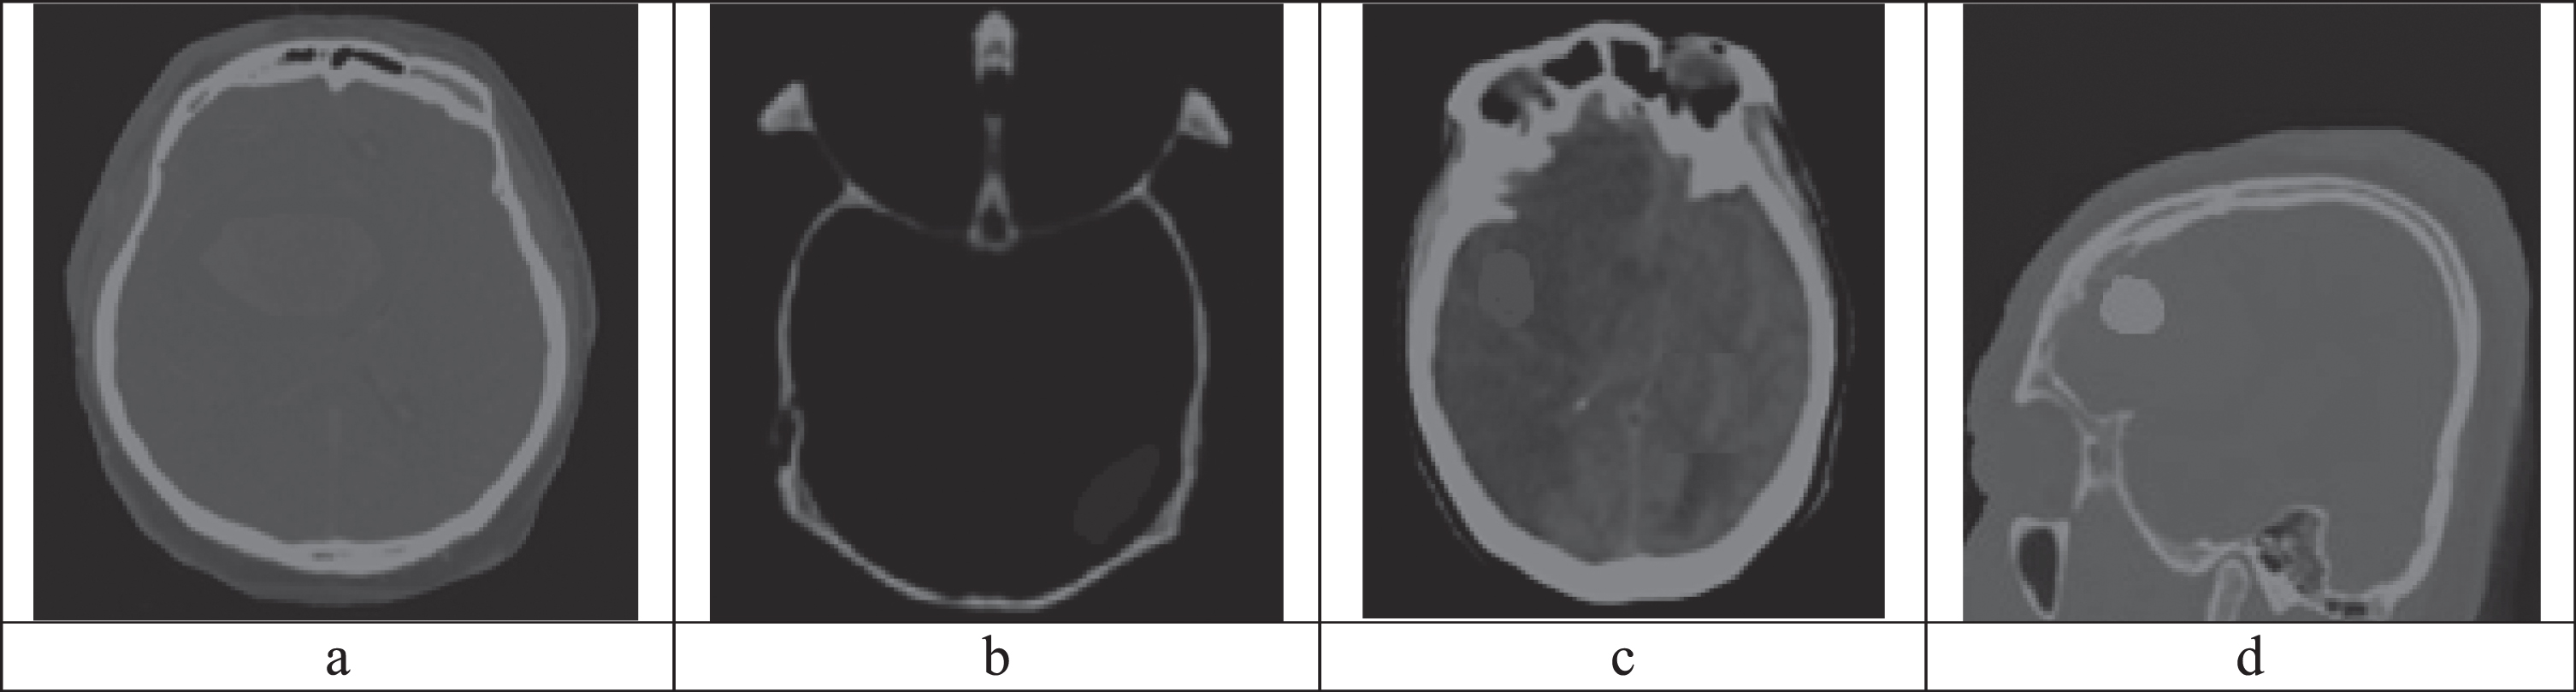
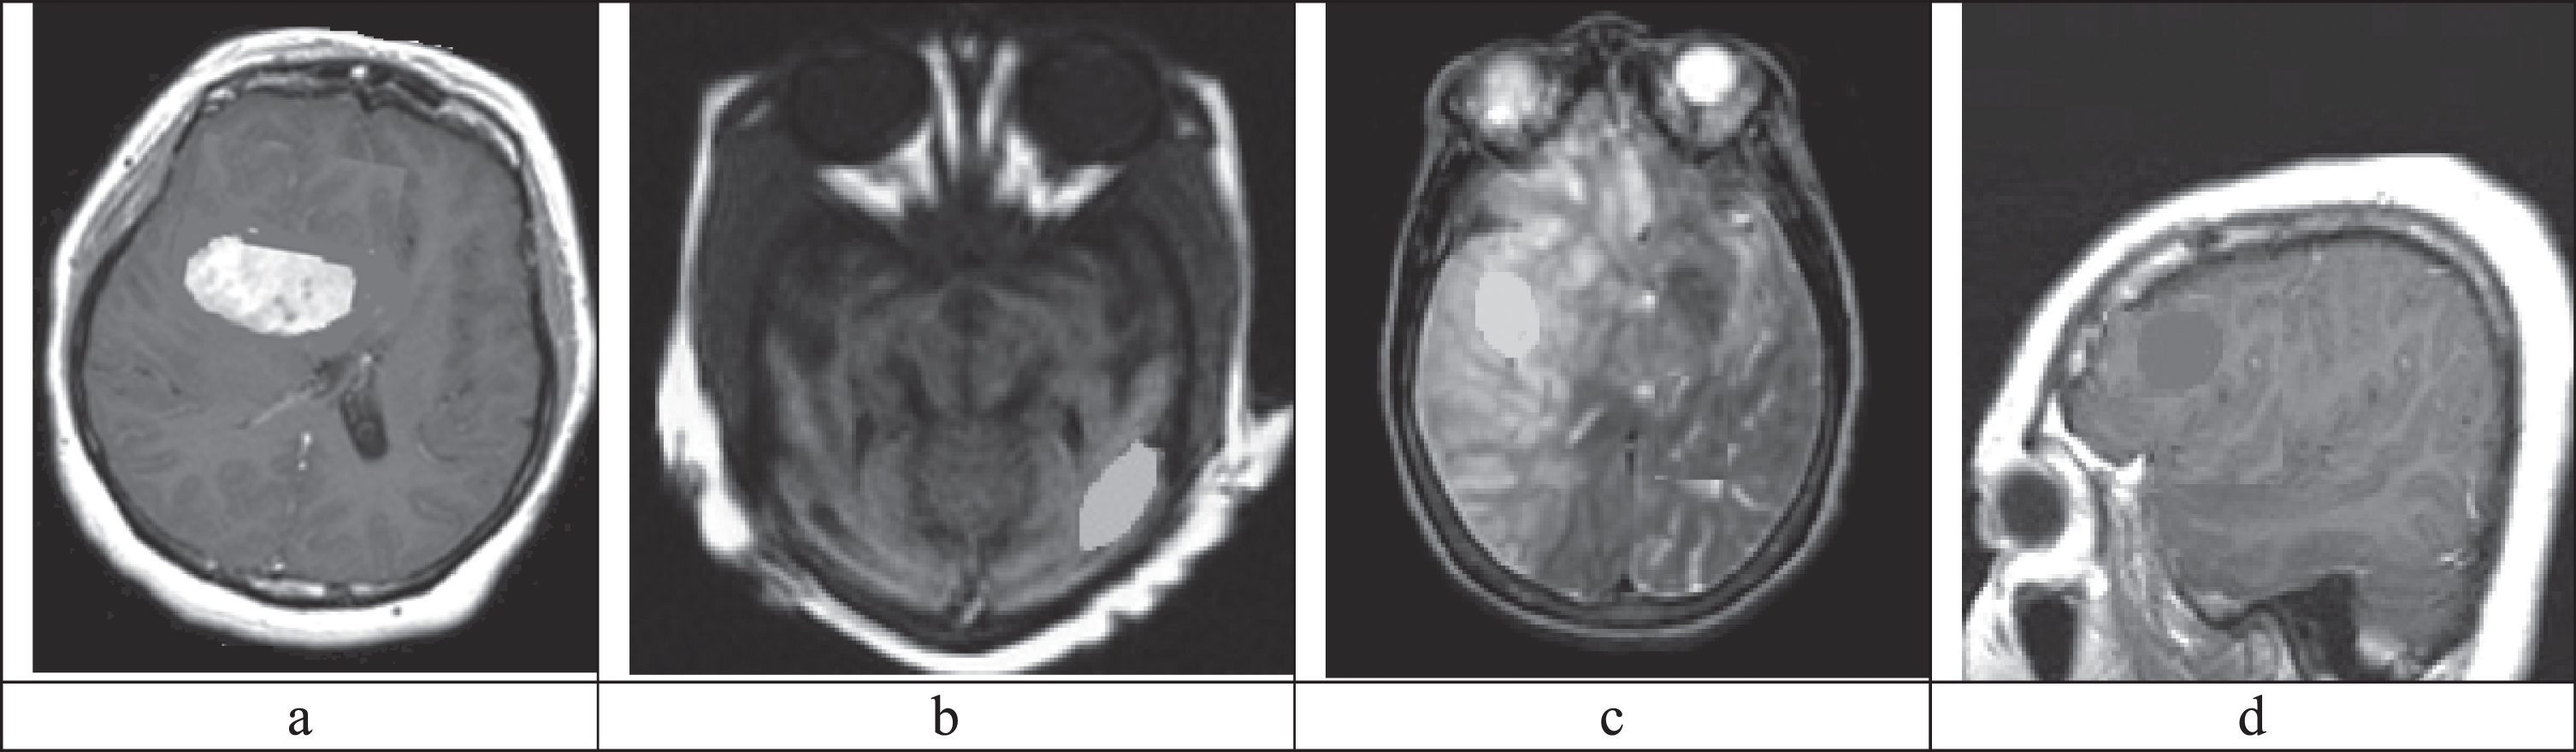
Figure 3 and Fig. 4 shows the sample input MRI and CT images respectively. From these Figs, it can be visually observed that the images are noisy. Hence, they are pre-processed using filtering and enhancement techniques.
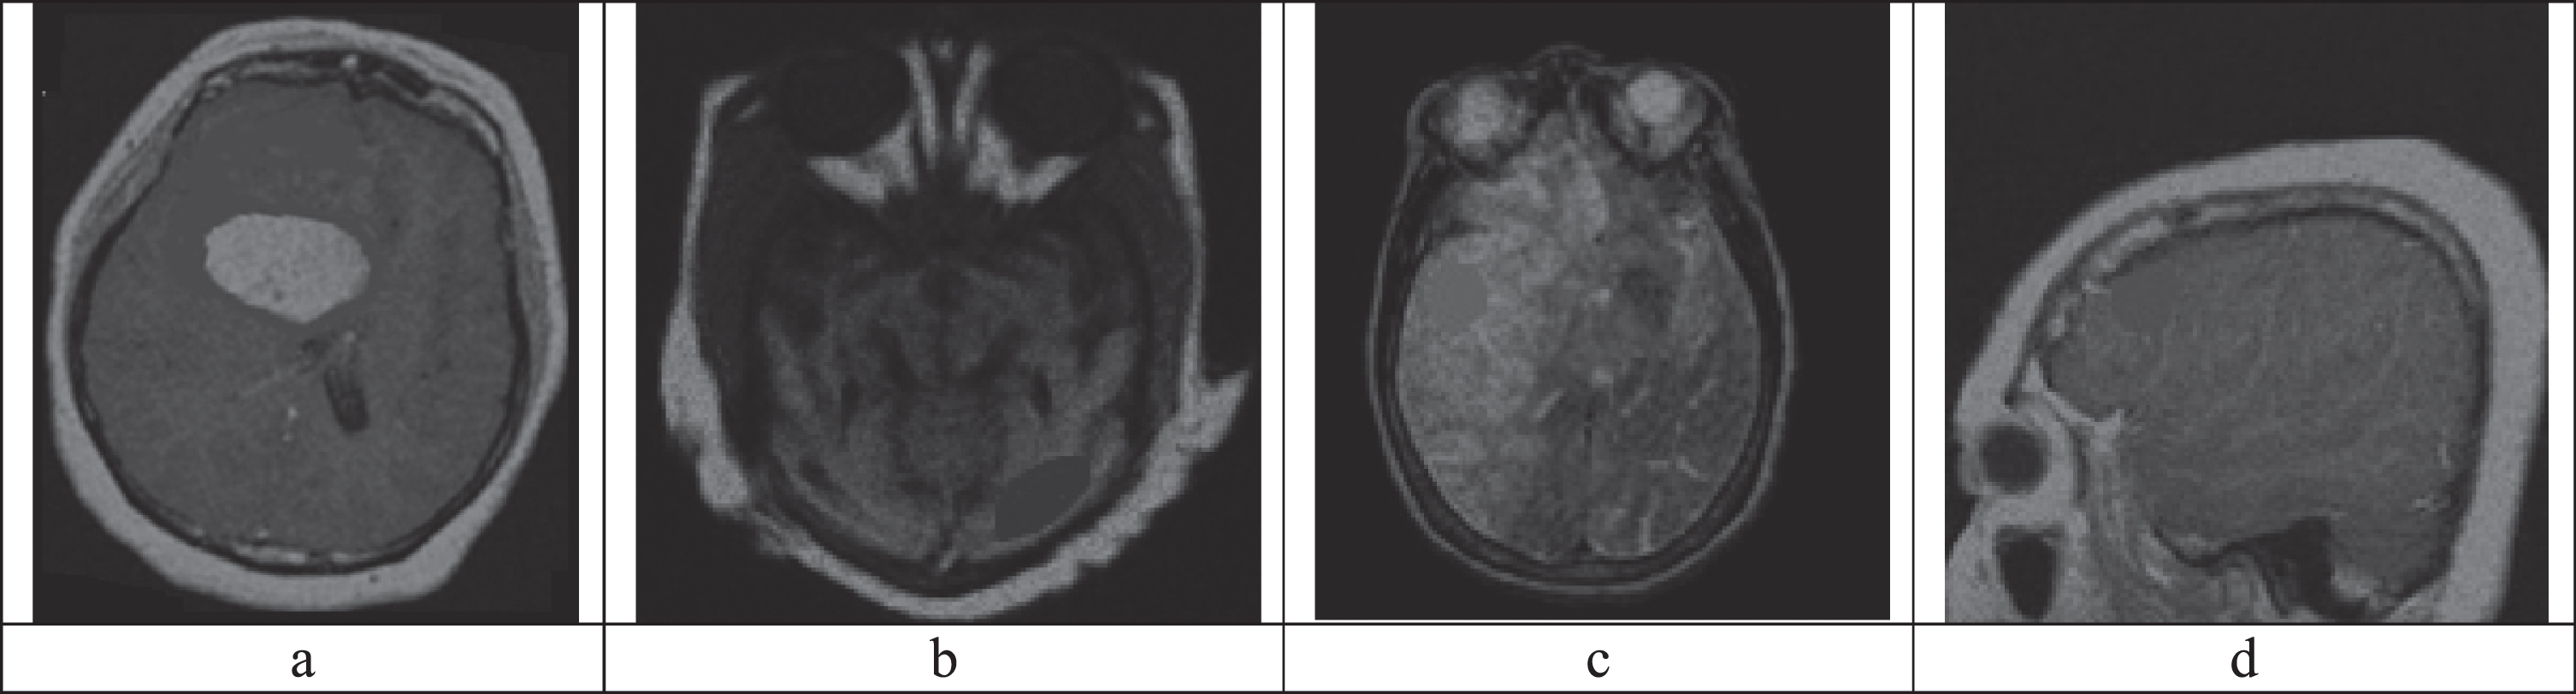
(a)Noisy MRI image 1, (b) Noisy MRI image 2, (c) Noisy MRI image 3, (d) Noisy MRI image 4.
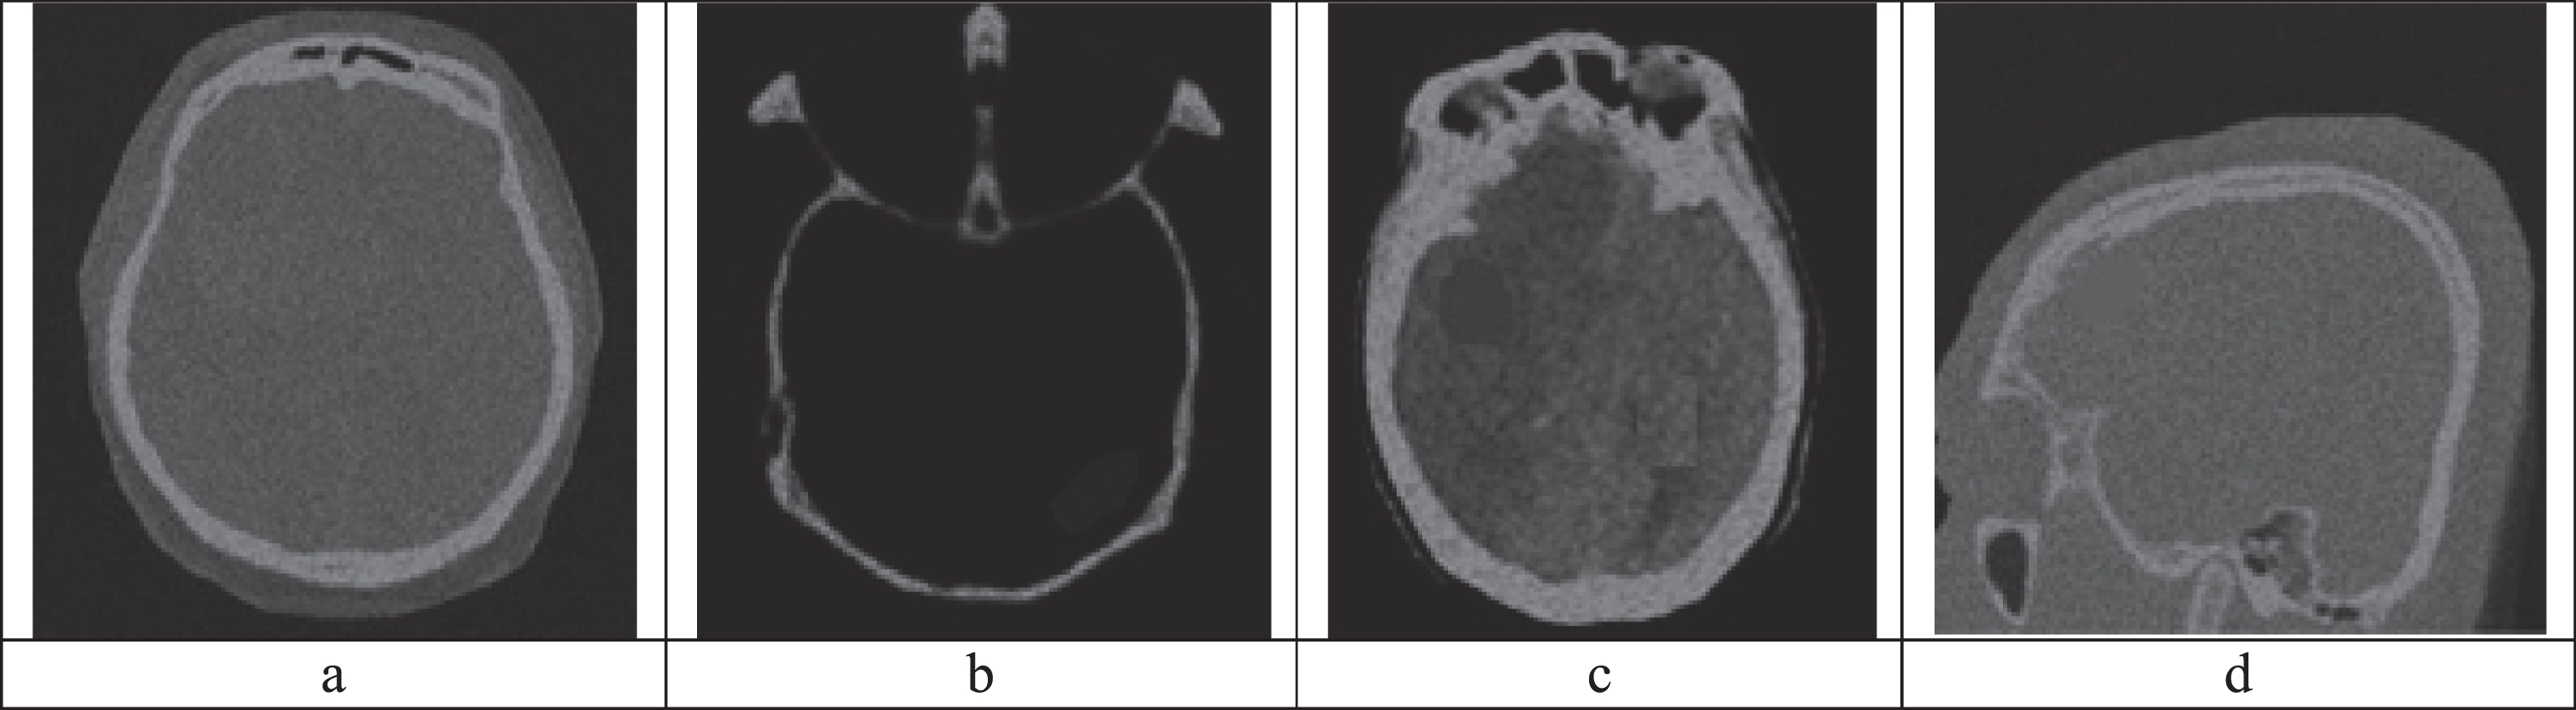
(a) Noisy CT image 1, (b) Noisy CT image 2, (c) Noisy CT image 3, (d) Noisy CT image 4.
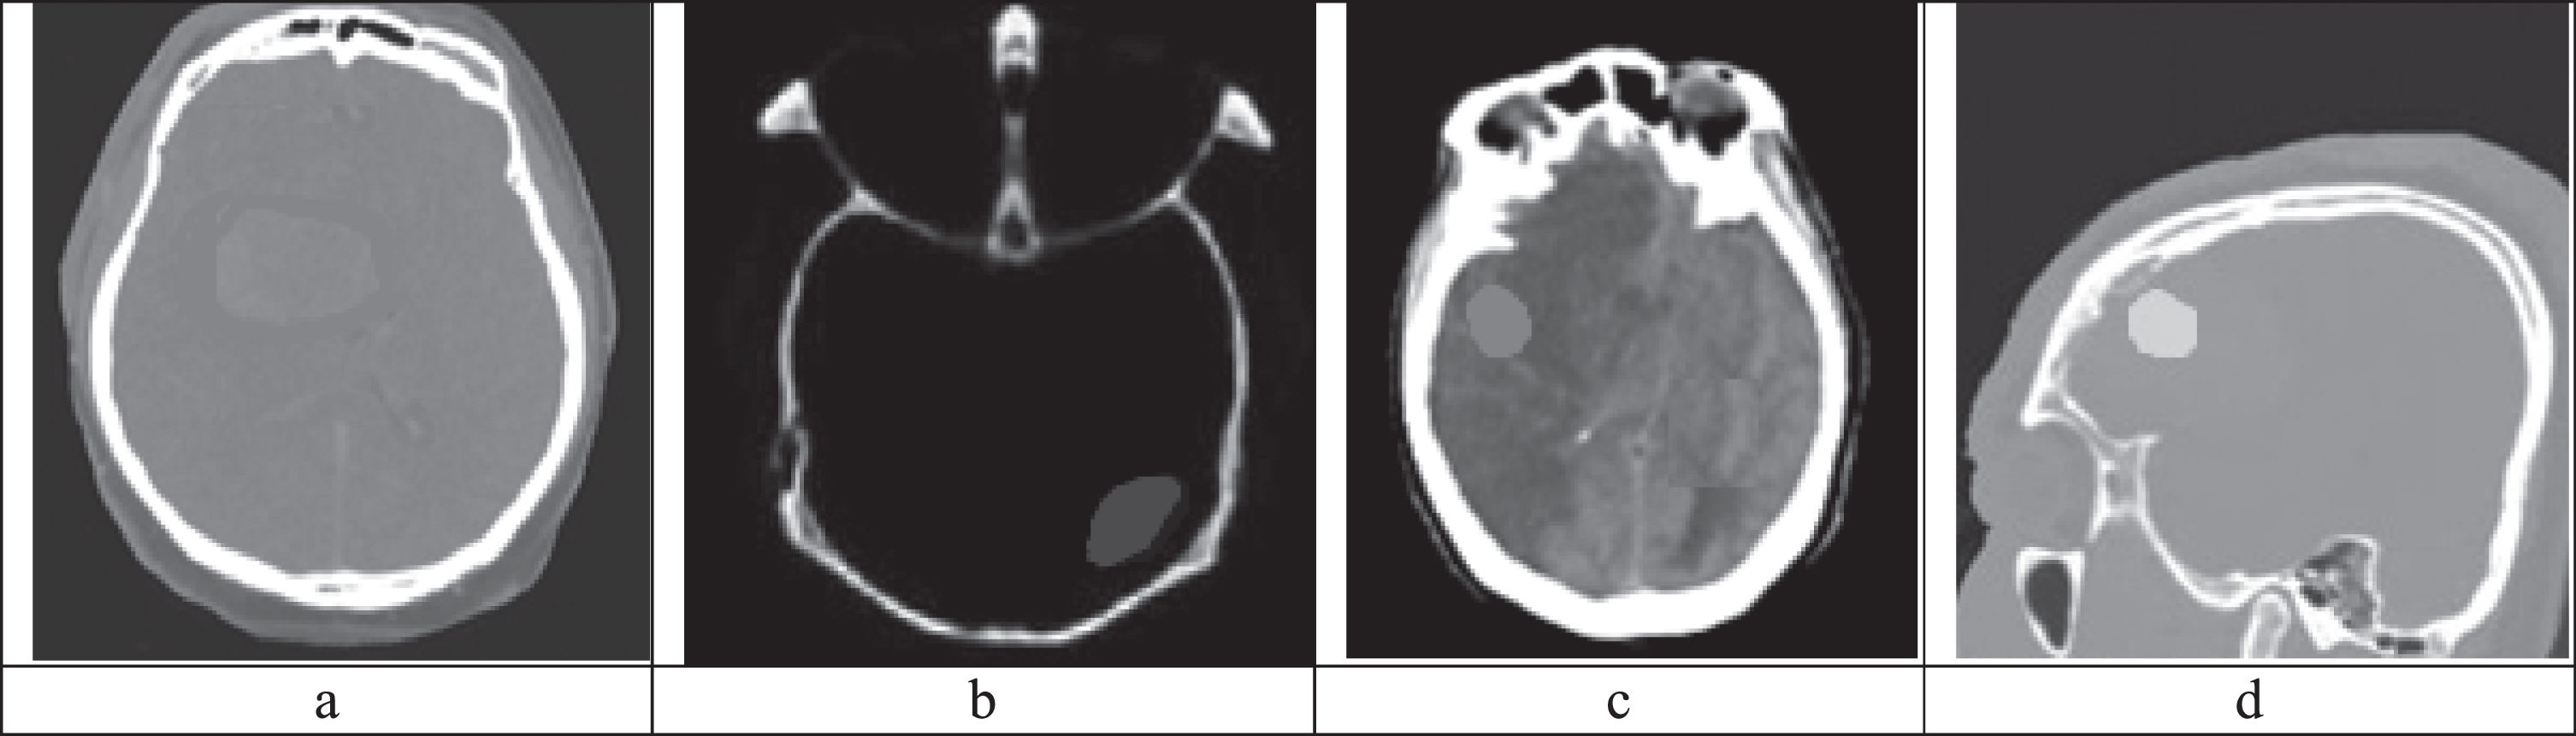
Figure 5 and Fig. 6 shows MRI and CT images that are filtered using M-2D-ABF filter. From these Figs we infer that the filtered images have less noise compared to the original images.
(a) M-2D-ABF filtered MRI image 1, (b) M-2D-ABF filtered MRI image 2, (c) M-2D-ABF filtered MRI image 3, (d) M-2D-ABF filtered MRI image 4.
(a) M-2D-ABF filtered CT image 1, (b) M-2D-ABF filtered CT image 2, (c) M-2D-ABF filtered CT image 3, (d) M-2D-ABF filtered CT image 4.
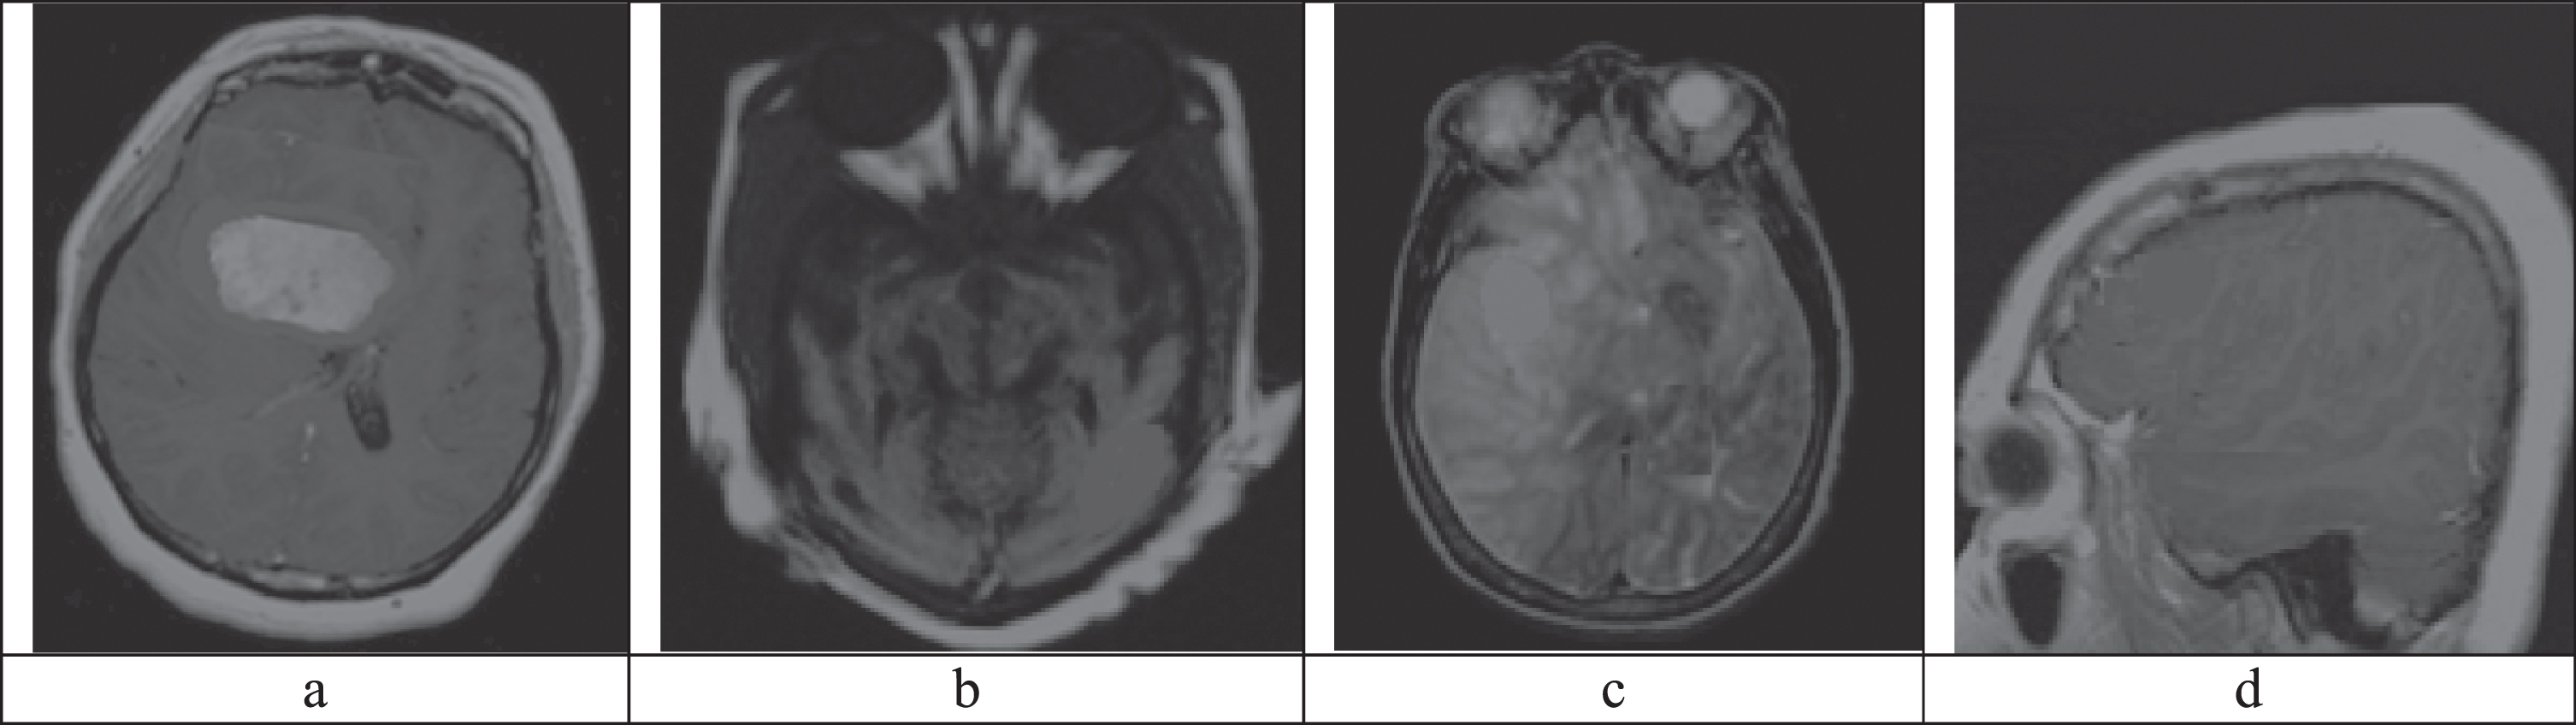
Figure 7 and Fig. 8 shows the MRI and CT images enhanced using ECLAHE algorithm. From Fig. 7 and Fig. 8, it is obvious that the enhanced images have better visual clarity compared to the original images.
(a) ECLAHE enhanced MRI image 1, (b) ECLAHE enhanced MRI image 2, (c) ECLAHE enhanced MRI image 3, (d) ECLAHE enhanced MRI image 4.
(a) ECLAHE enhanced CT image 1, (b) ECLAHE enhanced CT image 2, (c) ECLAHE enhanced CT image 3, (d) ECLAHE enhanced CT image 4.
Figure 9 shows an example pair of misaligned MRI and CT images. From Fig. 9, it is evident that, these two images cannot be fused directly as the orientation of the two images are different. Figure 9 (c) shows the registered MRI image.
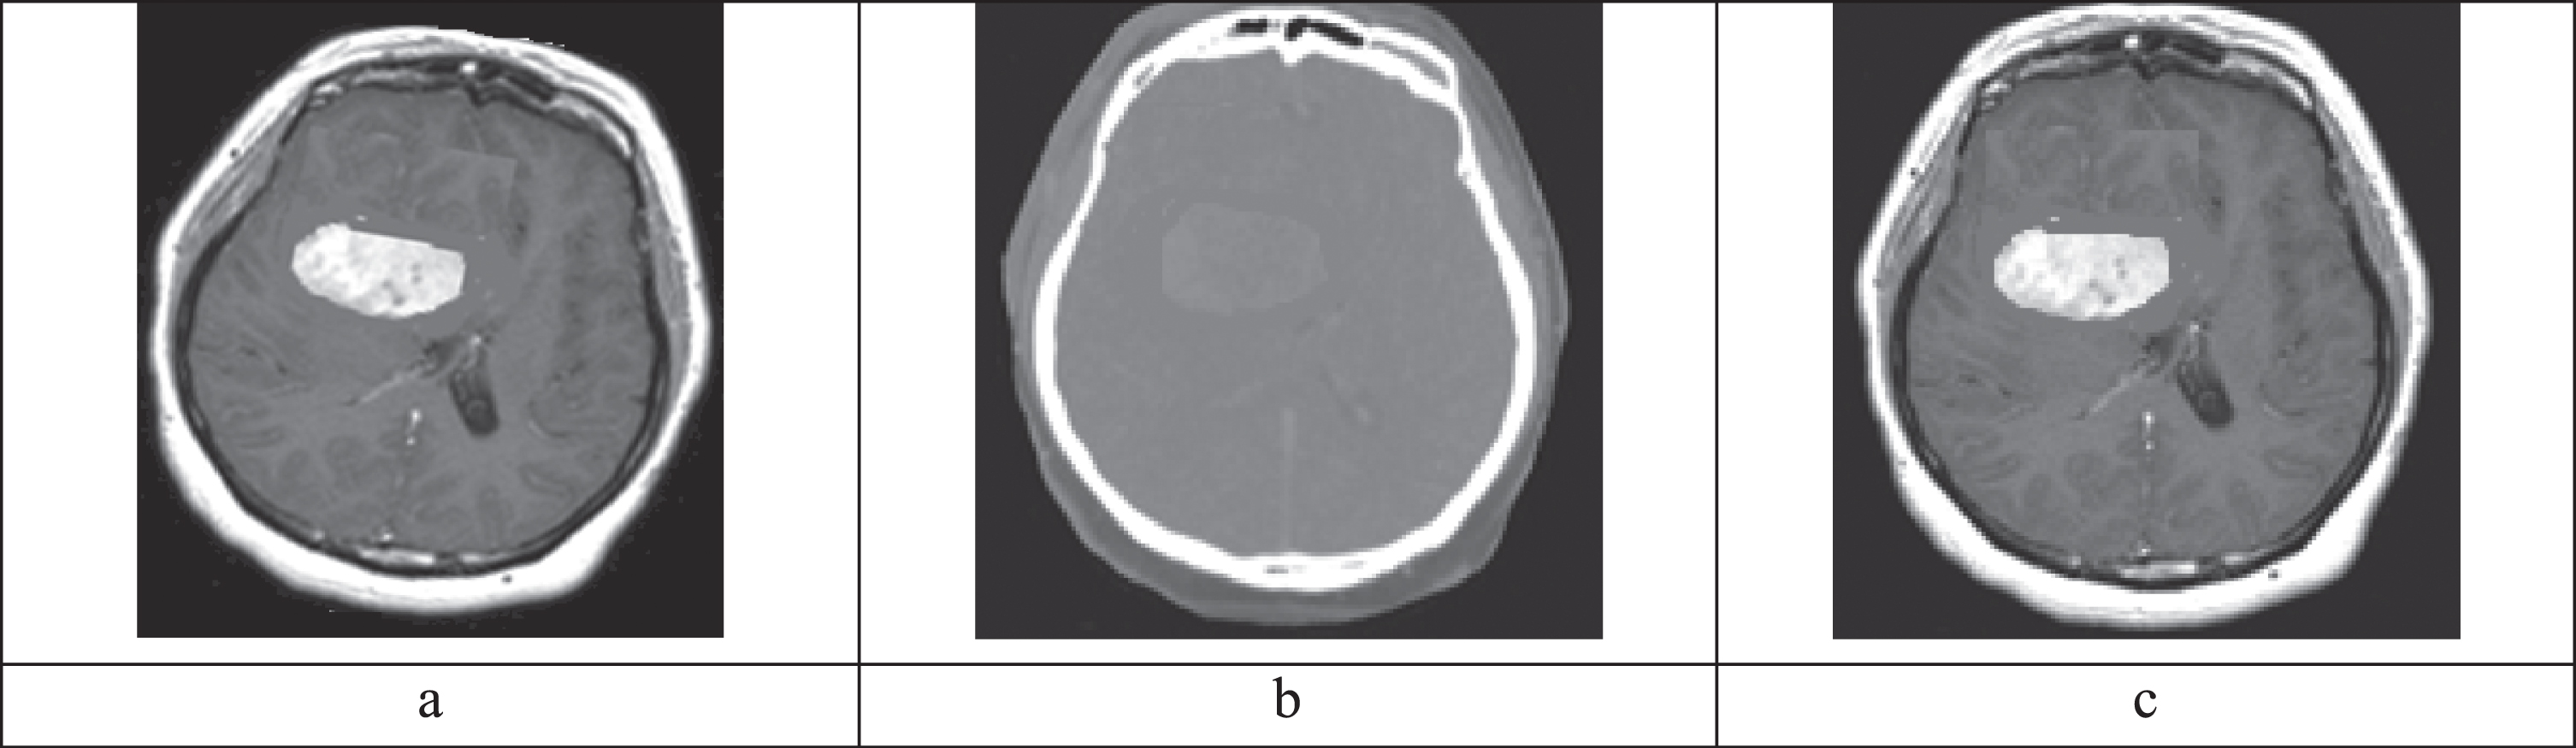
(a) Misaligned MRI image, (b) Misaligned CT image (c) Registered MRI image.
Figure 10 shows the images that depict the proposed SNNE algorithm results. The first two images are the input to the fusion algorithm. The final image is the fusion result. From the third image, we clearly see that the proposed algorithm produces excellent fusion result that contains the complimentary information from the two input images belonging to different modalities.

(a) MRI image, (b) CT image, (c)Fusion result using proposed SNNE algorithm.
Figure 11 shows the segmentation results using FFCMC clustering and Otsu thresholding. The segmentation results clearly show the regions containing the tumor cells. From these segmented regions, classification is performed using logistic regression classifier.
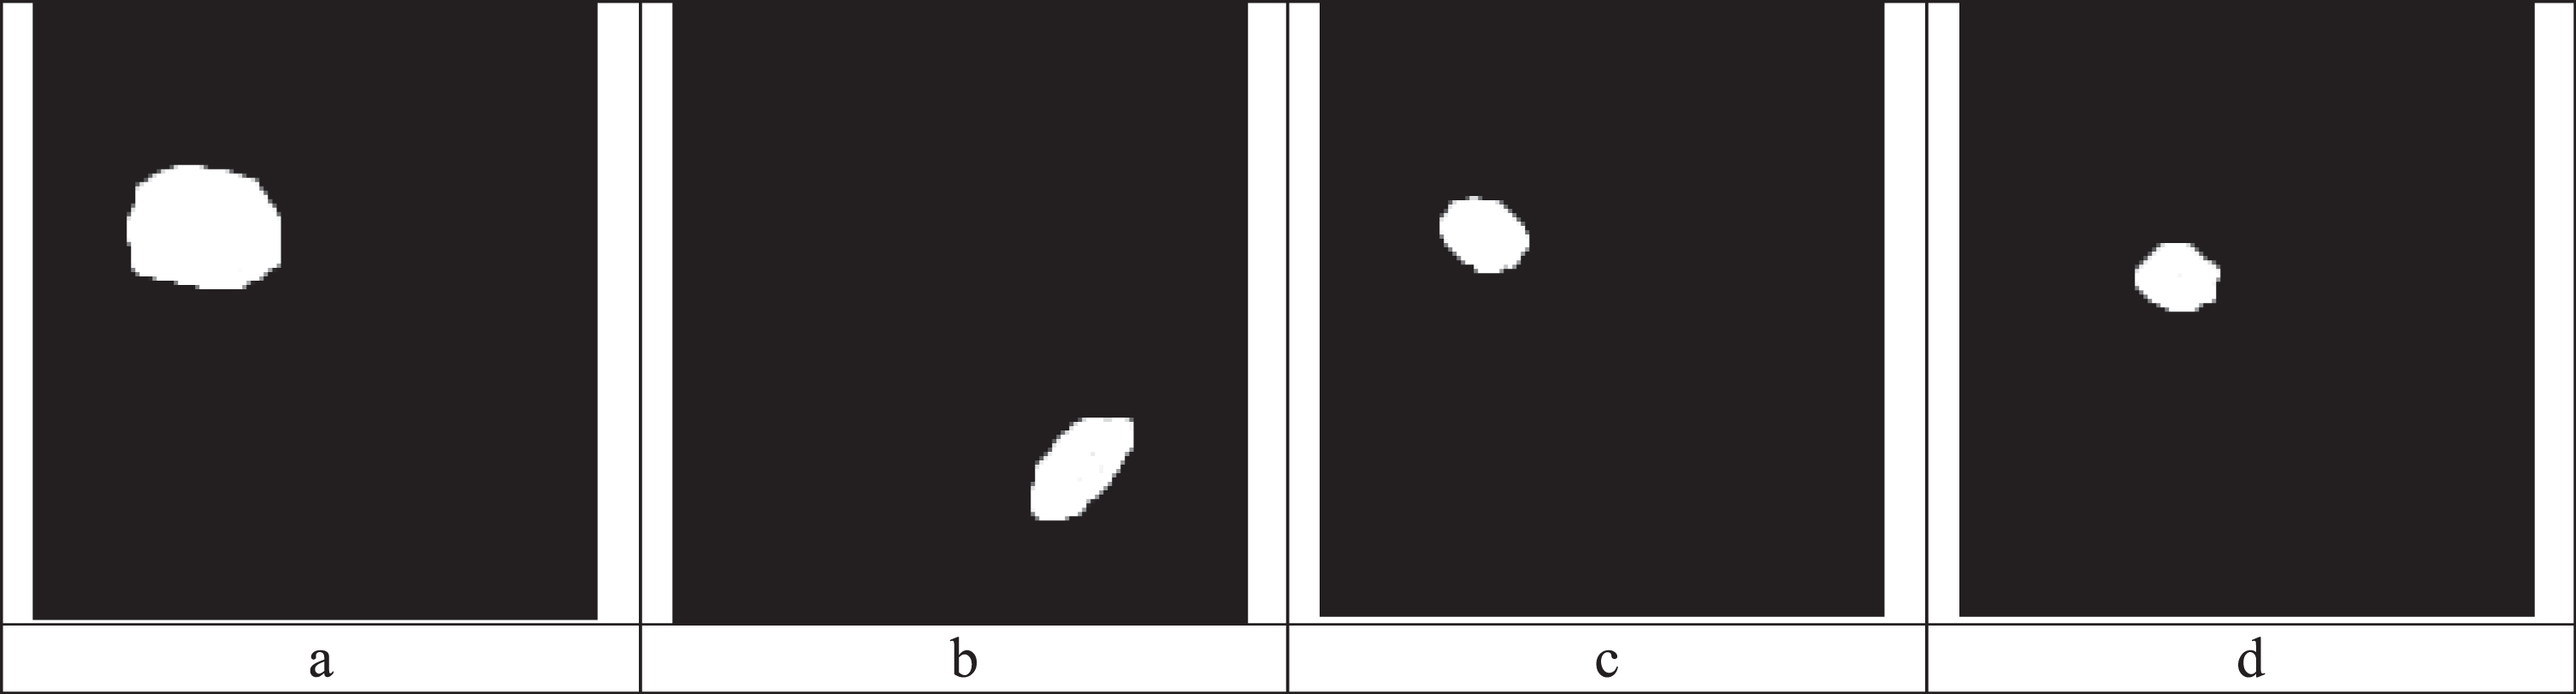
(a) Segmentation result of Image pair 1, (b) Segmentation result of Image pair 2, (c) Segmentation result of Image pair 3, (d) Segmentation result of Image pair 4.
BRATs 2015 is a well-known dataset for brain abnormalities investigation. The dataset contains axial brain MR slices with T2, T1c and FLAIR modalities. The dataset comprises the following properties listed in Table 1 (Image dimension: 216×160×3, Number of images: 1000, Modality: FLAIR|T2|T1C, Bit Depth: 8). The advantage of using BRATs MR series dataset is that, it holds expert ground truth (GT) information. The ground truth evidence helps in assessing the segmentation process of computer assisted procedure by analyzing the image similarity between the two images.
BRATs 2015 Dataset
BRATs 2015 Dataset
Similar procedure is directed towards MR series of BRATS 2015 dataset. The test images of Flair and T2 modalities to be evaluated and its corresponding ground truth is shown in Fig. 12. The MRI images are initially subjected to M-2D-ABF filter then enhanced using ECLAHE algorithm. The generated images from the above process contain less noise and offers better visualization.
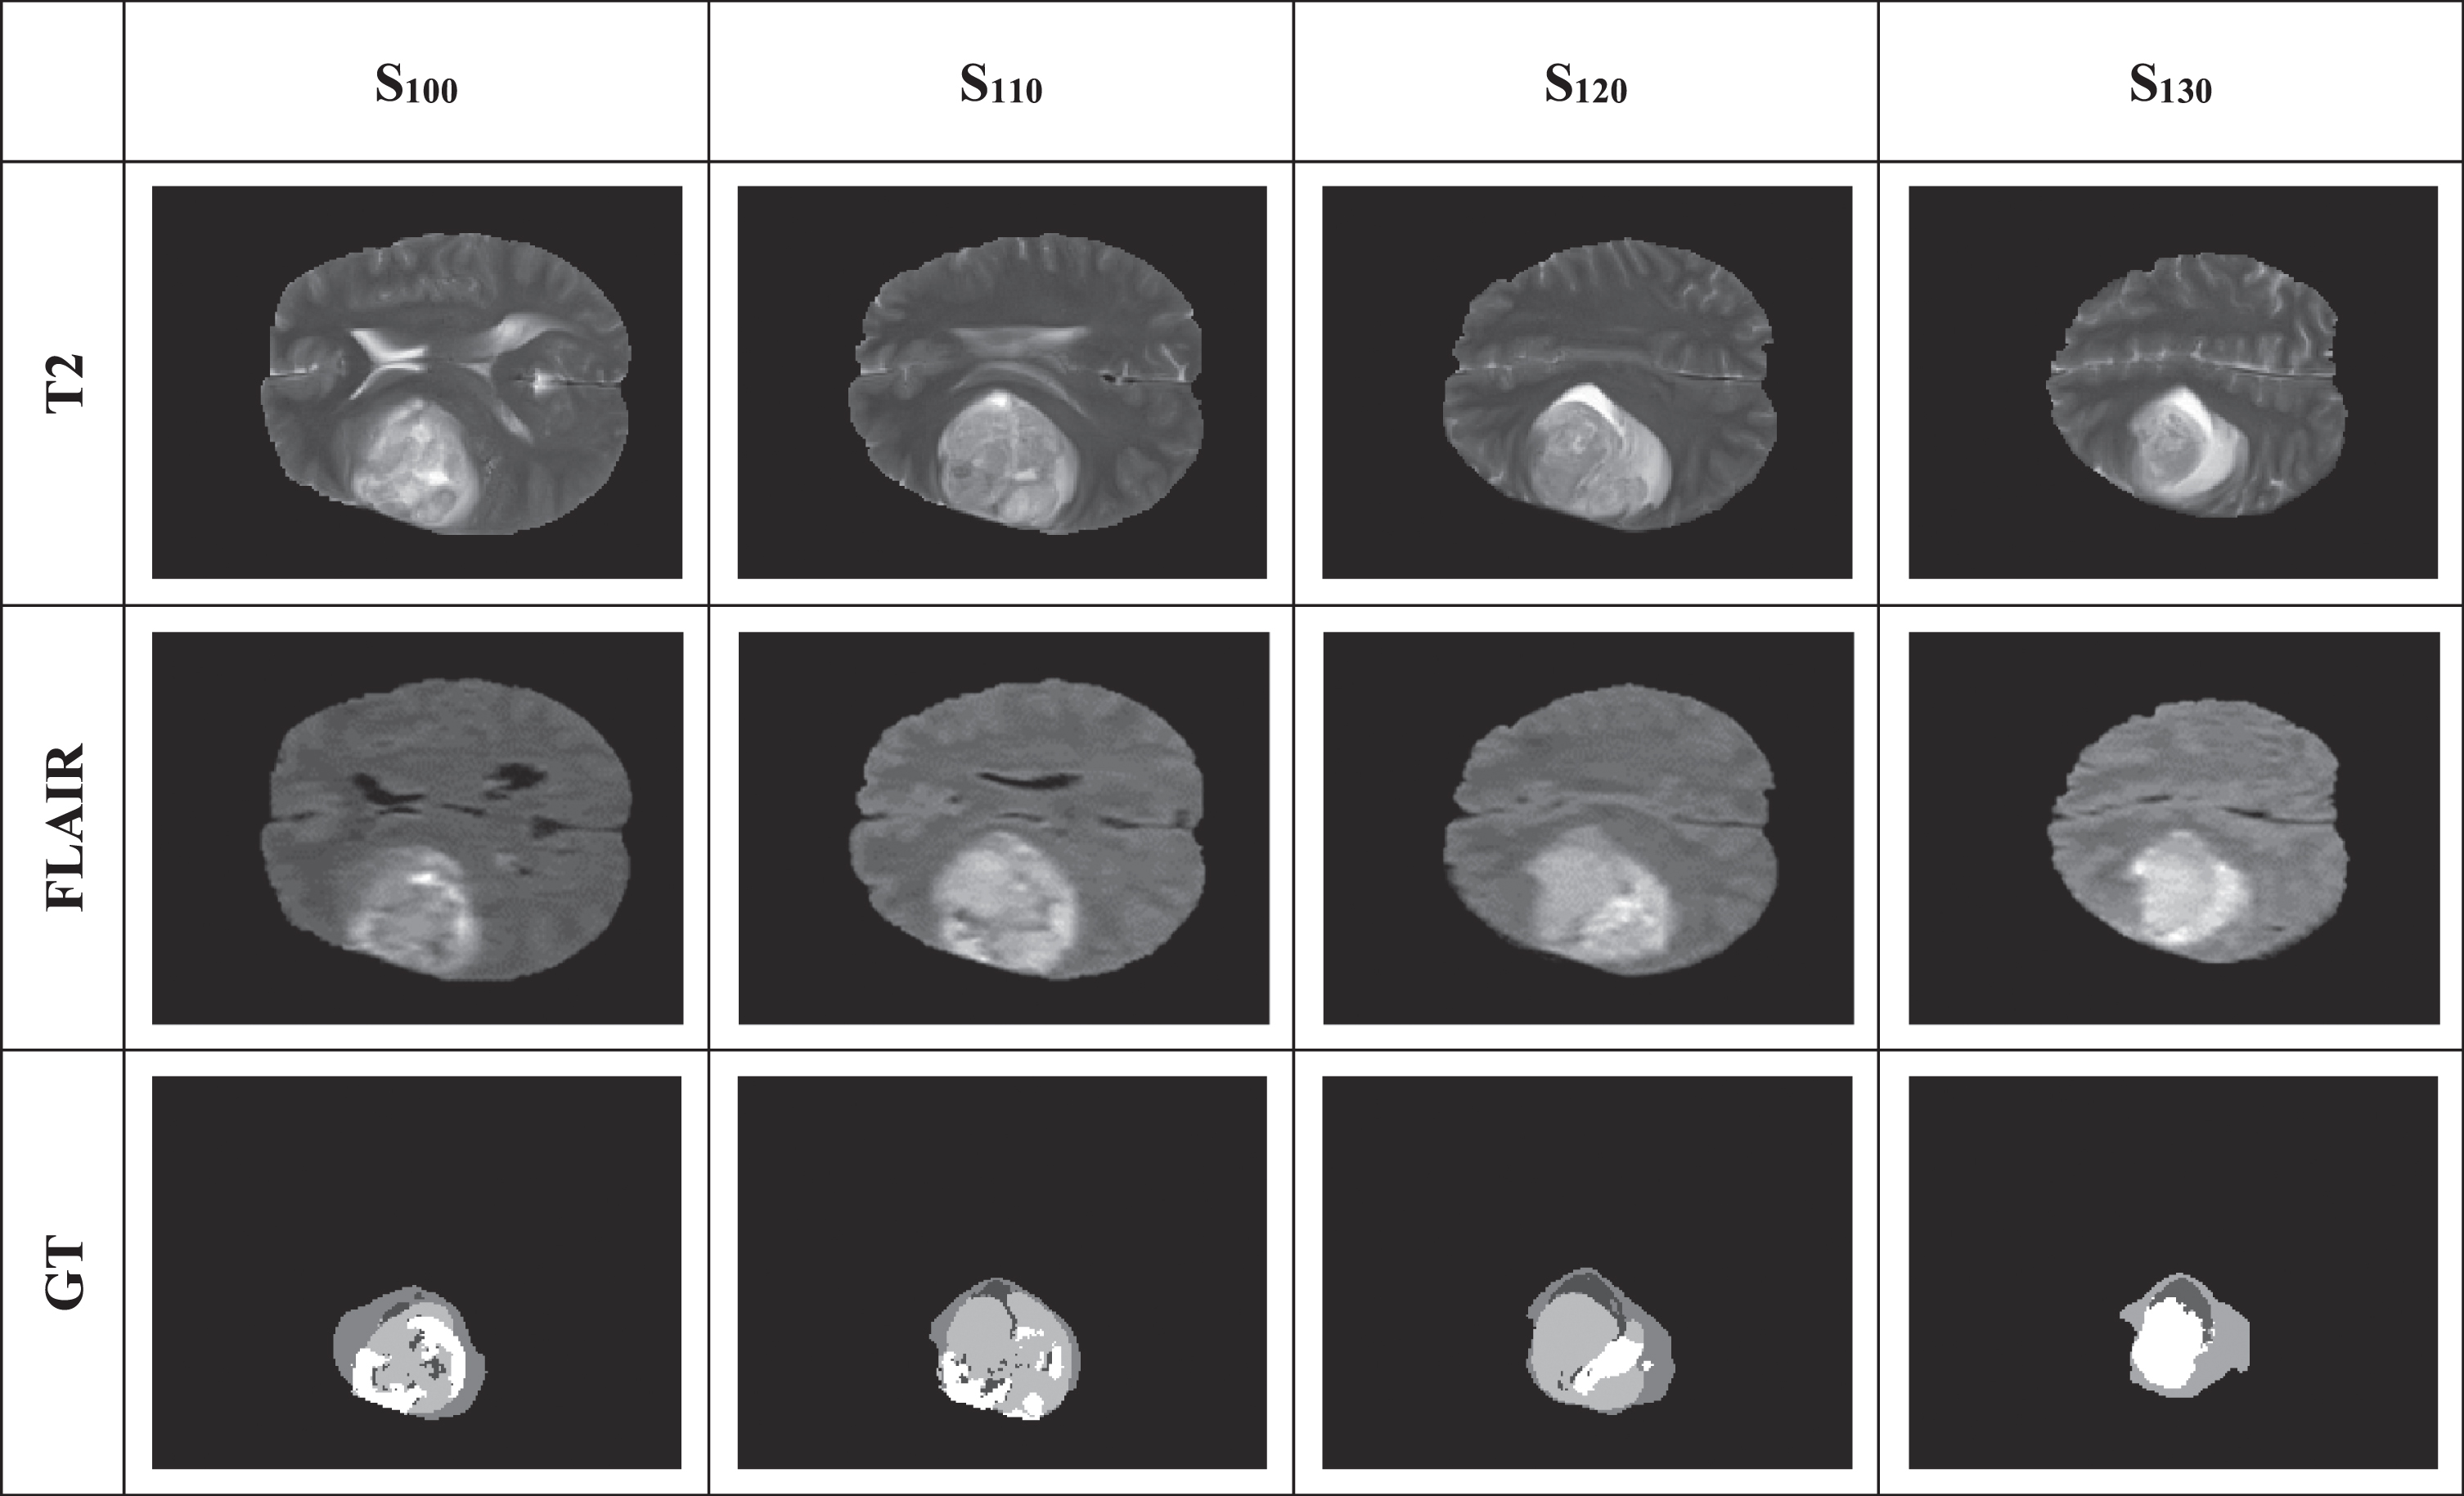
BRATS MR Series.
Figure 13 shows the fusion and segmentation results of the proposed SNNE algorithm. The FLAIR and T2 modalities of BRATs MR series is subjected to the fusion algorithm. The resultant image encloses the fused image of T2 and FLAIR modality. The segmentation results clearly depict that the proposed algorithm produces outstanding fusion results and it is reflected in the segmentation process in extracting the tumor core intensities.

Results of BRATS MR series. (a) Fusion result using proposed SNNE algorithm. (b) Segmentation results using FFCMC clustering and Otsu thresholding.
Evaluation of Proposed Pre-processing (M-2D-ABF-ECLAHE) Algorithms
Table 2 shows the performance evaluation using mean square error. Evaluation was performed for the four pairs of datasets shown in the Fig. 2 and Fig. 3. They are denoted as Image Pair 1 (IP1), Image Pair 2 (IP2), Image Pair 3 (IP3) and Image Pair 4 (IP4). From Table 1 we see that, the average value of MSE for a combination of2D median filter [32] with CLAHE [37] algorithm is 5.86. Similarly, the average value of MSE for a combination of 2D Adaptive Median Filter [1] with CLAHE algorithm is 3.07. However, our M-2D-ABF Filter with proposed ECLAHE algorithm produces a very low MSE of 0.91. Thus, our proposed pre-processing technique achieves best performance in terms of MSE.
Performance evaluation using Mean Square Error
Performance evaluation using Mean Square Error
Table 3 shows the performance evaluation using mean PSNR. From Table 3 we see that, the average value of PSNR for a combination of 2D Median Filter with CLAHE algorithm is 20.21. Similarly, the average value of PSNR for a combination of 2D Adaptive Median Filter with CLAHE algorithm is 24.40. However, our M-2D-ABF Filter with proposed ECLAHE algorithm produces a very high PSRN of 34.39. Thus, our proposed pre-processing technique achieves best performance in terms of PSNR.
Performance evaluation using PSNR
The proposed fusion methodology employs Siamese Neural Network (SNN) architecture. The convergence graph of the proposed SNN architecture is shown in Fig. 14. This graph shows the variation of loss and accuracy per epoch. From these plots, we observe that the SNN model has a comparable performance for the training and testing datasets in terms of loss and accuracy. These graphs also depict that the proposed SSN model has a good fit.

Convergence graph of SNN architecture.
The proposed fusion methodology is evaluated using the following metrics:
Entropy [16] is the information content of the fused image. It is computed as
where F p is the probability of intensity p in the fused image F.
Standard deviation [12] measures the overall contrast factor. It is computed as
where μ is the mean. Higher values of standard deviation indicate better contrast factor in the fusion output.
MSE gives the average difference between the original image O and the fused image F after applying the proposed fusion methodology. It is given by
PSNR gives the fraction of actual signal value to the error value. It is calculated as
The metric SSIM [41]measures the luminance, contrast and structural similarities between two images and is given by,
The default value for C1 and C2 are 0.01 and 0.03. The maximum SSIM value is 1.
Homogeneity indicates the structural similarity of an image. It is computes as
Table 4 to Table 7 clearly shows the results obtained for various fusion methodologies proposed in the literature using Image Pair 1 to Image Pair 4 respectively. From these tables, it is clear that the proposed Siamese Neural Network and Entropy (SNNE) based fusion technique produces outstanding results in terms of various metrics. The efficacy of the proposed fusion technique is clearly seen from Table 4 to Table 7. For all the four image pairs, our system produces excellent results in terms of all the fusion performance evaluation metrics.
Quantitative Metrics for Image Pair 1
Quantitative Metrics for Image Pair 2
Quantitative Metrics for Image Pair 3
Quantitative Metrics for Image Pair 4
The classification is also performed using traditional algorithms like k-nearest neighbour (k-NN), Naïve Bayes (NB), Random Forest (RF), support vector machine (SVM) for comparison.
The confusion matrix obtained for the logistic regression classification scheme is shown in Table 7. From Table 8 we infer that the overall accuracy of the logistic regression classifier is 97.37%.
Confusion matrix of logistic regression classifier
Confusion matrix of logistic regression classifier
Table 9 shows the results obtained in terms of overall accuracy. From Table 9, we see that Logistic Regression (LR) algorithm produces the best results compared to all other traditional classification algorithms.
Comparison of Overall Accuracy
Figure 15 represents the comparison of specificity for the ATLAS dataset. Form Fig. 15 we see that the value of specificity obtained byk-NN, NB, RF, SVM and LR are 88.12, 89.31, 91.39, 94.52 and 96.52 respectively. Thus, it is clearly seen that LR outperforms other algorithms.
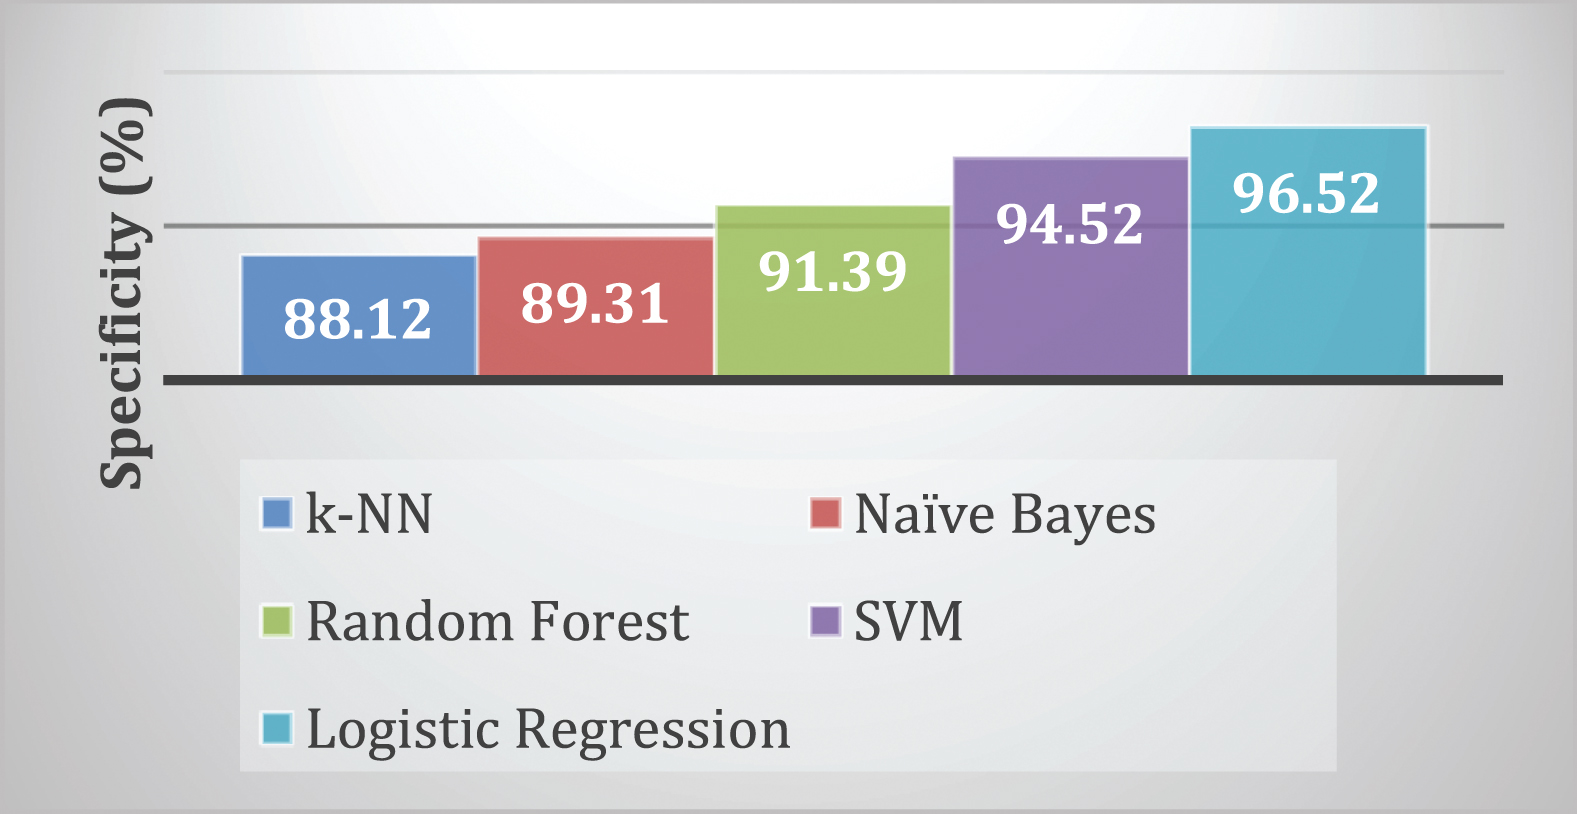
Comparison of specificity.
Figure 16 represents the comparison of precision. Form Fig. 16 we see that the average value of precision obtained by k-NN, NB, RF, SVM and LR are 86.13, 88.22, 90.36, 93.69 and 96.65 respectively. Thus, it is clearly seen that LR is the best compared to other algorithms.

Comparison of precision.
Figure 17 represents the comparison of recall. Form Fig. 17, we see that the average value of recall obtained by k-NN, NB, RF, SVM and LR are 89.23, 90.12, 92.96, 93.42 and 96.93 respectively. Thus, it is clearly seen that LR performs better that other traditional classification algorithms.
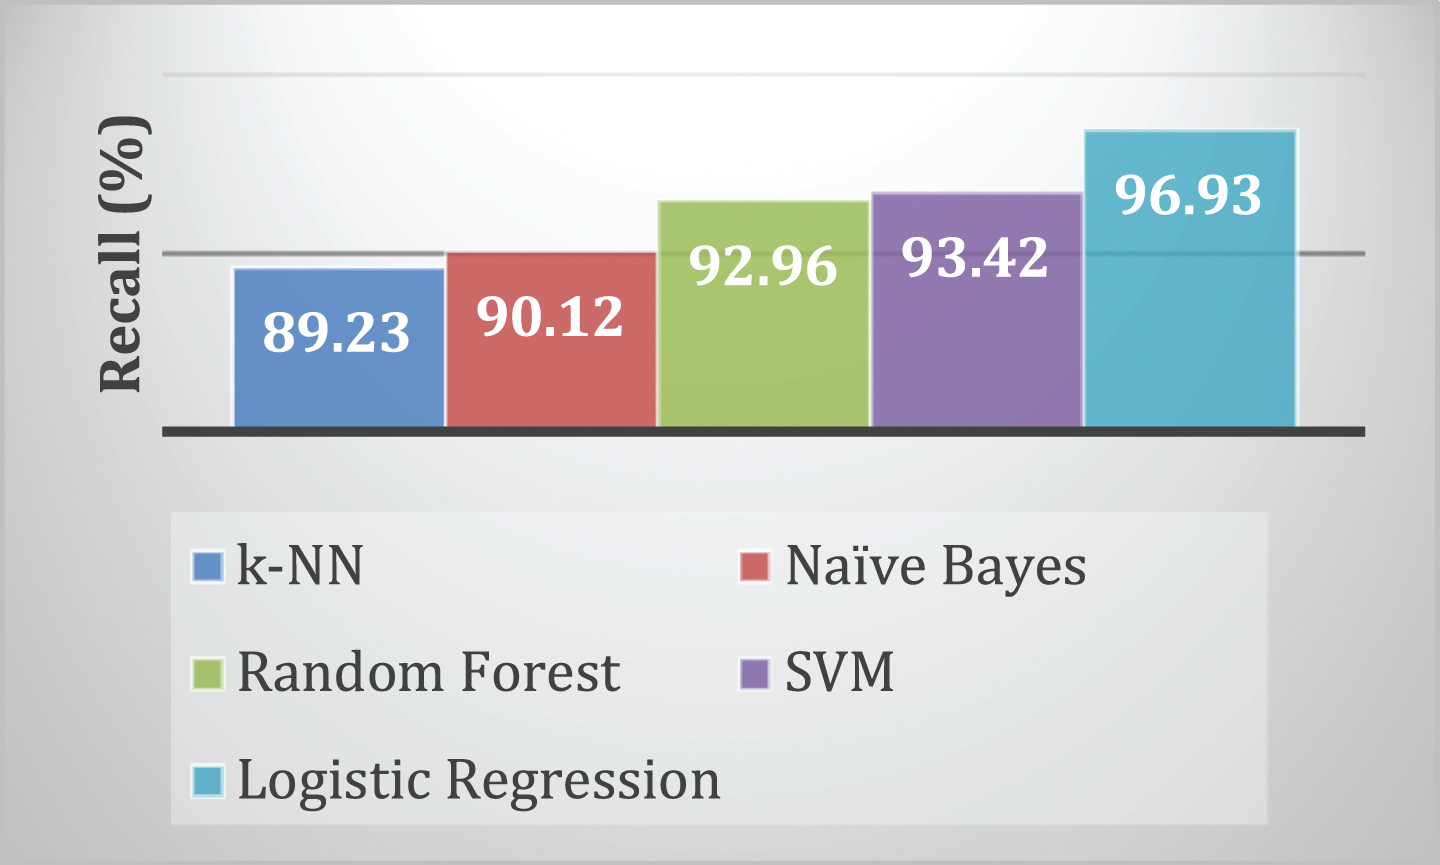
Comparison of recall.
Figure 18 represents the comparison of F-score. Form Fig. 18, we see that the average value of F-score obtained by k-NN, NB, RF, SVM and LR are 90.42, 91.67, 93.33, 94.62 and 97.11 respectively. Thus, the F-score of LR is better than other algorithms.

Comparison of F-score.
The classification is also performed using traditional algorithms like k-nearest neighbour (k-NN), Naïve Bayes (NB), Random Forest (RF), support vector machine (SVM) for comparison.
The performance of the proposed procedure is evaluated against BRATs dataset for estimating the classification accuracy. The classification is performed using the similar traditional algorithms like k-nearest neighbour (k-NN), Naïve Bayes (NB), Random Forest (RF), support vector machine (SVM) for evaluation. Table 10 lists the confusion matrix parameters for classifying the two distinct class of tumours. Figure 19 shows the predictive performance of the classifiers assessed with the following parameters, accuracy, sensitivity, specificity, precision and accuracy. From the plotted values of Fig. 19, LR outperforms in overall assessment towards classification accuracy.
Comparison of performance indices of applying 5 models to BRATs Dataset
Comparison of performance indices of applying 5 models to BRATs Dataset

Classifier accuracy of BRATs Dataset.
In future the proposed work can be extended by considering other pre-trained deep learning method existing in literature and used to text clinical MRI images.
A novel framework for fusion and classification of medical images was proposed in this research. In this work, the modified 2D Adaptive Bilateral Filtering algorithm was used for filtering. Then image enhancement was done using ECLAHE algorithm. The computed tomography and magnetic resonance imaging were then registered using mutual information and then fused to form a single fused image. Here, the images were fused using the proposed Siamese Neural Network and Entropy (SNNE)-based image fusion algorithm. Using the score of the SoftMax layer and the entropy of the image, fusion was done. Using the fused image, the tumor regions were segmented using FFCMC clustering and Otsu Thresholding. Finally, intensity histogram and GLCM features were extracted. Using the extracted features, classification was done using Logistic Regression classifier. The proposed fusion algorithm attained excellent results in terms of fusion metrics. It was observed that the logistic regression classifier achieved an accuracy of about 97.37% for ATLAS Dataset and an accuracy of about 95.76% for BRATs 2015 dataset.