
Abstract
OBJECTIVE:
To assess the feasibility of using virtual non-contrast (VNC) images derived from dual-energy computed tomography (DECT) to replace true non-contrast (TNC) images of papillary thyroid carcinoma (PTC) patients.
METHODS:
Images of 96 PTC patients were retrospectively analyzed. TNC images were acquired under the single-energy mode of DECT after the plain scanning. The arterial and venous phase VNC (VNC-a and VNC-v) images were generated by the post-processing algorithm from the arterial phase and venous phase of contrast-enhanced CT images, respectively. Mean attenuation values, image noise, number and length of calcification were measured. Radiation dose was also calculated. Last, subjective score of image quality was evaluated by a 5-point scale.
RESULTS:
Signal-to-noise ratio (SNR) of each tissue in TNC images is significantly higher than that of VNC images (p<0.050). Contrast-to-noise ratio (CNR) of fat, muscle, thyroid nodules and internal carotid artery in TNC images is significantly higher than that of VNC images, while CNR in TNC images is lower for cervical vertebra (p<0.001). Calcification is detected on TNC images of 44 patients, while it is omitted on VNC images of 14 patients (31.8%). The subjective score of TNC images is higher than VNC images (p<0.001). The effective dose reduction is 47.6% by avoiding plain scanning.
CONCLUSIONS:
Considering the different attenuation value, SNR, CNR and especially reduced detection rate of calcification, we deem that VNC images cannot be directly used to replace TNC images in PTC patients, despite the reduced radiation dose.
Keywords
Introduction
Papillary thyroid carcinoma (PTC) is the most common pathological type of thyroid carcinoma [1]. Ultrasound is recommended as the preferred image modality for assessing PTC, however, it is an operator-dependent technique. In addition, the usage of US is limited in the evaluation of mediastinum and retropharyngeal area [2]. As an alternative approach, computed tomography (CT), including plain scanning and contrast-enhanced scanning, has been proven to be a useful complementary tool for assessing PTC, especially the cervical lymph node metastasis [2, 3]. However, one crucial disadvantage of CT technique when applied in the PTC is the radiation. Therefore, to find an effective method to reduce the radiation dose while maintaining the image quality is in urgent need.
Dual-energy CT (DECT) which simultaneously acquire multiple datasets during one single CT scan attracts increasingly attention [4]. Based on the three-material decomposition model which setting iodine, fat and soft tissue as three basis materials, virtual non-contrast (VNC) image can be obtained by subtracting the iodine map from the original contrast-enhanced DECT image [5, 6]. It has been proved that VNC images can provide comparable image quality with true non-contrast (TNC) in many fields involving the liver, coronary artery, gastric tumor and kidney [4, 7–10]. In this case, the plain scanning could be omitted from the CT scan protocol, then the radiation dose would reduce. However, several above-mentioned studies also reported significant difference on the attenuation values of tissues and the size of calcification or stones between VNC and TNC [4, 9].
In view of the clinical importance of attenuation values and calcification in the assessment of PTC, and no previous study focused on this topic, therefore, our study aimed to assess the feasibility of using VNC images derived from DECT to replace the TNC images in patients with PTC.
Materials and methods
Patients
The institutional review board of our hospital approved this study and the informed consent was waived due to the nature of retrospective study. From August 2017 to November 2019, a total of 165 patients with pathologically confirmed PTC underwent triple-phase DECT were enrolled. Sixty-nine patients were excluded according to the following exclusion criteria: 1) bilateral PTC nodules (n=54); 2) images with severe artifacts (n=9); and 3) previous history of thyroid surgery before CT scan (n=6). Finally, 96 patients (36 men, 60 women; mean age=38.1±10.3 years) were enrolled in our study.
DECT protocol and post-processing
DECT examinations were performed by using a third-generation dual-source CT system (Force; Siemens Healthcare, Erlangen, Germany). Patients were positioned supine on the table, and acquisition was performed in a cranio-caudal scan direction. The scan ranged from basis cranii to aortic arch. First, a TNC scan was acquired under the single-energy mode of DECT by using the following parameters: field of view 252mm; section thickness 1.5mm; tube voltage 120kVp and current-time product 180mAs.
For contrast-enhanced CT, contrast agent (iproamine; Bayer HealthCare, Berlin, Germany) was injected into the elbow vein at a speed of 3.5ml/s for a total of 1.5mm/kg by using an automatic high-pressure syringe. The scan delay times for the arterial and venous phases were 25 sec and 50 sec, respectively. The contrast-enhanced CT scan was then acquired in the same coverage as TNC scan using the dual-energy mode. The DECT protocol included: detector configuration 128×0.6mm; pitch 0.7; rotation speed 0.5s; matrix 256×256; field of view 252mm; section thickness 1.5mm. Tube A was performed with a tube voltage of 80kVp and current-time product of 118 mAs. Tube B was performed with a tube voltage of Sn150kVp and current-time product of 59 mAs. Real-time automatic tube current modulation (CARE dose 4D; Siemens) was applied in all acquisitions. Three different image sets were obtained after the contrast-enhanced CT examination, 80kVp, Sn150kVp and a weighted average to reproduce the characteristics of a single-energy 120kVp image set, which was calculated from both tube data at a ratio of 0.5:0.5.
All original images were transmitted to a software (Syngo Dual Energy, version VB10B; Siemens Healthcare, Germany). VNC images were generated by the post-processing algorithm, ie, the three-material decomposition algorithm to differentiate iodine agent, fat and soft tissue. In this algorithm, iodine map was generated from the iodine concentration quantified in each voxel based on two basis materials, fat and soft tissue. VNC-a and VNC-v images were produced by subtracting the iodine map from the arterial phase and venous phase of contrast-enhanced DECT images, respectively [5].
The dose length product (DLP) and CT dose index (CTDIvol) of plain phase, arterial phase and venous phase images were recorded. The effective dose (ED) of each phase was calculated by multiplying the DLP with a neck-specific conversion coefficient k (k=0.0059) which was recommended by the European Working Group for Guidelines on Quality Criteria in Computed Tomography [9].
Imaging analysis
Regions of interest (ROIs) (size range=0.2∼1.0cm2) were placed in the same slice of TNC, VNC-a and VNC-v images in neck fat, sternocleidomastoid muscle, cancellous bone of cervical vertebra, normal thyroid, thyroid nodules and internal carotid artery by radiologist 1 (with 5 years of clinical experience in head and neck oncologic imaging). The mean attenuation values and standard deviation of these tissues were measured three times, then the average data was calculated. Signal-to-noise ratio (SNR) and contrast-to-noise ratio (CNR) were calculated using the following formula: SNR=|ROItissue|/SDtissue and CNR=|ROItissue-ROIthyroid|/SDthyroid, respectively, In the formula, ROItissue and SDtissue are the mean attenuation values and noise of each tissue, ROIthyroid and SDthyroid are the mean attenuation values and noise of the normal thyroid.
The number and the length of calcification were measured by radiologist 1 and radiologist 2 (with 8 years of clinical experience in head and neck oncologic imaging) on TNC, VNC-a and VNC-v images. Once disagreement occurred, a third senior radiologist (with 24 years of clinical experience in head and neck oncologic imaging) would make a consensus. The length refers to the longest diameter of calcification. If there are multiple calcifications, the calcification with the longest diameter was adapted in analysis.
The image quality of TNC, VNC-a and VNC-v images was assessed with a 5-point scale by radiologist 1 and radiologist 2. If any disagreement meat, the third radiologist would make a final decision. The 5-point scale was as follows: score 5, distinct anatomic structures and details allow excellent evaluation of the images; score 4, anatomic structures and details lead to proper evaluation due to minor artifacts; score 3, most anatomic structures and details are sufficient for evaluation; score 2, poor image quality with major artifacts; score 1, obscured anatomic structures and details are not assessable for diagnosis because of severe artifacts [11].
Statistical analysis
Statistical analysis was performed by using statistical software (SPSS Version 22.0, SPSS, Chicago, IL, USA). Quantitative variables were presented as mean±standard deviation. One-way ANOVA was used for the comparisons of mean attenuation values, SNR, CNR, subjective image quality scores, the number and length of calcification among three sets of CT images. If significant difference was present, a post hoc Student-Newman-Keuls test was performed among different subgroups. Cohen kappa statistic was used to calculated interobserver agreement of the subjective image quality scores between two radiologists. The agreement was defined as slight agreement (0<kappa≤0.2), fair agreement (0.2<kappa≤0.4), moderate agreement (0.4<kappa≤0.6), substantial agreement (0.6<kappa≤0.8), almost perfect agreement (0.8<kappa<1.0) [12]. Paired-samples Student’s t test was used to compare the difference of the radiation dose between dual-phase (DE arterial+DE venous) and triple-phase (TNC+DE arterial+DE venous) protocol. A two-sided p value less than 0.05 indicated a statistically significant difference.
Results
Objective assessment
Comparison of objective image quality among TNC, VNC-a and VNC-v images are summarized in Table 1. Box plots of differences between TNC, VNC-a and VNC-v images in attenuation values of different tissues are showed in Fig. 1. Significant differences are observed in mean attenuation values and SNR of each tissue among the three sets of CT images (all p<0.050). Lower mean attenuation values of muscle, cervical vertebra, normal thyroid gland, thyroid nodules and internal carotid artery are also found for VNC images than TNC images, while higher mean attenuation values of fat are detected in VNC images.
Comparison of quantitative measurements among TNC, VNC-a and VNC-v images
Comparison of quantitative measurements among TNC, VNC-a and VNC-v images
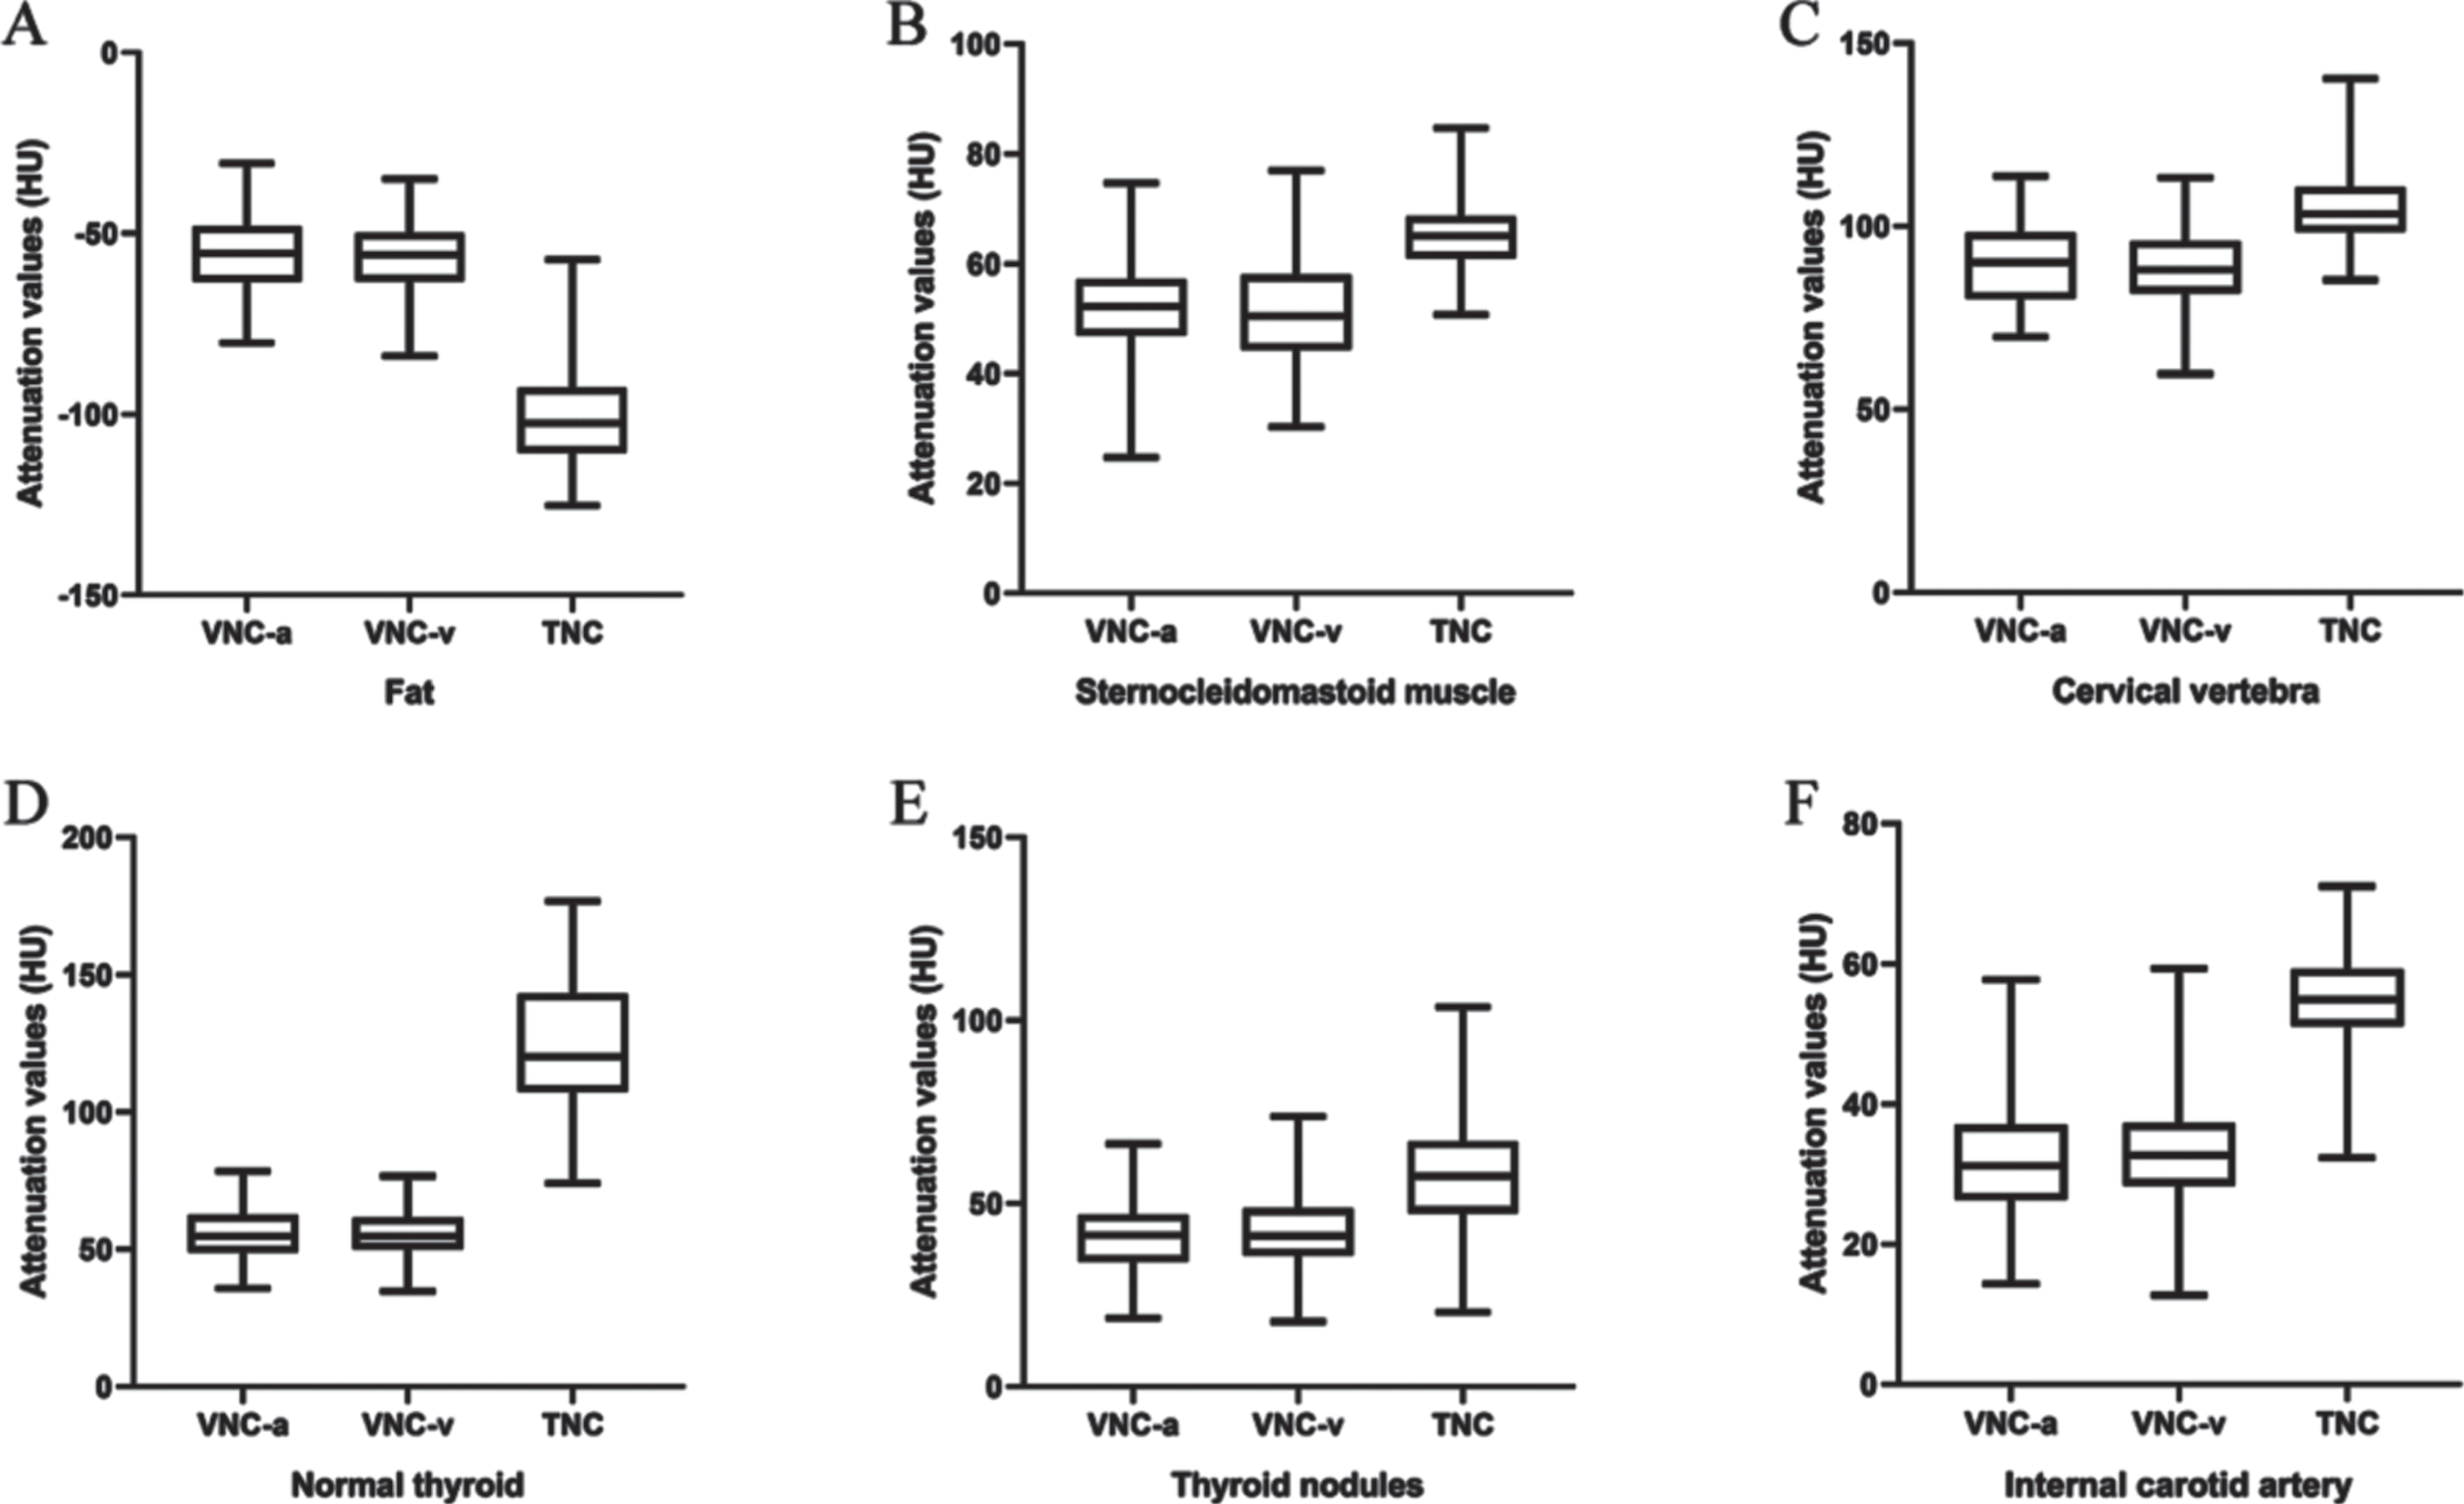
Box plots of differences on attenuation values of different tissues among TNC, VNC-a and VNC-v images (A-F).
First, following are the computer SNR of different image regions from TNC and VNC images: Fat (SNRTNC=6.6±1.4; SNRVNC-a=4.7±1.2; SNRVNC-v=4.7±1.3), Muscle (SNRTNC=9.1±2.1; SNRVNC-a=6.9±1.9; SNRVNC-v=6.8±1.9), Cervical vertebra (SNRTNC=9.7±1.9; SNRVNC-a=9.1±1.9; SNRVNC-v=9.0±2.3), Normal thyroid gland (SNRTNC=11.7±3.7; SNRVNC-a=6.4±1.7; SNRVNC-v=6.4±1.9), Thyroid nodules (SNRTNC=6.3±2.1; SNRVNC-a=4.7±1.5; SNRVNC-v=4.6±1.6), Internal carotid artery (SNRTNC=7.5±1.6; SNRVNC-a=4.4±1.3; SNRVNC-v=4.4±1.3.
The results show that lower SNR are detected for VNC images than TNC images. Comparing with TNC images, SNRs of fat, sternocleidomastoid muscle, cervical vertebra, normal thyroid, thyroid nodules and internal carotid artery in VNC-a images are reduced by 28.8%, 24.2%, 6.2%, 45.3%, 25.4% and 41.3%, respectively. SNRs of fat, sternocleidomastoid muscle, cervical vertebra, normal thyroid, thyroid nodules and internal carotid artery in VNC-v images are reduced by 28.8%, 25.3%, 7.2%, 45.3%, 27.0% and 41.3%, respectively. No significant difference is detected for mean attenuation values and SNR between VNC-a and VNC-v images (all p>0.050).
Next, the computed CNR of different image regions from TNC and VNC images are: Fat (CNRTNC=21.2±5.8; CNRVNC-a=12.9±3.0; CNRVNC-v=12.8±3.4), Muscle (CNRTNC=5.5±2.6; CNRVNC-a=1.2±0.9; CNRVNC-v=1.2±0.9), Thyroid nodules (CNRTNC=6.3±3.2; CNRVNC-a=1.8±1.2; CNRVNC-v=1.7±1.2), Internal carotid artery (CNRTNC=6.5±2.9; CNRVNC-a=2.8±1.5; CNRVNC-v=2.6±1.7), cervical vertebra (CNRTNC=2.4±2.0; CNRVNC-a=3.9±1.8; CNRVNC-v=3.9±1.8).
The results show that except cervical vertebra regions, CNRs of TNC images on other regions are significantly higher than those of VNC images (all p<0.001). Comparing with TNC images, CNRs of fat, sternocleidomastoid muscle, thyroid nodules and internal carotid artery in VNC-a images are reduced by 39.2%, 78.2%, 71.4% and 56.9%, respectively. CNRs of fat, sternocleidomastoid muscle, thyroid nodules and internal carotid artery in VNC-a images are reduced by 39.6%, 78.2%, 73.0% and 60.0%, respectively. No statistical difference is detected in CNR between the two VNC image sets (all p>0.050). Figure 2 shows a representative case that the thyroid nodule can be displayed clearly on TNC image, while not on both VNC-a and VNC-v image.
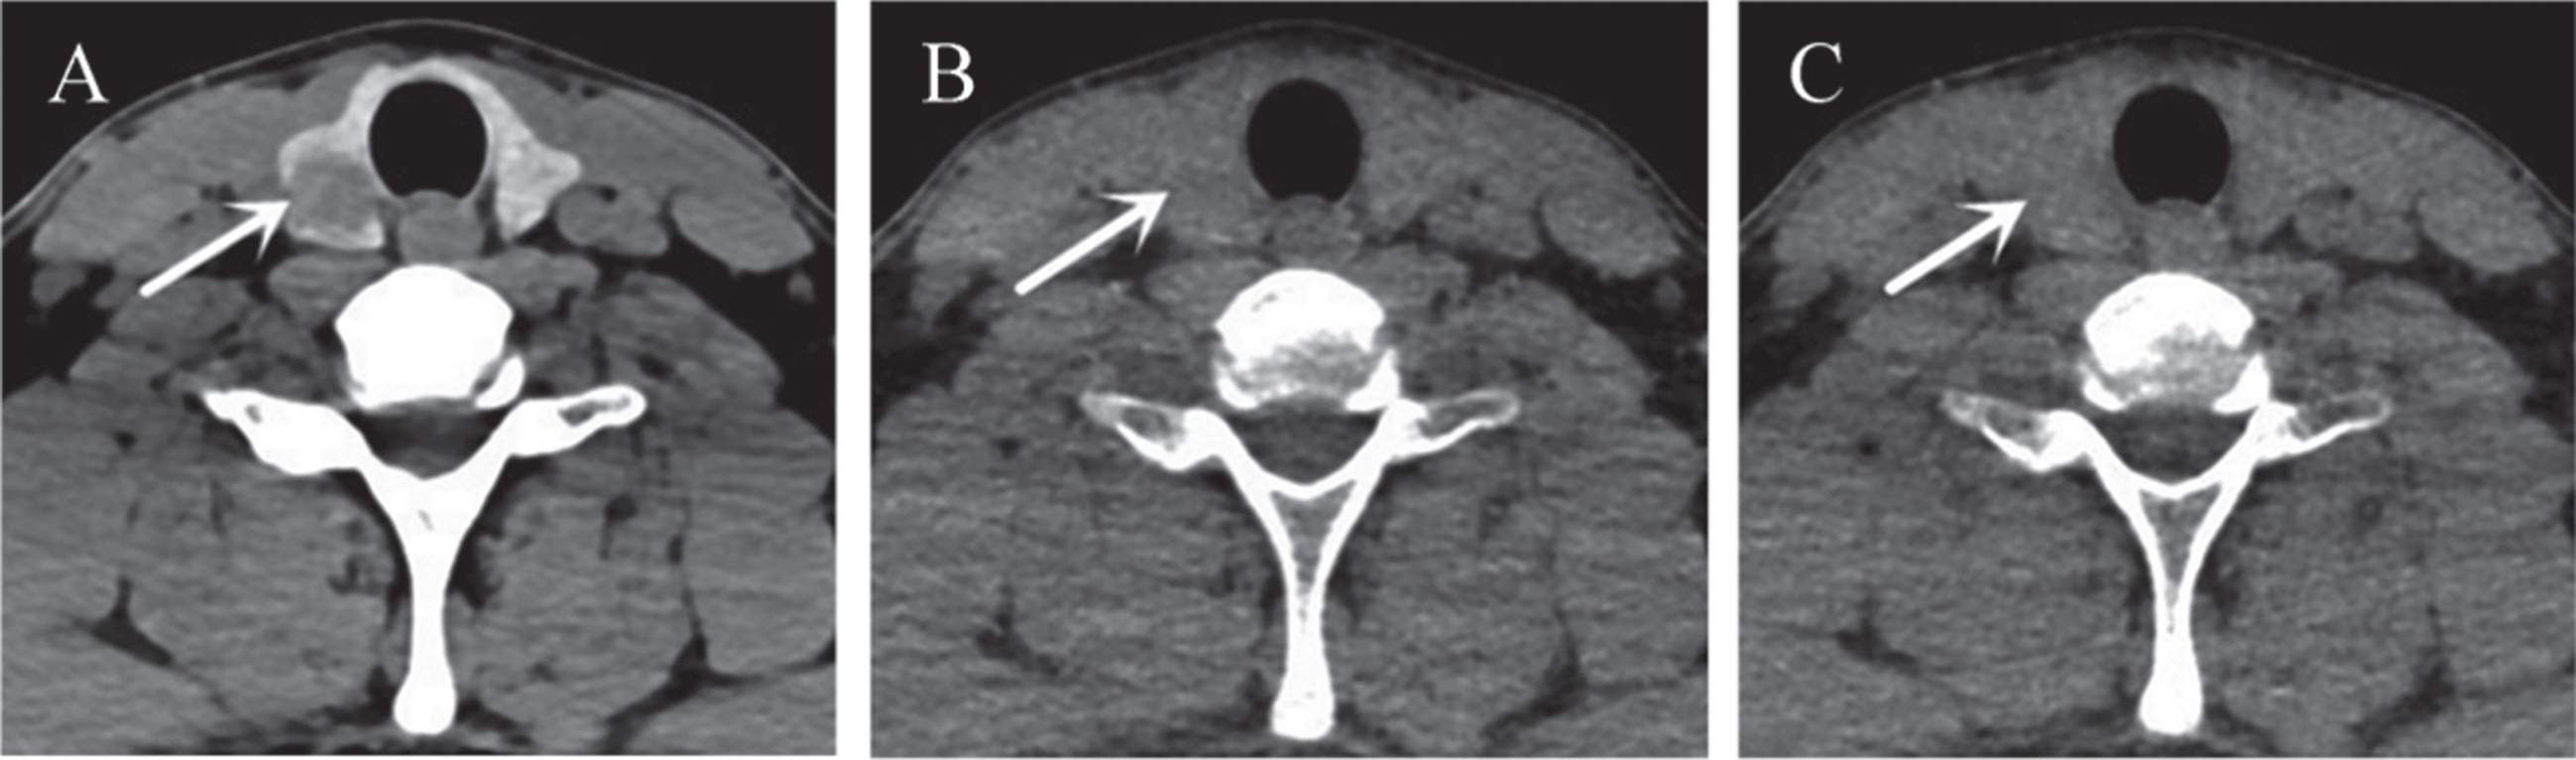
Representative images of a 30-year-old man with papillary thyroid carcinoma. Thyroid nodule (white arrow) was clearly showed in TNC image (A), while it was difficult to identify in VNC-a (B) and VNC-v image (C), respectively. The image window setting was window width, 250HU and window level, 60HU.
The interobserver agreement between two radiologists is “almost perfect” (kappa=0.9, p<0.001). The scores of VNC-a, VNC-v and TNC images are 2.5±0.7, 2.6±0.7 and 4.9±0.3, respectively. There is no significant difference between VNC-a and VNC-v images (p=0.591), but the scores of TNC images is significantly higher than that of VNC-a and VNC-v images (p<0.001).
Ability of calcification detection
Calcification is detected on the TNC images of 44 patients. Among them, calcification is not detected on both VNC-a and VNC-v images of 14 patients (31.8%). The length of calcification in TNC, VNC-a and VNC-v images are 4.5±3.2mm, 2.9±3.1mm and 2.7±3.1mm, respectively. Significant differences are observed on the number and length of calcification between TNC and VNC-a or VNC-v images (both p<0.050), while no significant difference is found between VNC-a and VNC-v images (both p>0.050) (Table 2). All 14 calcifications misdiagnosed on VNC images are smaller than 3mm. Among them, 11 belong to micro-calcification with a length less than 2mm. Figure 3 shows the representative cases that calcification shrank and disappeared in the VNC images.
Comparison of subjective image quality scores and calcification detection
Comparison of subjective image quality scores and calcification detection
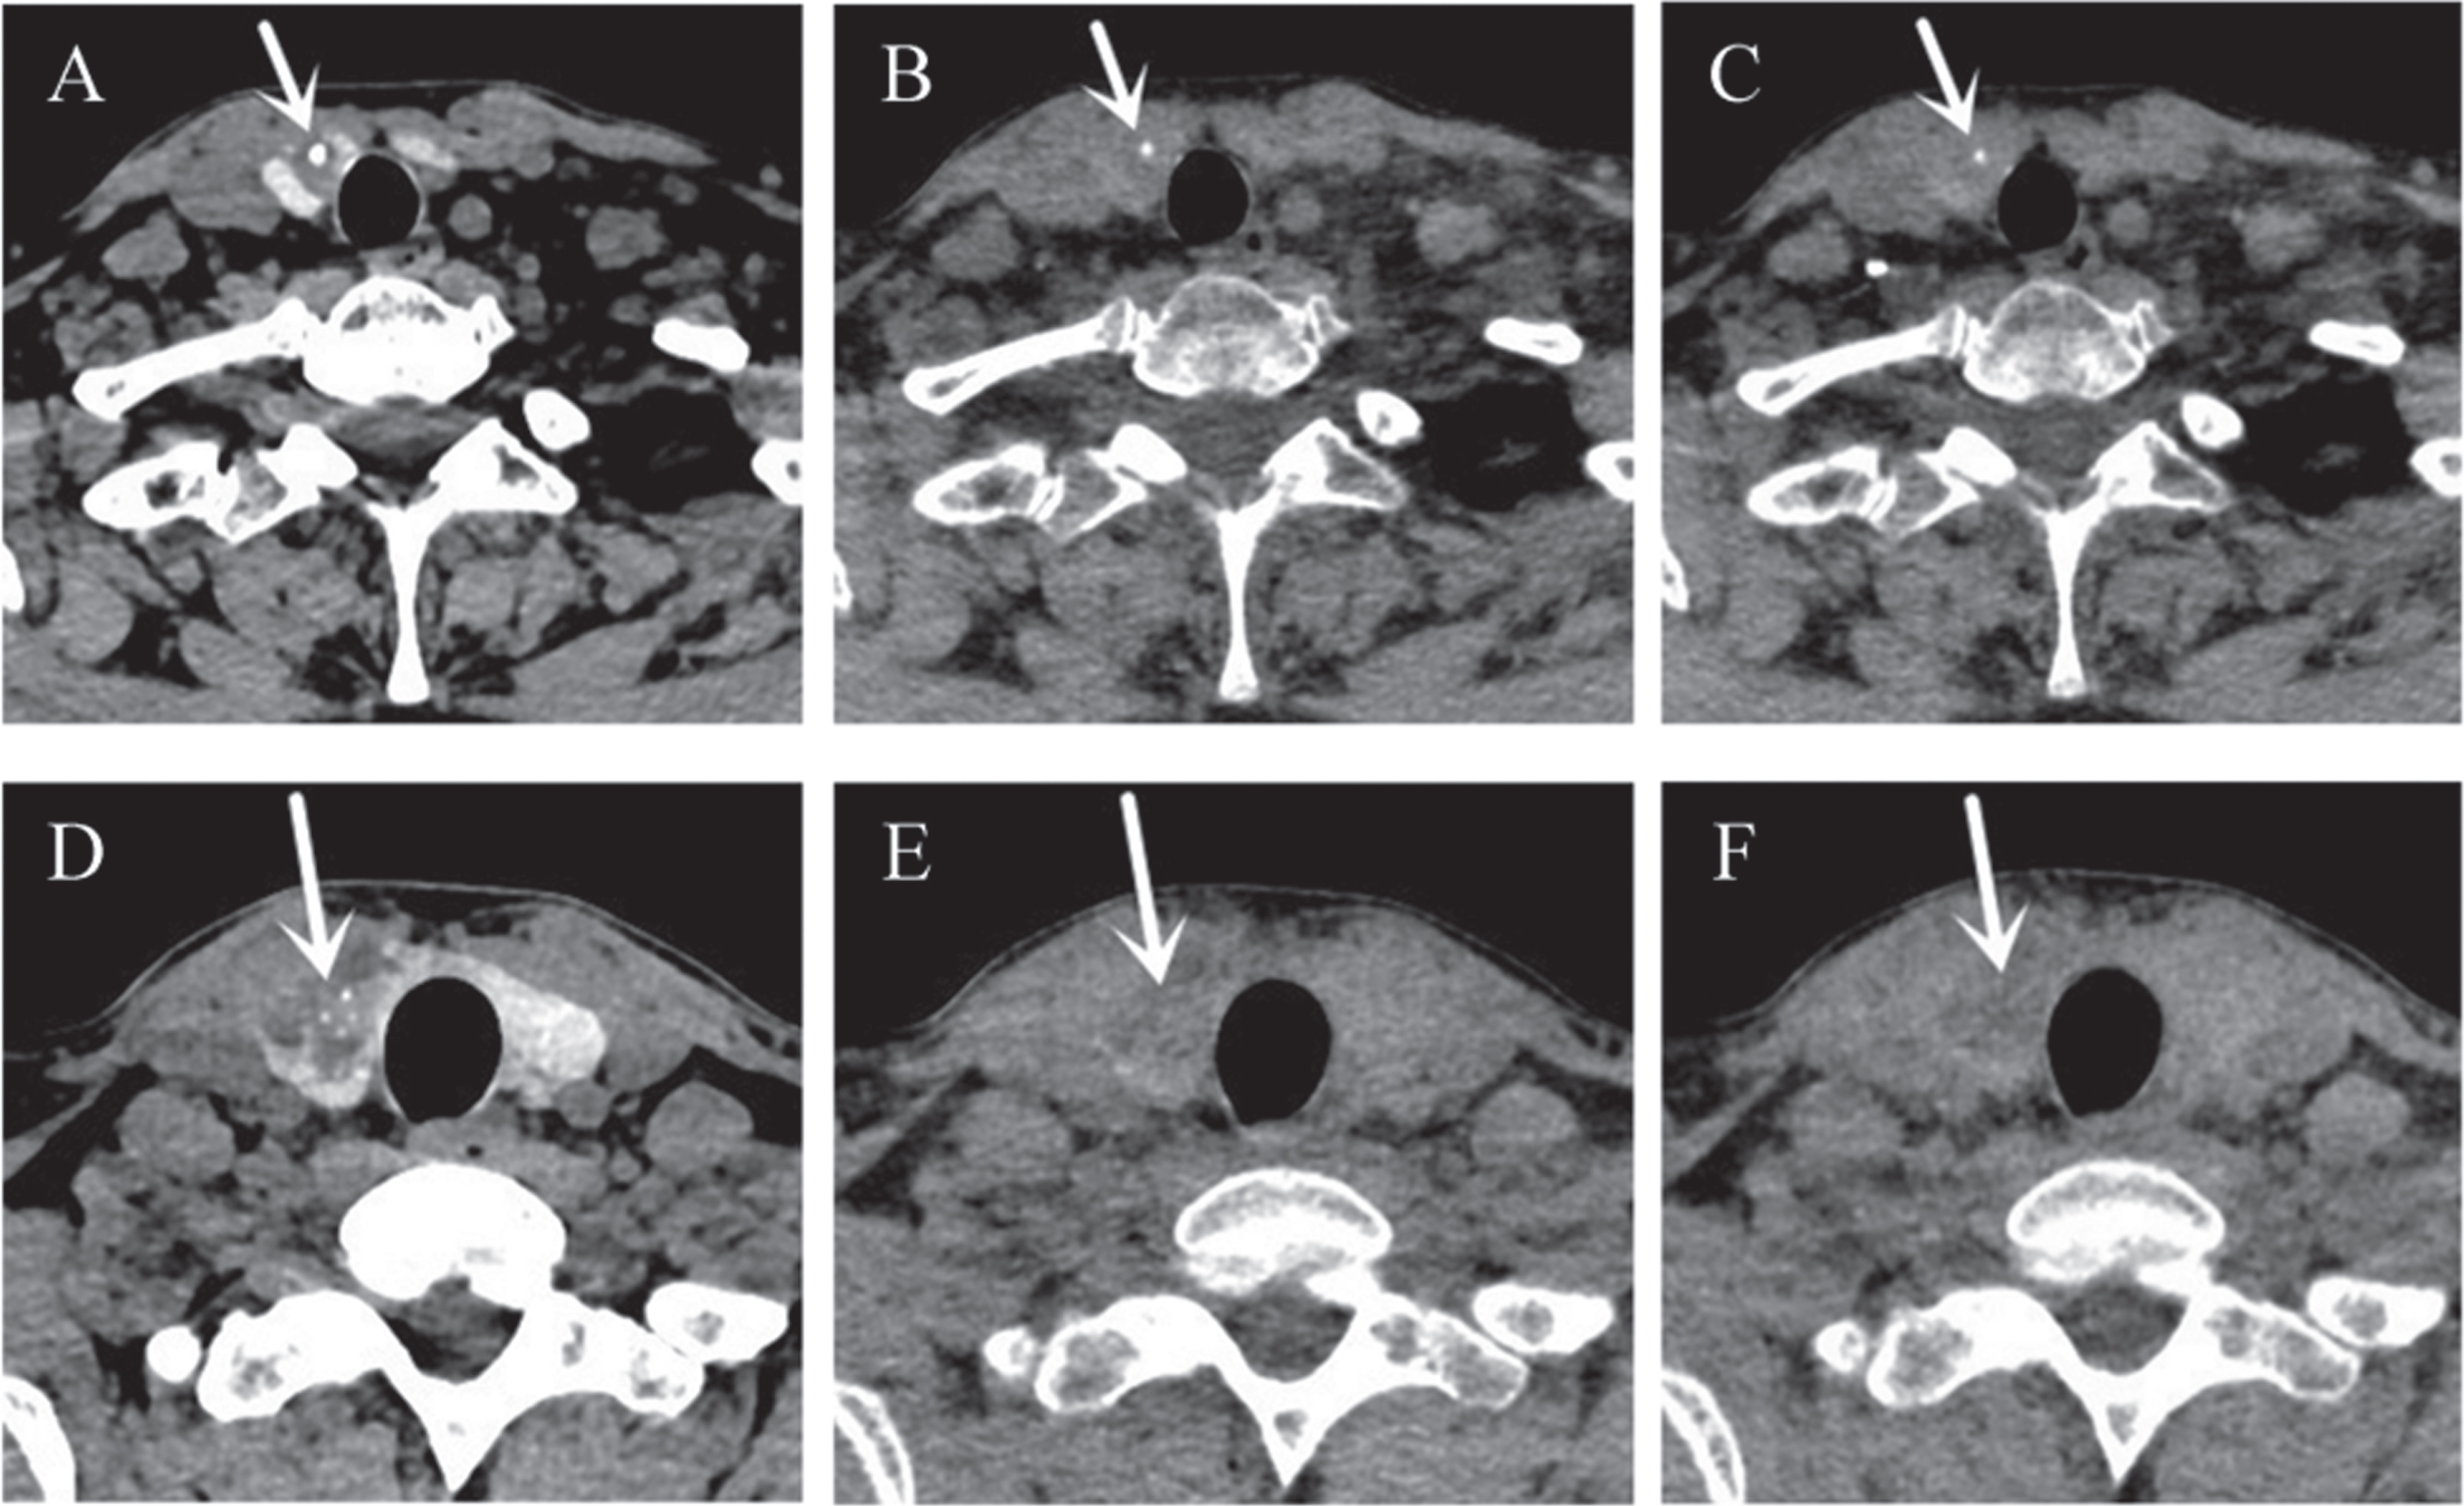
Representative images of a 50-year-old woman (A, B and C) and a 32-year-old man (D, E and F) with papillary thyroid carcinoma. The length of calcification (white arrow) was 3.1mm in TNC image (A). In VNC-a (B) and VNC-v image (C), the length of calcification (white arrow) was 1.5mm and 1.6mm, respectively. In the TNC image (D), multiple micro-calcifications (white arrow) with a length of about 0.9mm could be identified. However, all the micro-calcifications (white arrow) were missed in both VNC-a (E) and VNC-v image (F). The image window setting was window width, 250HU and window level, 60HU.
CTDIvol, DLP, and ED of triple-phase and dual-phase protocol are showed in Table 3. For arterial acquisition, venous acquisition and plain acquisition, CTDIvol are 4.4±0.9 mGy, 4.4±0.9 mGy and 8.0±1.7 mGy, respectively. DLP are 94.5±25.7 mGy·cm, 95.2±25.6 mGy·cm and 173.0±44.1 mGy·cm, respectively. CTDIvol, DLP and ED of the dual-phase protocol acquisitions are significantly lower than those of the triple-phase protocol acquisitions (all p<0.001). The effective dose reduction is 47.6% by avoiding plain acquisition.
Radiation dose of dual-phase and triple-phase protocol
Radiation dose of dual-phase and triple-phase protocol
In our study, the radiation dose was significantly reduced by omitting plain acquisition from CT protocol. However, the objective and subjective image quality of VNC images was significantly inferior to that of TNC images when applied in assessing PTC patients. In addition, compared with TNC images, VNC images showed a poor ability in describing the number and size of calcification within PTC lesions.
Several previous studies had compared VNC and TNC images in several tissues [4, 14]. Jamali et al reported that the mean attenuation values of abdominal fat and muscle were significantly different between VNC and TNC images [13]. Ding et al reported that the mean attenuation values of L1 vertebra were underestimated in VNC, compared with TNC images [14]. Meanwhile, De Cecco et al reported a significant reduction in the attenuation values of aorta in the VNC images, compared with TNC images [7]. In agreement with these studies, our results also showed a significant difference in mean attenuation values between VNC and TNC images in fat, muscle, cervical vertebra and internal carotid artery. It is worth noting that the mean attenuation values of thyroid in TNC images were about 2.2 times than that in VNC images. In our opinion, the post-processing algorithm could not distinguish the iodine stored within the thyroid tissue and the iodine in contrast agent, then the iodine stored within the thyroid tissue was also subtracted, consequently the attenuation values of thyroid in VNC images would be lower than that in TNC images.
In our study, both SNR and CNR of normal thyroid and thyroid nodules in VNC images were lower than that in TNC images, so did the subjective image quality scores. Due to the loss of iodine storage function and necrotic areas inside the nodules, PTC lesions mostly showed as low-density nodules in conventional plain CT image [15]. As we mentioned above, the attenuation values of normal thyroid gland in VNC images were lower than that in TNC images. This situation would decrease the attenuation difference between PTC lesions and normal thyroid gland tissues in VNC images. Both SNR and CNR are important parameters to evaluate the image quality. SNR is used to represent the ratio of useful signal to noise, higher SNR could lead to better image quality. In our study, CNR of thyroid nodules was used to represent the distinction between thyroid nodules and normal thyroid. Higher CNR of thyroid nodules will contribute to the detection of lesions. The reduction in SNR, CNR and subjective image quality score indicated that VNC images might be insufficient in displaying and delineating PTC lesions.
Calcification is one important imaging features for the differential diagnosis of thyroid nodules. Previous study reported an incidence of 42% to 72.3% in malignant nodules, while an incidence of 13.1% to 23.0% in benign nodules [16]. Besides that, micro-calcification has been reported as highly specific to malignant nodules [17]. In our study, VNC images showed a significant reduction of the number and the length of detected calcification, compared with TNC images. This finding was in accordance with one prior study of Song et al. [4]. They found that calcium volumes of coronary arteries were significantly lower in VNC images compared with TNC images. Bases on our study results, we deemed that replacing TNC images with VNC images would exert a negative impact on the detection of calcification and consequently affect the accurate evaluation of PTC.
Several limitations should be noted in our study. First, this was a retrospective study with a limited patient population. Second, the parameters of VNC images might be influenced by different scanning protocols and image post-processing algorithms. Our study results should be verified in future study with different imaging protocol and post-processing algorithms. Third, our study only enrolled the patients with PTC. Future study enrolling more thyroid nodules with different histopathological types is needed to study the influence of underestimated calcification on the diagnostic performance.
Conclusions
In conclusion, our study indicated significant differences on objective and subjective image quality, and detection ability of calcification numbers and size between VNC and TNC images. Considering the clinical importance of SNR, CNR and calcification on the detection and differential diagnosis of thyroid nodules, we deemed that VNC images could not be directly used to replace the TNC images in patients with PTC, in spite that the radiation dose was markedly reduced.
Funding information
This study received funding by the thyroid research program of young and middle-aged physicians from China Health Promotion Foundation (Xiao-Quan Xu) and Natural Science Foundation of Jiangsu Province (Fei-Yun Wu).
Conflict of interest
Ying-Qian Ge and Xin-Wei Tao are employee of Siemens Healthineers. The remaining authors have no conflict of interest.
Footnotes
Acknowledgments
None.