
Abstract
BACKGROUND:
Blending technology is usually used to improve quality of dual-energy computed (DECT) images.
OBJECTIVES:
To evaluate the blended DECT image qualities by employing the Blending-Property-Map (BP-Map) and elucidating the optimal parameters with the highest signal-to-noise ratio (SNR) and contrast-to-noise ratio (CNR).
METHODS:
Sixty pairs of 80 kV and 140 kV CT images are blended non-linearly by four methods. Protocol A uses the fixed values of blending width (BW) and blending center (BC); Protocol B uses the values of BW = (CThepatic portal vein – CThepatic parenchymal) / 2 and BC = (CThepatic portal vein + CThepatic parenchymal) / 2; Protocol C uses a BW ranging from 10 to 100 HU at an interval of 10 HU and BC = (CThepatic portal vein + CThepatic parenchymal) / 2; Protocol D uses the BP-Map that covers all possible values of BW and BC.
RESULTS:
When using CT value of adipose tissue as noise, the calculated SNR and CNR of optimal blending width and blending center were 123.22±41.73 and 9.00±3.52, respectively, by the BP-Map in the protocol D. By employing the CT value of back muscle as noise, the SNR and CNR of the best-blended images were 75.90±14.52 and 6.39±2.37, respectively. The subjective score of protocol D was 4.88±0.12.
CONCLUSIONS:
Compared to traditional blending methods, the BP-Map technique can determine the optimal blending parameter and provide the best-blended images with the highest SNR and CNR.
Keywords
Introduction
Dual-energy computed tomography (DECT), first described by Hounsfield in 1973 [1], is based on the multi-energy scanning CT data acquisition that simultaneously collects both low and high energy image data. Dual-source CT is a form of DECT that consists of two X-ray tubes at 90° that generate low and high energy X-ray, respectively, and through which two different X-ray attenuation properties and two tomographic images of one image object can be simultaneously collected and reconstructed [2]. DECT is being increasingly adopted for the purposes of material decomposition [3–5], tissue characterization [3, 6–8], hard beam artefact reduction [4, 9–12], and small lesion detection [2, 13–17]. Due to the increased available information of the image object, DECT can combine characteristics of low and high energy images and thereby offer a better image quality than any single-energy CT images.
Blending is a typical procedure that combines the low and high energy images from DECT to obtain a single fused image. A low-energy image provides higher contrast resolution and iodine conspicuity but with increased noise whereas the high-energy image provides little noise but a lower contrast resolution and iodine conspicuity [4, 13]. Therefore, the blending of the low and high energy datasets with an appropriate algorithm may generate a higher-quality fused image through a compromise between the contrast and noise [2]. Currently, dual-energy blended images studies have focused on liver applications and found it more conducive for the diagnosis of hepatic lesions [18–21], identification of vessels, and evaluation of the treatment [11, 22–25].
To maintain the advantages and suppress the drawbacks of mixing two energy images, some post-processing algorithms such as the linear blending and non-linear blending, are being investigated for their ability to yield a higher quality blended image. Linear blending uses a fixed weighting factor for all CT image pixels to fuse images. If the weight is 0.3, for example, adding 30% CT value of each pixel of a low-energy image to the 70% CT value of the pixel with the same position of a high-energy image can lead to the pixel value of the blended image. Using different weights can generate different blending results with different qualities. Due to the nature of linear blending using one weight for all pixels, the advantages of each image data-set (contrast or sharpness) are partially offset by its drawbacks (blurring or noise) [26].
As an alternative to linear blending, the non-linear blending procedure has been developed to improve image qualities such as contrast, high contrast-to-noise ratio (CNR), and signal-to-noise ratio (SNR). The non-linear algorithms increase contrast the resolution and decrease the noise level in the blended images. Eusemann et al. [26] suggested that non-linear blending of dual-energy CT data is superior to the linear blending algorithms. For pixels in the same position for the low and high energy images, unlike linear blending, non-linear blending calculates a specific blending weight for the pixels and determines the weight by a non-linear function, and where the function is related to the properties of the pixels. The most popular non-linear function is the sigmoid-like blending function, which can be determined by two parameters, blending width and blending height. Previous studies suggest that non-linear blending provides better performance for both subjective and objective evaluations and that the blending function can decide performance [11, 22–25].
To obtain the best image quality of non-linear blended images, it is essential to determine the most suitable blending function by selecting the most optimal blending parameters. However, previous studies did not identify the exact optimal parameters of nonlinear blending methods [23, 24], or the amount of data was too small [27]. In addition, different images have a different optimal blending center (BC) and blending width (BW) instead of requiring the same value. Therefore, further studies are required to study the variation tendency of the qualities of the blended image with the change of blending parameter and thereby determine the optimal parameters.
In this study, we used a novel method, Blending-Property-Map (BP-Map), inspired by the field of data-mining. Employing the image dataset of hepatic portal venography, the three-dimensional BP-Maps were generated to investigate the relationship between image qualities and blending parameters, and to determine the strategies for obtaining optimal blending.
Materials and Methods
Image data
Sixty pairs of low and high energy CT image slides, around the hepatic vein and its branches, were randomly selected from archived DECT images of 60 liver cirrhosis patients including 42 males (age range 28 to 84 years; BMI, 14∼29 kg/m2) and 18 females (age range 41 to 74 years; BMI, 18∼28 kg/m2). All patients met the following inclusion criteria: (1) no iodine allergy; (2) normal renal function; (3) no liver cancer, liver cysts, and hepatic hemangioma; and (4) no embolus in the portal vein system. This retrospective study was approved by the Tianjin Third Central Hospital Ethics Committee.
Imaging protocol
All CT examinations were performed using a dual-source dual-energy CT scanner (SOMATOM Flash, Siemens Healthineers, Forchheim, Germany). Patients were supine, feet advanced, and lifted on their arms. The scanning range was from 2 cm above the diaphragm to the lower edge of the liver or spleen. The mode automatically adjusted the current opened during the scanning (Care Dose4D, Siemens). The scanning in the portal venous phase was performed by dual-energy CT (A tube Sn140 kV/178 mAs, B tube 80 kV/461 mAs) with a collimation of 32×0.6 mm, rotation time of 0.5 s, and a pitch of 0.6.
During the scanning, Iohexol (350 mg/ml) was injected at a rate of 2.8–3 ml/s into the right forearm vein using a high-pressure syringe (LF OptiVantageTMDH, Siemens). The infusion was calculated at 1.2 ml/kg of the body weight. The contrast agent bolus-tracking technique was employed under the trigger threshold of 100 Hounsfield units (HU). The scan delay of the arterial phase, portal vein phase, and equilibrium phase was 25∼33 s, 60∼63 s, and 180 s, respectively. The region of interest (ROIs) was set at the abdominal aorta, 2 cm above the diaphragm and avoid the wall calcification in blood vessels.
Image processing
Every pair of dual-energy (80 kV and 140 kV) CT images of the portal vein phase were fused into a single image by four different non-linear blending methods. The image qualities of the blended images were evaluated by SNR and CNR.
Non-linear blending
An example of the sigmoid curve to process non-linear blending is shown in Fig. 1. The shape of the curve was determined by the blending center (BC) and blending width (BW). The CT value of a pixel on the reference image is on the horizontal axis and the corresponding blending proportion of the pixel is on the vertical axis. Using the low-kVp image as the reference image as an example, the CT values of the same position pixels on the low-kVp image, the high-kVp image, and the blended image were expressed as CTlow, CThigh, and CTblend, respectively. When the CTlow < ValueA, CTblend = 30% CTlow + 70% CThigh, while CTlow > ValueB, CTblend = 70% CTlow + 30% CThigh. When the (CTlow) is between the valueA and valueB on the curve, the blending ratio (br) of CTlow can be found on the vertical axis calculated from the oblique line on the curve whereas the blending percentage of corresponding CThigh is 100% - blending ratio of CTlow.
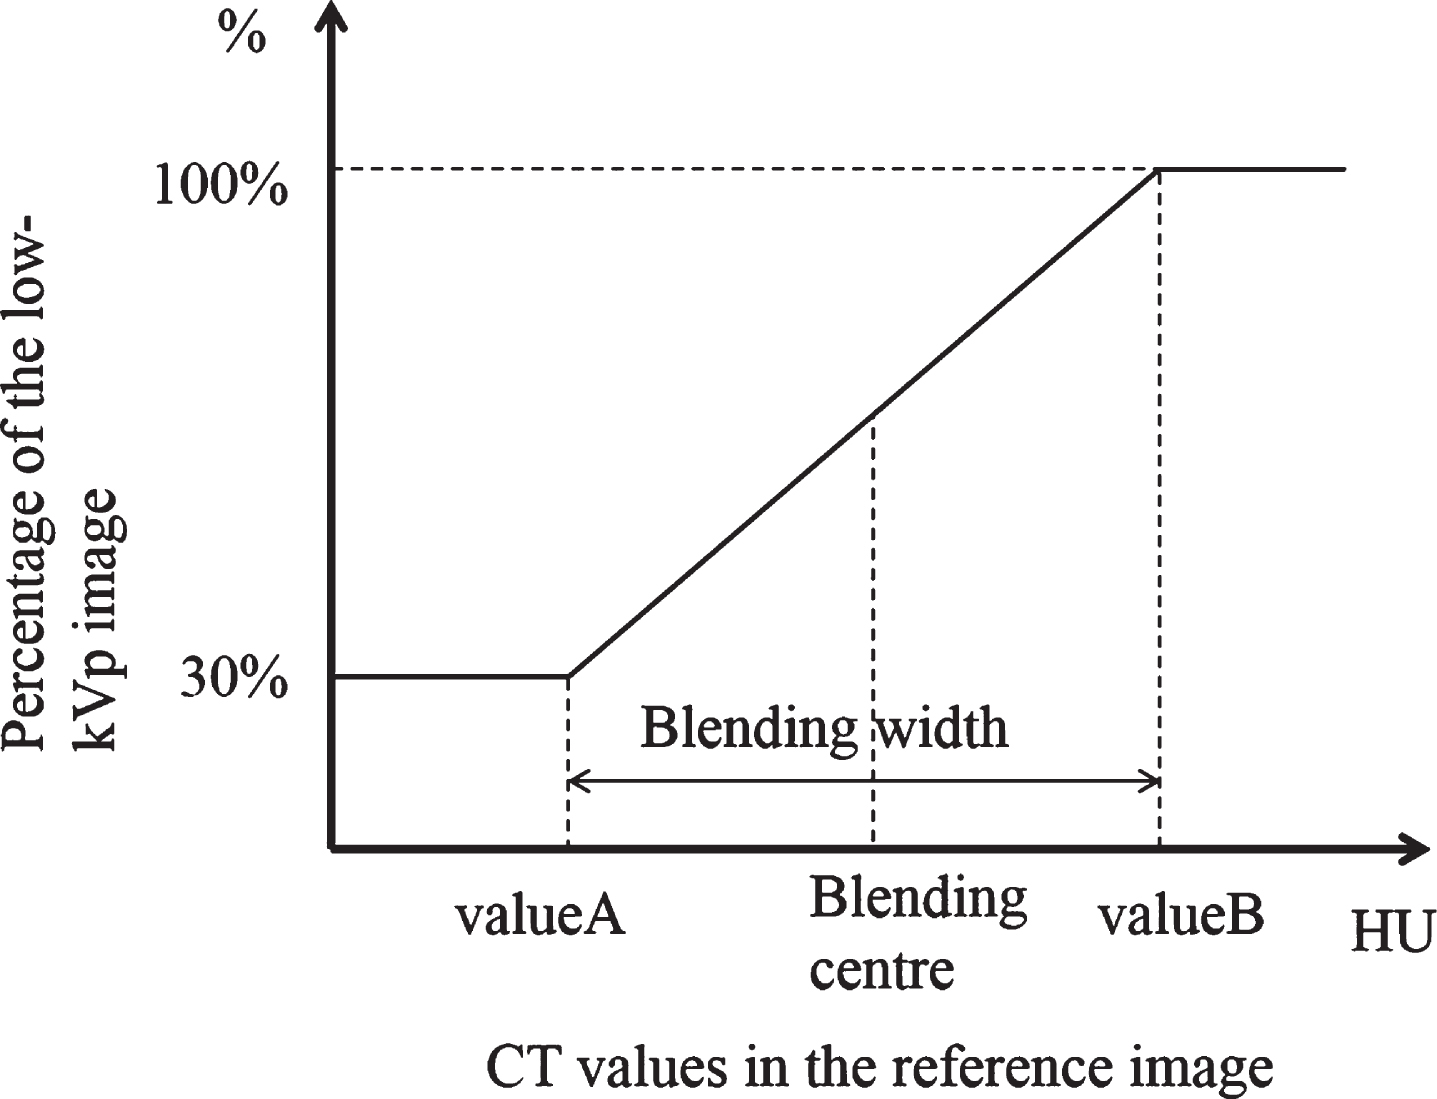
Schematic diagram of a non-linear blending curve. If the CT value of the reference image was smaller than BC-BW/2, the CT value of the 80 kVp image with a ratio of 30% was assigned to the resulting image. If the CT value of the reference image was larger than BC + BW / 2, the CT value of the 80 kVp image with a ratio of 100% was assigned to the resulting image. If the CT value of the reference image was within BC±BW / 2, the mixing ratio of the 80 kVp and 140 kVp image was linearly increased with the reference CT value until 100% of the 80 kVp image was used.
The combination of blending center and blending width determines the shape of the blending curve, which further determines the image qualities of the blended images. To compare the image qualities of the blended image around the ROIs of the hepatic portal vein, four different combinations were investigated. Protocol A used the fixed values of BC and BW (BC = 150 HU, BW = 200 HU). Protocol B used the calculated values of BC and BW by
Protocol C used a calculated blending center using the formula (1) and a blending width which can generate high image qualities, ranging from 0 to 100 HU at an interval of 10 HU. Protocol D used the optimal parameter combination of the blending center and blending width, for which the ROIs of each blended image had the best CNR and SNR, by analyzing the Blending-Property-Map (BP-Map) for each pair of the low and high energy CT images.
An example of a Blending-Property-Map (BP-Map), a concept in the field of data-mine to analyze the computing performance of an algorithm, is shown in Fig. 2. We used MATLAB (r2018b) software (Natick, Massachusetts, US states) to plot the BP-MAP. The X-coordinate axis and Y-coordinate axis are the blending center and blending width, respectively. The Z-coordinate axis is the image quality indicator of all possible combinations of blending center and blending width, which is also calculated in MATLAB. Through an exhaustive search, the combination of optimal blending parameters that generates the best image quality of blended images can be determined for a pair of dual-energy CT images.
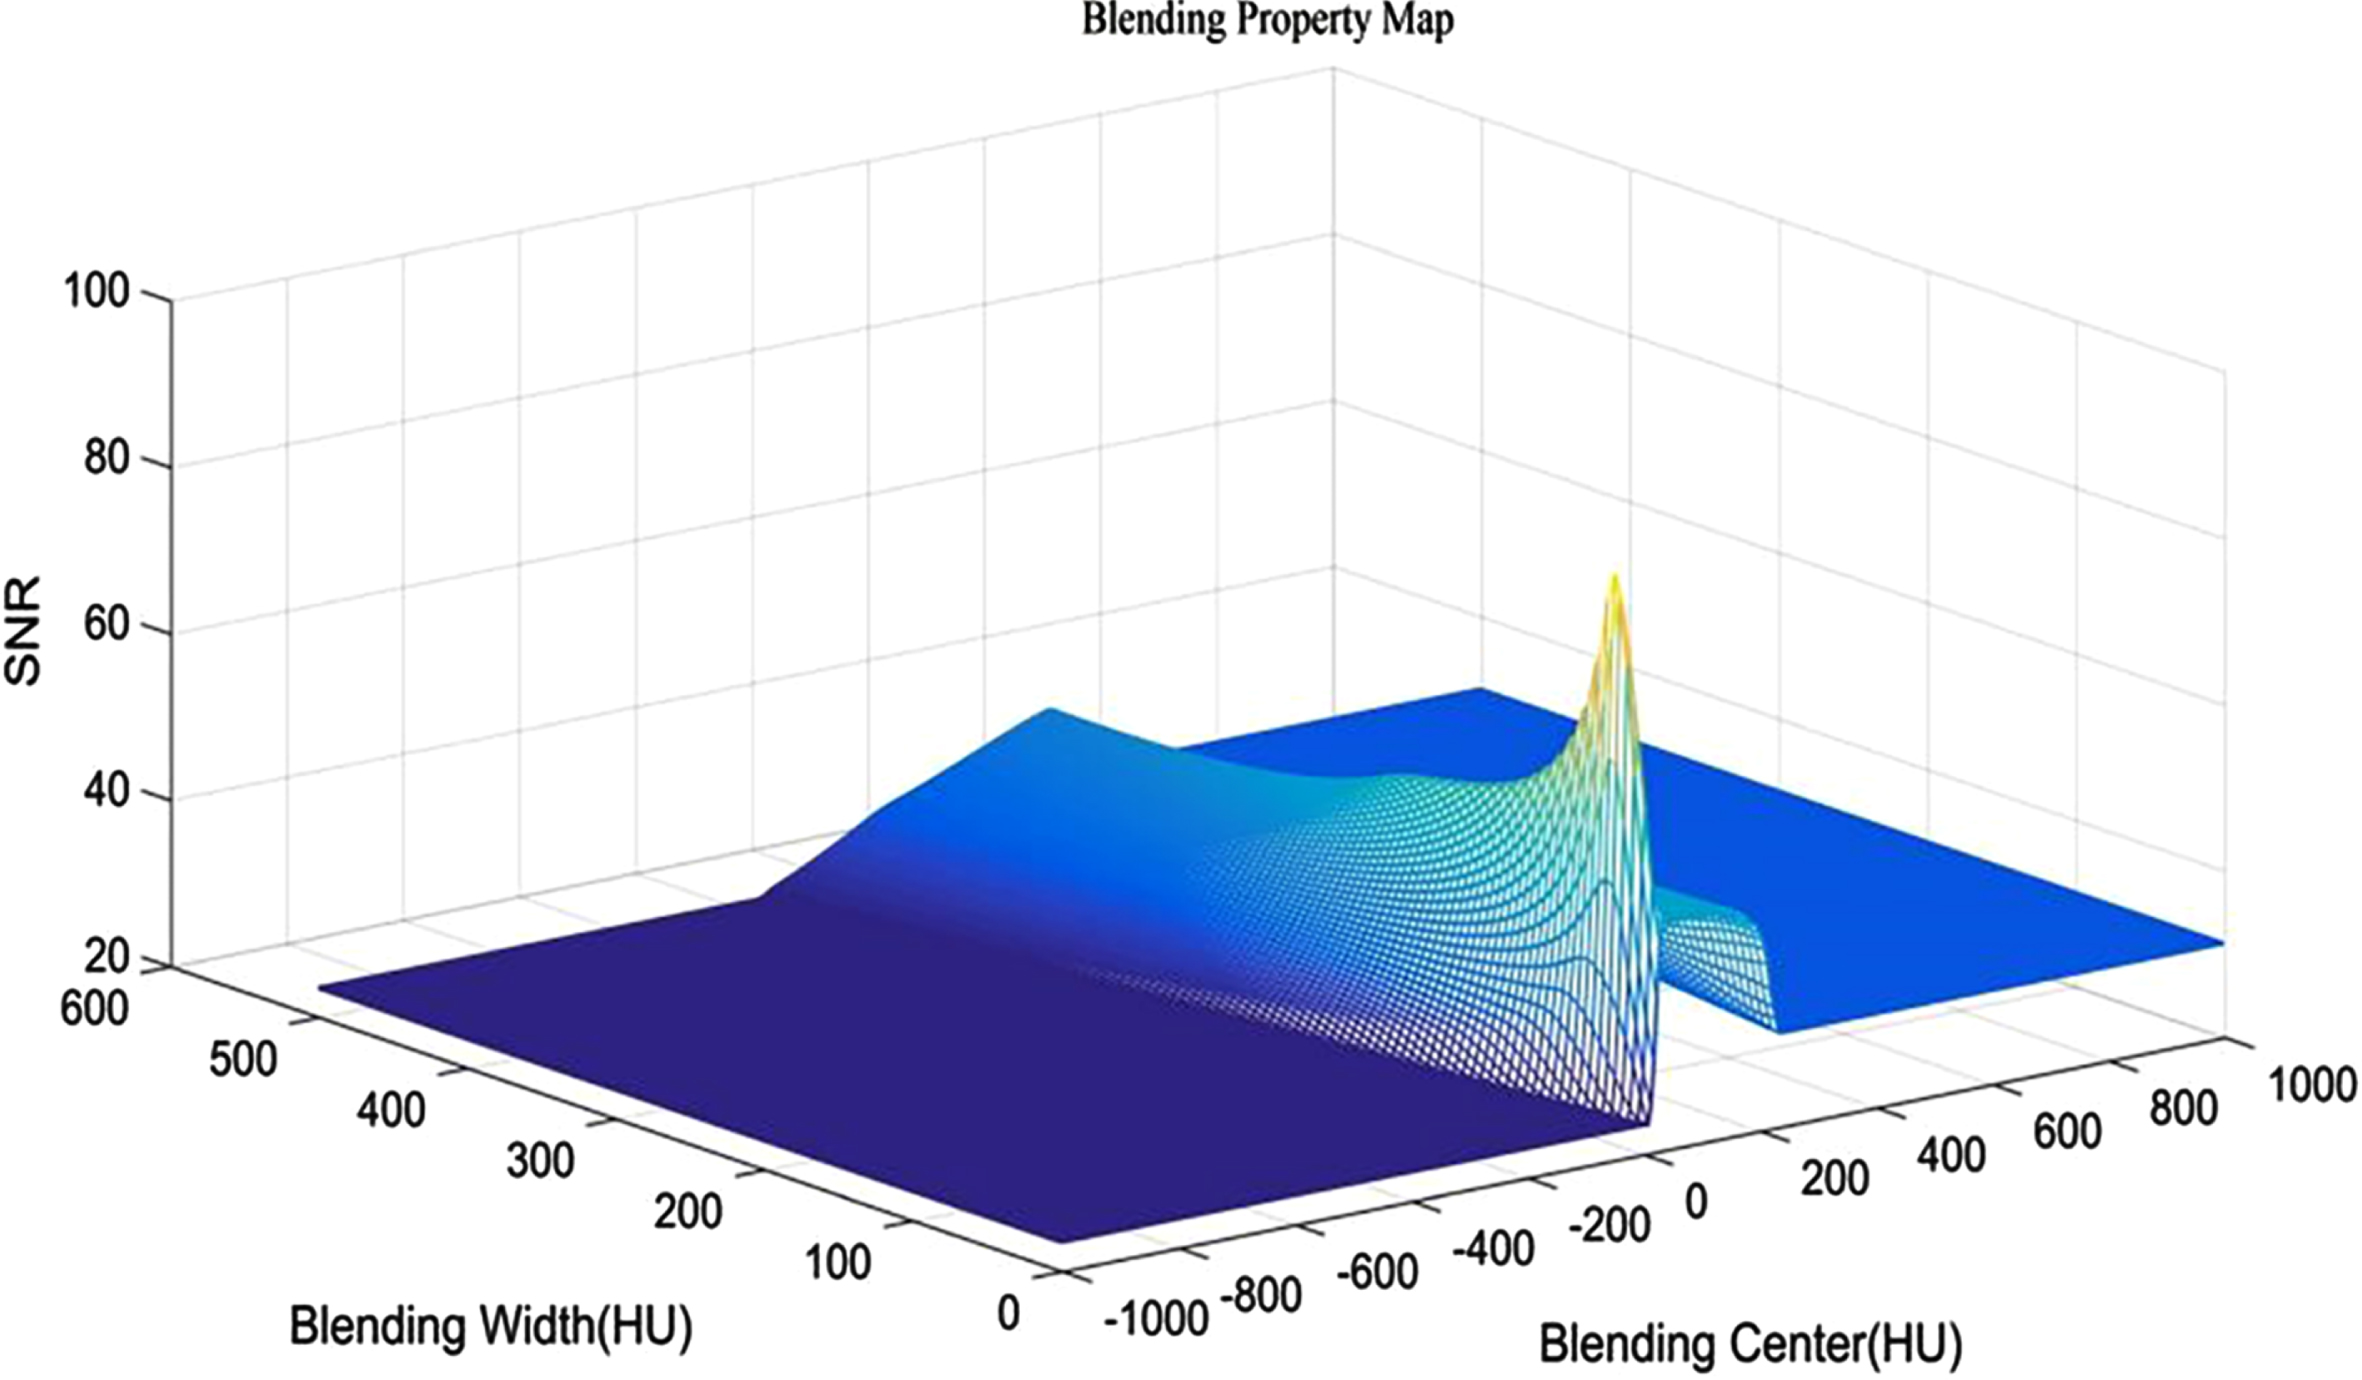
An example of a Blending Property Map. The X-coordinate axis is the blending center, the Y-coordinate axis is the blending width, and the Z-coordinate axis is the calculated signal-to-noise ratio (SNR).
Objective image quality evaluation
The transverse planes containing the ROIs of hepatic portal vein at the right end of the porta hepatis were selected for the blending study. The average CT values of the selected ROIs at the hepatic portal vein, dorsal spinal muscle, abdominal anterior wall fat, and hepatic parenchyma on the blended images were measured. To ensure measurement consistency the following requirements were met: (1) the CT value of the portal vein was the average of the three consecutive layers, (2) the CT value of the spinal muscle avoided the fat layer, and (3) the ROIs in the hepatic parenchyma avoided large vessels and was 1 cm2 for the left lobe, right anterior lobe, and the right posterior lobe of the liver.
The objective indicators to evaluate image quality included SNR and CNR, calculated by
In the equations above, ROIv was the average CT value measured in the hepatic portal vein and its branches, ROIlp was the CT value in the liver parenchyma, and the contrast is the difference of ROIv and ROIlp. SD was the noise of the blended images. Following previous reports, the standard deviations (SD) of the CT values measured at adipose tissue or back muscle were used as the noise, respectively [28]. In this study, therefore, each protocol has four image quality indicators: SNRt and CNRt are based on the calculated noise of the adipose tissue, and SNRm and CNRm are based on the noise of the back muscle. All image quality indicators are all calculated using MATLAB.
All CT images were non-linearly blended on the Siemens workstation with non-linear blending prototype software (Siemens Healthineers). All blended images of the four protocols were subjectively evaluated by two radiologists with more than five years of diagnosis experience. They evaluate independently as well as in consensus. If the score was disputed, it was assessed by another radiologist with at least five years of experience. A 5-grade assessment system was employed: Grade 5, excellent: sharp portal vein anatomy and satisfactory details, no significant image noise, and no interference from surrounding tissues; Grade 4, good: relatively clear anatomy of the portal vein system and details, no significant image noise, and some interference from surrounding tissues; Grade 3, generally acceptable: visible portal vein, significant image noise, and some interference from surrounding tissues; Grade 2, relatively poor: visible portal vein trunk, and significant image noise; Grade 1, poor: fuzzy portal vein trunk and serious image noise. Images with scores less than or equal to 2 were unfit for diagnosis.
Statistical analysis
We used IBM SPSS Statistics 19 (SPSS, Inc., Chicago, USA) software to analyze the objective data. The comparison of the SNR and CNR among the four protocols was performed using the Friedman rank-sum test. A repeated-measures analysis (Wilcoxon signed-rank test with Bonferroni adjustment) was used for the pairwise comparisons between protocol D and the other three protocols.
Results
Objective evaluation
To investigate the image quality of blended dual-energy CT images based on the non-linear sigmoid blending curve, four blending methods with different combinations of blending parameters, i.e. blending center and blending width, were analyzed and statistically compared.
As shown in Table 1, when the abdomen wall adipose tissue was used to calculate noise, the protocol D had the highest SNR (123.22±41.73) and CNR (9.00±3.52), protocol C had the lowest SNR (88.08±23.16), and protocol A had the lowest CNR (6.41±2.66); when using the back muscle to calculate noise, the protocol D still had the highest SNR (75.90±14.52) and CNR (6.39±2.37) while the protocol A had the lowest SNR (70.57±14.30) and CNR (5.14±2.04).
SNR and CNR of blended dual-energy CT images
SNR and CNR of blended dual-energy CT images
SNR: signal-to-noise ratio; CNR: contrast-to-noise ratio. *: the highest value in the group.
Calculated mean ranks and statistical analysis using the Friedman rank-sum test are shown in Table 2. When the noise source was the adipose tissue, the mean ranks of both SNR (4.00) and CNR (3.73) of the protocol D were the highest; when the noise source was the back muscle, the mean ranks of SNR (3.78) and CNR (3.63) of protocol D were the highest and that of protocol A was the lowest (1.55). The mean rank of the CNR in protocol D was the highest.
Statistical analysis and mean ranks of the Friedman rank-sum test for the four protocols
SNR: signal-to-noise ratio; CNR: contrast-to-noise ratio. *p < 0.01 means that there is a significant difference among the four groups.
There was a significant difference among the four groups in the SNR and CNR regardless of whether the calculated noise was from the adipose tissue or back muscle. When the noise source was from adipose tissue, the Chi-square values of both SNR and CNR were larger than the values of SNR and CNR when using the back muscle as the noise source. This demonstrates that using a standard deviation of ROIs on the abdomen wall adipose tissue as noise to calculate SNR and CNR is more effective for obtaining the optimal blending parameters by BP-map.
From the pairwise comparisons shown in Table 3, both the SNR and CNR were significantly different between the protocol D and other protocols regardless of whether the calculated noise was from the adipose tissue or back muscle. The value of z was the difference in the rank-sum between protocol D and other protocols. To analyze the calculated noise source, every item in the column using the adipose tissue as the noise had a higher z than the corresponding item in the back muscle noise column. This indicates that the adipose tissue as noise to calculate SNR or CNR can effectively determine the optimal blending parameters by the proposed BP-Map, through which the highest image quality of blended dual-energy images can be achieved.
Pairwise comparisons of the SNR and CNR from protocol D with the other protocols
z: the difference of the rank-sum between protocol D and one of the other three protocols; SNR: signal-to-noise ratio; CNR: contrast-to-noise ratio. *p < 0.01 means that there is a significant difference among the four groups.
Forty blended dual-energy CT images of each protocol were evaluated by two radiologists. As shown in Table 4, the total score of protocol D was the highest, which had 37 images with a score of 5. Protocol A had the worst score and protocol C was better than protocol B.
Subjective assessment for blended dual-energy CT images of four protocols
Subjective assessment for blended dual-energy CT images of four protocols
A pair of 80 kVp and 140 kVp CT images is illustrated in Fig. 3a and Fig. 3b, respectively. The 80 kVp image has a high contrast but is noisy, yet the 140 kVp has a lower noise but a worse contrast.
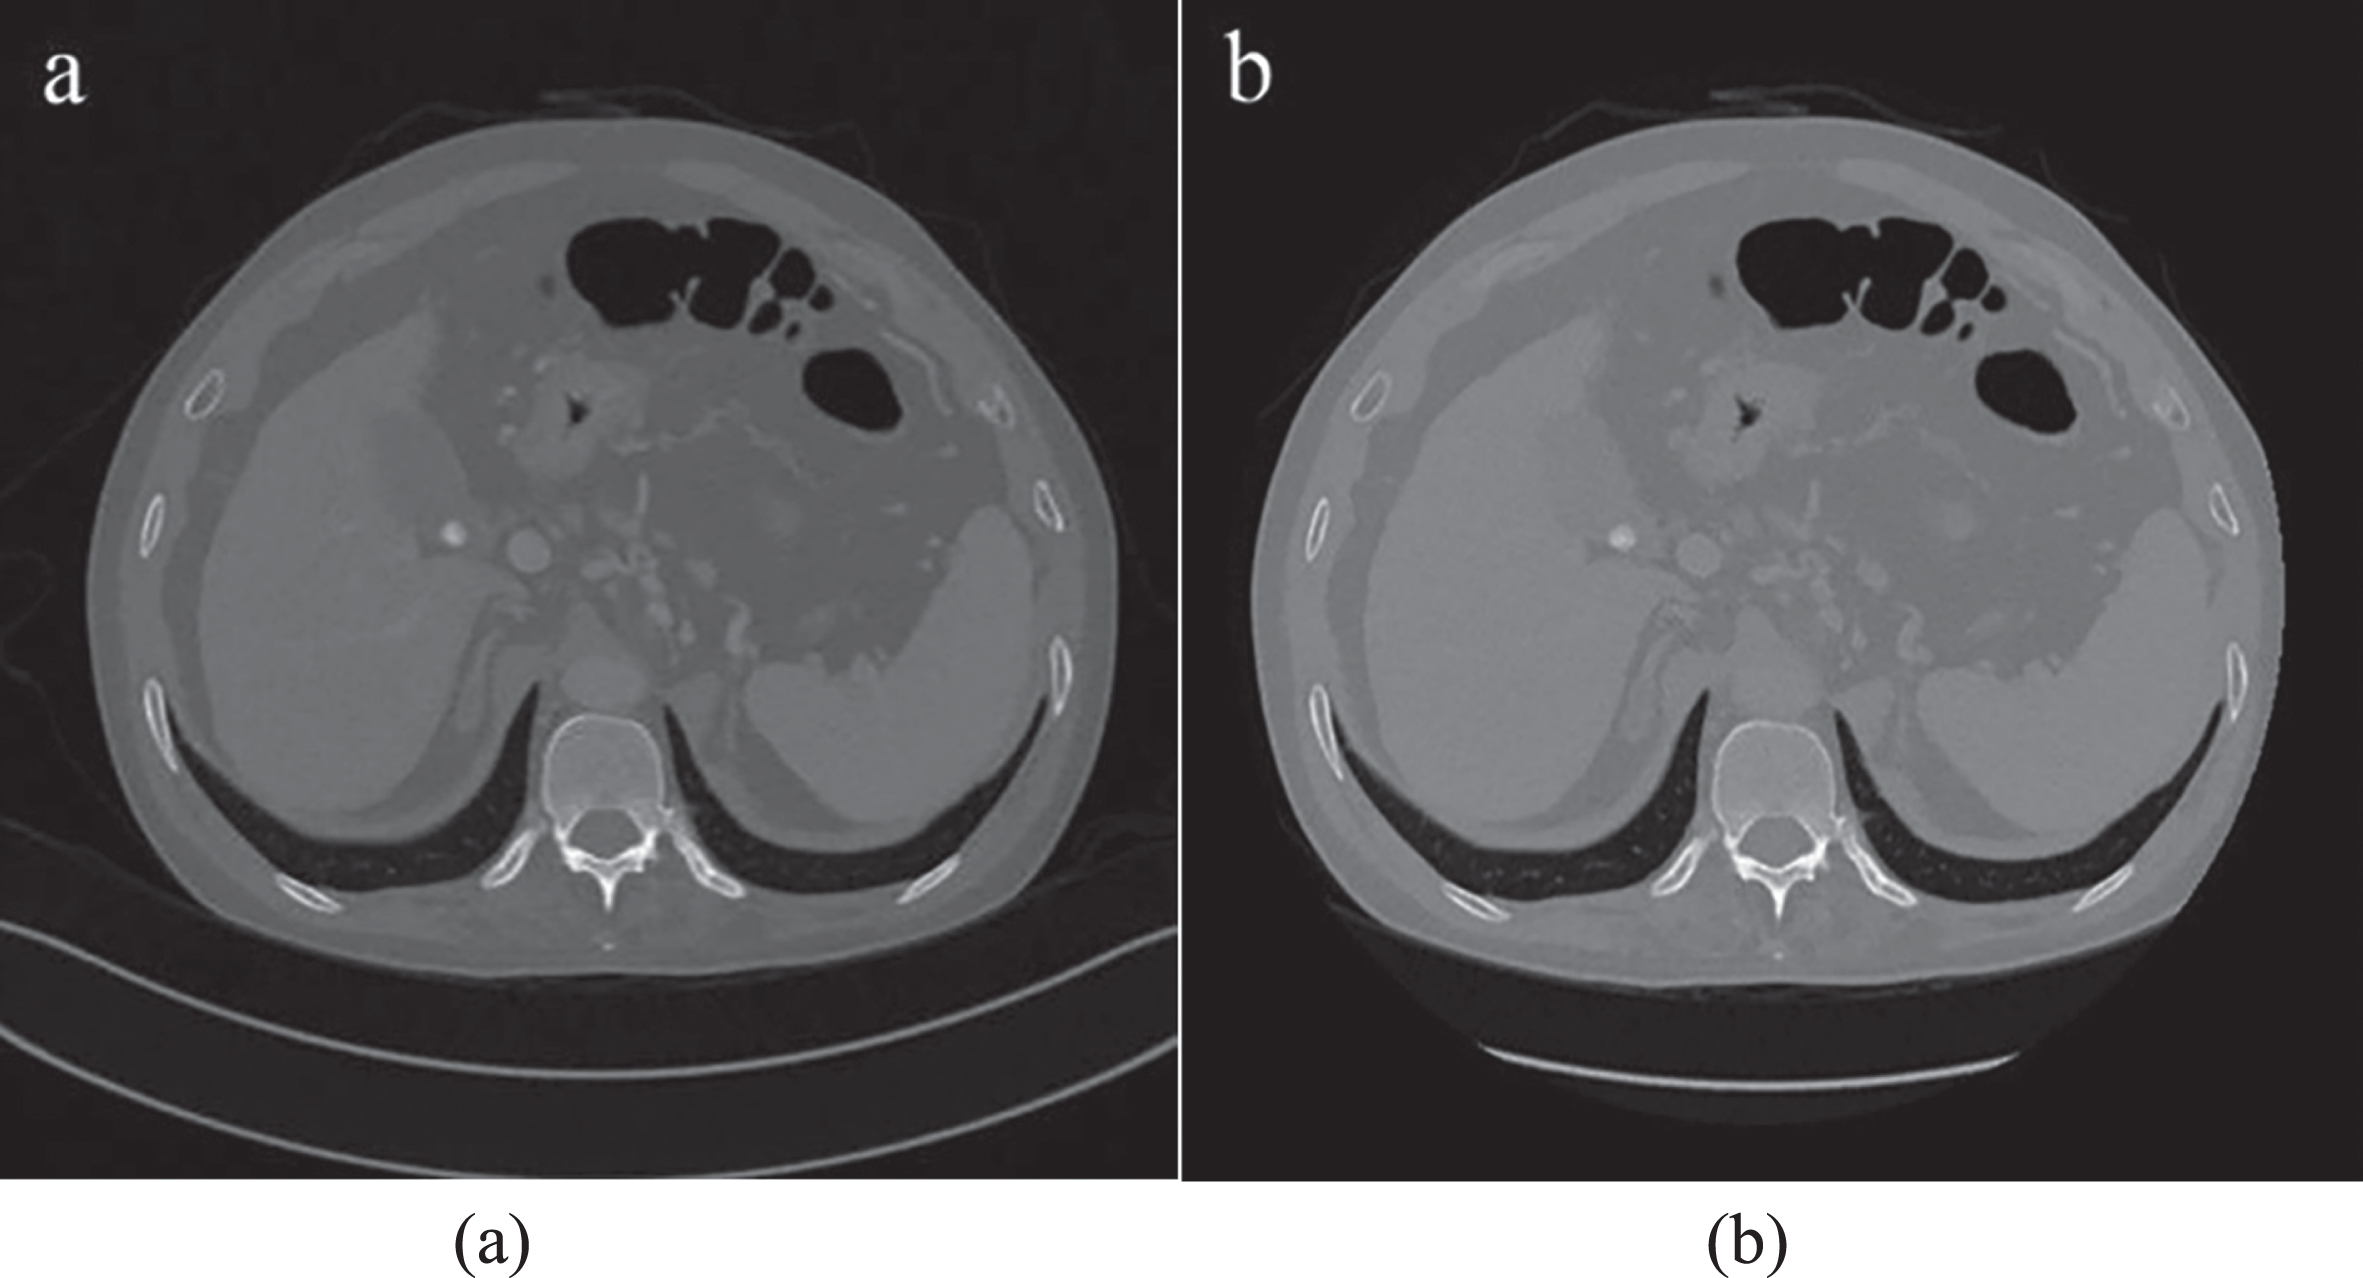
A pair of 80 kVp and 140 kVp CT images. (a) 80 kVp CT image has a high contrast but is noisy. (b) 140 kVp CT image has a lower noise but a worse contrast.
The images were blended non-linearly using the four protocols and are depicted in Fig. 4. Figure 4a is the blended image of protocol A with fixed values of the blending center (150 HU) and blending width (200 HU), and the SNR and CNR of selected ROIs around hepatic portal Veins being 133.63 and 7.24, respectively. Figure 4b (SNR = 134.40, CNR = 8.96) was blended by protocol B with a computed blending center (172 HU) and blending width (31 HU); Fig. 4c is the result of protocol C (blending center = 162 HU, blending width = 4 HU) where SNR and CNR of ROIs are 132.66 and 7.24, respectively. Figure 4d illustrates the blended image with the best image quality using protocol D, with the optimal blended parameter obtained by an exhaustive search on the BP-map; the optimal blending center and blending width being 133 HU and 58 HU, respectively, and the SNR and CNR of selected ROIs around hepatic portal Veins being 246.72 and 12.60, respectively.
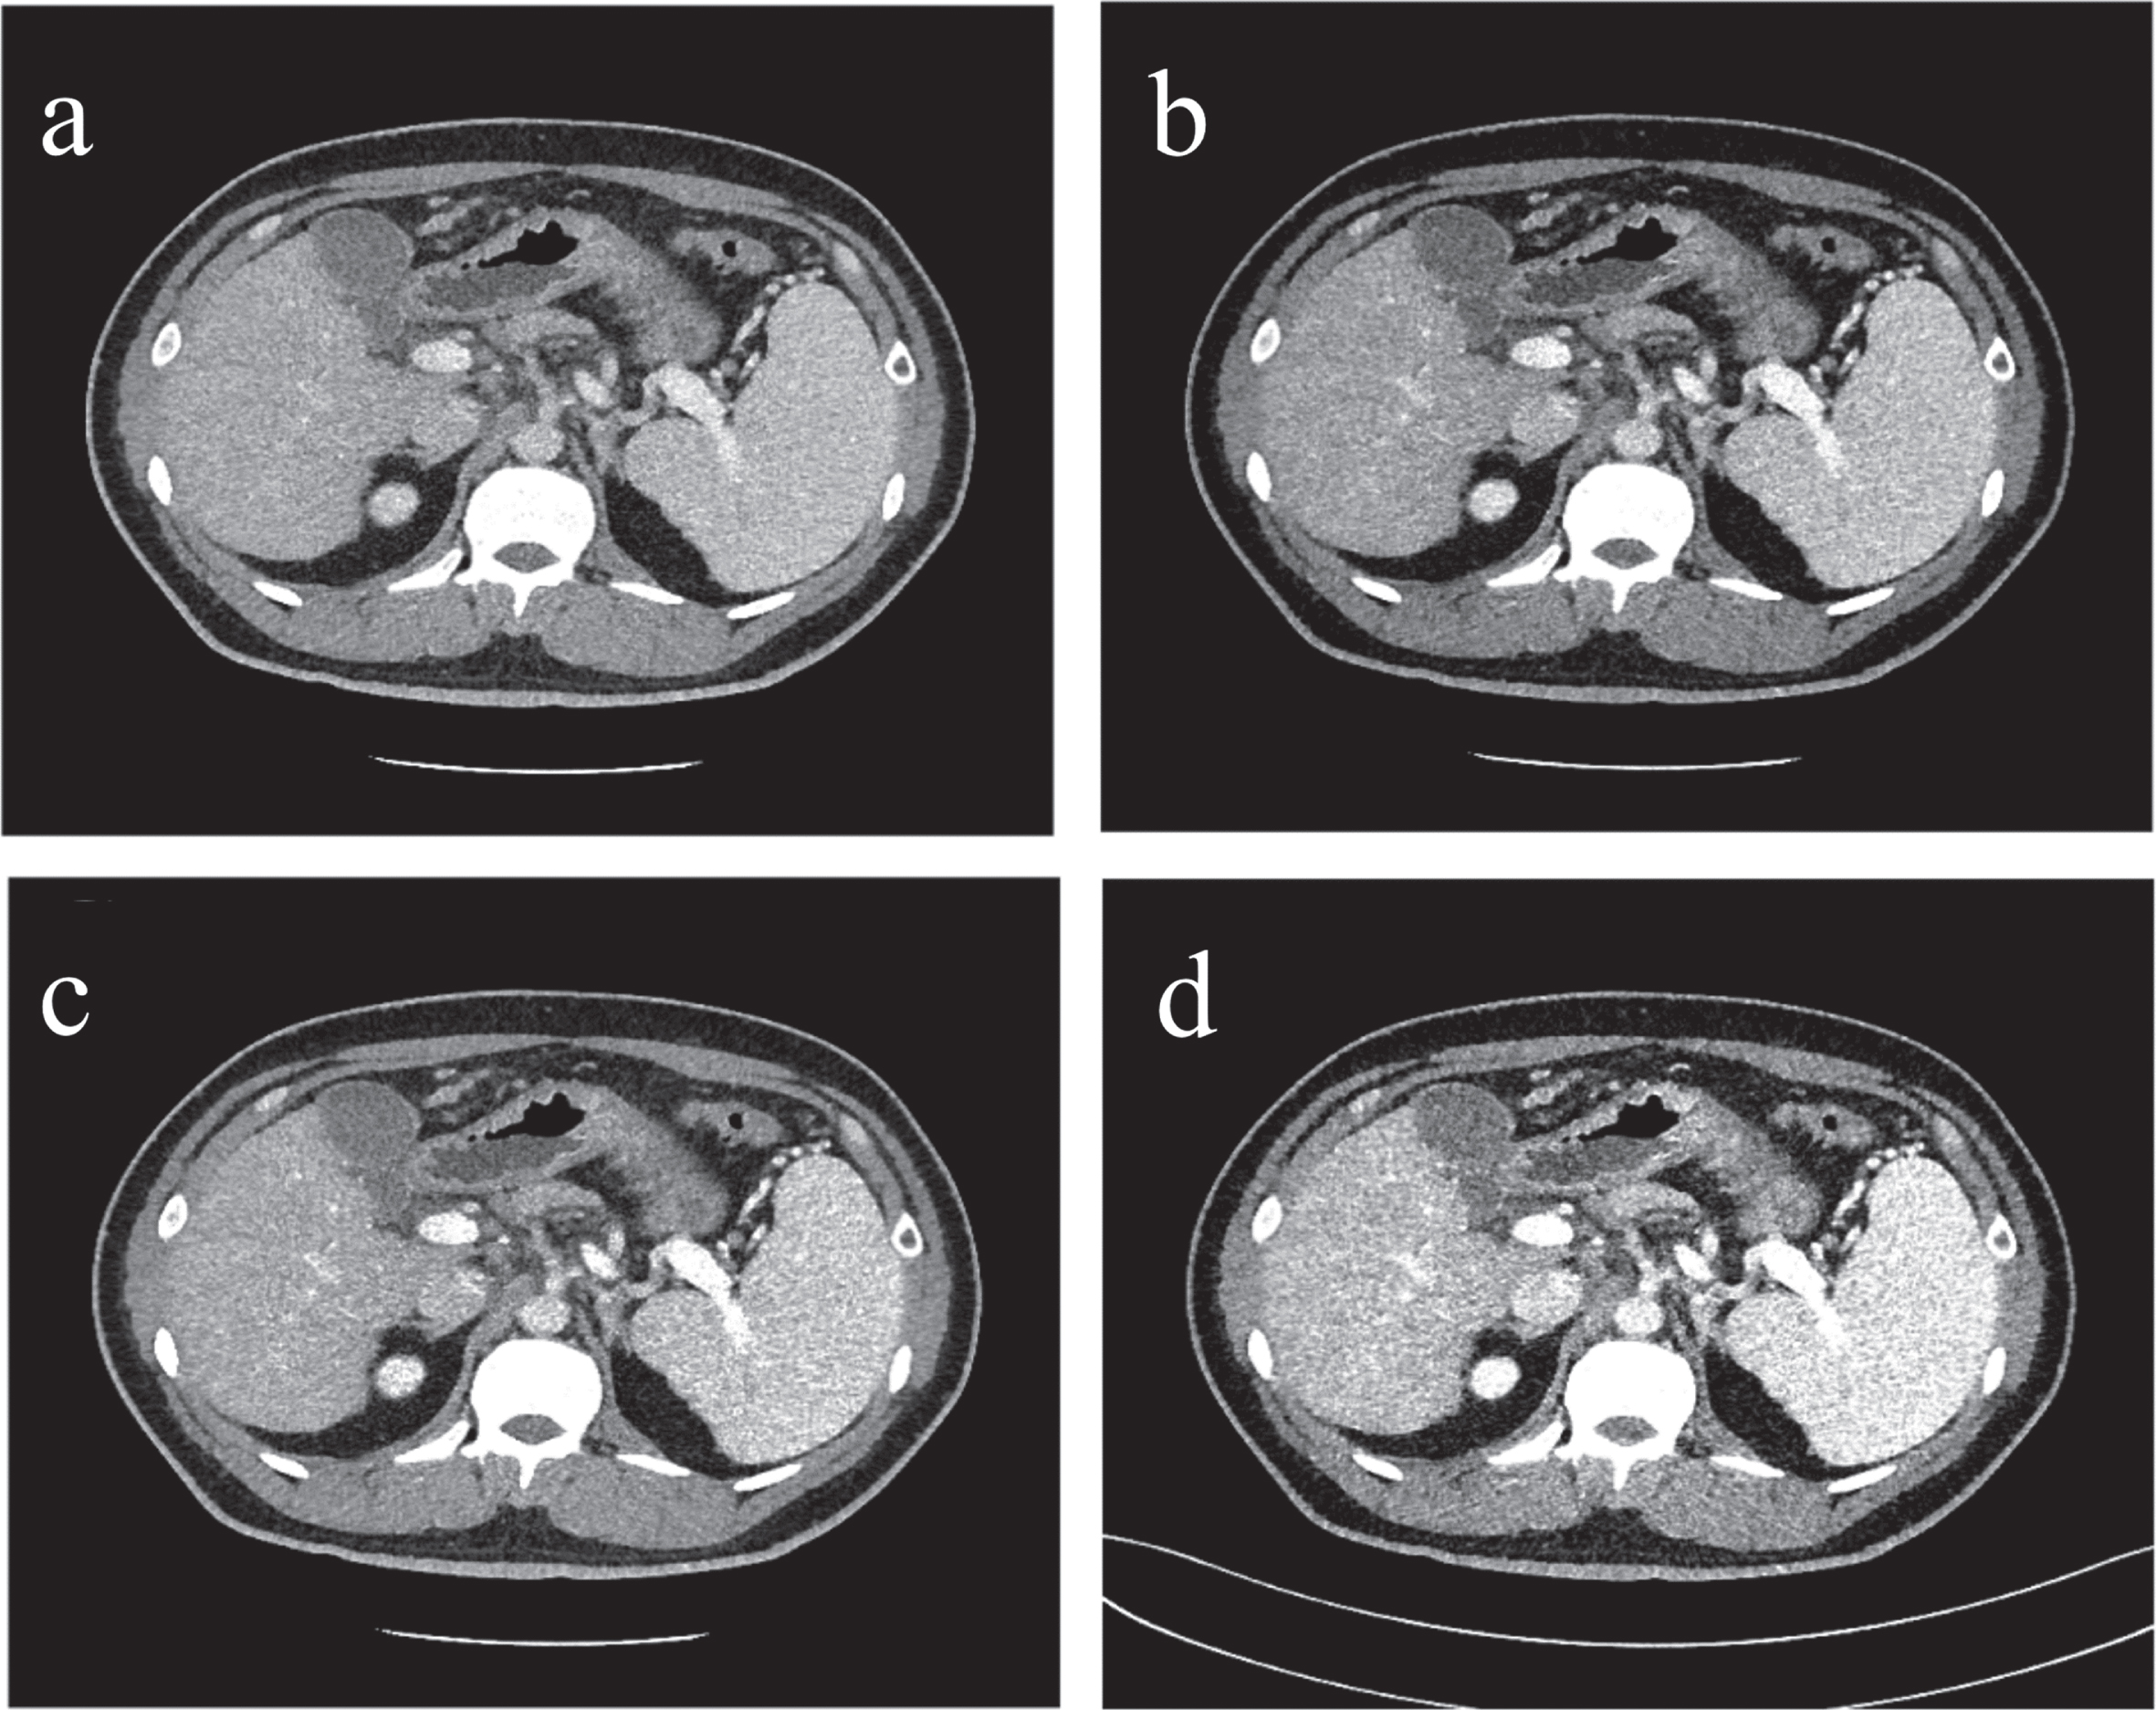
The images blended non-linearly using the four protocols. (a) Blended image of protocol A. (b) Blended image of protocol B. (c) Blended image of protocol C. (d) Blended image of protocol D.
Discerning the highest value of the calculated quality indicator, SNR or CNR, on the BP-Map can reveal optimal blended parameters of the sigmoid blending curve, with the best non-linearly blended image quality especially around the selected ROIs. The distribution of optimal blended parameters of the forty pairs dual-energy CT images and the scatter diagrams of the blending width and blending center are shown in Fig. 5. Figure 5a illustrates the distribution of optimal parameters generating the image with the highest SNR and Fig. 5b shows the scattering of optimal parameters to obtain the highest CNR. In Fig. 5a, the majority of scattered points distribute around the left bottom (blending width from 0 to 100 HU, blending center from –150 to 50 HU). In contrast, there are two groups of scattered points in Fig. 5b, i.e. the top left corner (0–20 HU blending width, 100–200 HU blending center) and the bottom (blending width of 0–80 HU, blending center of –150-50 HU). Therefore, different pairs of dual-energy CT images have different combinations of optimal blending parameters. It is difficult to determine the optimal blending center and width by constant or calculated value directly. Using BP-Map to search for optimal blending parameter case-by-case is a suitable option for obtaining the best image quality.

The distribution of optimal blended parameters of the forty pairs dual-energy CT images and the scatter diagrams of the blending width and blending center. (a) The best blending width and blending center for the SNR. (b) The best blending width and blending center for the CNR.
Non-linear mixing technology can effectively improve the image quality of DECT [26]. However, previous studies did not identify the exact optimal parameters of nonlinear blending methods. In Previous studies, nonlinear blending parameters were selected blending center = 150 HU and blending width = 120 HU according to the vendor’s default [23, 24]. Qi Wang et al. [27] chose 3 groups of values for BC and 16 groups of values for BW, then 48 sets of images were generated. They calculated the best CNR to determine the optimal BC and BW. However, there were a limited number of groups. No one can be sure the optimal BC and BW were not missed. Thus, this study is devoted to finding the optimal blending parameters for each individual, rather than using the same blending center and blending width for different images.
This study compared the BP-Map with traditional methods of finding the optimal parameters of non-linear blending to obtain the best SNR and CNR. We show that BP-Map can provide the best SNR and CNR for imaging diagnosis.
The parameters in protocol A are provided by the Siemens software and are widely used as the optimal parameters for non-linear blending for abdominal organs and vessels. The fixed values are convenient to use and provide a relatively good image quality for diagnosis. However, this study demonstrated that these parameters may not be the best for determining the blending center and blending width. Different organs require different optimal blending widths and blending centers. Even similar tissue requires different parameters for the best SNR and CNR when the background tissue and the reference noise change.
The CT values of the portal vein and hepatic parenchyma increase when the percentage of low-kVp image increases. Based on the theory of non-linear blending, if the noise is steady, the parameters in protocol B should mathematically be the optimal parameters for non-linear blending according to the process of non-linear blending. In other words, the results of protocol B should match those of the protocol D. However, the results of the four groups show that all objective evaluation indicators of the protocols A, B, and C are significantly smaller than that of the protocol D. As observed through the noise spectra of the two reference tissues, the noise is not steady but changes with the blending center and blending width. The noise of different human tissues requires further studies to clarify its change rule.
The protocol C method is similar to the BP-Map in a small range of blending widths. Protocol C has also been used to search for the optimal non-linear blending parameters in some studies; however, the blending width range in protocol C is part of the BP-Map. When the blending center is fixed, the SNR and CNR change with the blending width. The blending width is a 2-D function with a single variable. In the 2-D function, the effect of the blending center cannot be expressed. BP-Map is a 3-D function with the two variables, blending width and blending center, and it shows the changing trend when the two parameters change at the same time. In protocol C, the blending width is 0 HU and we adopted the low-kVp image data where the CT value is the blending center value in the reference image to avoid the jump point when exporting the blended image.
The irregular distribution of the best blending width and blending center demonstrates the difficulty in concluding a general formula to acquire the optimal blending width and blending center for the highest SNR and CNR. The non-linear blending parameters should be individualized. Therefore, BP-Map, which calculates the parameters case-by-case, can achieve this goal whereas the other methods cannot.
However, this study still has its limitations. More samples in this study would lead to the results being more conclusive. Furthermore, the target organ in this study was the portal vein and other organs such as the spleen, liver, and bile duct, which should be the future target organs for further research. In addition, the noise was an uncertain factor in this study and we were unable to obtain the characteristics of the noise. One may choose other tissues as a noise resource in the future to clarify the noise characteristics of the different tissues in the human body.
As shown through the statistical result of 40 samples, BP-Map is better than the other three methods in selecting for the optimal parameters of non-linear blending with a significant difference and can provide better-blended images with a higher SNR and CNR.
Conclusions
Compared to the traditional procedure for blending the two CT images scanned by different X-ray energies, BP-Map is an effective tool to determine the optimal blending parameters by an exhaustive search and to generate the best image quality of blended images for a pair of dual-energy CT images with the highest SNR and CNR.
Footnotes
Acknowledgments
This study was funded by Tianjin Natural Science Foundation (17JCZDJC32500).