
Abstract
OBJECTIVE:
To investigate feasibility of applying deep learning image reconstruction (DLIR) algorithm in a low-kilovolt enhanced scan of the upper abdomen.
METHODS:
A total of 64 patients (BMI<28) are selected for the enhanced upper abdomen scan and divided evenly into two groups. The tube voltages in Group A are 100kV in arterial phase and 80kV in venous phase, while tube voltages are 120kV during two phases in Group B. Image reconstruction algorithms used in Group A include the filtered back projection (FBP) algorithm, the adaptive statistical iterative reconstruction-Veo (ASIR-V 40% and 80%) algorithm, and the DLIR algorithm (DL-L, DL-M, DL-H). Image reconstruction algorithm used in Group B is ASIR-V40%. The different reconstruction algorithm images are used to measure the common hepatic artery, liver, renal cortex, erector spinae, and subcutaneous adipose in the arterial phase and the average CT value and standard deviation of the portal vein, liver, spleen, erector spinae, and subcutaneous adipose in the portal phase. The signal-to-noise ratio (SNR) is calculated, and the images are also scored subjectively.
RESULTS:
In Group A, noise in the aorta, liver, portal vein (the portal phase), spleen (the portal phase), renal cortex, retroperitoneal adipose, and muscle is significantly lower in both the DL-H and ASIR-V80% images, and the SNR is significantly higher than those in the remaining groups (P<0.05). The SNR of each tissue and organ in Group B is not significantly different from that in DL-M, DL-L, and ASIR-V40% in Group A (P>0.05). The subjective image quality scores in the DL-H and B groups are higher than those in the other groups, and the FBP group has significantly lower image quality than the remaining groups (P<0.05).
CONCLUSION:
For upper abdominal low-kilovolt enhanced scan data, the DLIR-H gear yields a more satisfactory image quality than the FBP and ASIR-V.
Keywords
Introduction
The computed tomography (CT) is becoming more common in abdominal applications, while ionizing radiation may pose a potential cancer-inducing risk. As a result, several techniques, including various algorithms, have been applied to CT to reduce and monitor radiation dosages. The filtered back projection (FBP) algorithm is the standard algorithm for CT. However, when the radiation dosage is reduced, the image quality obtained is not satisfactory [1]. Currently, the iterative reconstruction (IR) algorithms, such as the adaptive statistical iterative reconstruction-Veo (ASIR-V), are widely used in the CT examinations of various sites to reduce the noise and radiation dosage while maintaining the image quality [2, 3]. However, studies have shown that for the low-contrast diagnostic tasks, such as detecting the hepatic metastasis and pancreatic mass, the IR algorithm leads to a reduced spatial resolution and reduced low-contrast detection of the low-contrast structures if the radiation dosage is reduced by greater than 25% [4]. In recent years, in the field of medical imaging, artificial intelligence (AI) research has made rapid progress. Deep learning, as a branch of AI, can automatically learn the features of sample images that can match or even surpass the performance of experts in certain tasks.
Deep learning image reconstruction (DLIR) algorithm is divided into three levels, which are DL-L, (low) DL-M (medium) and DL-H (high) from low to high, according to different noise reduction capabilities [5]. Compared to the IR algorithm, the deep learning image reconstruction (DLIR) can reduce the image noise while maintaining the noisy texture, together with improvement in the spatial resolution and detection capability [6]. The present study aimed to compare the effects of DLIR, IR, and FBP algorithms on the image quality of low-kilovolt enhanced scans of the upper abdomen and further explore the clinical application value of the DLIR algorithm.
Materials and methods
General materials
Patients who visited our hospital for upper abdominal enhancement scans from March to June 2020 were selected and randomly divided into two groups, with Group A for the low-kilovolt group and Group B for the regular dosage group (the specific parameters are described below). The inclusion criteria were as follows: (1) Patients over the age of 18; (2) Patients without severe renal or hepatic abnormalities that prevented the performing of CT enhancement scanning; (3) Patients with a body mass index (BMI) of less than 28 kg/m2; and (4) Patients who were informed and signed consent. There were 32 patients enrolled in each group.
The study was conducted in accordance with the Declaration of Helsinki (as was revised in 2013). The study was approved by Ethics Committee of the Fourth Hospital of Hebei Medical University and informed consent was taken from all the patients.
CT examination and reconstruction
Patients with low kV enhanced scan of upper abdomen were enrolled as follows: (1) Patients without severe liver and kidney function abnormalities and unable to undergo enhanced CT scan; (2) Body mass index (BMI) less than 28kg/m2; and (3) Signing the informed consent. All the examinations were conducted on a Revolution CT scanner (General Electrical Company, Milwaukee, Wisconsin, U.S.A.). The patients were placed in the supine position, and after the completion of the positional image scan, an upper abdominal plain scan was routinely performed, followed by an upper abdominal enhancement scan. The scan ranged from the top of the diaphragm to the level of the lower border of the liver. The non-ionic iodine contrast agent (Iohexol, 300mg/ml) was used at a dosage of 1.5ml/kg, and an injection rate of 3ml/s. The contrast automatic bolus tracking technique was adopted, and the trigger level was the abdominal aorta at the level of the abdominal trunk with a trigger threshold of 100 HU. The arterial phase scan was delayed for 10s, and the portal phase scan was delayed for 40s with the arterial phase’s completion. In Group A, the tube voltage was 120kV. The tube voltage during the arterial phase was 100kV, and the tube voltage during the venous phase was 80kV. In Group B, the tube voltages during the three phases were all 120kV. The rest of the scanning parameters were as follows: The automatic tube current modulation technology was adopted with the current between 200–500mA, the noise index (NI) of 8.0, the collimation of 128×0.625mm, rotation time of 0.5s, the pitch of 0.992:1, the image matrix of 512×512, the reconstructed layer thickness and layer interval of 1.25mm, respectively. Different image reconstruction algorithms (0–80% ASIR-V) are reconstructed by the device itself and do not involve software packages.
The AW4.7 Workstation is known as Advantage Workstation and is a post-processing Workstation produced by GE’s CT equipment. The dual-phase enhanced data reconstruction algorithm in Group A were as follows: FBP, ASIR-V (with the intensity of 40% and 80%, respectively), DLIR algorithm (three gears as the low DL-L, moderate DL-M, and high DL-H, respectively). ASIR-V40% means that the proportion of ASIR-V in the reconstruction algorithm is 40% and that of FBP algorithm is 60%. ASIR-V80% refers to the proportion of ASIR-V and FBP in the reconstruction algorithm, which accounts for 80% and 20%. ASIR-V40% algorithm was adopted in Group B. All images were automatically transferred to the AW4.7 workstation for measurement and analysis. The objective measurement of each tissue and organ required three times of ROI measurement and average value, which did not involve objective evaluation of lesions. Subjective evaluation involves the evaluation of lesions according to the number of specific lesions, generally no more than three. Last, CTDIvol was recorded, and the effective dosage (the abdominal conversion factor of 0.015) was calculated.
Image assessment
Objective measurement
One physician with more than five years’ experience in diagnostic imaging measured the CT values and standard deviation (SD) of the common hepatic artery, portal vein (the venous phase), liver, spleen (the venous phase), subcutaneous adipose, and the erector spinae from the images during the arterial and portal phase from each data set. When measuring the non-vascular tissues and organs, the selection of the region of interest (ROI) should avoid the areas of blood vessels, hemorrhage, necrosis, cystic changes, and calcification. All tissue and organs were measured three times with the averaged value taken. The signal-to-noise ratio (SNR) for tissue and organs was calculated by the formula: SNR=CT value/SD.
Subjective evaluation
Two physicians with more than five years’ experience in diagnostic imaging evaluated the images using single-blind methods. The 5-point scale was used [7] namely, grade 1, set at 1 point, indicating excellent images; grade 2, set at 2 points, indicating the better than average images; grade 3, set at 3 points, indicating the average images; grade 4, set at 4 points, indicating poor images; grade 5, set at 5 points, indicating images not suitable for diagnosis. The 5-point scale criteria were composed of three parts: the lesion display, image sharpness, and noise level. The details were as follows. For lesions: Grade 1, good lesion display; Grade 2, lesion easily displayed; Grade 3, lesion could be displayed; Grade 4, difficulty in lesion display; Grade 5, lesion unable to be displayed. For image sharpness of organs: Grade 1, clear and well-developed organ edges; Grade 2, relatively clear organ edges; Grade 3, proper clear organ edges; Grade 4, blurred organ edges; Grade 5, unclear organ edges. For noise levels: Grade 1, no noise visible to the naked eye; Grade 2, low noise level; Grade 3, moderate noise level; Grade 4, high noise level; Grade 5, obvious noise that affects the diagnosis.
Statistical analysis
The statistical software SPSS 11.5 version was adopted. The measurement data were expressed as x±S. The repeated-measures ANOVA and LSD t-tests were conducted. The data were tested for variance congruence. The Kappa test was adopted to test the consistency of subjective assessment of the images by two physicians. Friedman’s test and Bonferroni correction were used to compare the subjective scores of image quality between groups. P<0.05 was considered statistically significant.
Results
In Group A, there were eight lung cancer cases with hepatic metastases, eight cases of primary liver cancer, 18 cases of post-operative re-examination for gastric cancer, and six cases of hepatocellular carcinoma after the intervention. There were 20 males and 12 females, with an average age of 53.5±8.6 years and an average BMI of 22.32±2.89kg/m2. In Group B, there were five lung cancer cases with hepatic metastases, seven cases of primary liver cancer, ten cases of post-operative re-examination for gastric cancer, five cases of pancreatic cancer, and five cases of hepatocellular carcinoma after the intervention. There were 19 males and 13 females with an average age of 55.5±6.6 years and an average BMI of 23.42±3.19kg/m2. There was no statistical difference in gender, age, and BMI between the two groups (P>0.05). The average dosage of contrast media was 91±13ml. In Group A, the average CTDIvol (the arterial phase) was 10.83±0.92 mGy, the average CTDIvol (the venous phase) was 5.45±0.35 mGy, and the average radiation dosage was 4.8±0.9 mSv. In Group B, the average CTDIvol (the arterial phase and the venous phase) was 13.6±1.5 mGy, and the average radiation dosage was 8.7±1.8 mSv. The CTDIvol and the average radiation dosage in Group B were higher than those in Group A (P<0.05). The average CT values, noise, and SNR of images of the common hepatic artery, portal vein (the venous phase), liver, spleen (the venous phase), retroperitoneal adipose, and muscle (the erector spinae was selected) in each group in Group A are shown in Tables 1 and 2, and Figs. 1 and 2. There was no statistical difference between the DL-H group and ASIR-V80% group in Group A (P>0.05), while the SNR in the DL-H group and the ASIR-V80% group were significantly higher than those in the remaining groups (P<0.05). There was no statistical difference among the DL-M group, DL-L group, and ASIR-V40% group (P>0.05). The noise in the FBP group was significantly higher than that in the other groups, and the SNR in the FBP group was significantly lower than that in the remaining groups (P<0.05). The average CT values, noise, and SNR of each tissue and organ in the arterial and venous phase in Group B were not statistically different from those in the DL-H group and ASIR-V80% group in Group A (P>0.05), but were significantly higher than those in the remaining groups (P<0.05). The SNR of each tissue and organ (the arterial and venous phases) in the images of Group B was not statistically different from those in the DL-M group, DL-L group, and ASIR-V40% group in Group A (P>0.05). It was lower than those in the DL-H group and the ASIR-V80% group and higher than in the FBP group (P<0.05). The Kappa values of the images in each group were all greater than 0.5, suggesting that physicians’ subjective evaluations on the image quality were reasonably consistent. The image quality of each group scored by two physicians (as shown in Table 3) revealed that there was no statistical difference in the scores between the DL-H group and Group B (P>0.05), which were significantly higher than those in the remaining groups (P<0.05). There was no statistical difference in the image quality between the DL-M group, DL-L group, ASIR 40% group, and 80% group (P>0.05), while the image quality in the FBP group was significantly lower than that in the other groups (P<0.05).
The average CT value, noise and SNR of each tissue and organ in the arterial phase in each group
The average CT value, noise and SNR of each tissue and organ in the arterial phase in each group
The average CT value, noise and SNR of each tissue and organ in the portal phase in each group
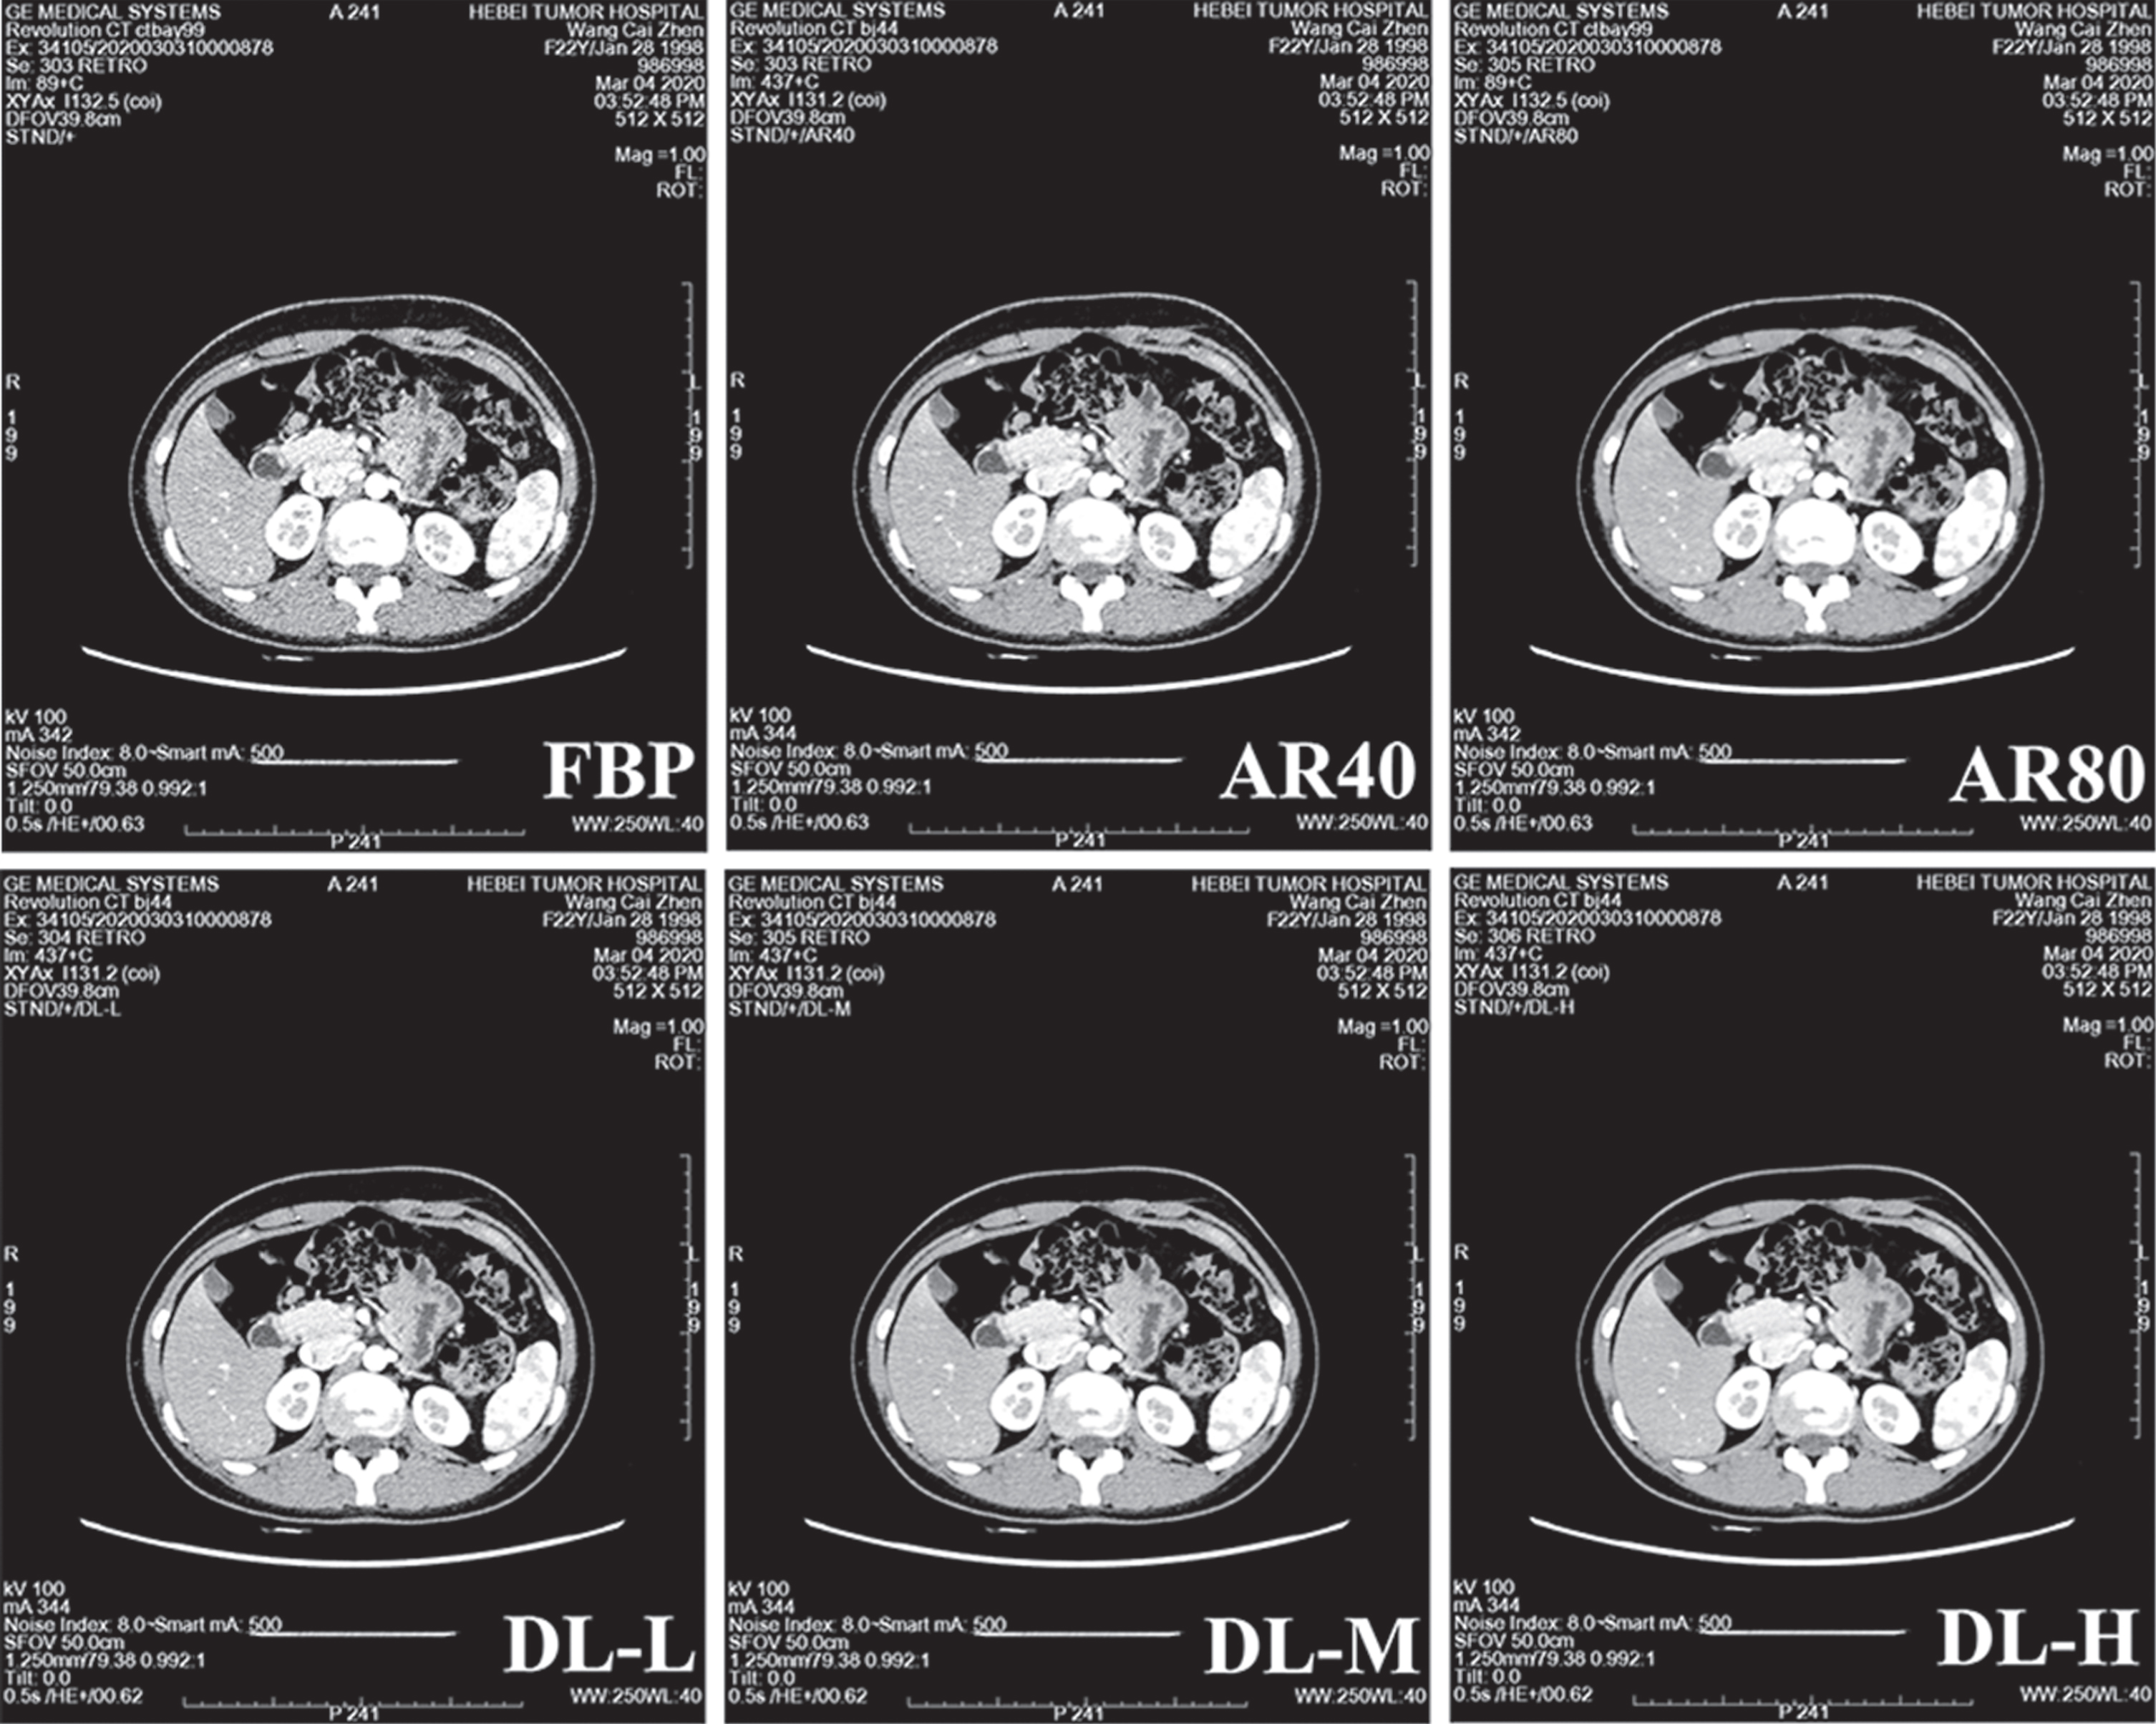
The image in the arterial phase in Group A.
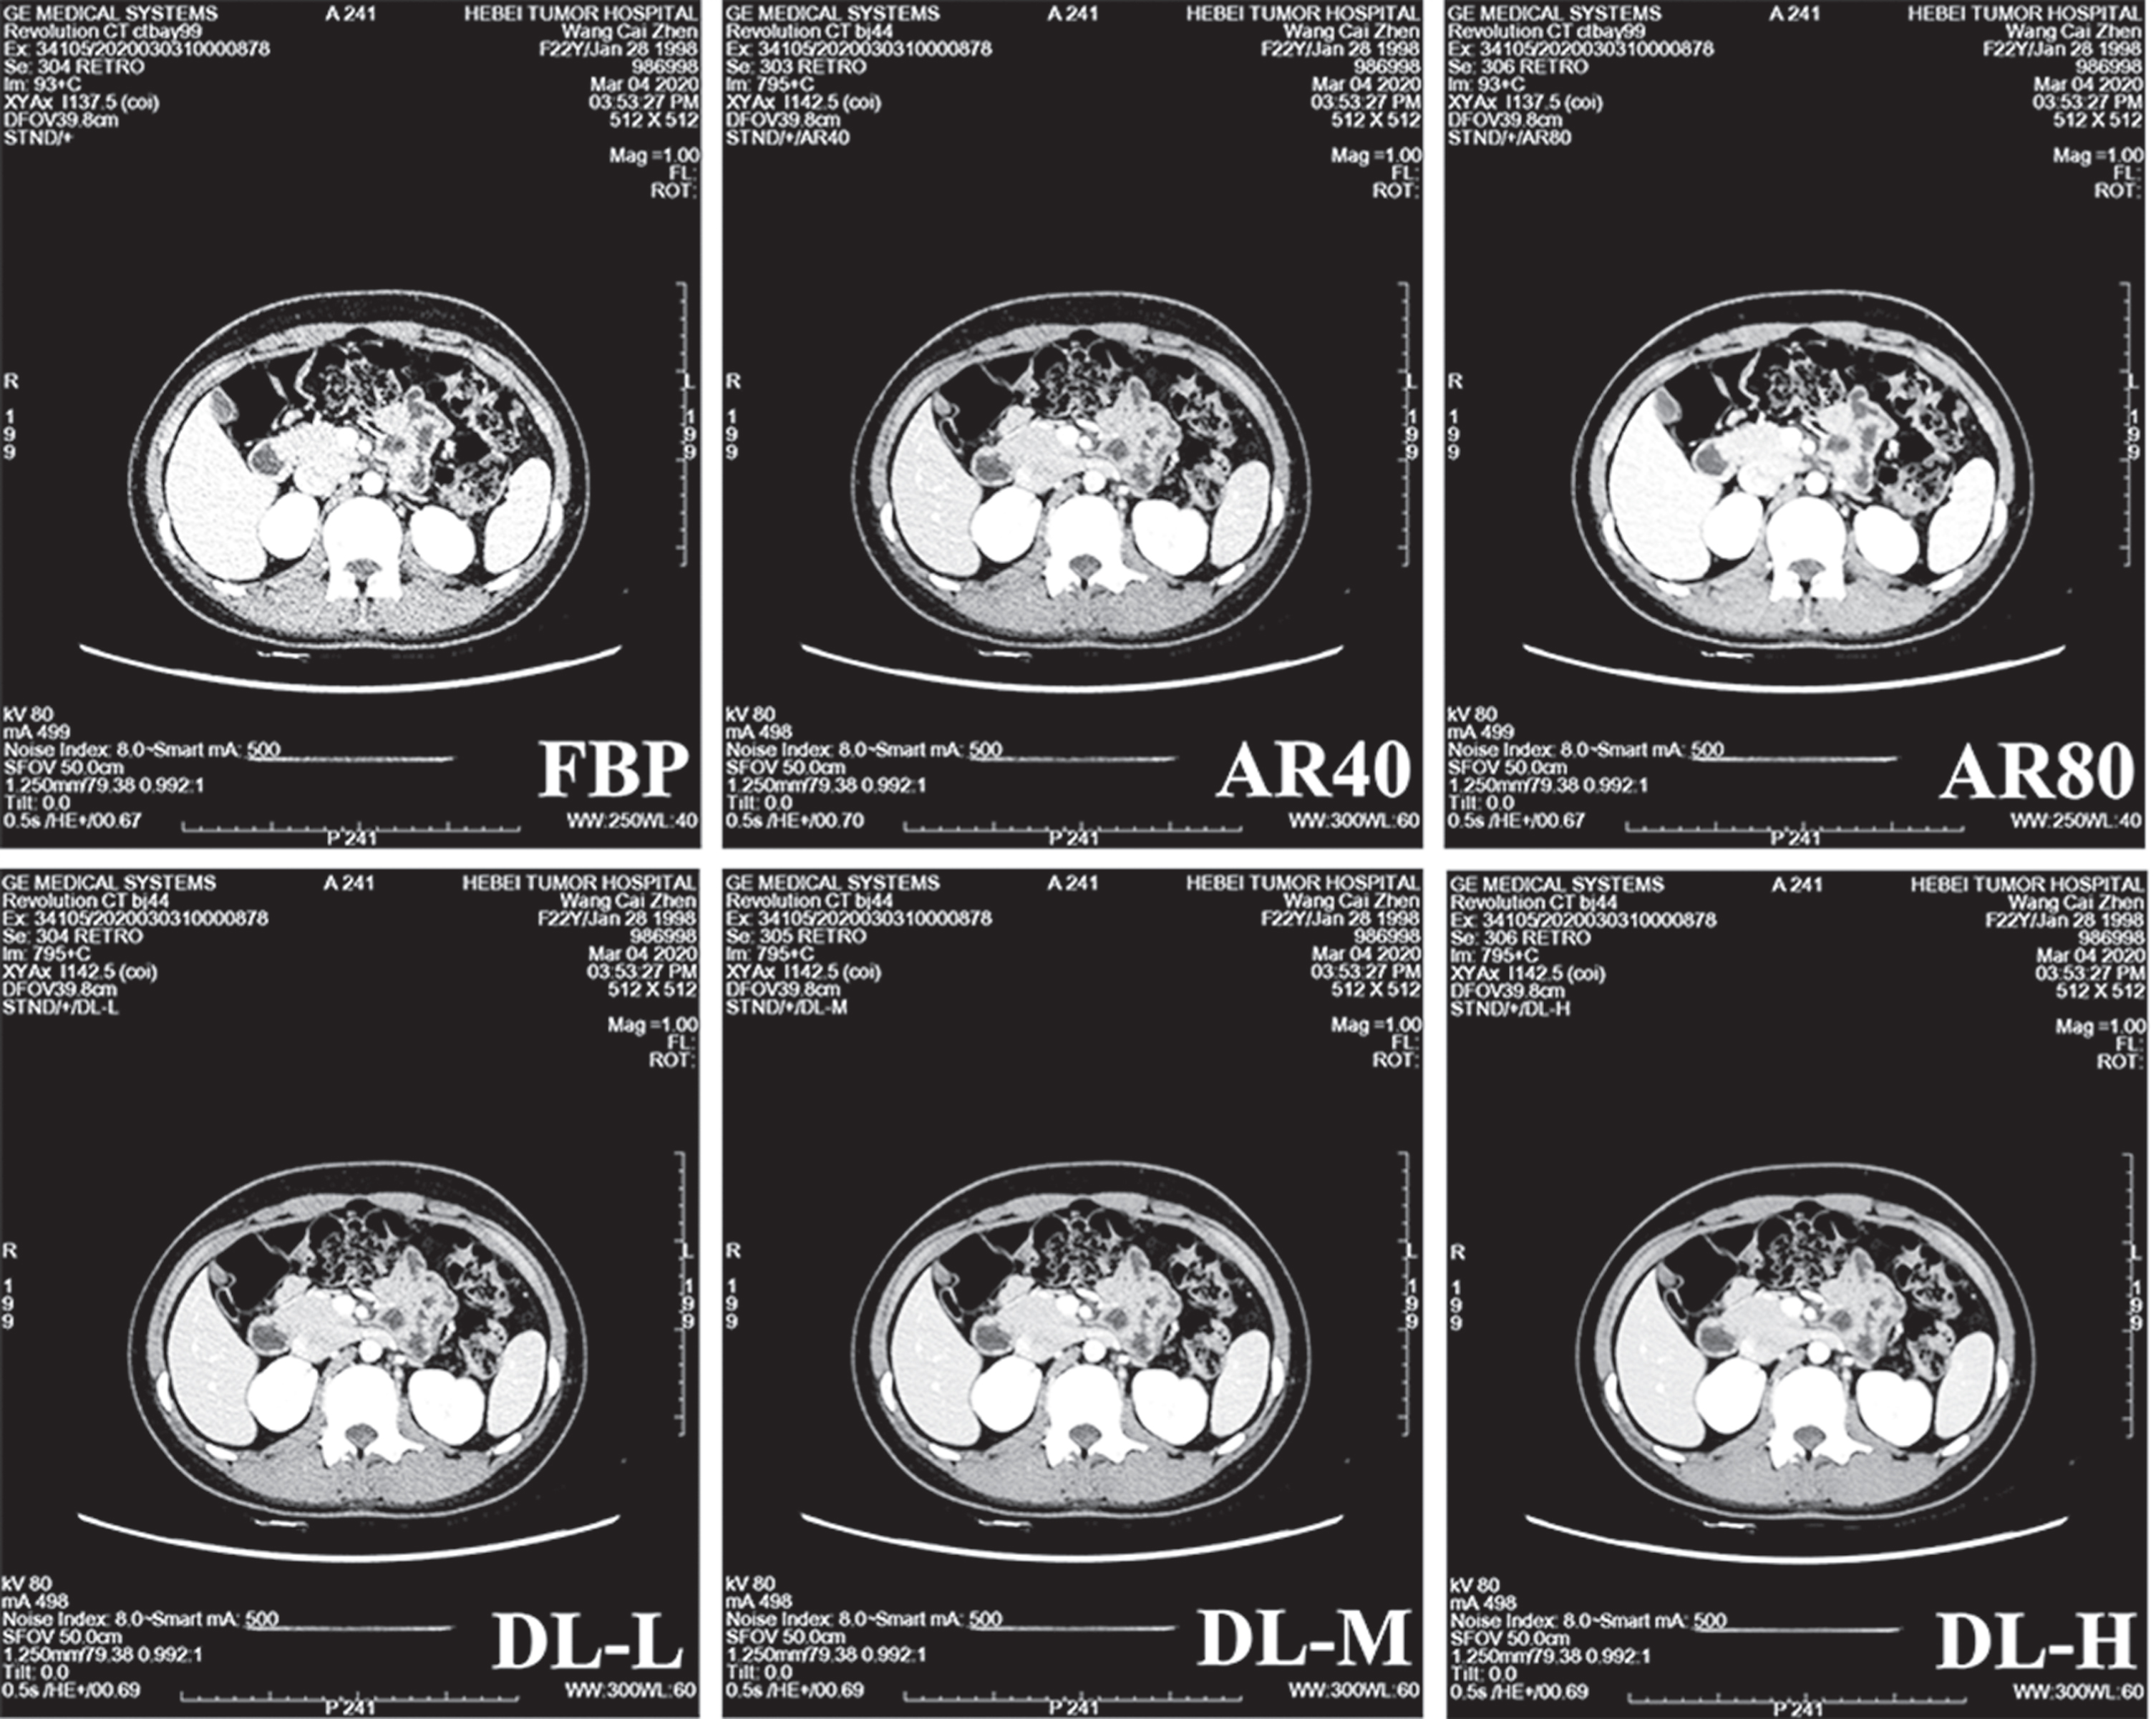
The image in the portal phase in Group A.
The scores of image quality in each group by two physicians
Note: *: DL-H group and (B)A40 group were compared in pairs with the rest of the groups; Δ: Comparison of DL-H group and A40(B) group; **: DL-M, DL-L, ASIR-V40% group and ASIR-V80% group are pair-to-pair comparison; ***: FBP group was compared pairwise with other groups.
Many studies have confirmed that in the enhanced scan sequence of the upper abdomen, the low-kilovolt scan can significantly reduce the scan dosage. In order to avoid the impact of low-dosage scanning on image quality, the present study had made certain restrictions on the patient’s BMI, which was less than 28 kg/m2. The present study compared different reconstruction algorithms, and, therefore, the amount of contrast medium used had not been reduced. Low-dosage scanning causes a significant increase in image noise, which in turn affects the image quality. Therefore, the FBP algorithm had the lowest subjective and objective image quality evaluation among several algorithms.
Various methods for optimizing the CT scan dosage have been widely used in clinical examinations. Among them, the most popular method is the automatic milliammeter technology along with the iterative image reconstruction algorithm [8]. Automatic milliammeter technology improves the image quality by providing a more uniform distribution of the scanning dosage and reducing the artifacts [9]. Compared to the traditional FBP algorithms, iterative reconstruction algorithms can apply lower scan dosages with the same dosage level to reduce the image noise or ensure image quality. Over the past ten years, different manufacturers have invented various iterative reconstruction algorithms for clinical examination [10, 11]. The ASIR-V algorithm used in the present study is one of these algorithms. This algorithm uses a probabilistic statistical algorithm to reconstruct the X-ray photons and the pre-established model after the statistical mixing. The reconstruction process allocates the respective proportions of the FBP algorithm and the iterative reconstruction algorithm as needed to reduce the noise artifacts [12, 13]. In the present study, three different ratios, such as 0% (i.e., FBP algorithm), 40%, and 80%, were selected, respectively. The results also showed that the objective and subjective image quality of the iterative reconstruction algorithm was higher than for those in the FBP group.
The iterative reconstruction algorithms are nonlinear and unstable, resulting in the fact that the image quality is somewhat dependent on the tissue’s contrast and the actual X-ray dosage [14]. The iterative reconstruction algorithm may change the image’s texture characteristics and the size of the inherent noise, resulting in a larger sensory difference compared to the conventional FBP image. Many studies have shown that the iterative reconstruction algorithm images are subjectively evaluated to be too smooth or with wax-like alterations [15–18]. This feature is more pronounced as the proportion of iterative reconstruction increases. Therefore, in the present study, the objective image quality (noise, SNR) was better in the ASIR 80% group, but the subjective image scores were reduced when compared to that in the DLIR-H group. Although the objective image quality of the ASIR 40% group was worse than that in the ASIR 80% group, the subjective image scores were comparable between the two groups.
Theoretically, the FBP algorithm can achieve satisfactory image quality provided that the scan dosage and reconstruction matrix are high enough [19, 20]. This was also validated by the lack of statistical differences in comparing the subjective scores between the DL-H group and B group. Decades of experience with the reconstruction algorithms have been taken into account in the development of DLIR, especially regarding the FBP-based image reconstruction algorithms for optimization. In the present study, the DLIR-H group had the best subjective and objective image quality. This new reconstruction algorithm based on AI research and development has not yet been put into clinical application. The application value needs to be compared with the traditionally applied FBP algorithm and the IR algorithm. It was found in the present study that the subjective and objective image quality of the DLIR-M group and DLIR-L group was similar to that in the iterative reconstruction group, indicating that the application needs further research to determine the specific dosage range.
There are also some limitations to the present study. First, the CT scanner and reconstruction algorithm adopted in the present study were developed by one company only, and whether the DLIR algorithm is applicable to other devices needs further verification. Second, the low-dosage intensified scan images of the upper abdomen were selected for analysis and comparison, and the applicability of the DLIR algorithm to other scan sites and scan conditions requires further research. Last, the study used a small sample size, and the subjects selected for the present study all had a BMI of less than 28. Subsequent studies need to increase the sample size and investigate whether the DLIR algorithm has advantages over the FBP algorithm and the IR algorithm for patients with higher BMI. In summary, comparing with the FBP and IR algorithms, the combination of low-kilovolt enhanced scanning of the upper abdomen using DLIR algorithm achieves a more satisfactory image quality and has an ideal clinical application prospect in the future.
Footnotes
Acknowledgments
We are particularly grateful to all the people who have given us help on our article.
Competing interests
All authors declare that they have no competing interests.
Funding
None.