
Abstract
BACKGROUND:
Previous studies have shown that using some post-processing methods, such as nonlinear-blending and linear blending techniques, has potential to improve dual-energy computed (DECT) image quality.
OBJECTIVE:
To improve DECT image quality of hepatic portal venography (CTPV) using a new non-linear blending method with computer-determined parameters, and to compare the results to additional linear and non-linear blending techniques.
METHODS:
DECT images of 60 patients who were clinically diagnosed with liver cirrhosis were selected and studied. Dual-energy scanning (80 kVp and Sn140 kVp) of CTPV was utilized in the portal venous phase through a dual-source CT scanner. For image processing, four protocols were utilized including linear blending with a weighing factor of 0.3 (protocol A) and 1.0 (protocol B), non-linear blending with fixed blending width of 200 HU and set blending center of 150HU (protocol C), and computer-based blending (protocol D). Several image quality indicators, including signal-to-noise ratio (SNR), contrast-to-noise ratio (CNR) and contrast of hepatic portal vein and hepatic parenchyma, were evaluated using the paired-sample t-test. A 5-grade scale scoring system was also utilized for subjective analysis.
RESULTS:
SNR of protocols A-D were 9.1±2.1, 12.1±3.0, 11.6±2.8 and 14.4±3.2, respectively. CNR of protocols A-D were 4.6±1.3, 8.0±2.3, 7.0±2.0 and 9.8±2.4, respectively. The contrast of protocols A-D were 37.7±11.6, 91.9±21.0, 66.2±19.0 and 107.7±21.3, respectively. The differences between protocol D and other three protocols were significant (P < 0.01). In subjective evaluation, the modes of protocols A, B, C, and D were rated poor, good, generally acceptable, and excellent, respectively.
CONCLUSION:
The non-linear blending technique of protocol D with computer-determined blending parameters can help improve imaging quality of CTPV and contribute to a diagnosis of liver disease.
Keywords
Introduction
Rupture of oesophageal varices, caused by hepatic cirrhosis portal hypertension, and resultant hemorrhage is the most dangerous complication associated with intravenous hypertension [1]. According to the 2010 American society of liver diseases guidelines [1] and 2015 British cirrhosis varicose vein bleeding prevention guidelines [2], transjugular intrahepatic portosystemic shunt (TIPS) is useful for the treatment of recurrent variceal bleeding. It is particularly important to study the collaterals of portal hypertension due to cirrhosis before TIPS.
The clinical use of dual-energy computed tomography (DECT) to improve CT imaging quality of the target blood vessel has also become widely used in the research field [3]. Dual-source DECT uses two X-ray tubes of 80 kVp and Sn140 kVp (Sn refers to use of a tin filter to filter X-rays below 80 kVp), respectively, to scan objects and generates two different types of X-ray attenuation properties, simultaneously [4, 5]. As it offers abundant and vital information on diseases, dual-source DECT is widely used in clinical research [6–8]. One of the uses of dual-source DECT is to obtain one image by blending an 80 kVp image and a Sn140 kVp image with linear blending (LB) or non-linear blending (NLB). The images taken using different X-ray voltages have different characteristics. The 80 kVp image has a high contrast-to-noise ratio (CNR), but low signal-to-noise ratio (SNR). In contrast, the Sn140 kVp image has a low CNR, but high SNR [9].
Additional post-processing, such as nonlinear-blending and linear blending techniques, can help improve quality of the image [10–12]. For linear blending, the CT value of all pixels of low- and high- kV images are blended at the same fusion ratio. The blending ratio can be altered, but 30% of 80 kVp blended with 70% of Sn140 kVp images is the standard algorithm, which has been confirmed to be equivalent to the conventional single-energy 120 kV image [13–18]. Non-linear blending uses different rates of blending for different pixels in order to blend two single-energy images, according to the CT values of the pixels in low-kVp image [12, 19–22]. The blending center (c) and blending width (w) resolve the shape of the blending curve, which help determine the blending proportion of every pixel in the 80 kVp and Sn140 kVp images. In order to magnify the contrast between tissues and contrast agent, pixels of low CT values use a high proportion of high-kVp (Sn140 kVp) image for blending, while pixels of high CT values use a high percentage of low-kVp (80 kVp) image. In comparison to linear blending methods, use of non-blending with the curve calculated by fixed blending parameters has a distinctive benefit in increasing image SNR and heightening subjective conspicuity [11, 24].
Numerous studies have been performed using nonlinear fusion technology [6, 25]; however, the blending parameters given are still within range value. Few in depth studies have evaluated nonlinear blending methods due to complexity of blending parameters. Blending center and width have a significant effect on quality of blended images. In order to attain a more effective fusion method for imaging hepatic portal veins, we set out to assess image quality utilizing linear and non-linear blending. We also compared imaging quality between fixed and computed blending parameters in non-linear blending.
Methods and materials
Patients
The DECT images of 60 patients with oesophageal varices, caused by cirrhosis and portal hypertension diagnosed via ultrasound, were analyzed in this retrospective study. The patients had to meet the following inclusion criteria, including (1) no diagnosis of liver cancer, liver cysts, hepatic hemangioma and no embolus in the portal vein system confirmed by ultrasound; (2) no iodine allergy; and (3) estimated glomerular filtration rate (eGFR) is in the range of 80–100 ml/min. Patients that met the criteria were diagnosed by radiologists with over five years of experience.
Among the 60 patients included in this study, 42 were men (age range 28 to 84 years; BMI, 14∼29 kg/m2) and 18 were women (age range 41 to 74 years; BMI, 18∼28 kg/m2). All patients had 1-to-22 years of liver cirrhosis. Furthermore, there were 32 cases of viral hepatitis related cirrhosis, 10 cases of pure alcoholic cirrhosis, 11 cases of viral hepatitis complicated with alcoholic cirrhosis, and seven cases of additional types of cirrhosis in this study. There were 32 cases of grade A, 21 of grade B, and 5 of grade C cirrhosis, as per the Child-Turcotte-Pugh (CTP) score [26]. There were 22 cases of ascites due to cirrhosis, and 43 cases of hematemesis and/or hematochezia due to treatment of oesophageal varices.
CT scanning parameters
All CT examinations were conducted using dual-source dual-energy CT scanner (SOMATOM Flash, Siemens Healthcare, Forchheim, Germany). Patients were in a supine position, feet first, and arms raised. The scanning range started from 2cm above the diaphragm to the lower edge of the liver or spleen. The mode of automatically adjusted current was utilized during scanning (Care Dose 4D, Siemens), which enables to automatically control the output of tube current according to the body type, anatomical location and incident angle. The scanning of the portal venous phase was conducted using the dual-source DECT (TubeA: Sn140 kVp/178 mAs; TubeB: 80 kVp/461 mAs) with a collimation of 32×0.6 mm, SAFIRE = 3, a rotation time of 0.5 seconds, and a pitch of 0.6. Iohexol (350 mg/mL) was injected at a rate of 2.8–3 mL/s into the right forearm vein using an injector (LF OptiVantageTMDH, Siemens). The infusion was calculated using a formula of 1.2 mL/kg of body weight. The region of interest (ROI) was set at the abdominal aorta, 2 cm above the diaphragm, in order to avoid wall calcification of blood vessels. The arterial phase was triggered automatically (at 100 HU), the portal venous phase was triggered 30 s later and then the equilibrium phase 150 s later.
Image blending methods
Overall, 60 cases of portal vein phase images were processed using four protocols, each with a different blending method (protocols A-D). Protocols A and B utilized linear blending, through which each pair of pixel values at the same position in high-kVp and low-kVp images were blended proportionally, with a blending ratio of M. In protocol A, M = 0.3, which means that 30% of pixel values of the 80 kVp image were blended with 70% of pixel values of the Sn140 kVp image, which is equivalent to a 120 kVp single energy image. In protocol B, the M = 1.0, which is equal to an 80 kVp single energy image. Dual-energy images in protocols C and D were blended with non-linear methods, which uses different blending rates for different pixels in order to blend two single-energy images as per the CT values of the pixels of the low-kVp image. The blending ratios of the pixels within the low-kVp image can be obtained using the curve shown in Fig. 1. The shape of the curve was determined using two blending parameters: blending width (w) and blending center (c). In protocol C, the values of w and c were the default fixed values of Siemens system (w = 200HU, c = 150HU). On the other hand, in protocol D, the values (c and w) were computed blending parameters using the following equations:
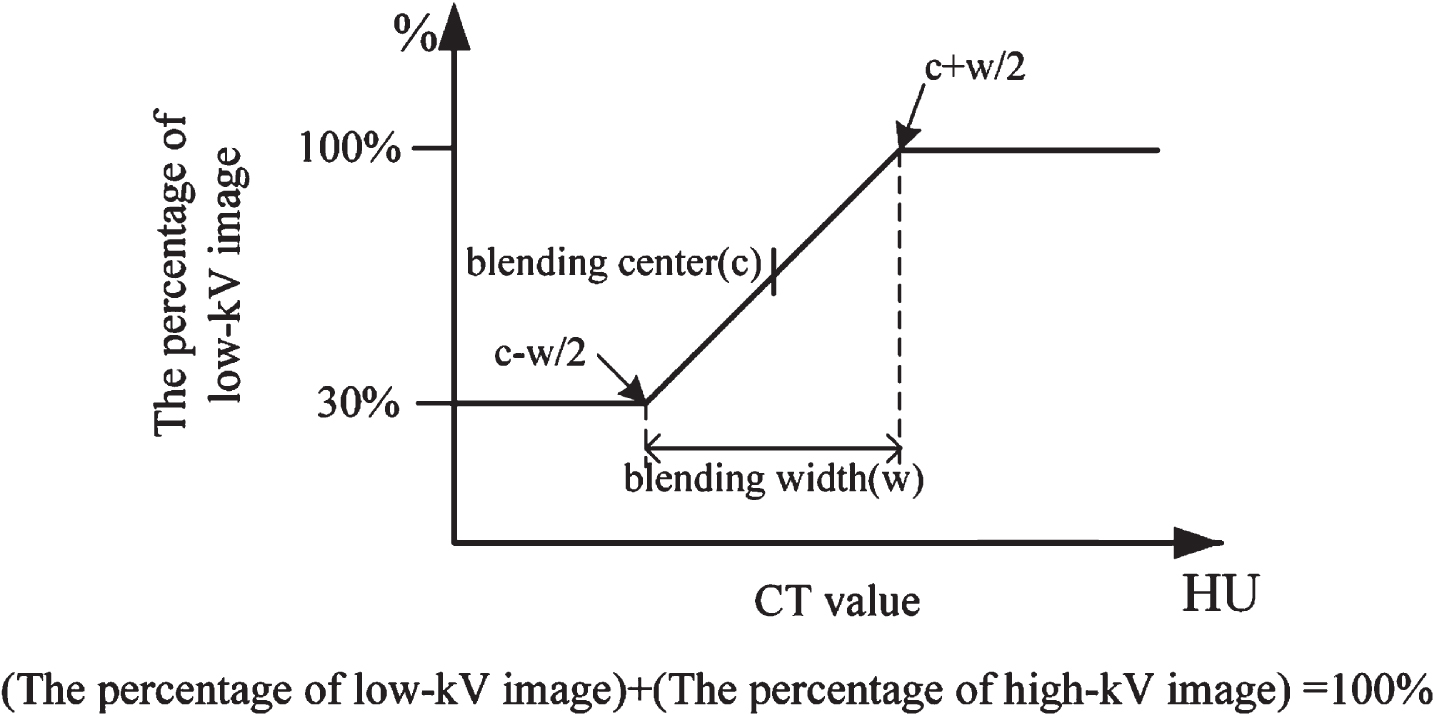
Schematic diagram of a non-linear blending proportion curve.
Objective evaluation
The transverse planes that contain the bifurcation of the hepatic portal vein at the right end of the porta hepatis were chosen for blending study. The CT values and standard deviation (SD) of the hepatic portal vein, dorsal spinal muscle, abdominal anterior wall fat, and hepatic parenchyma were also quantified. The SD value of the abdominal anterior wall was utilized as the image noise [27]. In order to ensure the consistency of measurement, the measurements must meet the following requirements. First, the CT value of the portal vein must be the average of the three consecutive layers where the left and right hepatic portal veins converge. Second, the CT value of the spinal muscle must avoid the fat layer. Third, the hepatic parenchyma in the ROI set at 1 cm2 for the left lobe, right anterior lobe, and right posterior lobe of the liver and avoids large vessels. The average value of the ROIs is defined as the CT value of the hepatic parenchyma. All above ROI selection and value measurements are performed by radiologists who have more than five years of experience utilizing Siemens workstation (multimodality workplace, MMWP). SNR, CNR, and the contrast of hepatic portal vein and hepatic parenchyma are indicators that allow measurement of image quality within this article. The SNR and CNR were calculated as per the following formula, respectively.
Volume rendering technique (VRT) is a three-dimensional reconstruction visualization technology, which can generate images based on all volume data, and convert radiological property such as CT value into optical properties such as color and opacity. VRT has been proven to improve the accuracy of diagnosis by improving visualization and display of surface and internal details anatomy [28–30]. Therefore, all blended images of the four protocols were processed through VRT in order to generate blended images for subjective evaluation [31, 32]. We used a five-grade scale scoring system [33]. Grade 5 (excellent) refers to sharp portal vein anatomy and satisfactory details, with no significant image noise, no interference from surrounding tissues, and four visible levels of intrahepatic branches. Grade 4 (good) refers to relatively clear anatomy of the portal vein system and details, with no significant image noise, some interference from surrounding tissues, and three visible levels of intrahepatic branches. Grade 3 (generally acceptable) refers to visible portal vein trunk and branches, significant image noise, with some interference from surrounding tissues, and two visible levels of intrahepatic branches. Grade 2 (relatively poor), refers to visible portal vein trunk, with only one visible level of intrahepatic branches and significant image noise. Grade 1 (poor) refers to fuzzy portal vein trunk, and serious image noise. Images with scores lower than or equal to two were unfit for subsequent diagnosis. Two radiologists with more than five-year diagnostic experience performed subjective evaluation of these images, independently as well as in consensus. If the score was disputed, then it was resolved by another radiologist with at least five years of experience.
Statistical analysis
We utilized the IBM SPSS statistics software (SPSS, Inc., Chicago, USA) 19.0 software in order to analyze objective data. The objective data fit normal distribution, and therefore, the paired-sample t-test was utilized to compare protocol D with the additional three protocols. P < 0.05 was set as statistically significant and P < 0.01 was highly statistically significant. As for subjective data, the mode was utilized to compare subjective results across the four protocols [34].
Results
Objective evaluation
Representative CT images of blended images using each of the four protocols and measurements are shown in Fig. 2. Results from the four protocols, which include CT values of the hepatic portal vein (HPV), spinal muscle and hepatic parenchyma (HP), SD values of the anterior abdominal wall fat, SNR and CNR of the HPV, and contrast of the HPV and the HP, are listed in Table 1. The differences of image quality across the four protocols are shown in Fig. 3.
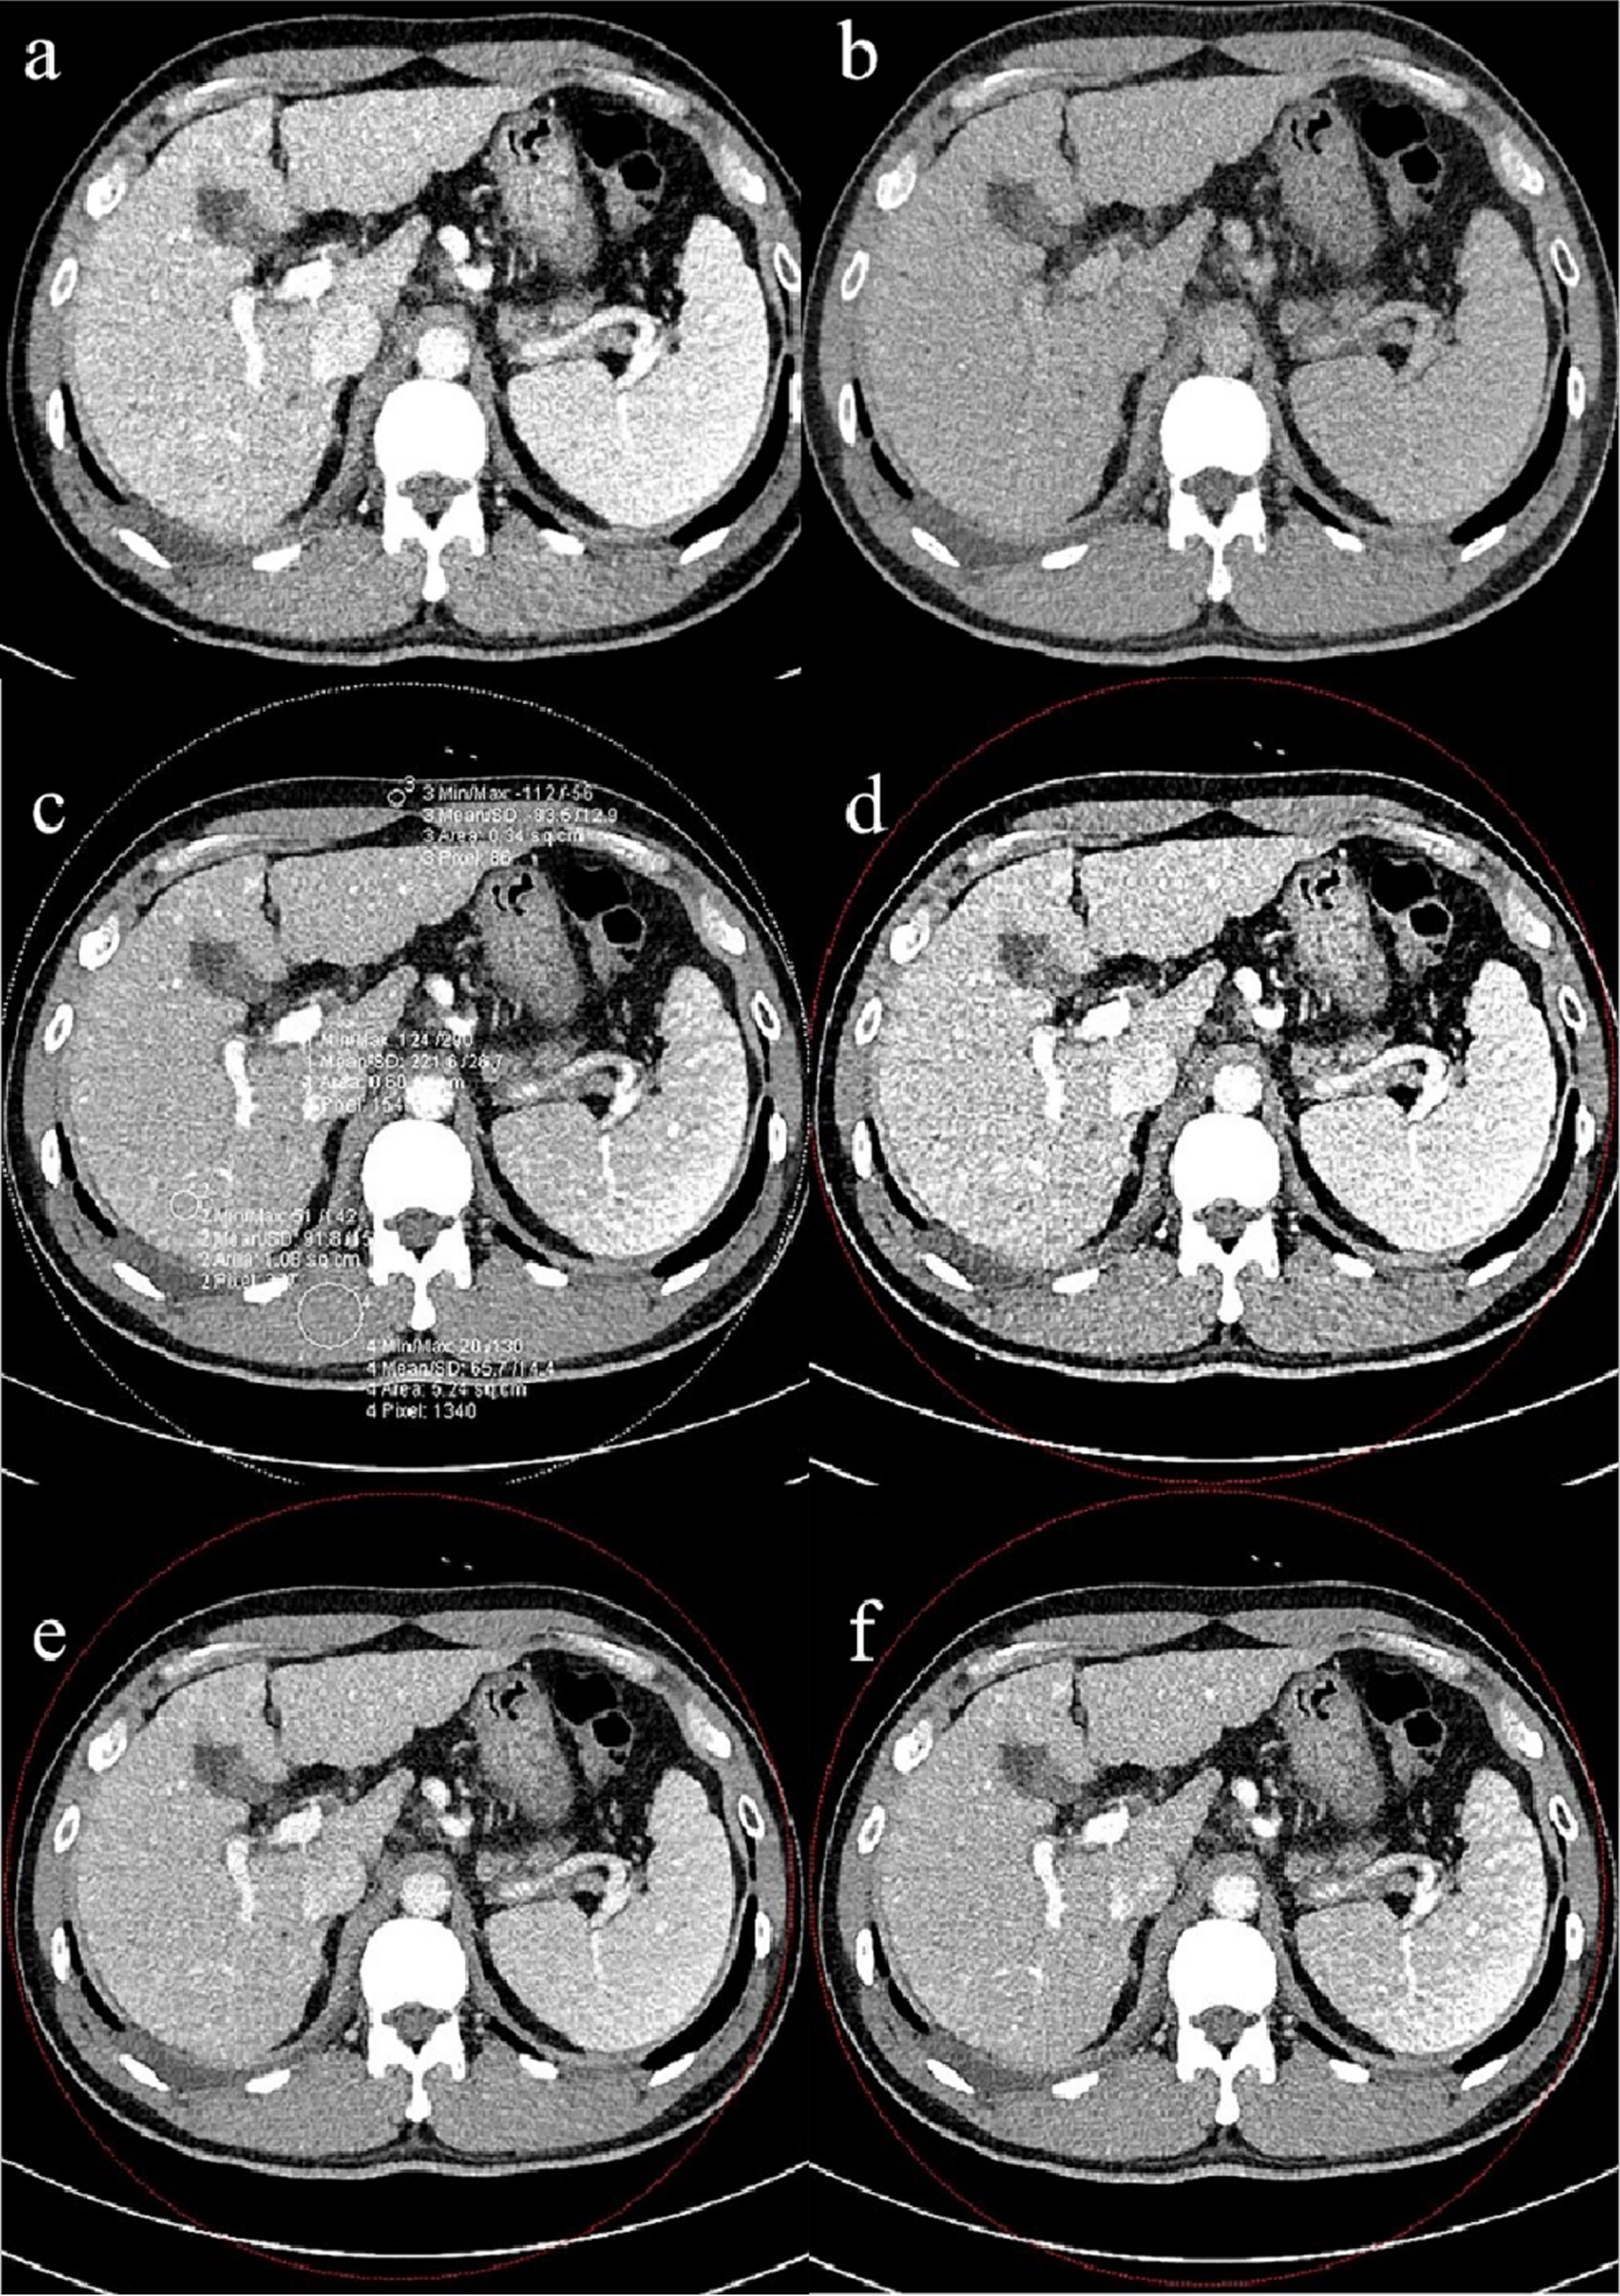
Representative CT images of blended images across the four protocols and measurements. (a) The measurements of four protocols and example image of protocol A. (b) Representative image of protocol B. (c) Representative image of protocol C. (d) Representative image of protocol D.
Objective evaluations for blending of four protocols (x±SD)
HPV, hepatic portal vein. SD, standard deviation. SNR, signal-to-noise ratio. CNR, contrast-to-noise ratio. HP, hepatic parenchyma.
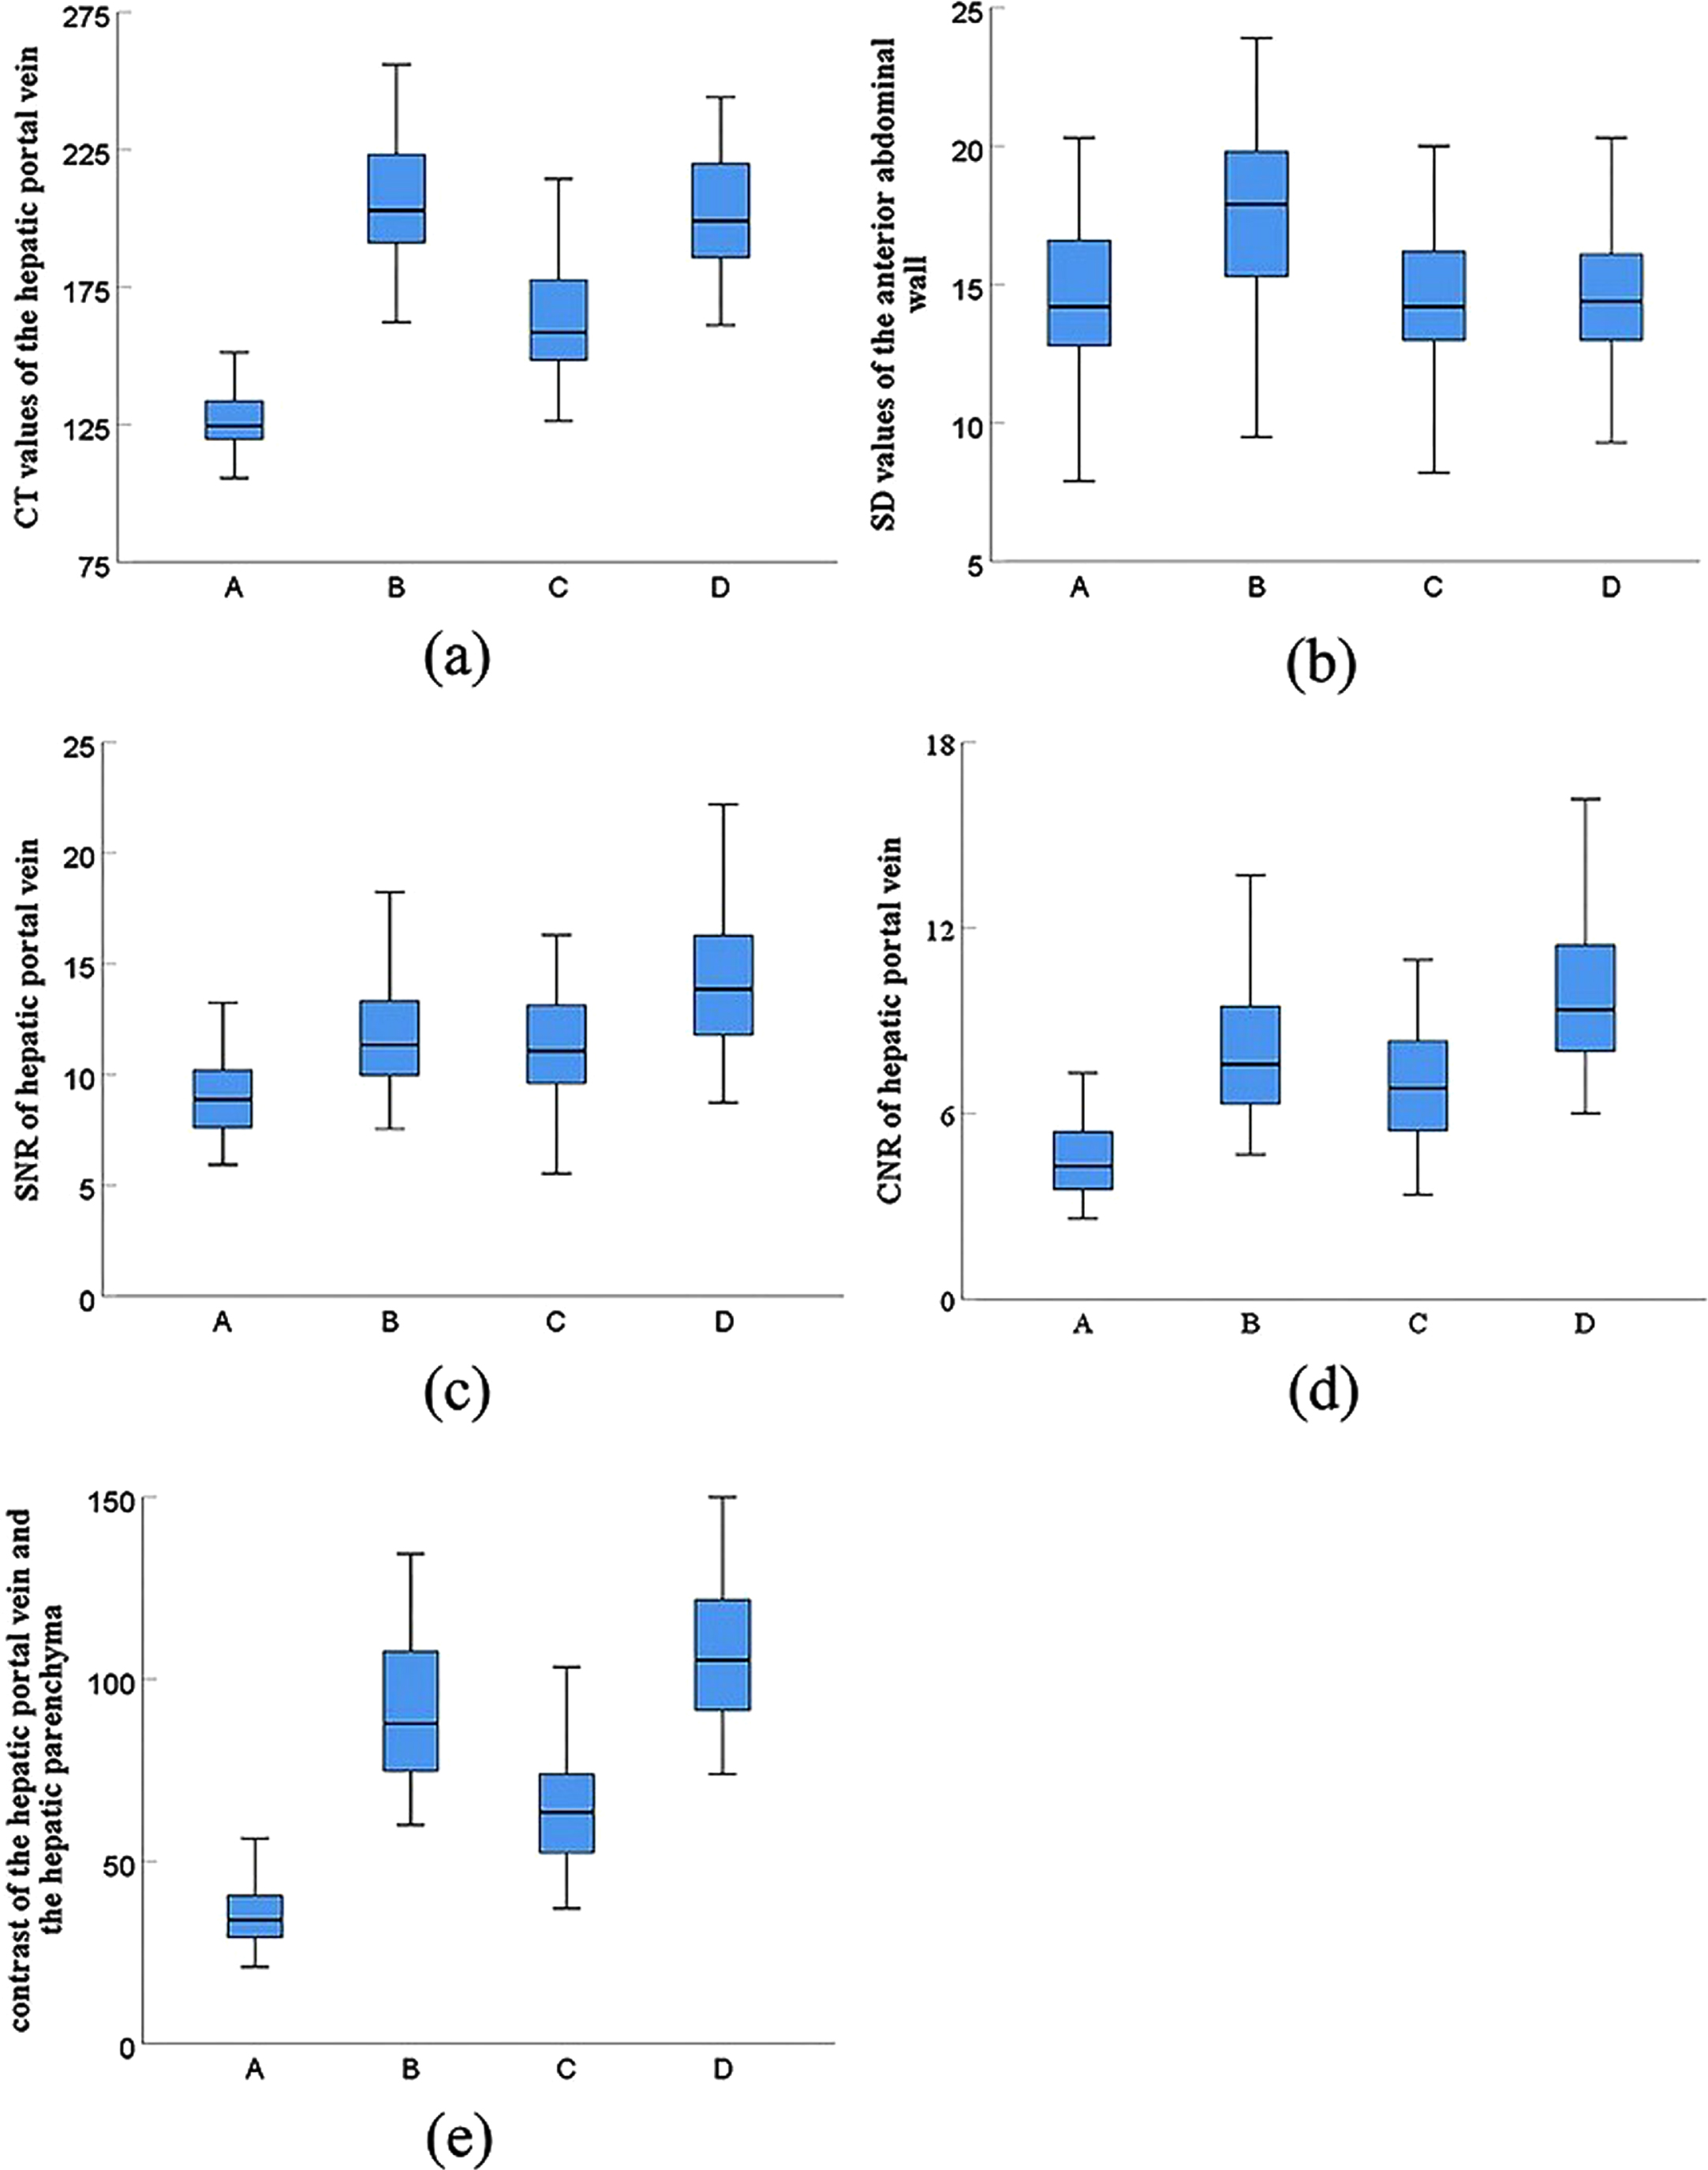
The differences in image quality across the four protocols (including extreme value, median and quartile). (a) CT values of HPV. (b) SD values of anterior abdominal wall fat. (c) SNR of HPV. (d) CNR of HPV. (e) Contrast of HPV and HP.
Result of objective evaluation show that protocols B (206.5±21.5HU) and D (201.6±21.0HU) have similar portal CT values of HPV, which are higher than those of protocols A (127.4±11.7HU) and C (163.4±20.1HU). However, protocol B (17.9±3.8) had the highest SD values, while protocol D had the highest SNR (14.4±3.2), CNR (9.8±2.4) and contrast (107.7±21.3). The differences between protocol D and other three protocols in SNR and CNR of HPV and the contrast of HPV and HP were found to be significant (P < 0.001).
VRT images of protocols A, B, C, and D are shown in Fig. 4. The subjective data from the four protocols is listed in Table 2. The modes of protocols A, B, C, and D are poor, good, generally acceptable, and excellent, respectively. Figure 4 VRT images of protocols A, B, C, and D.
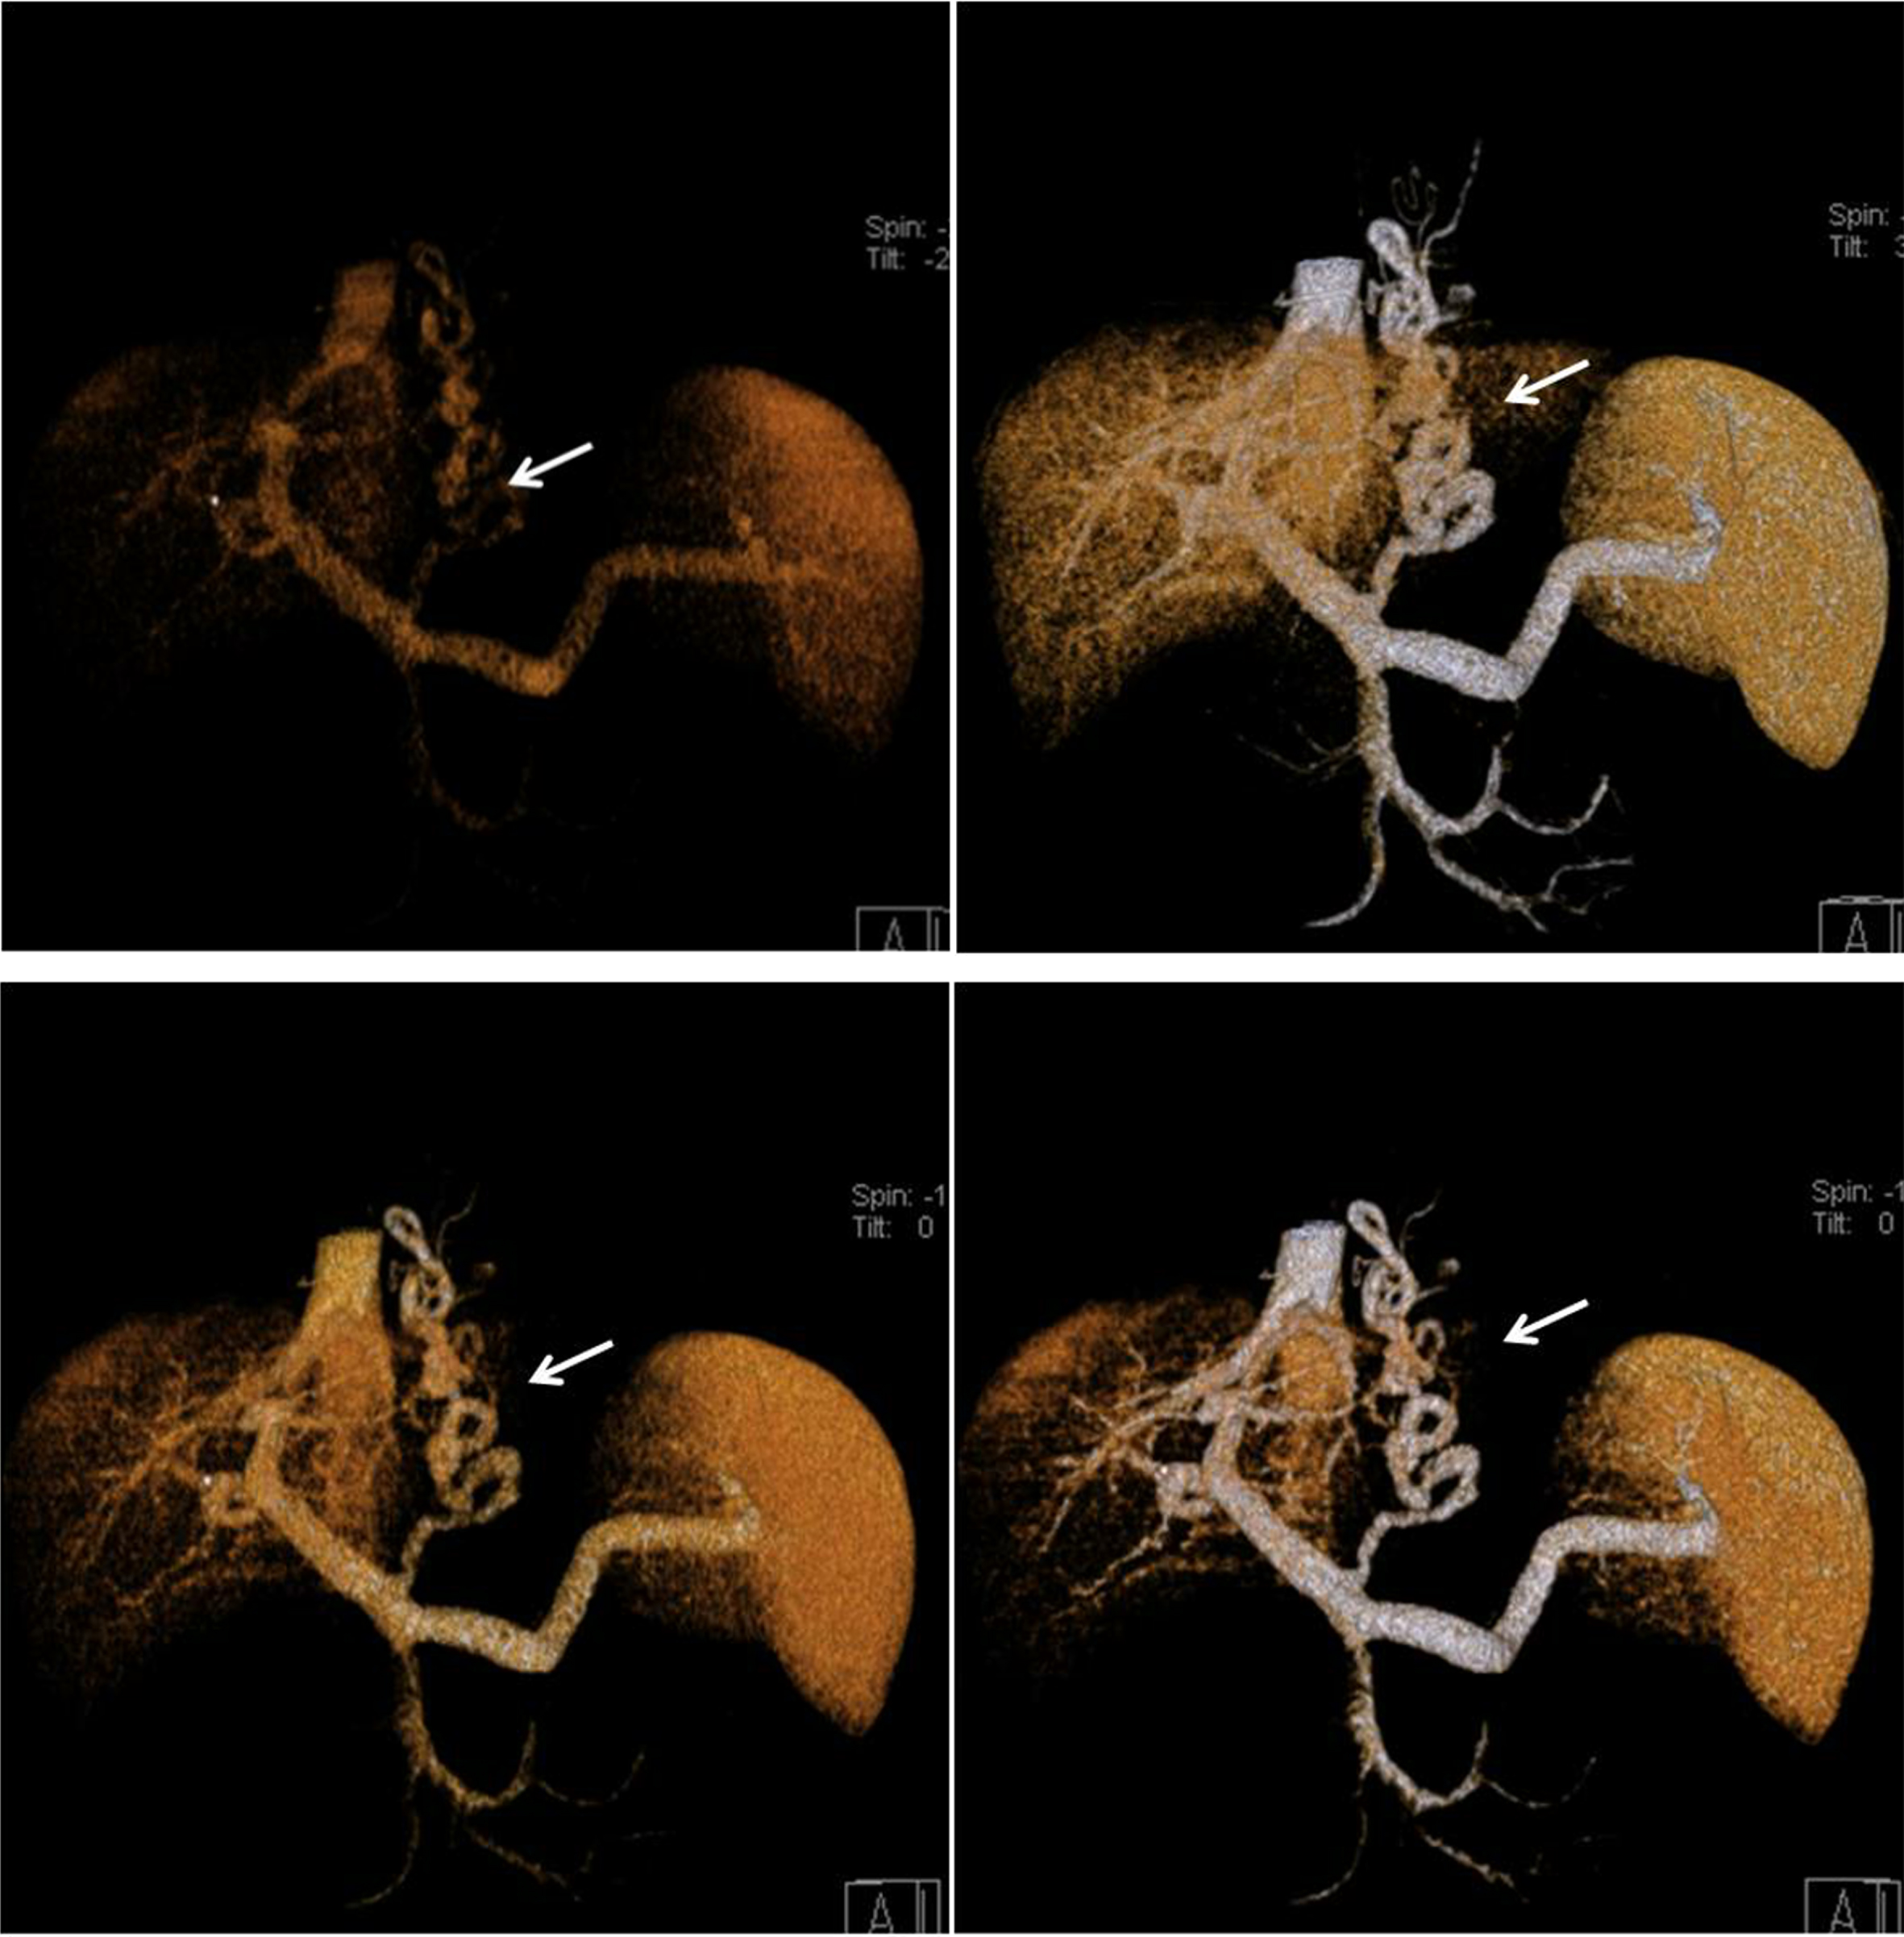
VRT images of protocols A, B, C, and D.
Subjective evaluation for VRT images of 4 protocols
Note: Data represent frequencies; data in parentheses are percentages.
Prior work has documented the practicality of dual energy CT imaging in clinical fields, ranging from anatomical imaging to functional imaging [35]. How to determine blending parameters in order to obtain option blending images is still worthy of further research. The images that were generated from Sn140 kVp and 80 kVp have different characteristics. When pre-processing is the same, the Sn140 kVp image has a reduced image contrast and density resolution, though the value of its noise is low. On the other hand, while 80 kVp image has a good imaging contrast and density resolution, the noise is high [23, 24]. Therefore, the expected blended image is that its contrast is close to a low-energy image. However, its noise is near to a high-energy image.
In order to improve the image quality of the DECT hepatic portal venography, we have presented a new technique that blends a pair of dual-energy images by non-linear blending using computed blending parameters (i.e. blending width and blending center) and compared the image qualities with the additional three blending methods. In this study, the best period of portal vein enhancement was chosen for whole liver scan, and a three-dimensional image was reconstructed using the image post-processing technology VRT to visually display the portal vein and branches of the liver.
With regards to linear blending, the portal vein blended images of protocol A had the lowest evaluation scores in comparison to the other three protocols and did not meet requirements of angiography for diagnosis. For protocol B, both the density resolution and noise of blended images were increased, which was a disadvantage of that protocol, as identified in previous studies [36].
In our study, protocols C and D utilized different strategies of generating a blending curve to blend the images. In protocol C, the blending width and center were fixed (w = 200HU and c = 150HU) according to recommended parameters of the Siemens system. Thus, only one blending curve was utilized for all blending cases. However, both the objective and subjective scores of protocol C were lower compared to protocol D and even protocol B. For example, protocol C could not make the target vessel prominent in some cases.
Our present method is protocol D, in which blending center and blending width were calculated using the formulas 1 and 2, respectively. Therefore, a specific blending curve was generated for one blending case. Next, different circumstances with different image properties of the low-kVp images have different blending curves. With regards to the curve in Fig. 1, all CT values of the target portal vein with contrast agent in 80 kVp images were higher than (c + w)/2. Hence, 100% value of all pixels of the portal vein in the blended image was contributed from the 80 kVp image. All CT values of the anterior abdominal wall fat in an 80 kVp image were lower than (c - w)/2. Hence, the CT values of the fat in the blended image comprised of 70% from a Sn140 kVp image and 30% from an 80 kVp image. Moreover, CT values of the hepatic parenchyma fell in between those of the portal vein and the anterior abdominal wall fat. Hence, the blending ratio was acquired from the oblique line in middle part of the blending curve, calculated by the computed blending parameters. Compared to the other three protocols, the contrast in protocol D was the highest due to avoiding using fixed blending parameters. In blended VRT images, the images of hepatic portal veins were distinct and rarely blurred by surrounding tissues.
In protocol D, the values of the blending width and blending center to form blending curve were established on a case-by-case calculation. In our study, 63% of cases used 20HU as blending width, 35% cases used 100HU as blending center, and 38.3% cases used 110HU as blending center. Compared to the suggested default blending parameters of Siemens system, both blending center and blending width were lower in protocol D.
The non-linear blending parameters should be personalized. That is, the parameter values should be altered with the target and surrounding tissues. When using equations (1) and (2) to compute blending width (w) and blending center (c), the contrast and saliency of the target tissue can be improved, and noise of surrounding tissues can be reduced.
During dual-energy hepatic portal venography, the imaging quality mainly depends on concentration of the contrast agent in collateral flows. In this study, the new non-linear blending with computed blending parameters (i.e. blending center and blending width), can improve imaging quality, especially SNR and CNR, of hepatic portal venography using dual-energy CT. Therefore, the nonlinear fusion parameters that are proposed in this paper may provide a possibility for CT-enhanced scanning in order to reduce the amount of contrast agent or use of low concentration contrast agent, which needs to be further researched.
Our study has a few limitations. Firstly, patients with different BMI ranges and multiple dual-energy voltage combinations (80 kV/140 kV, 100 kV/Sn140 kV, etc.) should be considered. This study only evaluated the hepatic portal vein, and the best blending parameters for other tissues or lesions can be studied in the future.
Conclusion
Among the four protocols, non-linear blending with computed blending parameters calculated by the relationship between CT value of the target vessel and surrounding tissue can improve the imaging quality of CTPV and contribute to diagnosis of the disease.
Footnotes
Acknowledgments
This study was funded by Tianjin Natural Science Foundation (17JCZDJC32500).