
Abstract
BACKGROUND:
Volumetric lung tumor segmentation is difficult due to the diversity of the sizes, locations and shapes of lung tumors, as well as the similarity in the intensity with surrounding tissue structures.
OBJECTIVE:
We propose a dual-coupling net for accurate lung tumor segmentation in chest CT images regardless of sizes, locations and shapes of lung tumors.
METHODS
To extract shape information from lung tumors and use it as shape prior, three-planar images including axial, coronal, and sagittal planes are trained on 2D-Nets. Two types of window images, lung and mediastinal window images, are trained on 2D-Nets to distinguish lung tumors from the thoracic region and to better separate the boundaries of lung tumors from adjacent tissue structures. To prevent false-positive outliers to adjacent structures and to consider the spatial information of lung tumors, pairs of tumor volume-of-interest (VOI) and tumor shape prior are trained on 3D-Net.
RESULTS
In the first experiment, the dual-coupling net had the highest Dice Similarity Coefficient (DSC) of 75.7%, considering the shape prior as well as mediastinal window images to prevent the leakage of adjacent structures while maintaining the shape of the lung tumor, with 18.23% p, 3.7% p, 1.1% p, and 1.77% p higher DSCs than in the 2D-Net, 2.5D-Net, 3D-Net, and single-coupling net results, respectively. In the second experiment with annotations for two clinicians, the dual-coupling net showed outcomes of 67.73% and 65.07% regarding the DSC for each annotation. In the third experiment, the dual-coupling net showed 70.97% for the DSC.
CONCLUSIONS
The dual-coupling net enables accurate segmentation by distinguishing lung tumors from surrounding tissue structures and thus yields the highest DSC value.
Keywords
Introduction
Lung cancer is the most common type of cancer and is the leading cause of cancer death worldwide [1]. To establish a treatment regimen with accurate staging, to evaluate treatment responses, and to predict prognoses, it is essential to measure the tumor size in chest CT images. Tumor sizes for response evaluations are traditionally assessed according to World Health Organization (WHO) criteria, which involve bi-dimensional measurements defined as the product of the longest diameter and the longest perpendicular diameter for each tumor [2]. The current standard method for evaluating the treatment response follows the RECIST (Response Evaluation Criteria in Solid Tumors) criteria, which involve uni-dimensional measurements of tumors defined as the longest diameter on a cross-sectional image [3]. However, these line measurement methods are limited in that the measurement of the longest diameter of a tumor with an irregular shape can be subjective depending on the observer and does not reflect the shape of the tumor [4]. Therefore, volumetric lung tumor segmentation of chest CT images is necessary for lung cancer patients to monitor tumor responses to treatments by tracking lung tumor volume changes after radiotherapy and to make prognostic predictions using the internal information of the lung tumors before surgery [5, 6].
As shown in Fig. 1, it is difficult to segment lung tumors in CT images due to the diversity of the sizes, locations, shapes, as well as types of tumors. Examples of such factors can be solid and sub-solid areas as well as necrosis of lung tumors. Moreover, it is difficult to distinguish lung tumors from surrounding structures due to the low contrast when lung tumors are attached to the chest well, mediastinum, or pulmonary vessels.
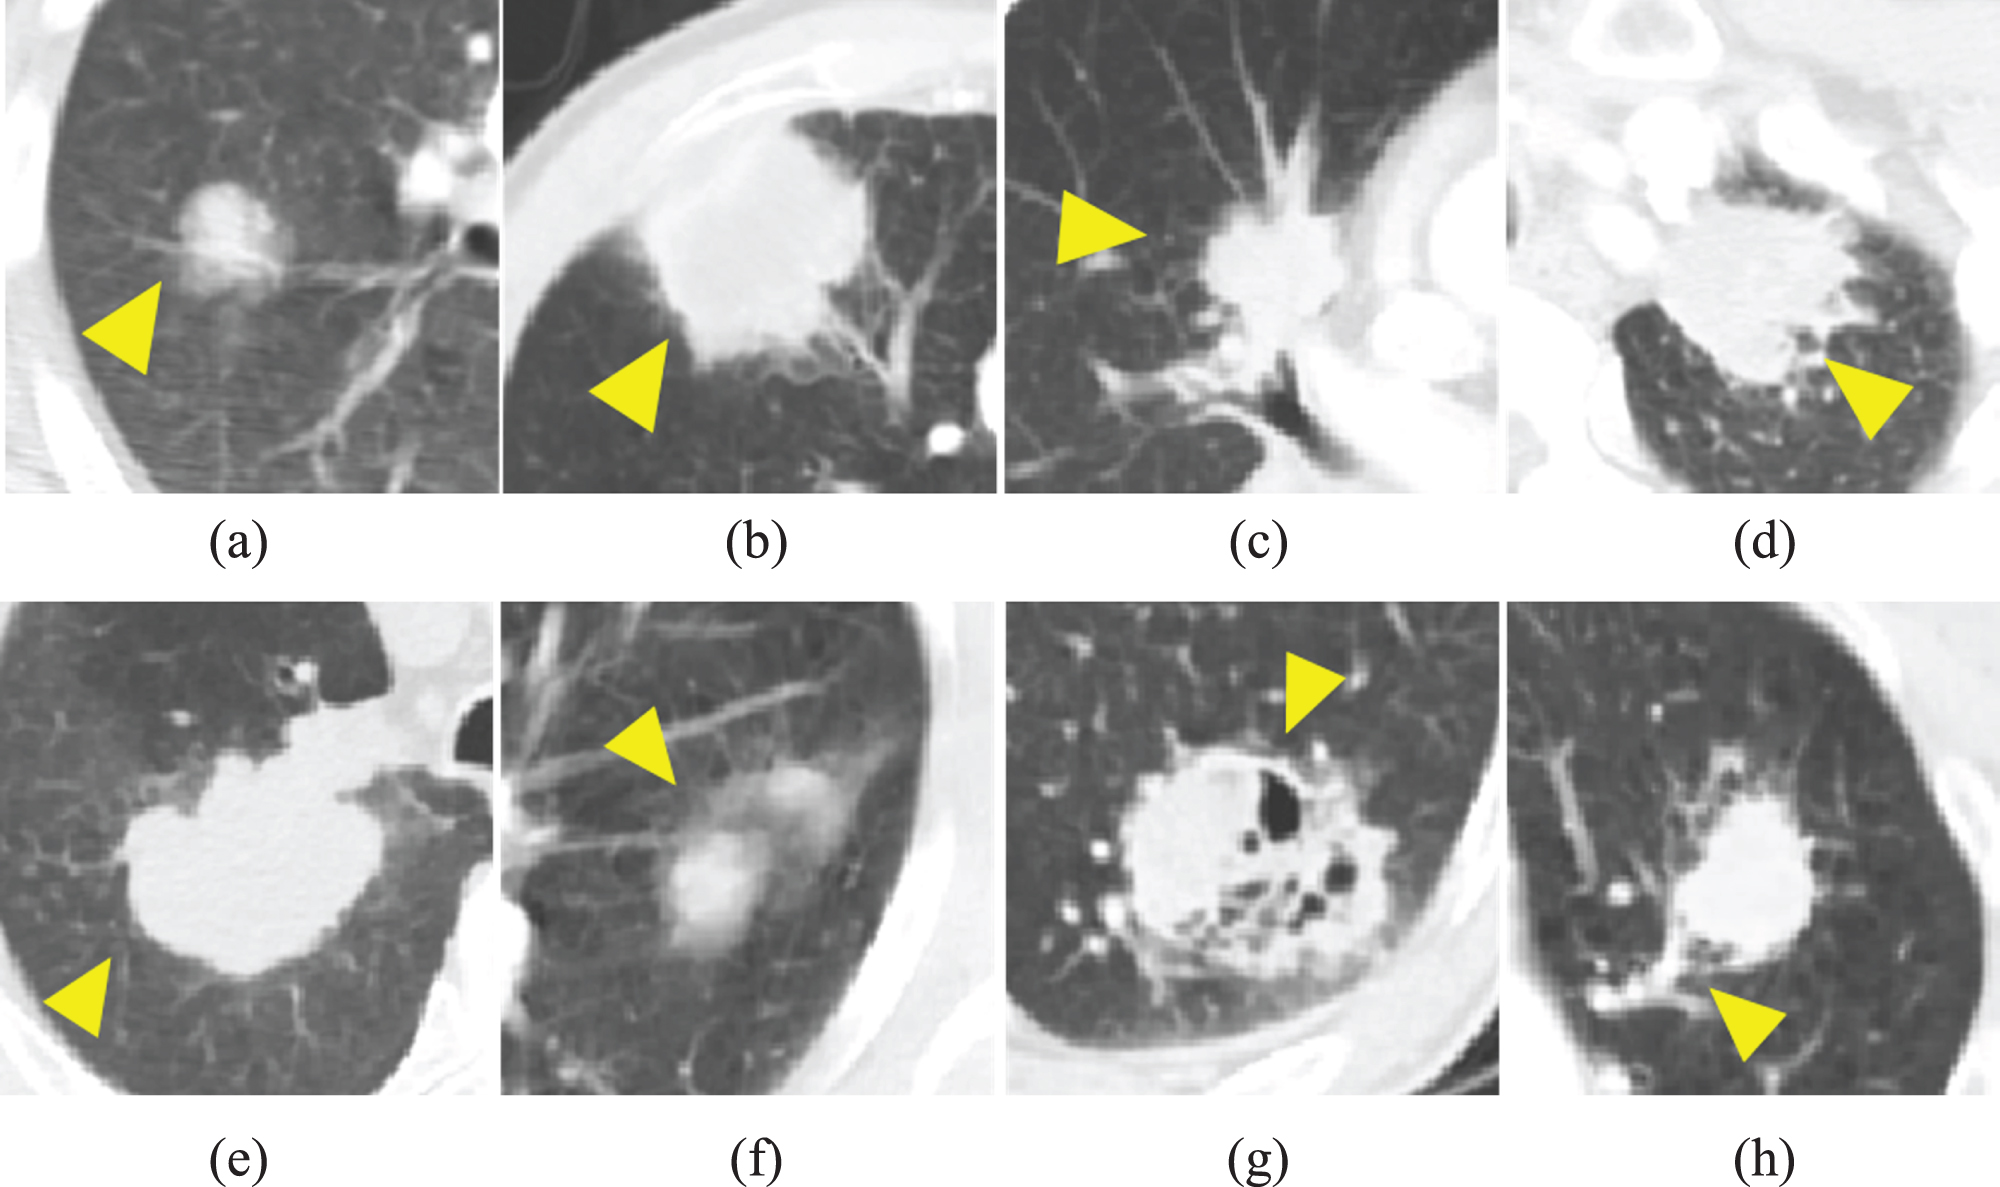
Example images of lung tumors with the diversity in sizes, locations, shapes, proximity to surrounding structures, and types on chest CT images (a)-(d) lung tumors including isolated tumor, chest wall-attached tumor, mediastinum-attached tumor, and surrounded-tumor by chest wall at the apex of the lung (e)-(h) lung tumors including solid tumor, sub-solid tumor, tumor with necrosis, and vessel-attached tumor (yellow arrowheads indicate the lung tumor).
Several studies have presented deep-learning-based segmentation methods for lung nodules and tumors, and these can be categorized into two approaches: 2D and 3D segmentation networks. Regarding a 2D segmentation network, Tong et al. [7] proposed an improved U-Net architecture in which a shortcut residual block was added for lung nodule segmentation using a dataset from the LUng Nodule Analysis (LUNA) 15 challenges. Jiang et al. [8] proposed a multiple-resolution residually connected network (MRRN), including an incremental MRRN and a dense MRRN, for lung tumor segmentation using two public datasets and one internal dataset, specifically the Lung Image Database Consortium (LIDC) dataset, the Cancer Imaging Archive (TCIA) dataset [9], and a dataset from the Memorial Sloan Kettering Cancer Center, respectively. The incremental-MRRN-extended U-Net and the dense-MRRN-extended RefineNet [10] were designed by passing features to multiple resolution layers using a residual connection. Wang et al. [11] proposed a central focused convolution neural network (CF-CNN) for lung nodule segmentation using the public LIDC dataset and an internal dataset from Guangdong General Hospital (GDGH). The CF-CNN is designed to capture 3D and 2D information simultaneously. The 3D input images consist of three subsequent slices of the lung nodule and the 2D input images consist of two scales of the middle slice of the 3D input image. To eliminate irrelevant features while maintaining patch center features, the proposed central pooling approach adopts small pooling kernels around the image center and large pooling kernels around the image edge. Wang et al. [12] proposed multi-view deep convolutional neural networks (MV-CNN) for lung nodule segmentation using the public dataset of the Lung Image Database Consortium and Image Database Resource Initiative (LIDC-IDRI). To capture detailed texture and shape information of lung nodules, they used a multi-scale input patch strategy and MV-CNN including three branches intended to capture features from the axial, coronal, and sagittal planes.
With regard to 3D segmentation network, Hossain et al. [13] proposed a dilated hybrid 2D/3D convolutional neural network for lung tumor segmentation using a public TCIA dataset. Their model is defined by a modification of the LungNet architecture [14], in which 3D convolutional blocks are added. LungNet, a dilated convolutional neural network, is used to extract 2D feature maps from individual 2D slices. The extracted 2D feature maps are then stacked and fused through 3D convolutions to consider the 3D structure of the lung tumor. Zhou et al. [15] proposed 3D lesion volume segmentation from 2D RECIST-slice data using a scale-invariant and boundary-aware (SiBA) deep convolutional network for lung lesion segmentation using the LesionVis internal dataset. The initial SiBA-Net is initially trained on 2D RECIST slices with labels. The next neighboring slices without a label are then predicted using the initial SiBA-Net model, with the masks refined by CRF. All slices with labels and predicted labels are added to the training dataset for the next iteration of training. Nam et al. [16] proposed a convolutional neural network trained with nodule diameter information for lung nodule segmentation using the dataset from LUNA 16 challenges for training and the public LIDC-IDRI dataset for testing. To consider the nodule diameter information, the proposed model uses only pixels of the diameter as the foreground for loss calculations instead of pixels within the entire tumor.
Our study aims to accurately segment lung tumors of various sizes, locations, and shapes on chest CT images. Most of the previously reported studies were studies in which lung nodules were segmented using publicly available datasets, and even if lung tumors were segmented, they were segmented using 2D or 3D CNNs using the intensity values obtained from chest CT images. To overcome this problem, we propose a dual-coupling net with shape prior based on lung and mediastinal window images from chest CT images. Dual-coupling net is a network combined with three planar 2D-Nets considering separation from surrounding structures through two window images and a 3D Net considering the spatial and tumor shape information. To extract shape information from lung tumors accurately, three-planar images which include the axial, coronal, and sagittal planes are trained on 2D-Nets. To distinguish lung tumors from the thoracic region and for better separation of the boundaries of lung tumors from those of adjacent structures, two types of window images, specifically lung and mediastinal window images, are trained on 2D-Nets. To prevent false-positive outliers to adjacent structures and to consider the spatial information of lung tumors, a pair consisting of the tumor volume-of-interest (VOI) and the tumor shape prior is trained on 3D-Net.
This paper is organized as follows. The characteristics of the dataset and a detailed description of the proposed dual-coupling net are given in Section 2. Three types of experiments and their overall performance outcomes are presented in Section 3. Finally, Section 4 discusses the contributions of the proposed dual-coupling net and provides the conclusion to the paper.
Materials
Three different lung tumor datasets were used in this study. Patient data from the first and second datasets were approved by the Institutional Review Board (IRB) of the Veterans Health Service Medical Center (VHSMC), Seoul, Korea. First, 260 CT images of histologically proven non-small-cell lung cancer (NSCLC) patients were acquired from July of 2003 to June of 2015, consisting of 148 lung squamous cell carcinomas (LUSC) and 112 lung adenocarcinomas (LUAD). The patients were 253 males and 7 females of an average age of 73 years and with a standard deviation of 6.9. These patients were examined with three different CT scanners: a Siemens SOMATOM Definition AS+, a Siemens SOMATOM Sensation 64, and a GE Healthcare Lightspeed Ultra. The CT data consist of 15 non-contrast-enhanced images and 245 contrast-enhanced images, each image has a matrix size of 512x 512 pixels with an in-plane resolution of 0.54 to 0.83 mm, a slice thickness of 1.0 to 7.5 mm, and a dose protocol of 100 to 130kVp at 73∼575 mAs.
Second, 67 CT images of histologically proven NSCLC patients were acquired from November of 2015 to December of 2016, consisting of 27 LUSC and 40 LUAD images. These were from 65 males and 2 females of an average age of 72 years and with a standard deviation of 4.1. These patients were examined with five different CT scanners, in this case GE Healthcare Lightspeed Ultra, Discovery CT 750 HD, Siemens SOMATOM Sensation 16, PHILIPS CT 5000 Ingenuity, and Toshiba Aquilion scanners. The CT data consist of 34 non-contrast-enhanced images and 33 contrast-enhanced images, each image has a matrix size of 512x512 pixels with an in-plane resolution of 0.58 to 0.88 mm, a slice thickness of 1.2 to 5 mm, and a dose protocol of 100 to 140kVp at 84∼578 mAs.
Third, 70 CT images of NSCLC patients acquired from September of 2004 to January of 2014, specifically 51 LUSC and 19 LUAD images, were selected from the TCIA dataset. These were from 55 male and 15 female patients of an average age of 69 years and with a standard deviation of 10.7. These patients were examined with four different CT scanners, in this case Elekta CMS XiO, Siemens SOMATOM Sensation 16, Siemens SOMATOM Sensation Open, and Siemens Biograph 40 scanners. The CT data consist of 37 non-contrast-enhanced images and 33 contrast-enhanced images; each image has a matrix size of 512x512 pixels with an in-plane resolution of 0.97 mm, a slice thickness of 3 mm, and a dose protocol of 50 to 360 kVp at 120 to 140 mAs.
For the first and second datasets, lung tumor annotations were performed by three board-certified radiologists using in-house software [17, 18]. In the tumor annotation, the radiologists annotated tumor boundaries in all involved slices, necrosis and cavities were excluded from the lung tumor area, and the ground-glass opacity areas were included in the lung tumor area. Lung tumor annotations in the first dataset were performed by one radiologist in the lung and mediastinal window images, and lung tumor annotations in the second dataset were performed simultaneously by two radiologists only in the lung window images. For the third dataset, lung tumor annotations were performed by four radiologists with 3D-slicer [19], and necrosis, cavities, and ground-glass opacity areas were all included in the tumor area.
Figure 2 shows the size distributions of the lung tumors for the three datasets, where the lung tumor size has the longest diameter measured in the largest tumor slice of the CT images. The first and second datasets obtained from VHSMC are mostly distributed with a longest diameter of less than 5 cm and are generally distributed with longest diameters of 2 cm to 3 cm, while the third dataset is evenly distributed over the entire range.
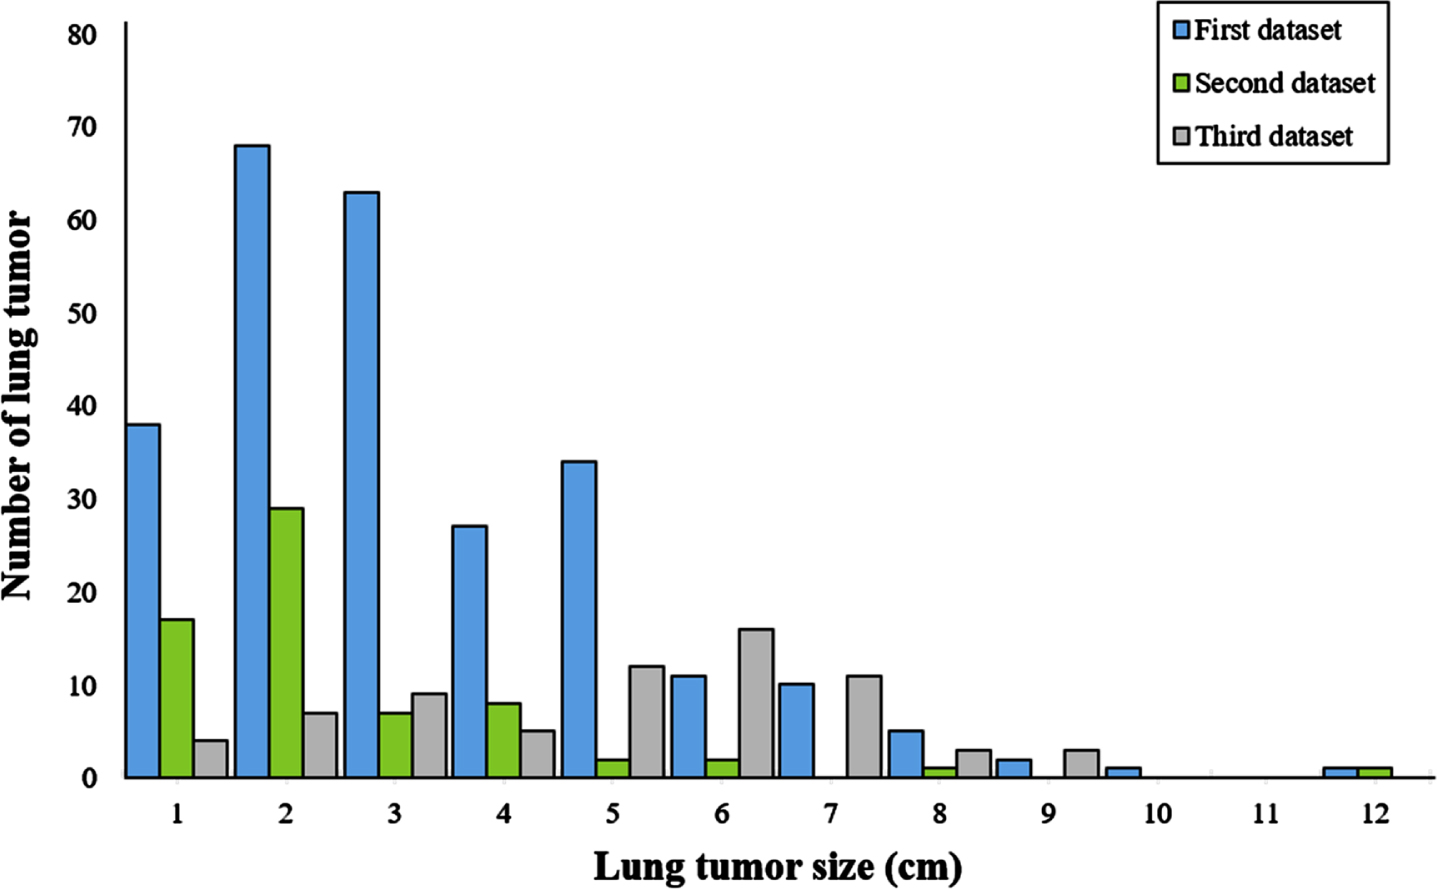
Distributions of lung tumor size for all datasets. The lung tumor diameter was measured from the largest tumor slice in the CT image.
Intensity normalization requires intensity rescaling, where lung tumors are well observed and well distinguished from the surrounding structures, depending on the lung and mediastinal window settings, and pixel spacing normalization is required due to the different field of view (FOV) during CT scanning.
For intensity normalization, the image is rescaled with reference to the lung and mediastinal window settings to enlarge the visual gray-scale identification range. The lung window images (Fig. 3(a)) with a window width and level of 1500HU and -600HU, respectively, are used to distinguish the lung parenchyma from the surrounding structures, while mediastinal window images with a corresponding window width and level of 350HU and 50HU are used to distinguish lung tumors from nearby structures [20]. The intensity of the lung window image is rescaled between 0 and 255 in the gray level range from -1350HU to 150HU, and the intensity of the mediastinal window image is rescaled between 0 and 255 in the gray level range from -125HU to 225HU. For spacing normalization, all images are resampled with a minimum spacing of 0.54 mm along the x-y axes.

Example images of different window settings (a) images with lung window setting (window width: 1500HU, window level: -600HU) which shows unclear boundaries from adjacent structures (b) images with mediastinal window setting (window width: 350HU, window level: 50HU) which shows clear boundaries from adjacent structures such as the chest wall and mediastinum.
To generate an input patch, the input images of three planar 2D-Nets are cropped to 160 x 160 pixels and the input volume of the 3D-Net is resized to 64 x 64 x 64 voxels around the annotated lung tumor. 2D-Net is based on 2D U-Net [21] using only the axial plane and 3D-Net is based on 3D U-Net [22].
Dual-coupling net consists of two types of three planar 2D-Nets considering separation from surrounding structures through two window images, and a 3D-Net considering the spatial and tumor shape information. In the three planar 2D-Nets using lung window images, a lung shape prior is generated with the overall tumor area information, and in the three planar 2D-Nets using mediastinal window images, a mediastinal shape prior is generated with clear tumor area information separated from adjacent structures due to their high contrast. In the 3D-Net, the lung tumor volume-of-interest (VOI) and the shape prior generated by combining the lung and mediastinal shape priors are trained together. The overall architecture of dual-coupling net is summarized in Fig. 4.

Illustration of Dual Coupling-Net architecture for lung tumor segmentation.
To consider the relationship between the lung tumor and surrounding structures on various planes, three planar images, in this case images on the axial, coronal, and sagittal planes, are generated from each of the lung and mediastinal window images and are trained in 2D-Nets based on 2D U-Net. To generate coronal and sagittal plane images, three-dimensionally reconstructed volume of the chest is generated from a sequence of 2D CT images along the axial axis. Coronal and sagittal plane images are then obtained from the 3D reconstructed volume at regular intervals along the coronal and sagittal axes, respectively. 2D-Net consists of a contracting path and an expanding path with five layers. Each layer in the contracting path contains two 3×3 convolution filters followed by a ReLU activation function and 2×2 max pooling with strides of 2 for down-sampling. In the expanding path, each layer contains 3×3 convolution filters followed by ReLU activation and up-sampling. To add high-resolution features to the expanding path, there is a skip connection from the contracting path to the corresponding layer in the expanding path. In the last layer, 1×1 convolution reduces the number of output channels, and the predicted probabilities of lung tumors is output. The mediastinal shape prior (MSP) is generated by maximum voting of three predicted probabilities trained from three plane images, and the lung shape prior (LSP) is generated through the same process in which the MSP is generated.
To reduce false-positive outliers that arise when training 3D-Net using a lung window image, a shape prior (SP) is generated by combining LSP and MSP. In Equation 1, the SEP of the region having a MSP probability of 0.5 or more is assigned a score of 1.0, and the SEP of the region having a LSP probability of 0.7 or more while the probability of MSP is 0 is weighted as 0.8 of the probability of LSP, and the SEP of the region having a LSP probability of 0.5 or more or 0.7 or less while the MSP probability is 0 is weighted as 0.6 of the probability of LSP. This means that the core region of the tumor is given as 1.0, while the peripheral region of the tumor is weighted as 0.6 or 0.8 of the weight of the LSP probability, limiting the segmentation to surrounding structures with intensity values similar to that of the tumor.
Here, SP i , MSP i , and LSP i denote the i-th values of shape prior, mediastinal shape prior, and lung shape prior, respectively.
As shown in Fig. 5, the SEP can reduce incorrectly segmented regions leaking around the lung tumors, which can occur when using LSP, increasing the influence of MSP reflecting clear lung tumor areas.

Color-coded images of the shape prior: (a) lung window images, (b) mediastinal window images, (c) shape prior (the range of color-bar is 0 to 1, which means the probability for a lung tumor).
Unlike the original 3D U-Net [21], the 3D-Net of dual-coupling net is trained with the tumor VOI and a shape prior together to reduce area that are incorrectly segmented into surrounding structures while maintaining the tumor shape. The 3D-Net consists of a contracting path and an expanding path with four layers. Each layer in the contracting path contains two 3×3×3 convolution filters followed by a ReLU activation function and 2×2×2 max pooling with strides of 2 for down-sampling. In the expanding path, each layer contains 3×3×3 convolution filters followed by ReLU activation and up-sampling. To add high-resolution features to the expanding path, there is a skip connection from the contracting path to the corresponding layer in the expanding path. In the last layer, 1×1×1 convolution reduces the number of output channels, and the predicted lung tumor probabilities are output.
Experimental settings
Dual-coupling net was implemented using the Python-based deep learning libraries Tensorflow and Keras. Training, validation, and testing of the model were performed on a server with four GeForce GTX 1080 GPUs. In 2D-Nets, the learning rate was 0.0001, the mini-batch size was 20, the loss function was the cross-entropy, and the Adam optimizer was used for optimization, while in 3D-Net, the learning rate was 0.0001, the mini-batch size was 5, the loss function was the dice coefficient, and the Adam optimizer was again used for optimization.
In the first experiment, we performed five-fold cross-validation by dividing the first dataset into five subsets of the same size based on the acquisition date to evaluate dual-coupling net, with 208 of the 260 cases used for training and validation and 52 of the 260 cases used for testing. In the second experiment, 260 cases of the first dataset were used for training and validation, and 67 cases of the second dataset were used for testing, while in the third experiment, 260 cases of the first dataset were used for training and validation, and 70 cases of the third dataset were used for testing. The second and third datasets were not used for training because annotations were only provided for the lung window images in those cases.
The Segmentation performance of dual-coupling net was compared with those of 2D-Net, 2.5D-Net, 3D-Net, and single-coupling net [6]. 2D-Net is based on 2D U-Net using only the axial plane; 2.5D-Net is a combination of results obtained from the axial, coronal, and sagittal planes; and 3D-Net is based on 3D U-Net. Single-coupling net is a combination of 2.5D-Net and 3D-Net considering only lung window images, while dual-coupling net is a combination of 2.5D-Net and 3D-Net considering pairs of lung and mediastinal window images. The performance outcomes of all models were evaluated using the Dice Similarity Coefficient (DSC), accuracy, sensitivity, and specificity, as shown in the following equations.
To analyze the effects of lung tumor segmentation, lung tumors were divided into four types, as shown in Fig. 6, depending on the location of the tumor in the lung parenchyma, where type 1 was an isolated tumor, type 2 was a chest-wall-attached tumor, type 3 was a mediastinum-attached-tumor, and type 4 was a tumor surrounded by the chest wall or liver in the apex or base of the lung. Figure 7 shows the number of tumors by lung tumor type according to the dataset.
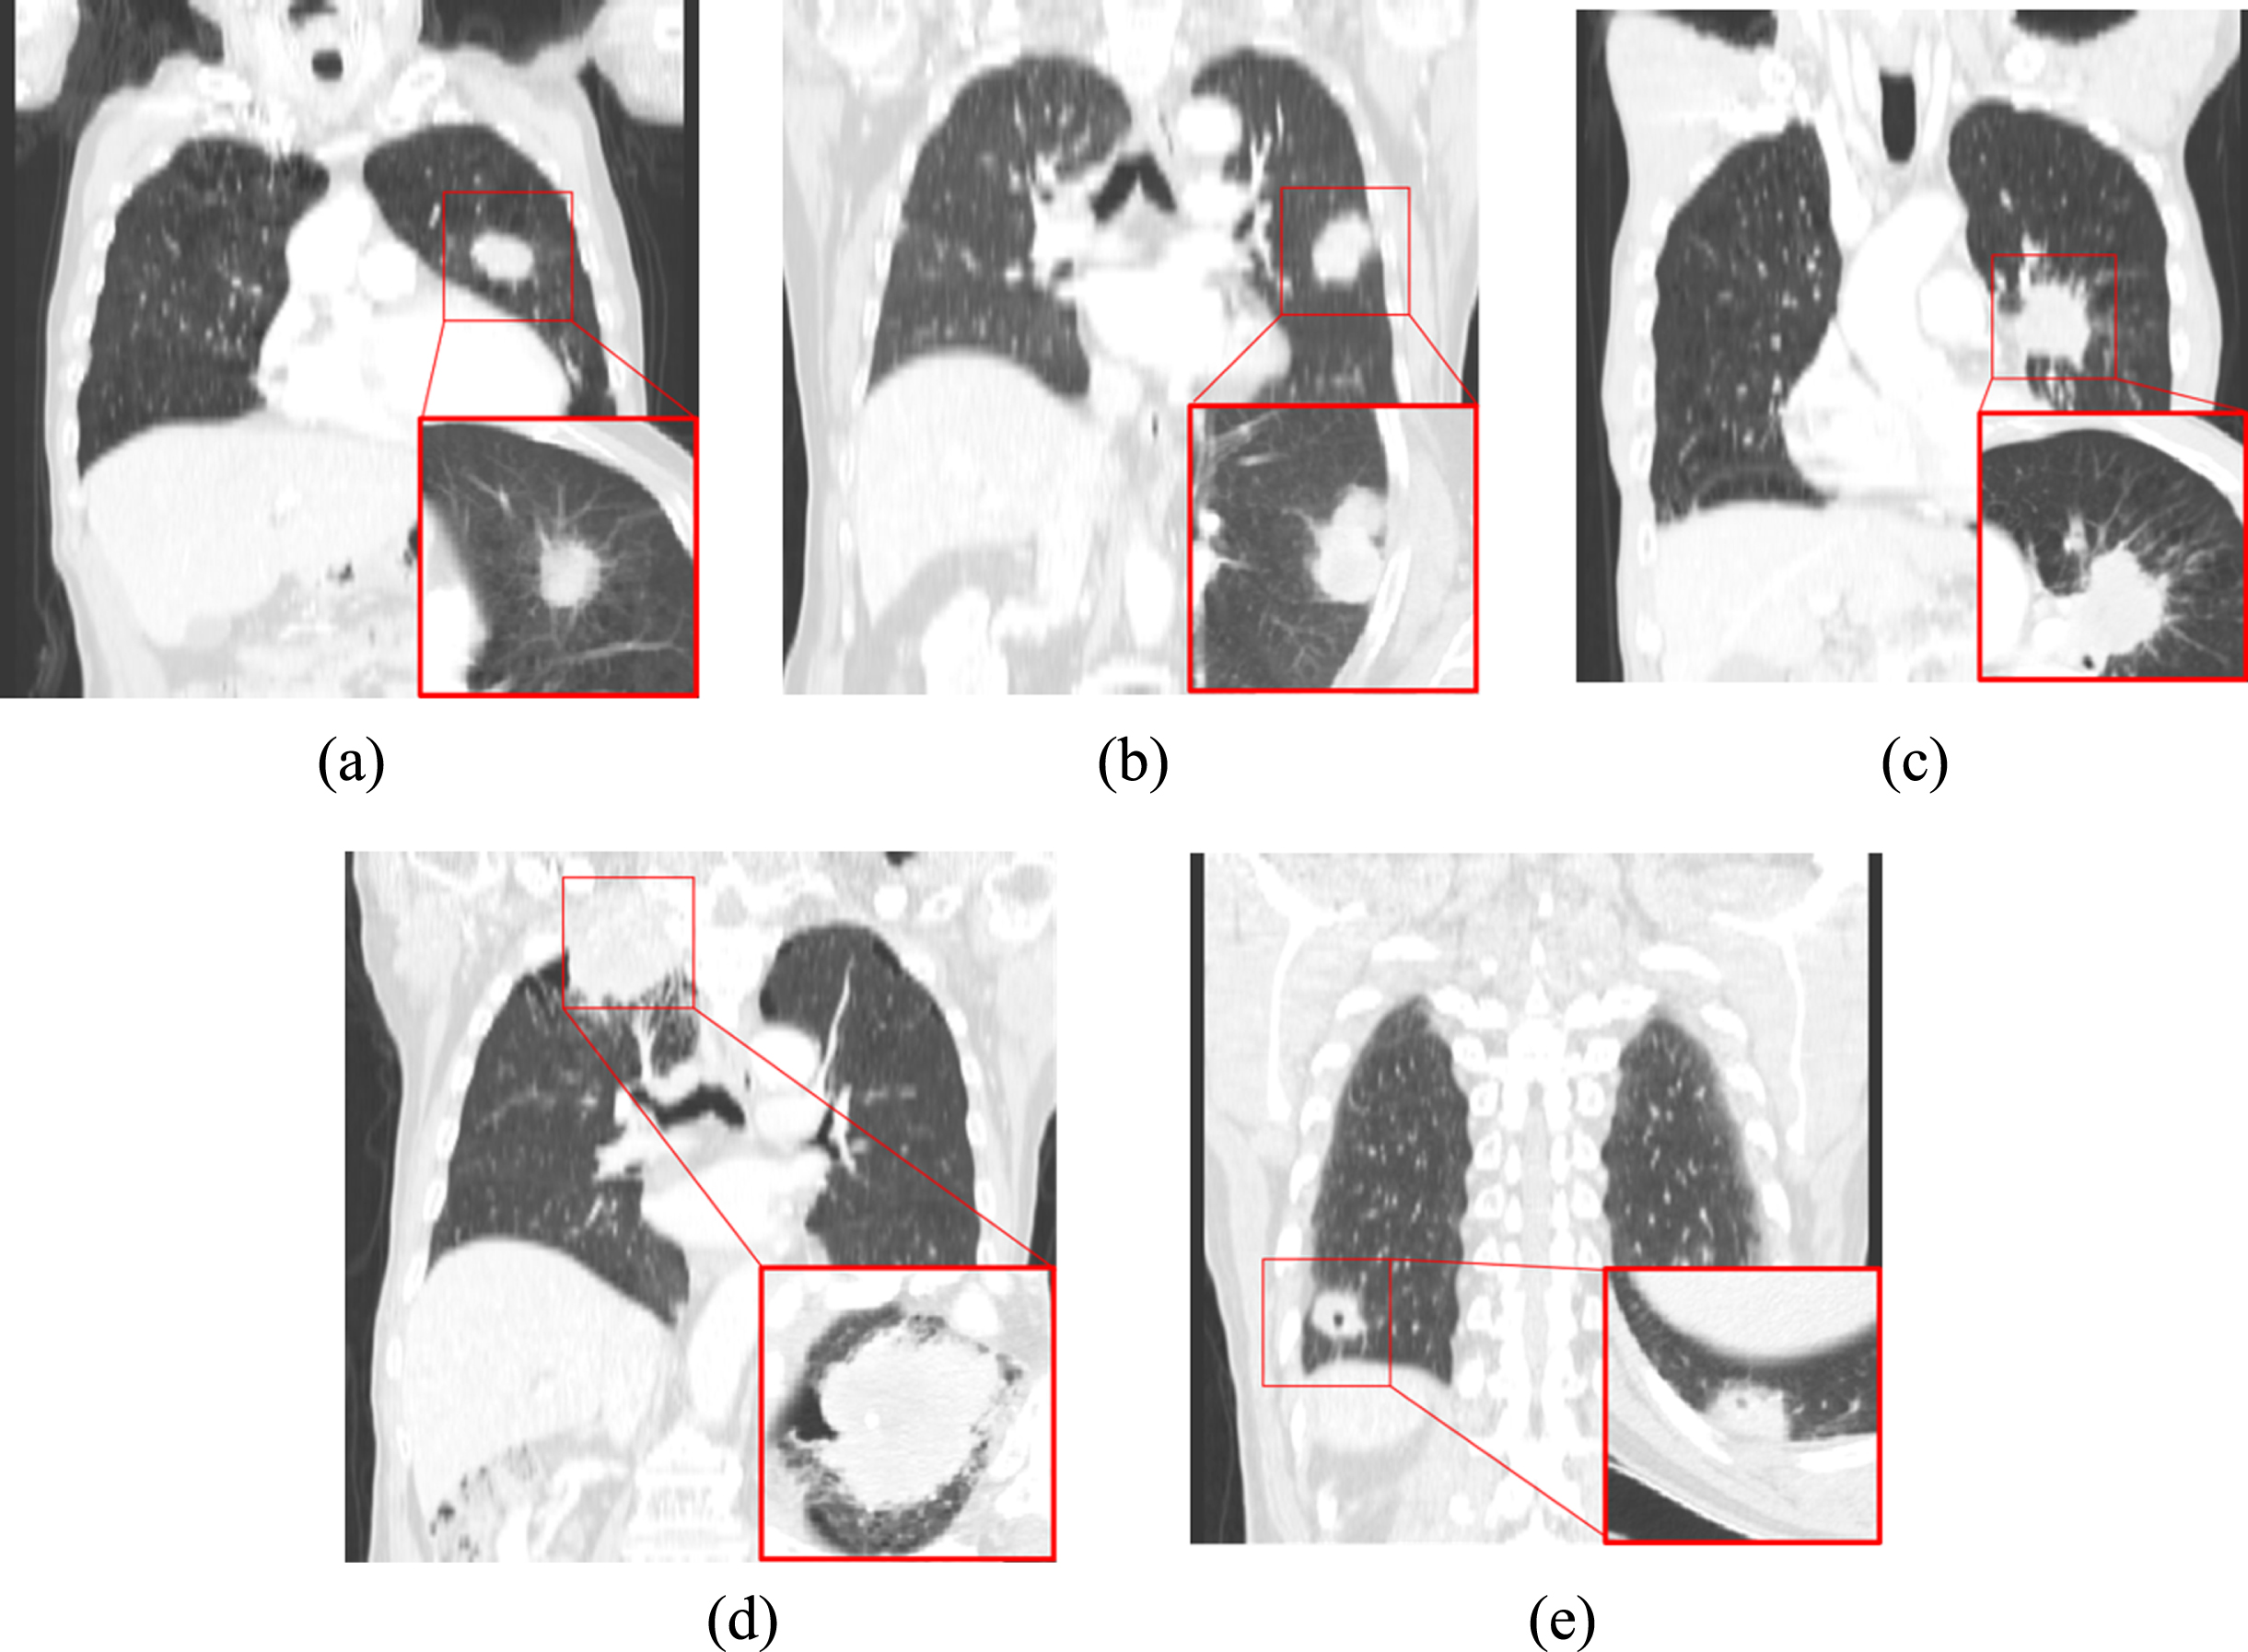
Representative images of lung tumors according to tumor type in the coronal plane. The enlarged image in the lower right of the image shows the lung tumor in the axial plane. (a) Type 1: isolated tumor, (b) Type 2: chest wall-attached tumor, (c) Type 3: mediastinum-attached tumor, and (d-e) Type 4: surrounded-tumor by chest wall or liver at the apex or base of the lung.
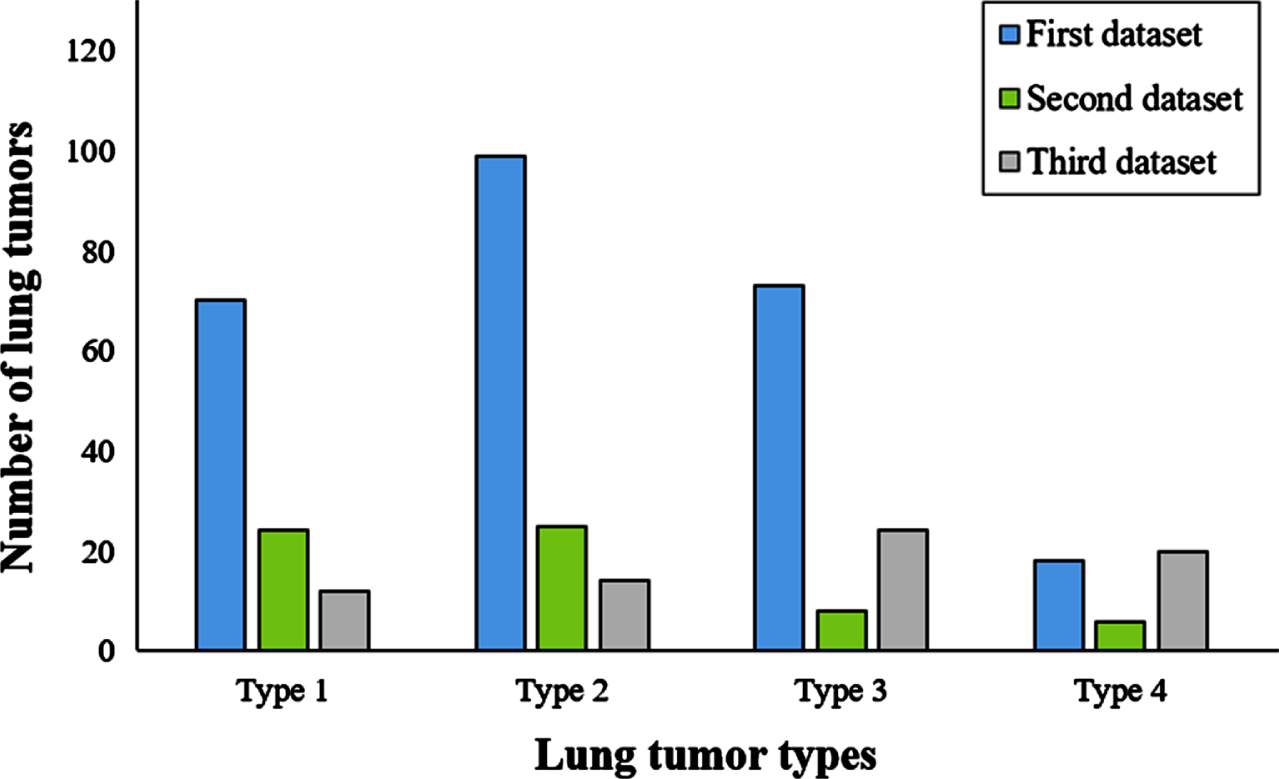
Distribution of number of tumors by lung tumor type according to dataset (a) first datasets (b) second datasets (c) third datasets.
Table 1 shows the segmentation performance according to the DSC, accuracy, sensitivity, and specificity for the first dataset. The segmentation performance of the proposed dual-coupling net achieved the best results compared to the other compared methods. The 2D-Net results showed the lowest DSC and sensitivity with the highest specificity. This occurred because the lung tumors had been under-segmented only while considering the axial plane. In the 2.5D-Net results, the overall performance of the DSC was improved by 14.53% p compared to the 2D-Net results by considering the coronal and sagittal images as well as the axial images, but the results were over-segmented around the lung tumors, resulting in the lowest specificity. In the 3D-Net results, the overall performance of the DSC was improved by 17.13% p and 2.6% p compared to 2D-Net and 2.5D-Net because the spatial information was considered, but there were nonetheless leaks into adjacent structures because it was difficult to distinguish lung tumor boundaries from lung window images. In the single-coupling net results, lung tumor segmentation was improved to consider the shape prior, but there were still limitations in that outliers remained because only lung window images were considered. In addition, due to the constraints of the shape prior, there was a tendency of segmentation into smaller segments than the actual tumor size; thus, the performance was lowered by 0.67% p in terms of the average DSC compared to 3D-Net. On the other hand, dual-coupling net showed the highest DSC of 75.7% because not only the shape prior but also the mediastinal window images were conspired to prevent leaks of adjacent structures while maintaining the lung tumors. Hence, the results were 18.23% p, 3.7% p, 1.1% p, and 1.77% p higher than those of 2D-Net, 2.5D-Net, 3D-Net, and single-coupling net, respectively.
Performance evaluation of lung tumor segmentation on the first dataset (Bold indicates the best performance of the comparison methods)
Performance evaluation of lung tumor segmentation on the first dataset (Bold indicates the best performance of the comparison methods)
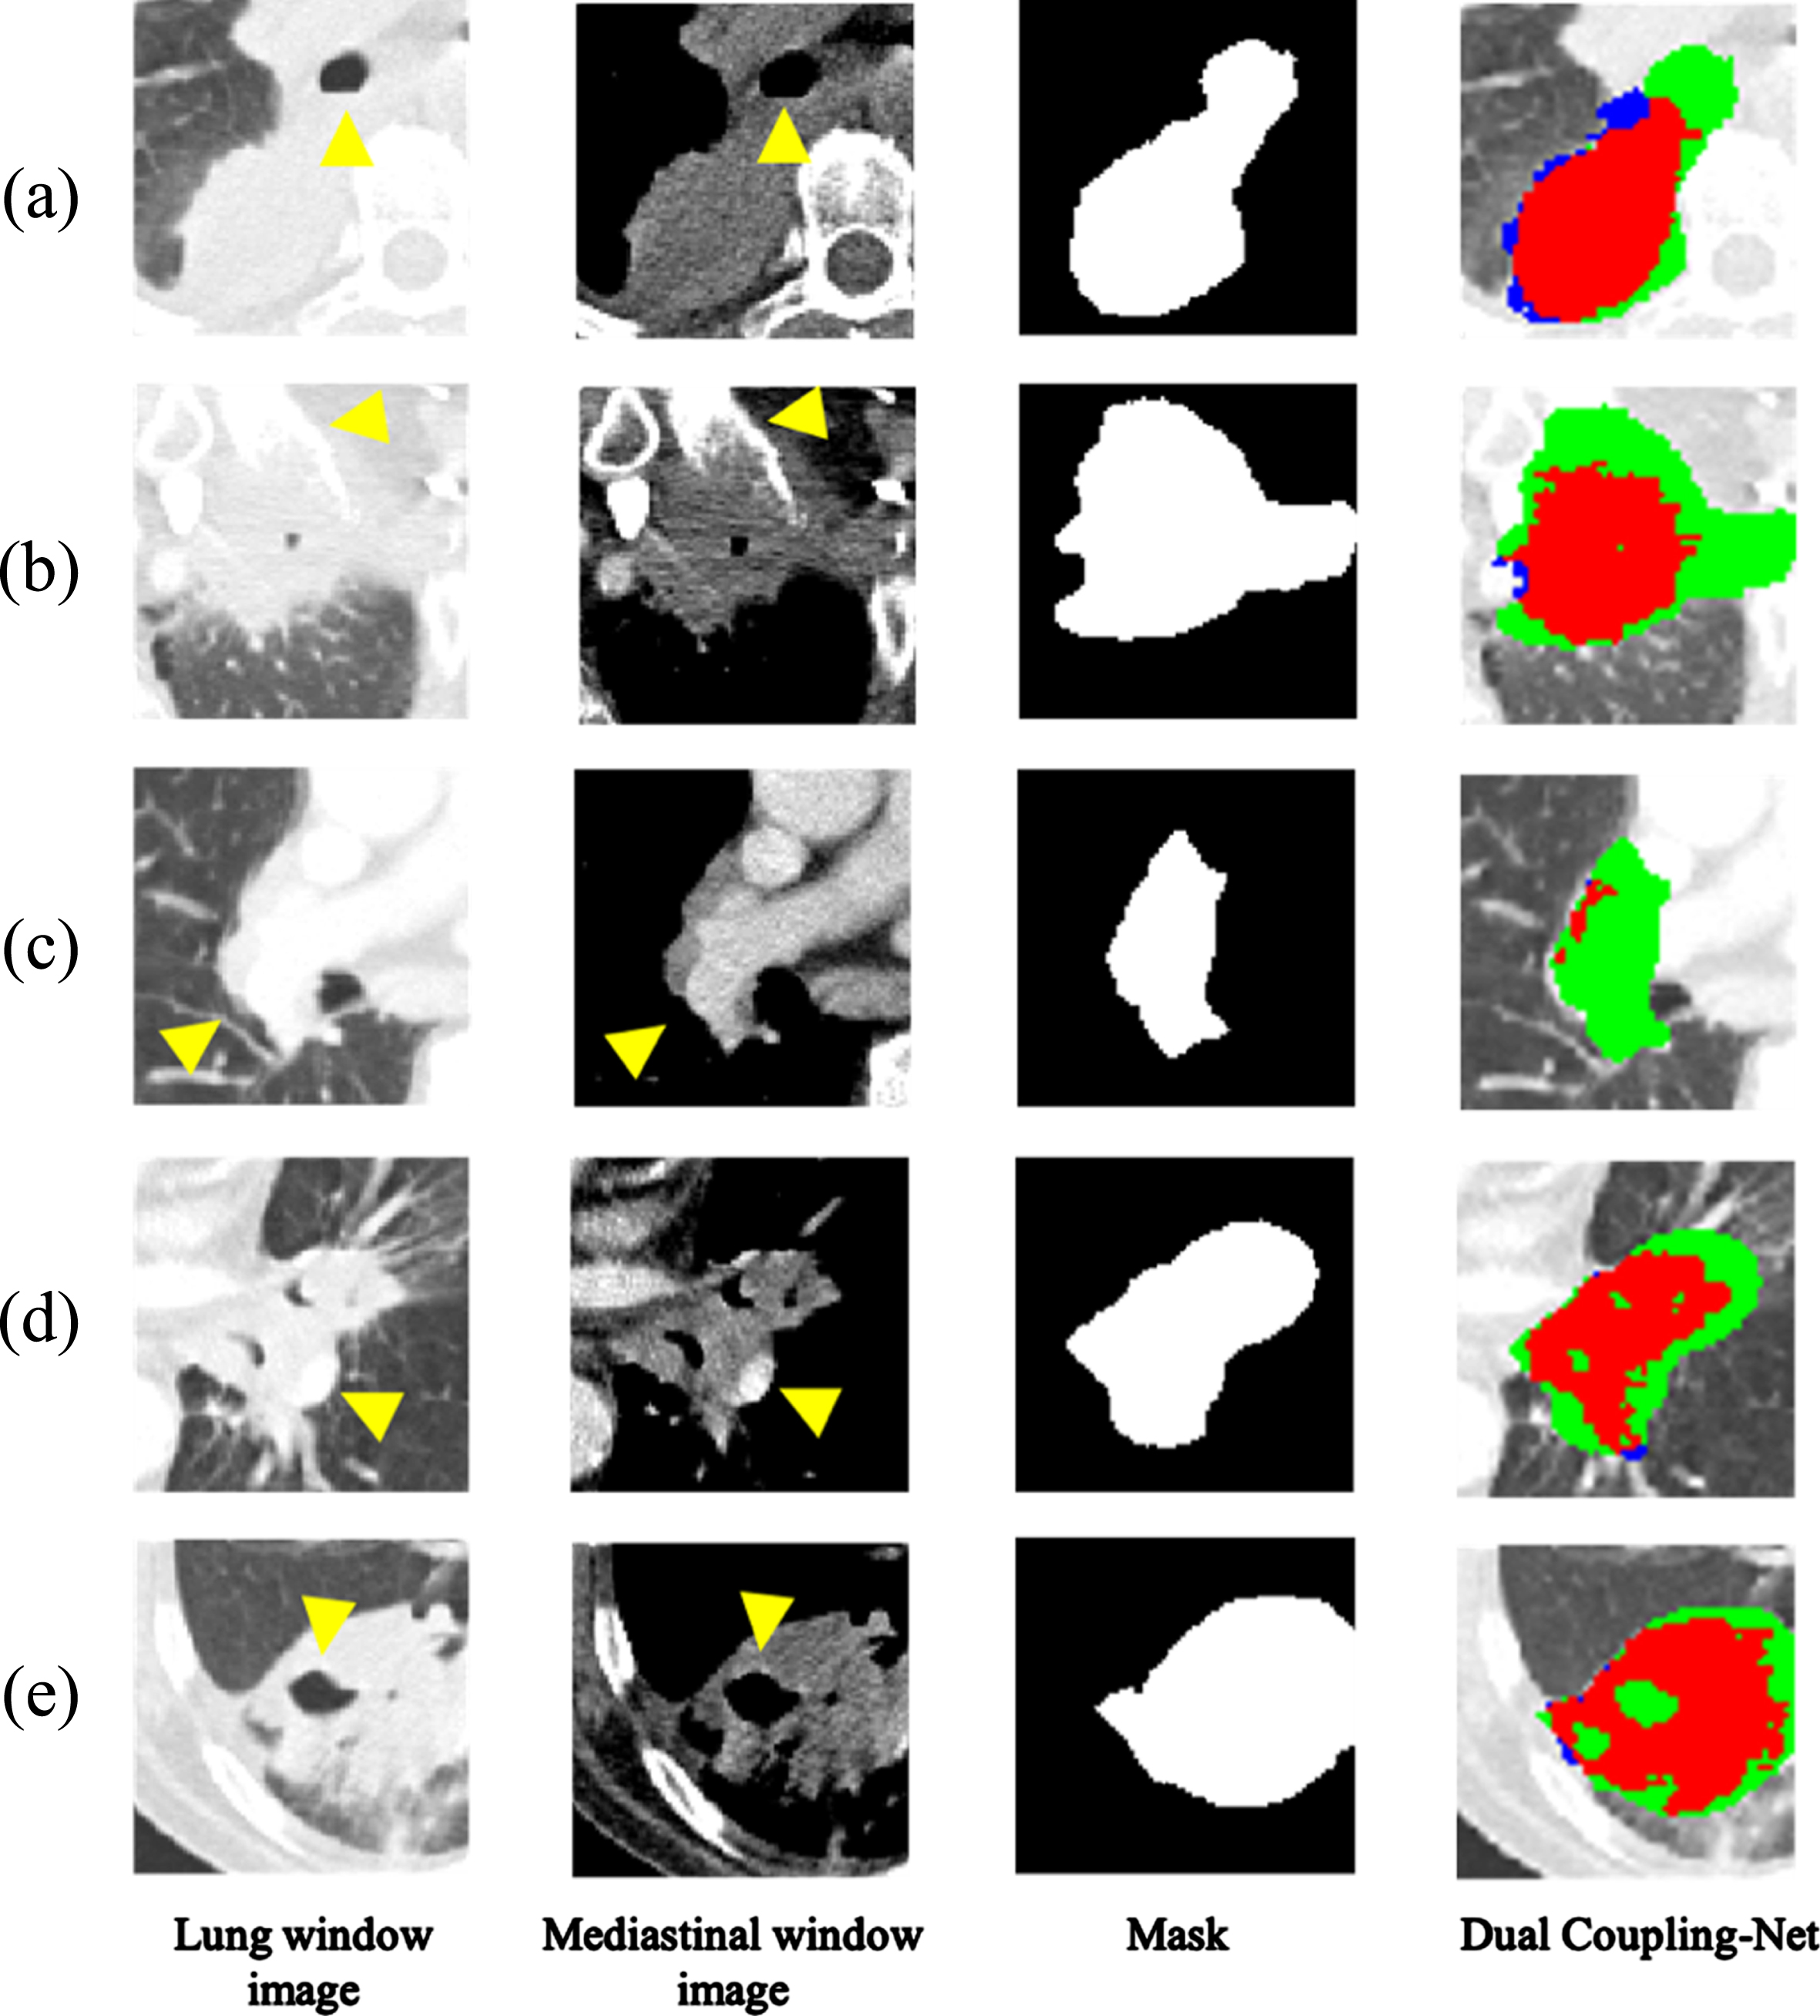
Table 2 shows the DSC for each type of lung tumor for the first dataset. Type 1 is an isolated tumor, which is mostly unaffected by the surrounding structures compared to the other types, resulting in over 80% performance on 3D-Net, single-coupling net, and dual-coupling net, but not 2D-Net or 2.5D-Net. Type 2 showed the best performance of 76.26% on dual-coupling net. Unlike the lung window image, the mediastinal window image used for dual-coupling net was able to distinguish the lung tumor boundaries attached to the chest wall by providing a large difference in the intensity values between the ribs surrounded by the chest wall and the lung tumor. Type 3 is a lung tumor attached to the mediastinum, which is difficult to distinguish due to the similar intensity values between the lung tumor and the mediastinum in the lung window image. However, dual-coupling net showed the best performance of 69.36% by reducing the leakage to the mediastinum due to the mediastinal window images used. Type 4 is a lung tumor located at the apex and base of the lungs and surrounded by the chest wall or liver, showing the best performance of 81.09% on dual-coupling net considering the mediastinal window image as well as the lung window image and shape prior. Figure 8 shows the segmentation results of dual-coupling net and the compared methods on the chest CT images.
Performance evaluation of the lung tumor segmentation according to lung tumor types (Bold indicates the best performance of the comparison methods)
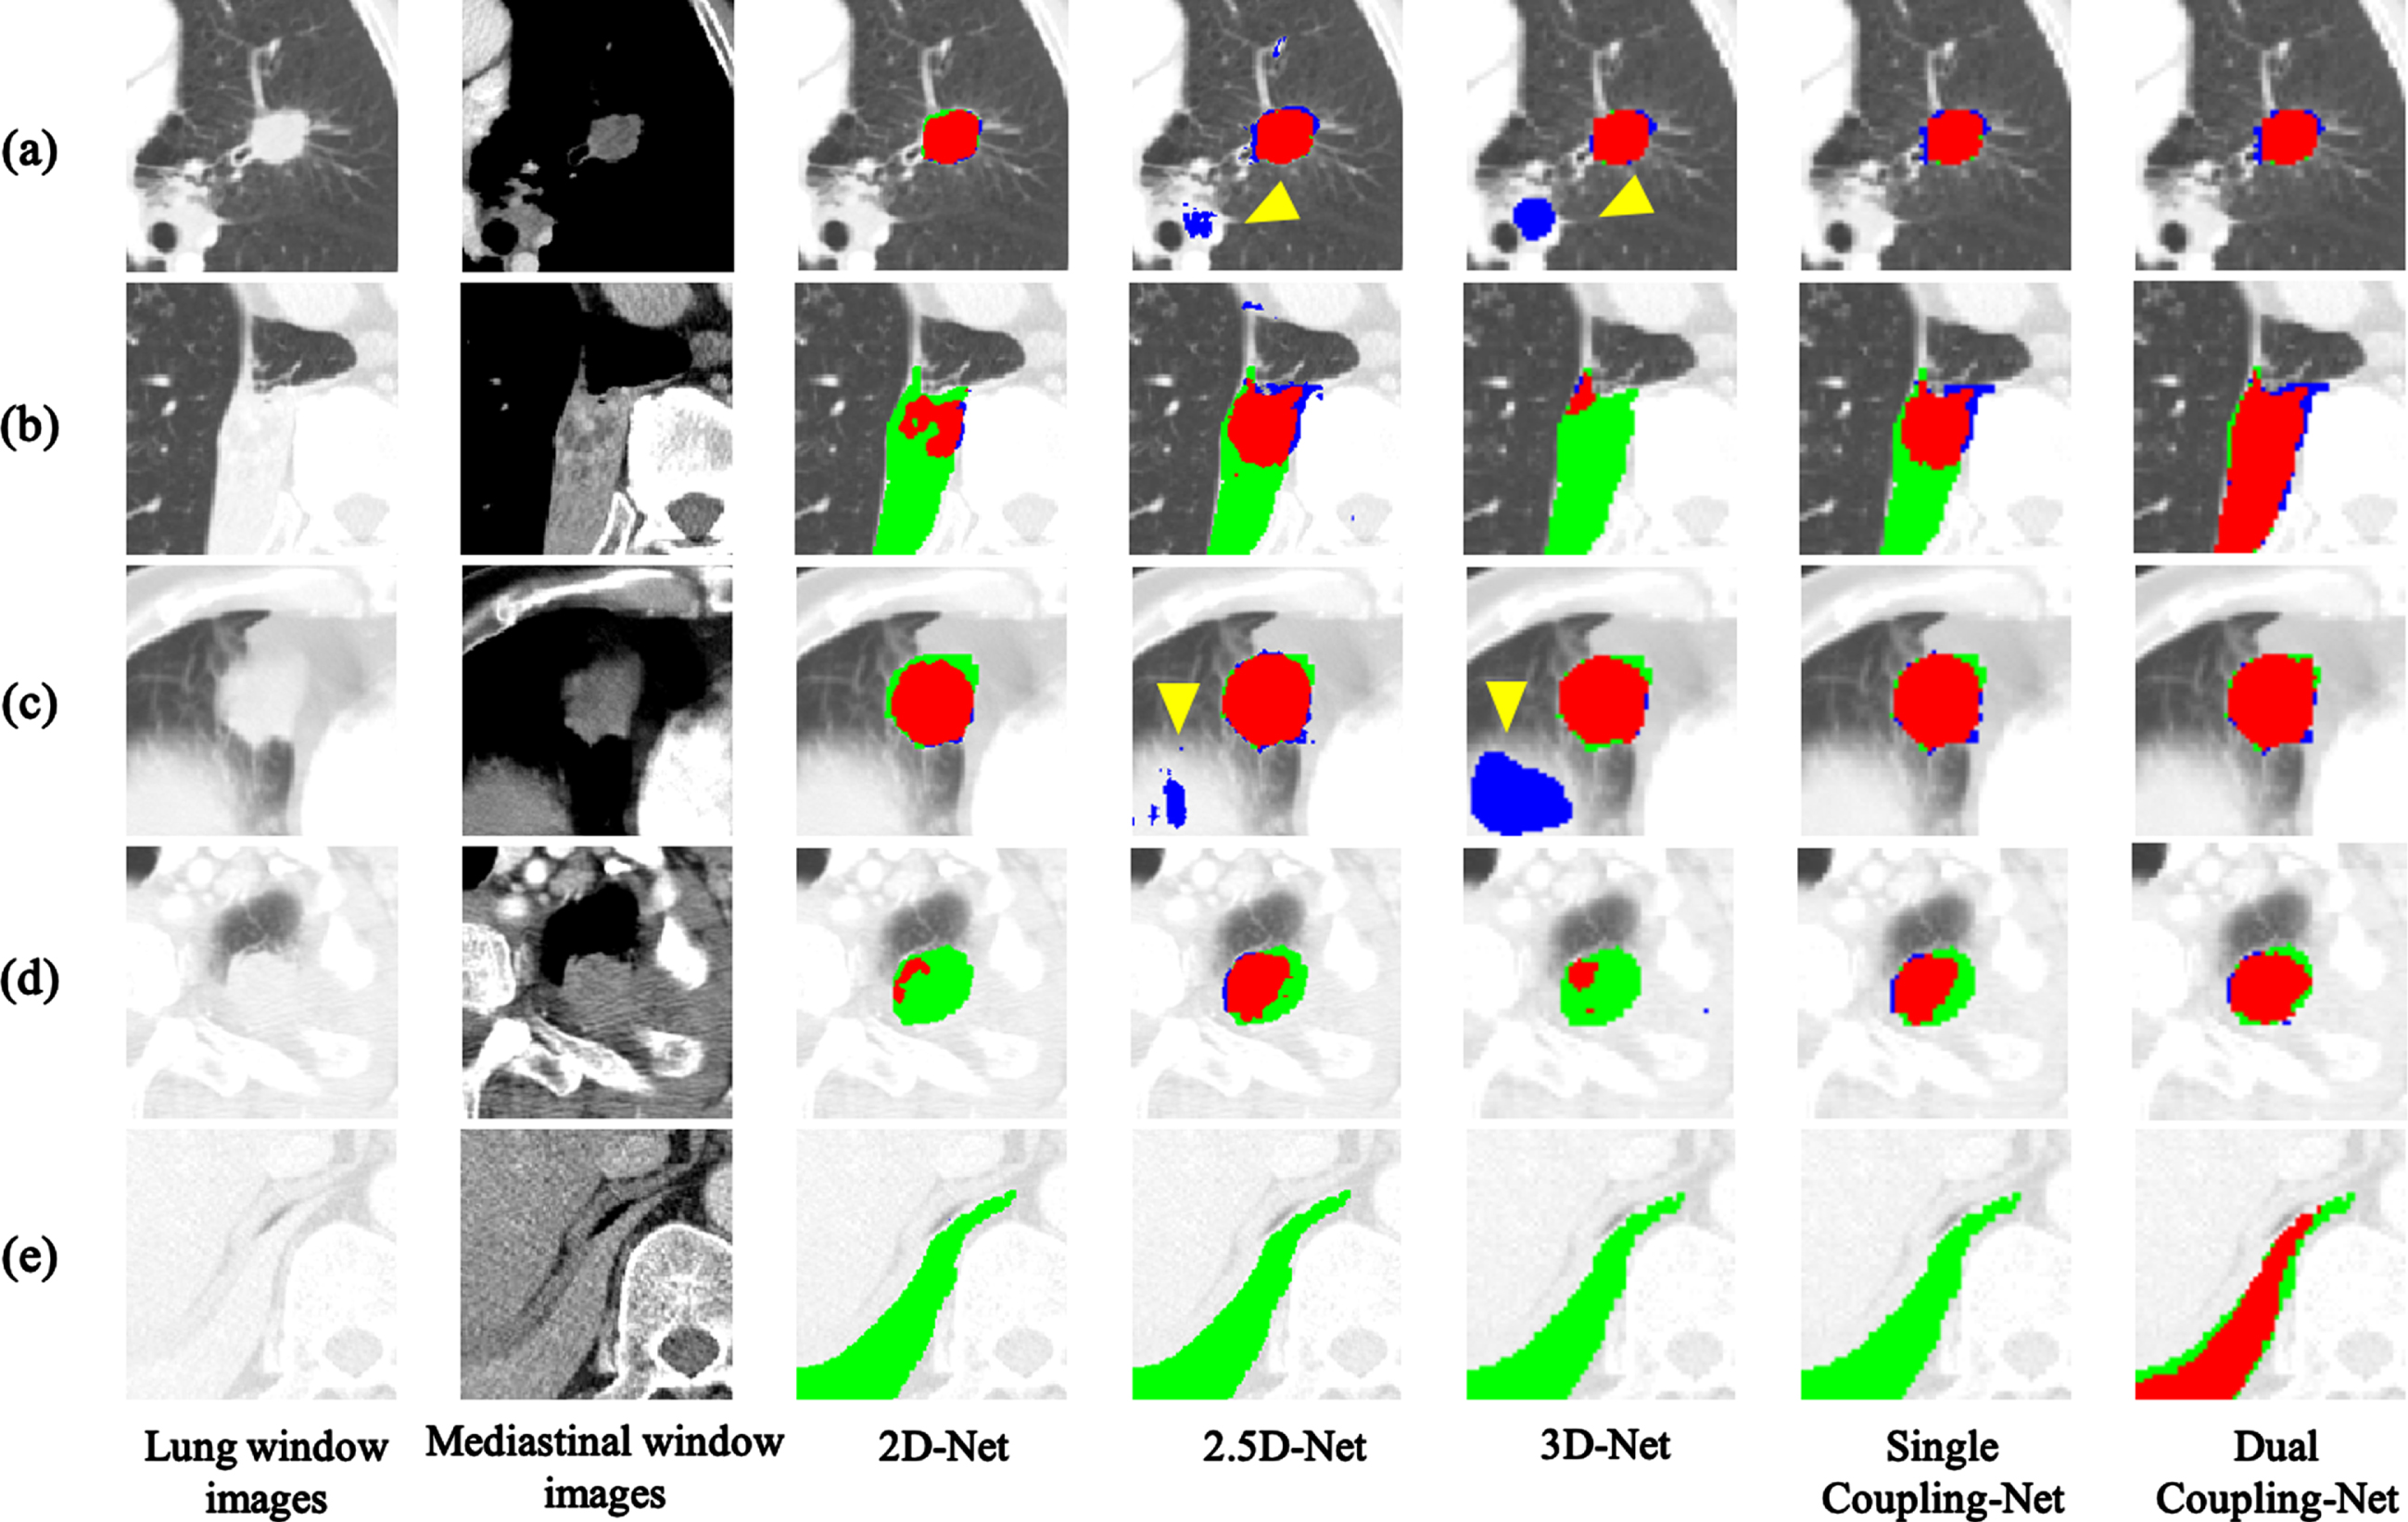
Segmentation results for various types of lung tumors in the first dataset. (a) isolated tumor (type 1), (b) chest wall-attached tumor (type 2), (c) mediastinum-attached tumor (type 3), (d) surrounded-tumor by chest wall at the apex of lung (type 4), (e) surrounded-tumor by liver and chest wall at the base of lung (type 4). (Red: overlapping areas with expert annotation, Green: under-segmented areas, Blue: over-segmented areas, Yellow arrowheads indicate leaks to nearby structures.).
Table 3 shows the segmentation performance of the proposed dual-coupling net based on the ground truths drawn by two radiologists in the second dataset according to the DSC, accuracy, sensitivity, and specificity. First, for the four datasets with a DSC of less than 50% between annotation A and annotation B, the agreement between radiologists was low and was excluded from the evaluation of the segmentation performance. For 63 cases, the average ICC value between annotation A and annotation B was 0.996, the DSC was 82.46%, and the DSC between annotation A and the ground truth was 2.66% p higher than the DSC with annotation B. The performance of dual-coupling net based on annotation A was 67.73% on the average DSC, and the performance of dual-coupling net based on annotation B was 65.07% on the average DSC, outcomes which are 6.97% p and 10.63% p lower compared to the corresponding segmentation performance outcomes with the first dataset. The segmentation performance of the second dataset is lower than that of the first dataset because the radiologist’s annotation criteria of the first and second datasets differ in some respects, and because the second dataset contains more non-contrast-enhanced images than the first dataset. Dual-coupling net can distinguish the exact lung tumor boundaries from the surrounding structures relatively well by considering the intensity differences between the lung tumor and the surrounding structures in mediastinal window images, but in non-contrast-enhanced images these cannot be distinguished from the surroundings, even in mediastinal window images.
Performance evaluation of lung tumor segmentation according to annotations on the second dataset
Performance evaluation of lung tumor segmentation according to annotations on the second dataset
Table 4 shows the performance evaluation of lung tumor segmentation according to the lung tumor type for the second dataset. Types 1, 2, and 4 showed similar segmentation performance outcomes between annotation A and annotation B, but type 3 had a lower DSC than the other types due to the difficulty of distinguishing the tumor boundaries in lung tumors attached to the mediastinum in non-contrast-enhanced images. Figure 9 shows the segmentation results of dual-coupling net according to the lung tumor type.
Performance evaluation of the lung tumor segmentation according to lung tumor types for the second dataset
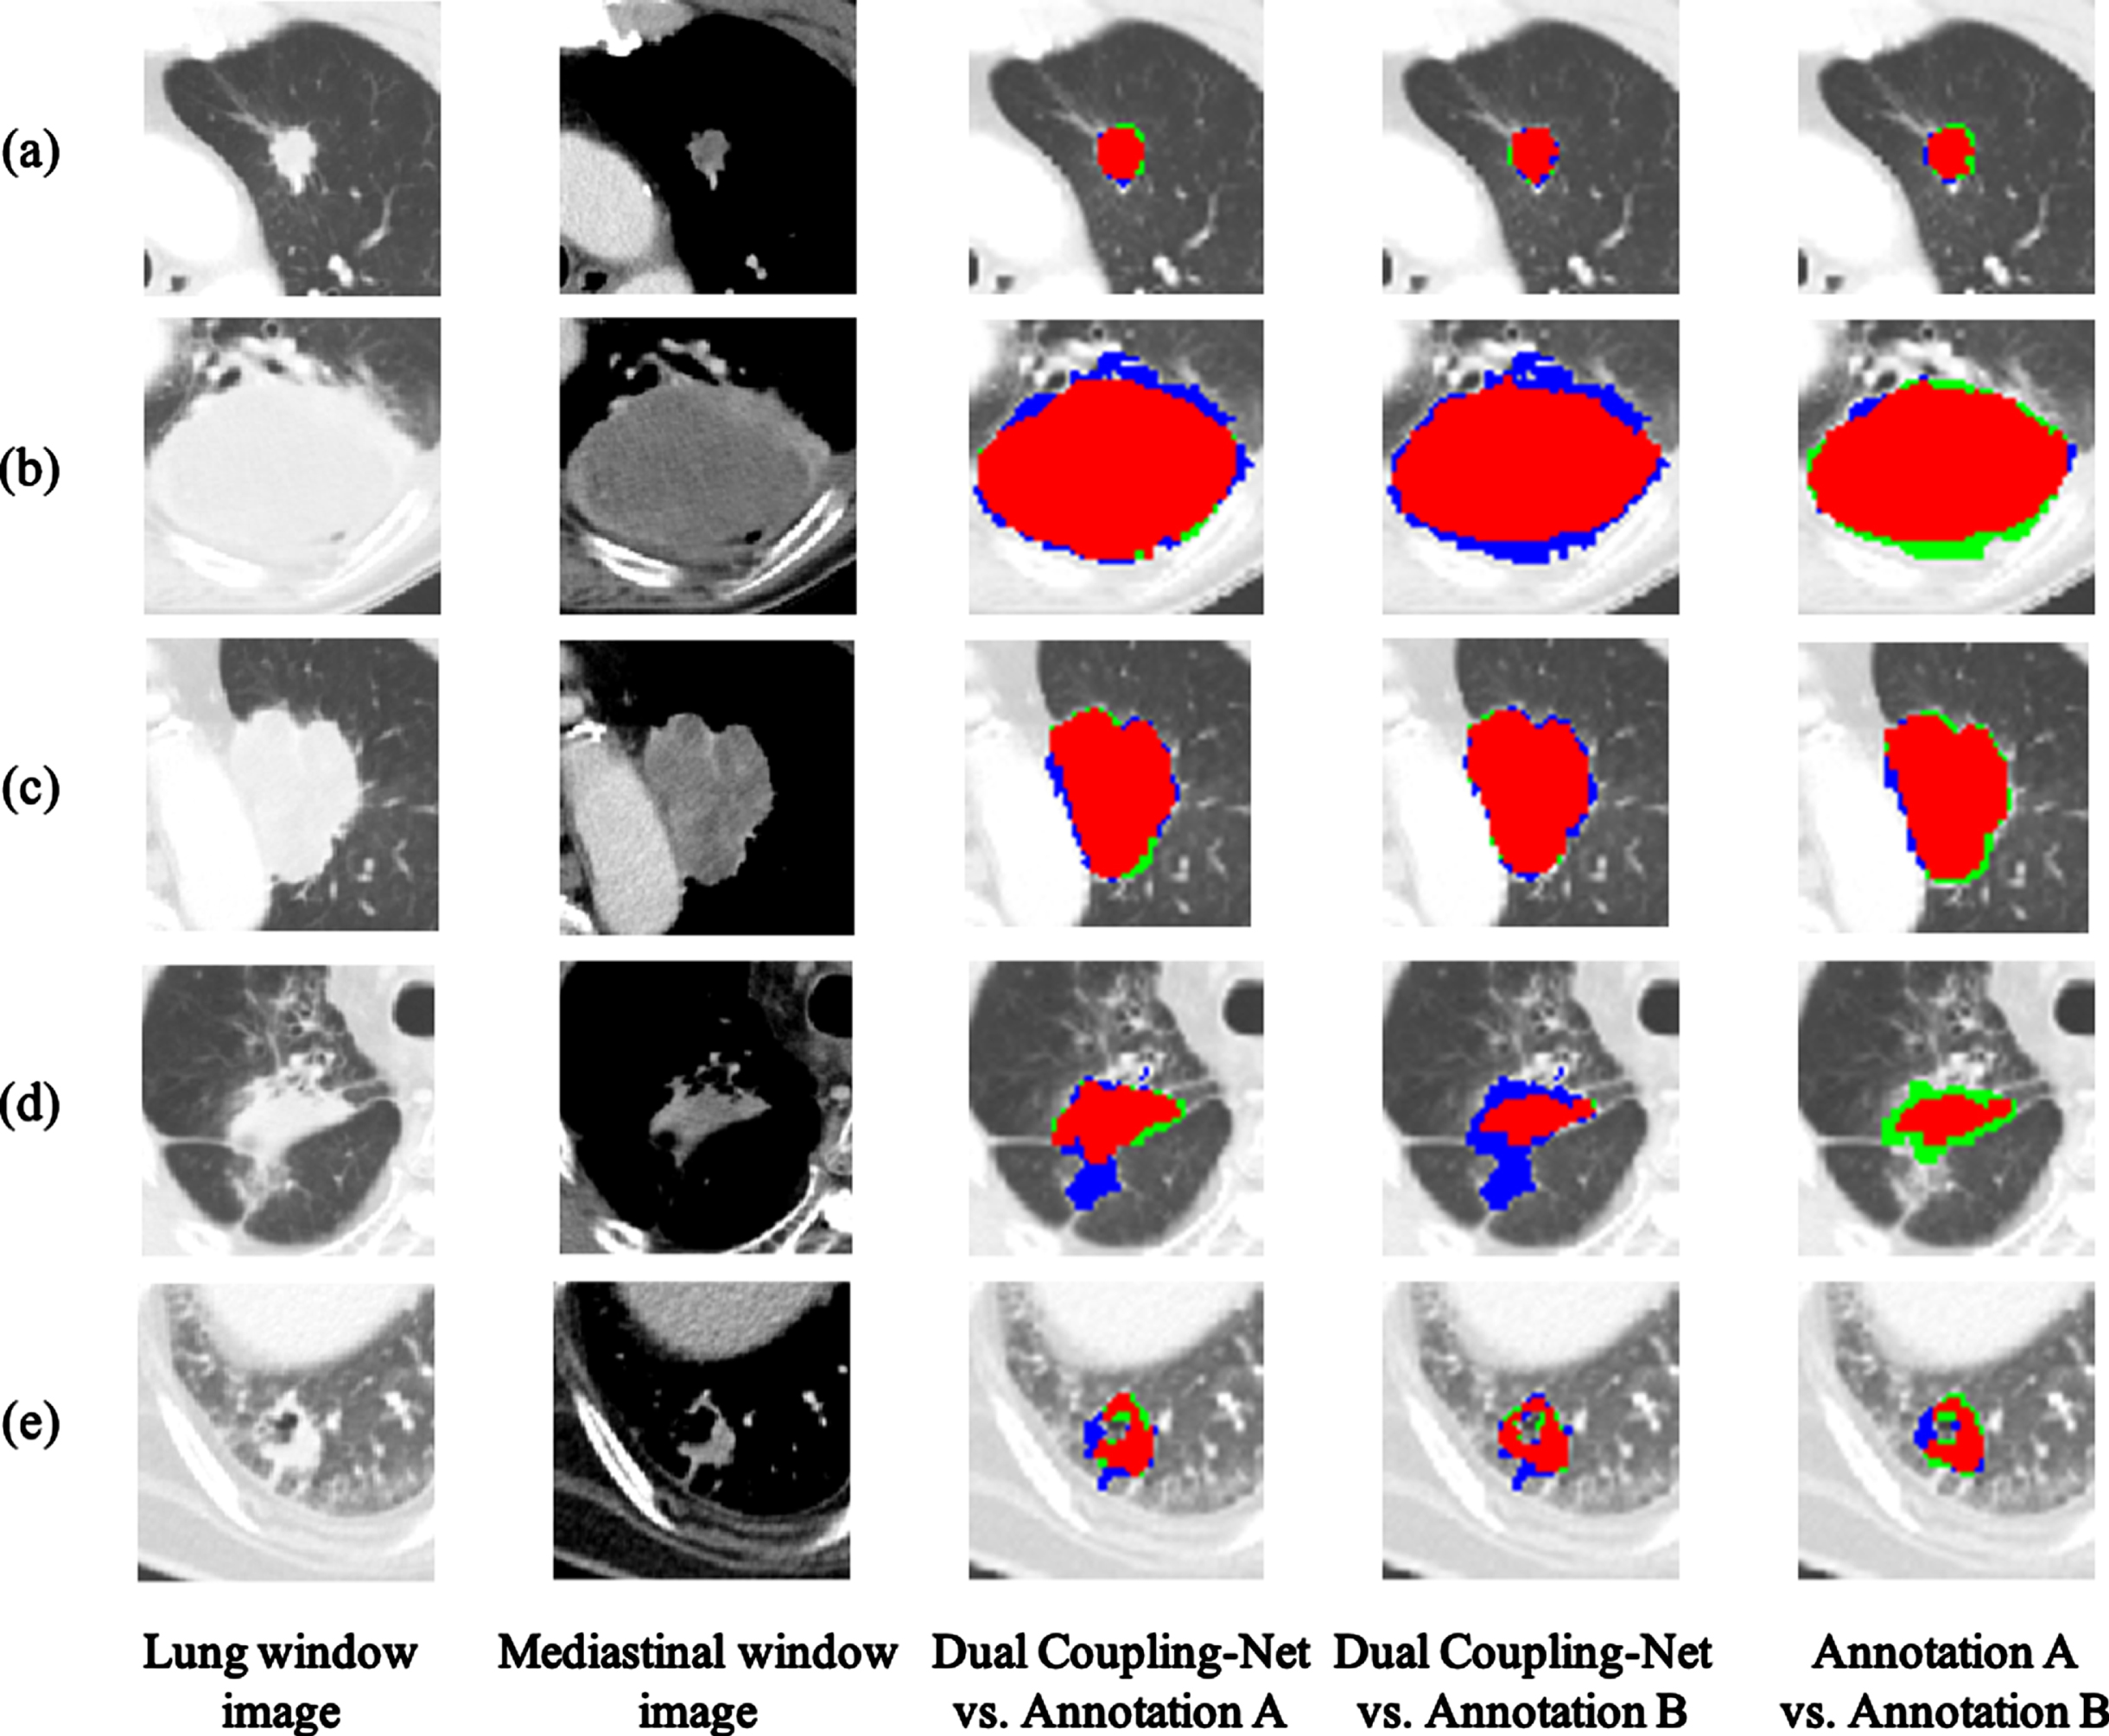
Segmentation results for various types of lung tumors in the second dataset. (a) isolated tumor (type 1), (b) chest wall-attached tumor (type 2), (c) mediastinum-attached tumor (type 3), (d) surrounded-tumor by chest wall at the apex of lung (type 4), (e) surrounded-tumor by liver and chest wall at the base of lung (type 4). (Red: overlapping areas with expert annotation, Green: under-segmented areas, Blue: over-segmented areas.).
Table 5 shows the segmentation performance according to the DSC, accuracy, sensitivity, and specificity factors. The performance of dual-coupling net was 70.97% on the average DSC, which is 4.73% p lower than the segmentation performance of the first dataset. This arose due to many annotations leaking into adjacent structures, such as bones and pulmonary vessels. Table 6 shows the segmentation performance according to the lung tumor type by DSC. The trends for types 2, 3, and 4 in the third dataset were similar to those in the first and second datasets. The lowest segmentation performance of type 1 arose because this type was annotated with lung tumors up to the barely visible ground-glass opacity area.
Performance evaluation of lung tumor segmentation according to annotations for third dataset
Performance evaluation of lung tumor segmentation according to annotations for third dataset
Performance evaluation of lung tumor segmentation according to lung tumor types for third dataset
In this paper, we proposed a dual-coupling net, which can accurately segment lung tumors of various locations and shapes in chest CT images. Unlike conventional 2D-based tumor segmentation studies that use only axial plane images, the proposed method requires additional time to train using additional coronal and sagittal plane images. However, by considering the coronal and sagittal planes as well as the axial plane, the shape information of lung tumors could be extracted more accurately compared to when only a single cross-sectional image is considered. By considering the image of the mediastinum window as well as the lung window image, it was possible to distinguish lung tumors from the thoracic region as well as to separate the boundaries of the lung tumors well from adjacent structures such as the mediastinum, chest wall, and pulmonary vessels. By providing a shape prior to a 3D-Net, dual-coupling net prevented outliers to adjacent structures and enabled accurate lung tumor segmentation regardless of the size, shape, location, and/or lung tumor type. In dual-coupling net, which considers lung and mediastinal window images, the recorded segmentation performance outcomes were 75.70%, 67.73%, 65.07%, and 70.97% for the DSCs in the first, second with annotation A, second with annotation B and third datasets, respectively.
Through a total of three experiments using internal hospital data and external public data, we were able to discover several issues in each experiment. In the first experiment, the radiologist assigned to the first dataset annotated lung tumors in both the lung and mediastinal window images, and dual-coupling net trained with these two different window image annotations underwent five-fold cross-validation. Dual coupling-net showed improved performance compared to 2D-Net, 2.5D-Net, 3D-Net, and single-coupling net, but there was a difference between the ground-truth and tumor segmentation areas, including the ground-glass opacity. As shown in Fig. 10, the ground truth of lung tumors with ground-glass opacity was widely defined, but dual-coupling net predicted a rather clear area. Therefore, for lung tumors with ground-glass opacity, the segmentation performance was low due to inconsistencies in the ground-glass opacity areas.
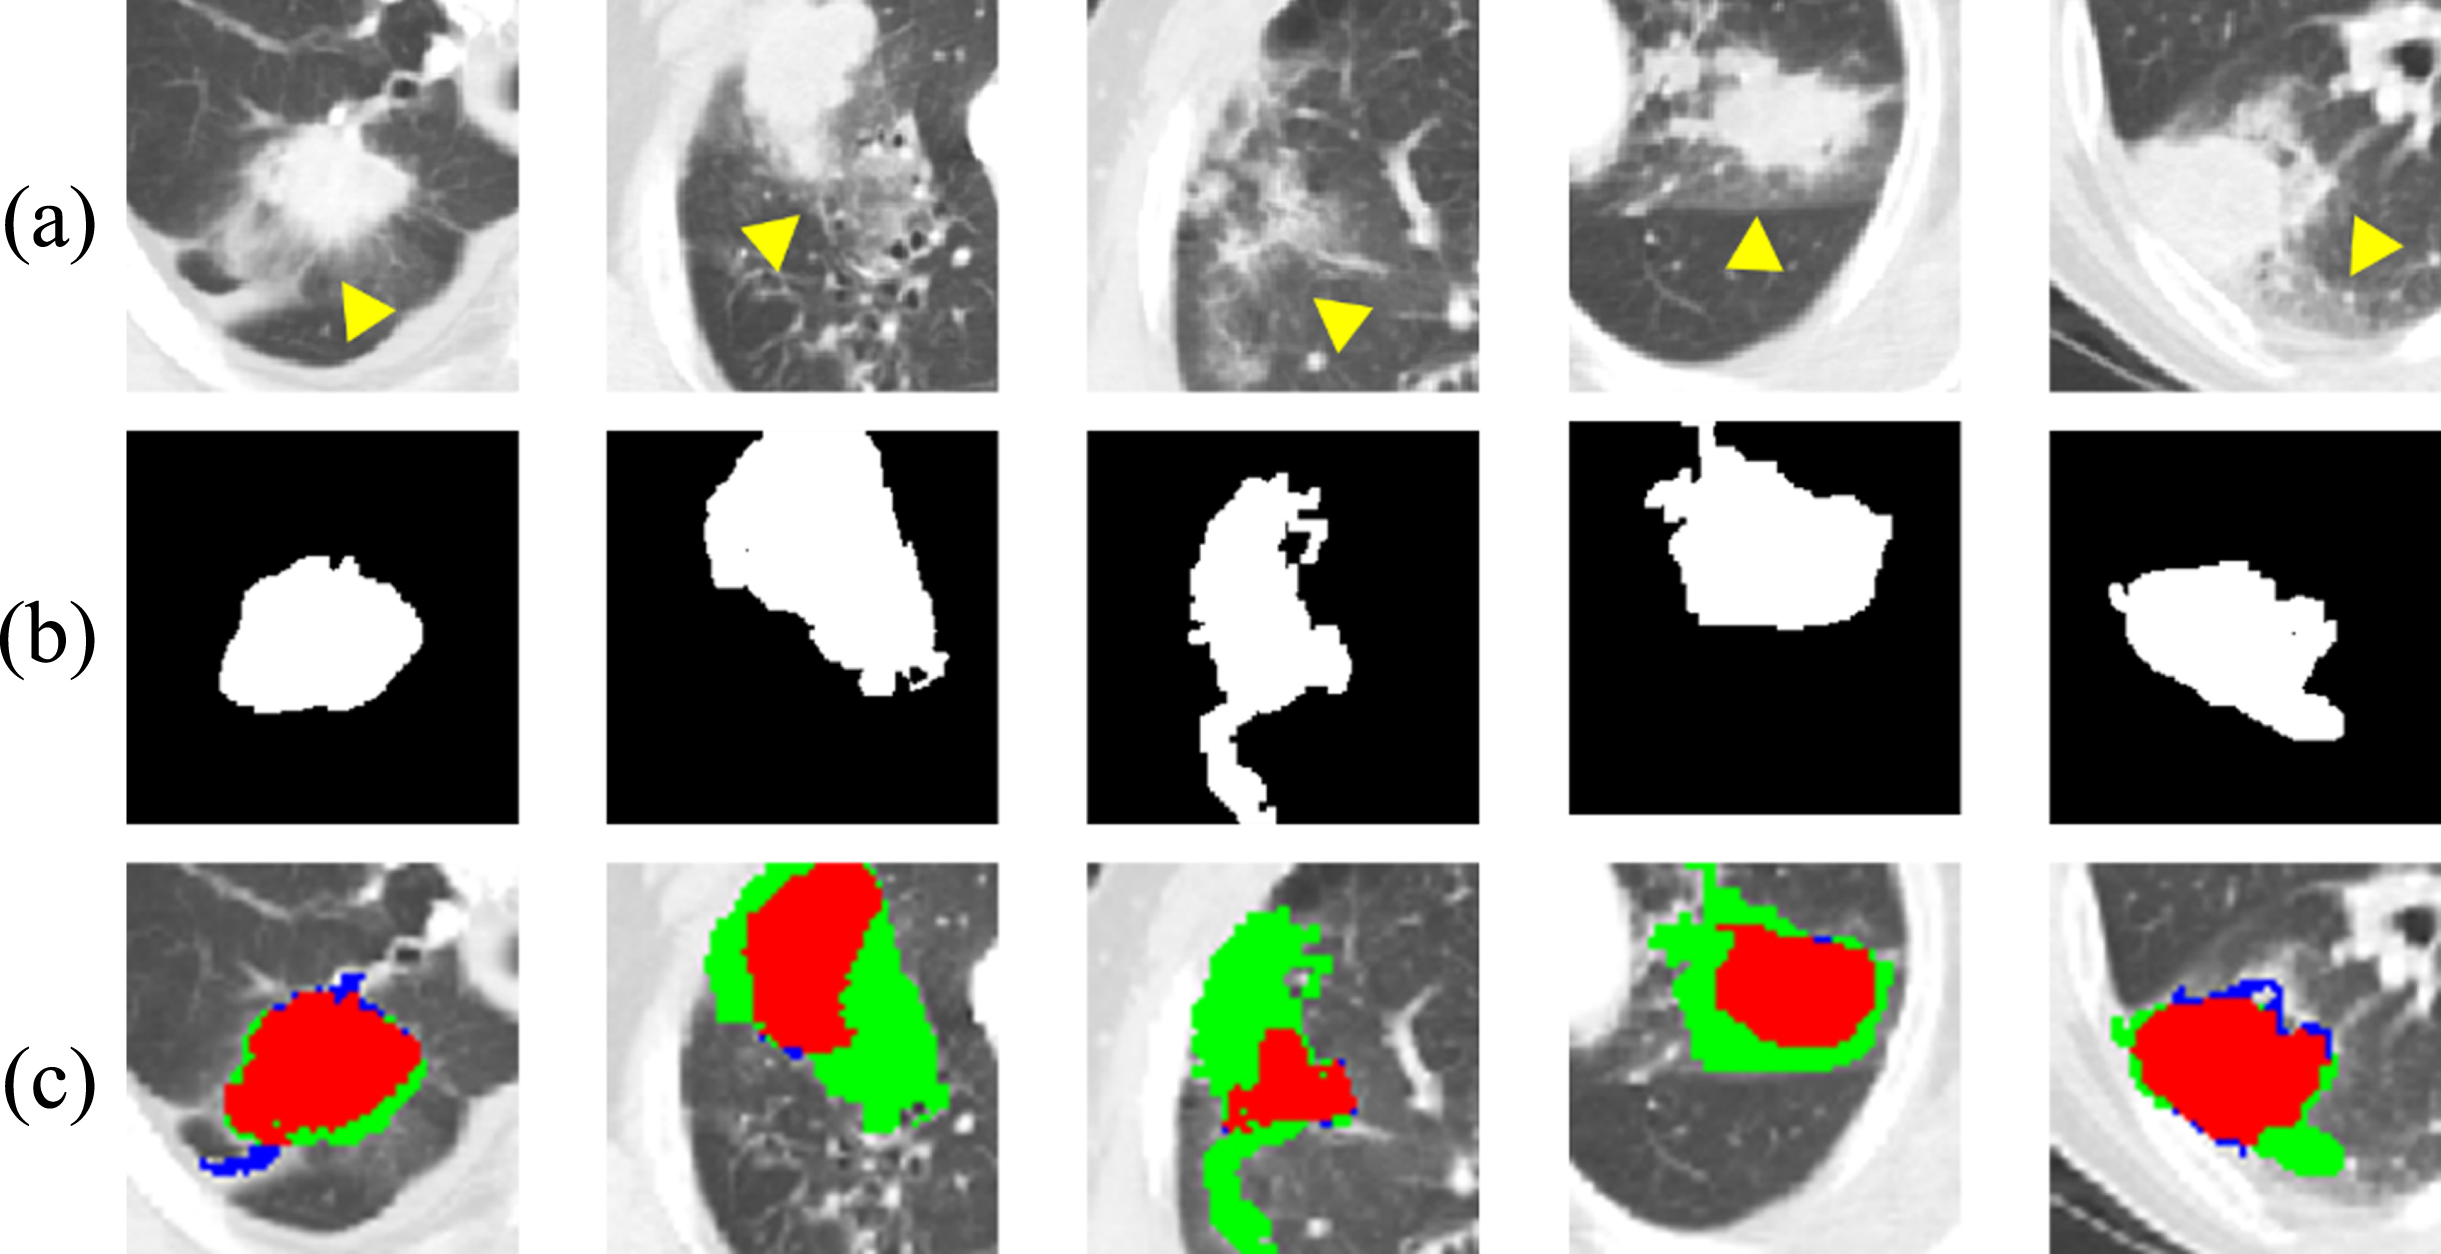
Example images of segmentation results of lung tumors with ground-glass opacity (a) lung window images, (b) ground-truth of lung tumors, (c) lung tumor segmentation results (Red: overlapping areas with ground-truth, Green: under-segmented areas, Blue: over-segmented areas, Yellow arrowheads indicate ground-glass opacity.).
In the second experiment, first, two radiologists annotated the lung tumors by setting the same annotation criteria for the lung window image without reference to the pathological image. The mean intra-class correlation coefficient (ICC) value between the two radiologists was as high as 99.6% excluding four cases, as shown in Fig. 11. The reason for the exclusion from the segmentation performance evaluation in these four cases was that it was difficult to use these as the ground truth due to the low agreement between the two radiologists, and it was found that a large difference occurred in the radiologists’ annotations when lung tumors were attached to the mediastinum. Second, the second dataset contained 52% non-contrast-enhanced CT images, representing many non-contrast-enhanced images compared to the first dataset, which contained 6% non-contrast-enhanced CT images. This showed that non-contrast-enhanced images in the mediastinal window setting reduced the overall segmentation performance due to the unclear boundary between the lung tumor and the surrounding structures, similar to the lung window images.
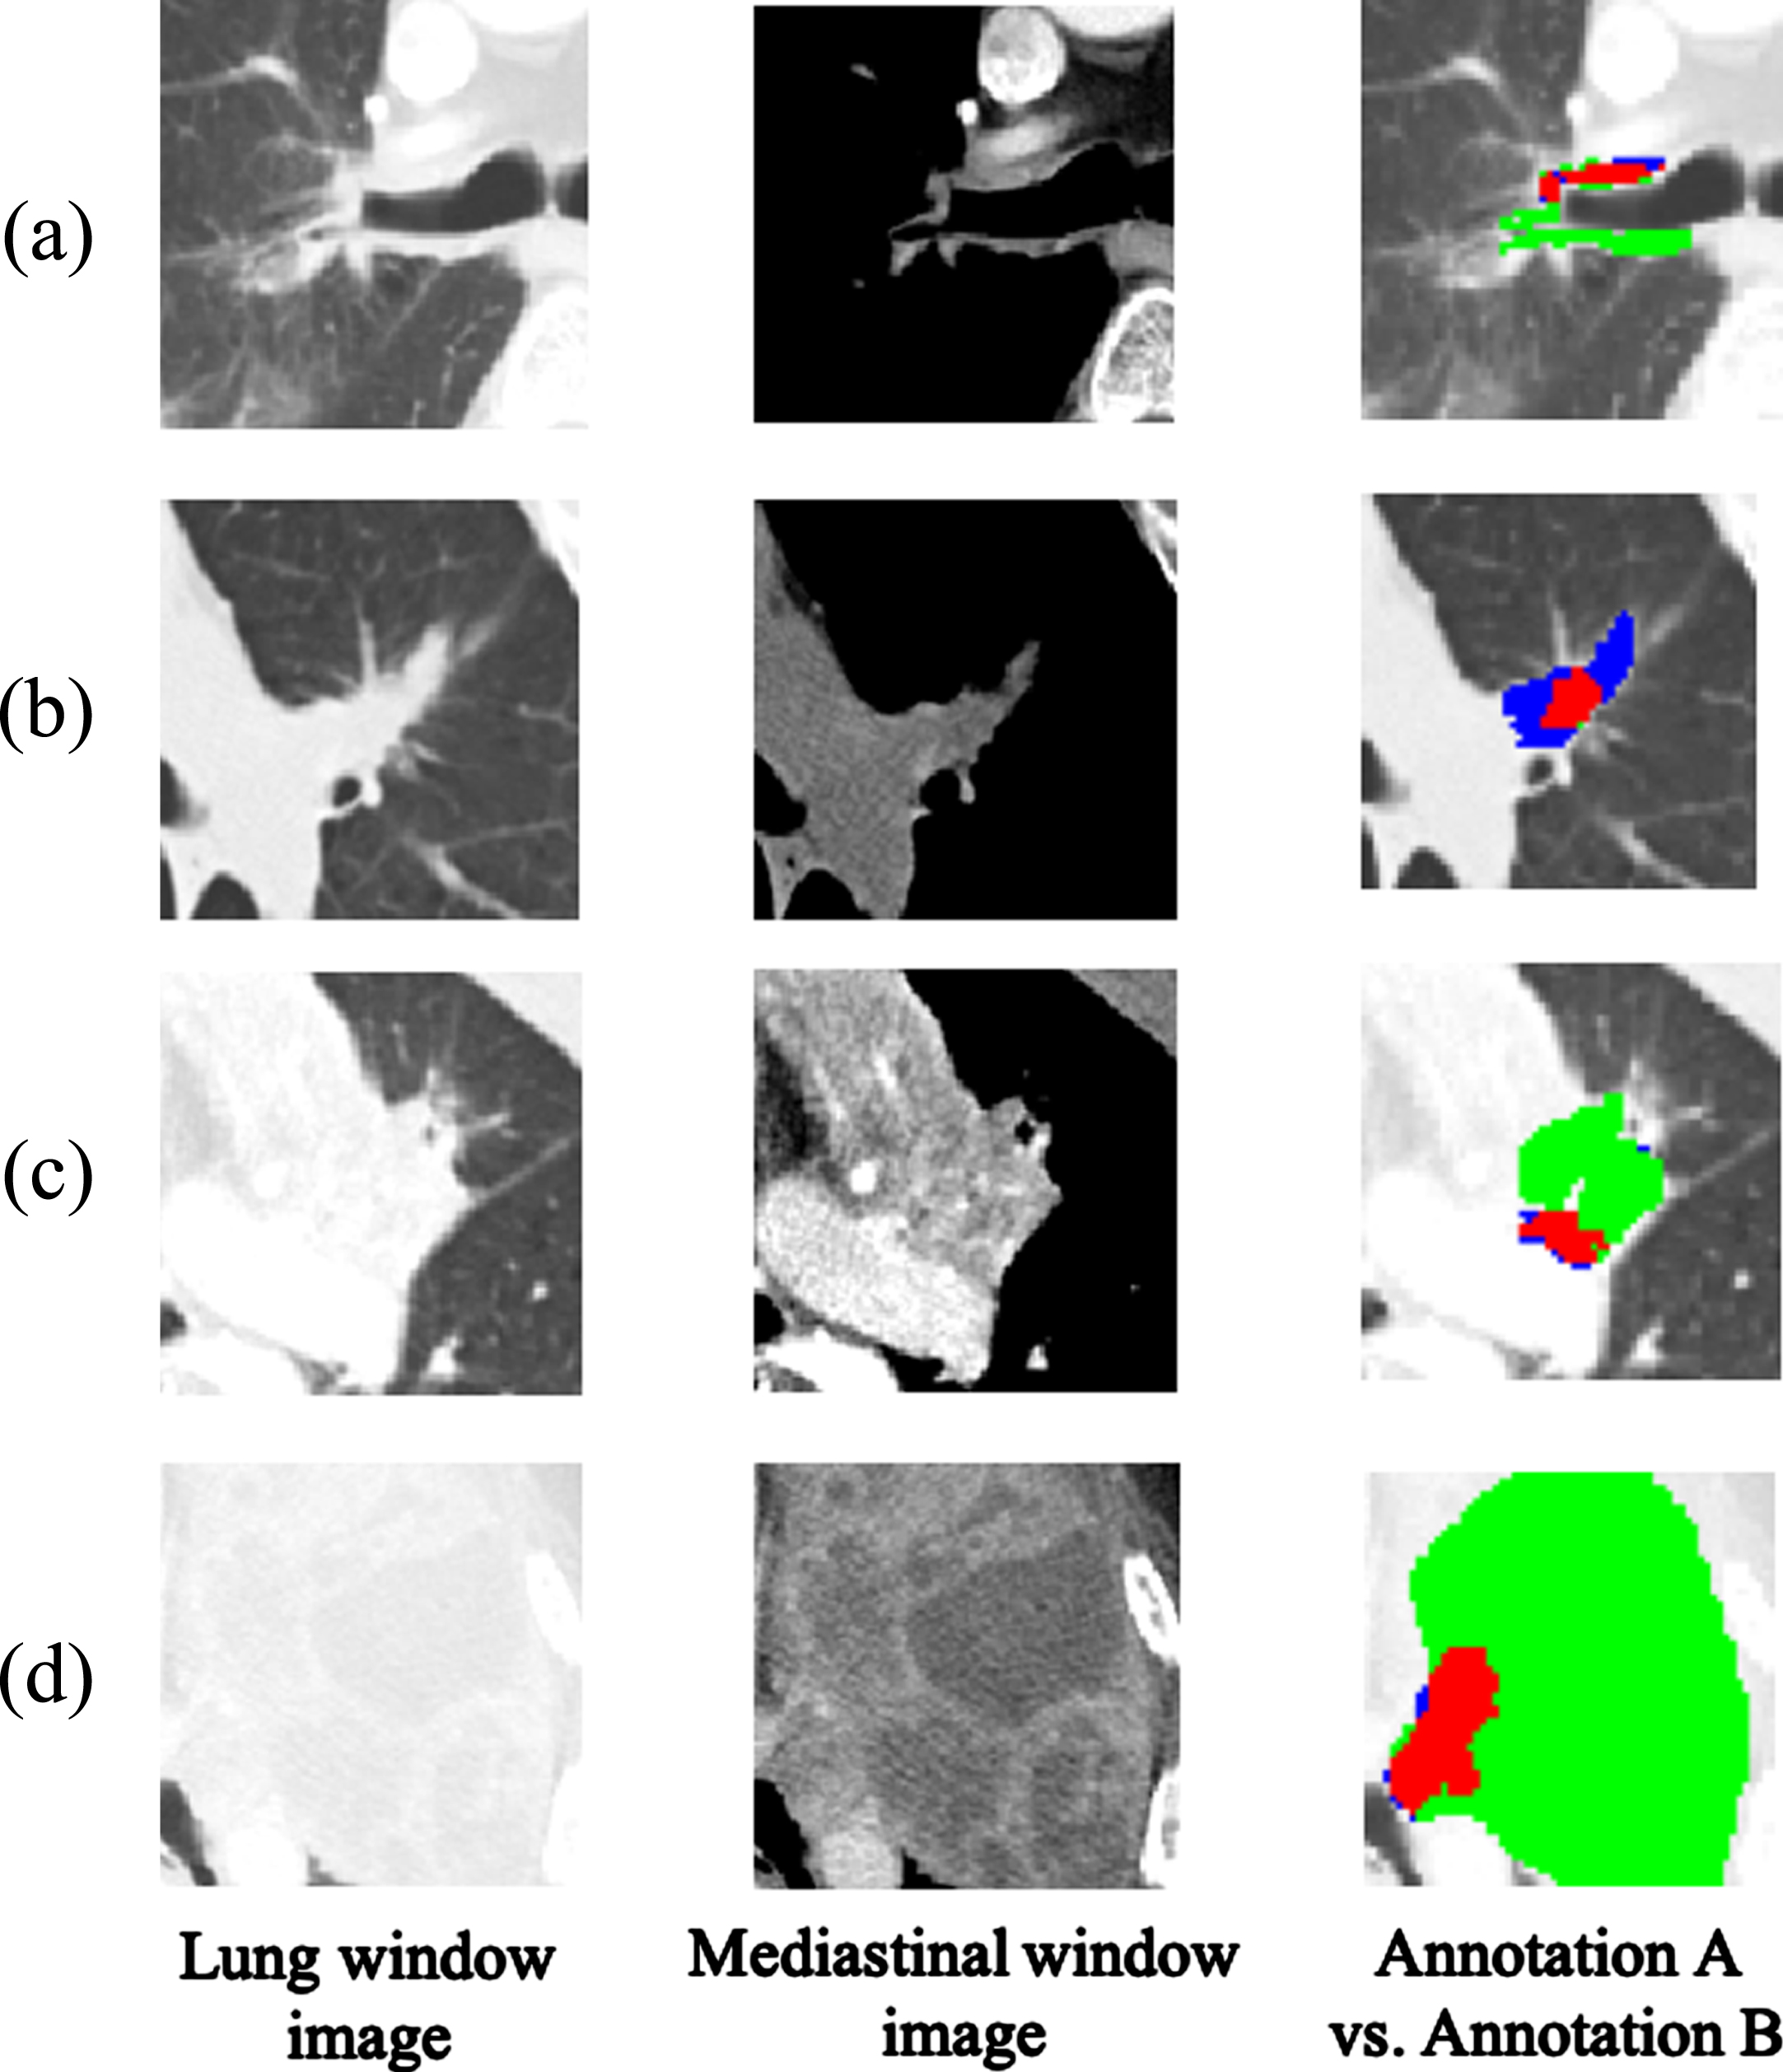
Example images of lung tumors with a difference between annotation A and annotation B: (a) lung tumor near the main bronchus, (b) lung tumors combined with nodular, (c) lung tumors with effusion, (d) lung tumors with necrosis mass (Red: overlapping areas with annotation A, Green: under-segmented areas, Blue: over-segmented areas.).
In the third experiment, the segmentation performance was evaluated using the TCIA public dataset. As with the second dataset, dual-coupling net learning was performed using the first dataset because the third dataset does not provide a mask of the mediastinal window images. In the third dataset, over-labeled annotations arose in the airways, ribs, and main pulmonary arteries, as shown in Fig. 12, and pulmonary vessels attached to lung tumors and areas of necrosis were included as lung tumors. On the other hand, dual-coupling net was confirmed mainly to segment lung tumor areas without over-segmentation.
Example images of lung tumors with over-labeled annotation in the third dataset (a) over-labeled annotation in airway, (b) over-labeled annotation in rib, (c) over-labeled annotation in pulmonary artery, (d) over-labeled annotation in pulmonary vessel attached to lung tumor, (e) over-labeled annotation in necrosis inside lung tumor (Red: overlapping areas with ground-truth, Green: under-segmented areas, Blue: over-segmented areas. Yellow arrowheads indicate over-segmented annotation region).
Footnotes
Acknowledgments
We would like to thank Hoonil Oh of the Nowon Radiology Clinic who provided the annotations of the first dataset, and Eunju Lee, and Hyunjeong Yoon of the department of radiology from Veterans Health Service Medical Center who provided the annotations of the second dataset. In addition, we would like to thank Joomin Lee and Yoonjo Kim of the Seoul Women’s University for selecting the third datasets from the TCIA dataset and helping with the experiment. This research was supported by the Bio & Medical Technology Development Program of the National Research Foundation (NRF) funded by the Ministry of Science & ICT (2015-2015M3A9A7029725) and the National Research Foundation of Korea (NRF) grant funded by the Korea government (MSIT) (No. 2020R1A2C1102140).