
Abstract
Computerized segmentation of brain tumor based on magnetic resonance imaging (MRI) data presents an important challenging act in computer vision. In image segmentation, numerous studies have explored the feasibility and advantages of employing deep neural network methods to automatically detect and segment brain tumors depicting on MRI. For training the deeper neural network, the procedure usually requires extensive computational power and it is also very time-consuming due to the complexity and the gradient diffusion difficulty. In order to address and help solve this challenge, we in this study present an automatic approach for Glioblastoma brain tumor segmentation based on deep Residual Learning Network (ResNet) to get over the gradient problem of deep Convolutional Neural Networks (CNNs). Using the extra layers added to a deep neural network, ResNet algorithm can effectively improve the accuracy and the performance, which is useful in solving complex problems with a much rapid training process. An additional method is then proposed to fully automatically classify different brain tumor categories (necrosis, edema, and enhancing regions). Results confirm that the proposed fusion method (ResNet-SVM) has an increased classification results of accuracy (AC = 89.36%), specificity (SP = 92.52%) and precision (PR = 90.12%) using 260 MRI data for the training and 112 data used for testing and validation of Glioblastoma tumor cases. Compared to the state-of-the art methods, the proposed scheme provides a higher performance by identifying Glioblastoma tumor type.
Introduction
Glioblastoma multiforme (GBM) presents a violent type of primary brain tumor. The survival rate in 5-year is about 5.1% [1, 2]. 45% of main central nervous system tumors has achieved in this disease. The classical treatment of brain cancer disease, especially Glioblastoma, involves surgical resection ensued by radiation therapy and temozolomide chemotherapy. This allows enhancing the median survival during three months when compared to the application of single radiation therapy. In diagnosis process, preoperative delineation and therapy assessment of Glioblastoma tumor [3, 4], magnetic resonance imaging (MRI) remains a typical classic examination. A brain cancer is an anomalous cell regarding its growing within the brain or central spin canal [5]. 13.000 patients die per year and 29.000 ones undergo from five chief brain cancers in the United States of America. Dissimilar health condition, age and gender are current for each patient. Also, diverse tumor could seem anywhere in the human brain [6]. Through the enormous medical technology such as magnetic resonance imaging (MRI), computed tomography (CT), ultrasound (US), X-rays, positron emission tomography (PET) and even device recording, and the massive patients number worldwide, emerged the necessity to find novel methods for the treatment process. Besides, the diagnosis period plays a vital role regarding to the life-threatening pathologies of the patients like Gliomas tumors. As stated by the World Health Organization (WHO) categorization [7], these tumors have four grades. Gliomas disease affects children and adults between 5 and 10 years [8] and between 40 and 65 years, respectively [9]. Gliomas tumors denote 81% of all malignant brain tumors, and 45% of all main brain tumors [10]. Having a survival rate between 0.05% and 4.7% of patients affected by Gliomas tumors still hold to the subsequent reason of death [11]. In this paper, the proposed method is concerned with the segmentation of Glioblastomas cancer images; a sort of Gliomas brain tumors as shown in Fig. 1.
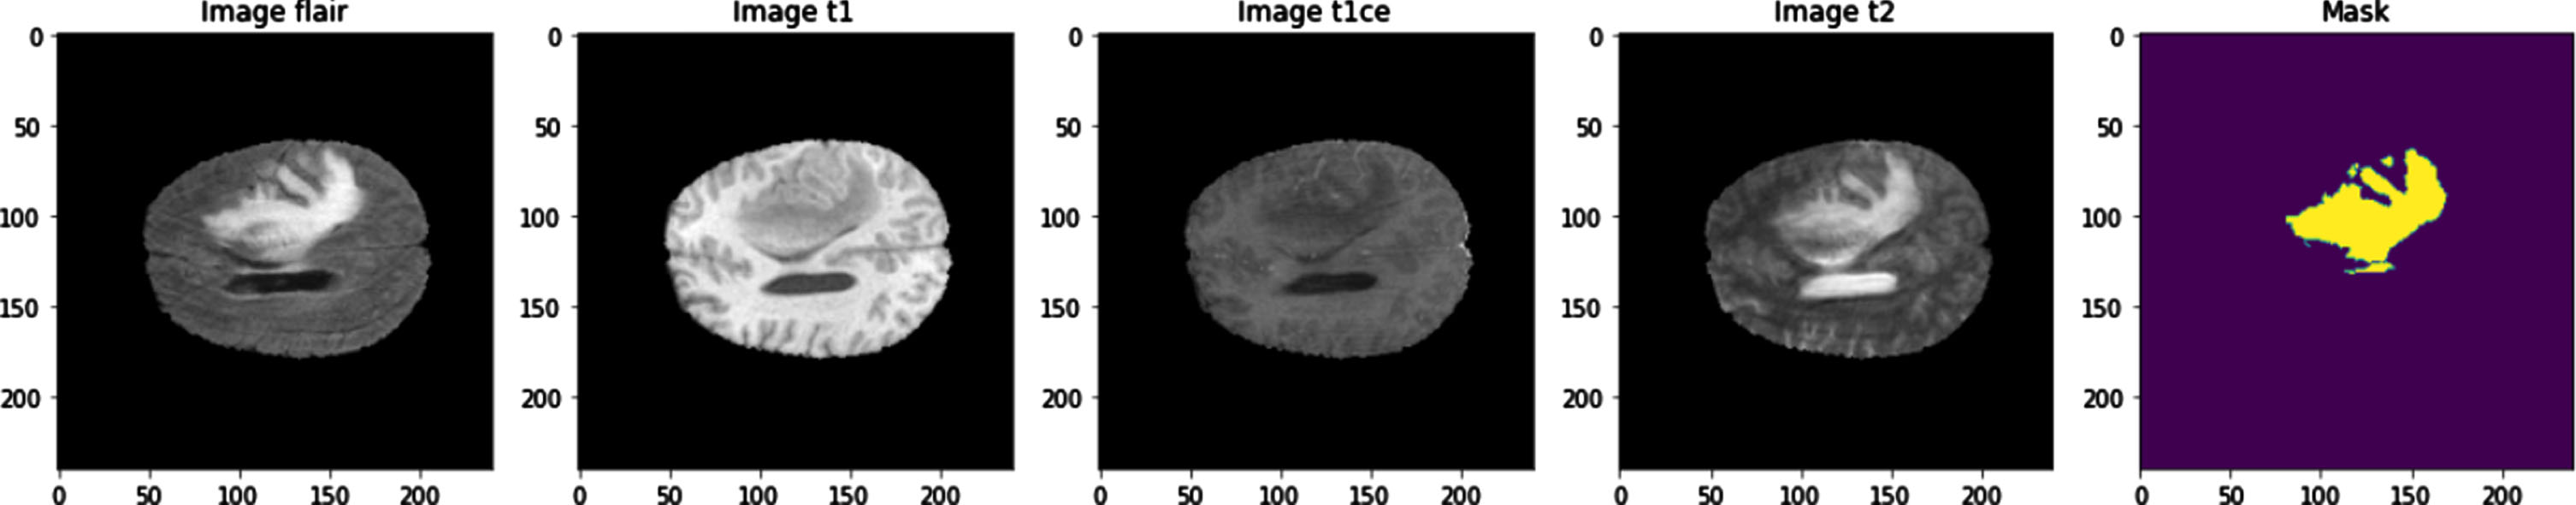
MRI image and its mask for different modalities.
In the past decades, consuming frequently attention from medical doctors, brain tumors appear from glial cell termed gliomas [12]. There are four grades in cancer brain examination. In the first and second grades, cancers are orderly classified as benign contrary to the third and the fourth grades that are classified to be a malignant brain tumor [13]. MRI is an eminent medical quality amongst further modalities to evaluate brain tumors. Its performance in recognizing brain soft tissues highly aid experts in their examinations [14]. Four MRI images types are as follow: T1-weighted (T1 w), T1-weighted with contrast enhancement (T1wc), T2-weighted (T2 w), and Fluid-Attenuated Inversion Recovery (FLAIR). T1-weighted (T1 w) is generally employed to designate the healthy tissues. For tumor identification, T1wc and T2 w contains respectively bright tumors border and bright tumor regions. Moreover, in order to isolate edema district from cerebrospinal fluid (CSF), FLAIR image is compelling [15]. US, CT and MRI are the greatest used medical imaging modalities for cancerous lesions examination. MRI still the forceful imaging technique to recognize the tumorous tissue. Despite the MRI efficiency, in some intricated situation, qualified radiologists require to aggressive procedures to emphasize their diagnosis.
Artificial intelligence methods [16, 17] have implication in various research studies for finest characterization of the brain tumor. Regarding brain tumor detection, different approaches are realized including watershed transform, region-based methods and machine learning and deep learning methods. An overview of traditional and current methods will be given in the following sections by discussing their differences and challenges. We particularly deliberate modern methods such methods-based deep learning. A summary of the major challenging issues of deep learning approaches through Glioblastoma multiforme brain tumor segmentation will be introduced in the next section.
In MRI images, delineation of tumor limits is hard since tumors hurt in homogeneity as well as to diverse intensity among the same sequences [18]. CNN strategies have been exploited in multi-modal MRI application for brain tumor segmentation. The CNN method is an innovative procedure by combining two important feature extraction and classification process within an only bloc. In the work of Pereira et al., [19], an automated deep CNN construction by small 3×3 convolutional kernels are projected to evidently segment tumors regions using MRI images. The authors employed small filter kernels to obtain deeper CNNs and cascade additional convolutional layers presenting the identical responsive field of bigger kernels. Havaei et al. [20] used a composite architecture contains of parallel branches and two cascaded CNNs. These CNN models [19, 20] are patch-focused techniques for pixel labeling and classification of the patch centered by this pixel. The redundancy owing to the overlapping between small patches is the most weaknesses of these methods [20, 21]. Besides, vanishing gradient presents a hard task in the training process of CNN systems.
Recent segmentation approaches are projected to surmount the redundancy difficulty of CNN techniques via assigning each pixel with a class label [22]. A Fully Convolutional Network (FCN) is improved from the CNN architecture. Every local block in image is classified in a U-shaped construction based on paths contracting and expanding. This method necessitates big training images for yielding exact segmentation that is incompleted by GPU memory [23]. Kermi et al., [24] proposed a comparable model to U-net architecture enhancing then the layers of contracting and expanding paths. The authors proposed to employ a residual block instead of convolutional block in the original U-shaped FCN [25]. Two convolution units integrating a Batch Normalization (BN) layer and a Parametric Rectified Linear Unit (PReLU) activation function are used in each block. Nevertheless, these methods improve the segmentation results, but the problem of excessive pixel-wise computation time persists [24].
In the work of Zikic et al., [26], CNNs architecture is applied for the GBM brain tumors segmentation using MRI images. The input of this method is a (4*19*19) 2D patch corresponds to four channels: T1, T2, T1c, and FLAIR. The segmentation of MRI images focused on CNNs network in separated to five categories: non-tumor, necrosis, edema, non-enhancing tumor and enhancing tumor. Also, Wang et al., [27] proposed an enhanced method based on CNNs in order to segment GBM brain tumor. The authors proposed a consecutive 3D-CNNs architecture. The size of the 3D patches input data is (9*9*9) voxels through four channels (i.e., T1, T1c, T2, FLAIR). They used a morphological filter to remove isolated regions in the last implemented phase in the proposed algorithm. This method takes ten minutes for the whole brain segmentation employing a GPU implementation. The pooling layers is not used in this model to decrease the size of feature maps and consequently, the computational costs. Furthermore, an extra post-processing stage is used where they eliminated all regions of less than 3000 voxels. GBM brain tumor segmentation method focused on CNNs is developed by Pereira et al. [19]. Two CNNs architectures are applied in this work depending on Glioblastoma’s type: High-Grade HGG and Low-Grade LGG. The authors used inputs 2D patches of size (33*33) pixels and four MRI sequences: T1, T2, T1c, and FLAIR.
Because of the deep learning systems requires great data sets, these architectures can provide precise models even with somewhat little database. An improved wholly Convolutional Neural Network notion (CNN) is got via the U-Net model [28] through CNN layers presented by up-sampling process. This study puts in residual networks (ResNets) in order to resolve the CNN problems, Fully Conventional Networks (FCN) procedures also to improve the computation time. The notion of ResNets is focused on adding between the layer output and input. This modest change advances the deep networks training while they possess shortcut connections parallel to their usual convolutional layers [29–31]. These shortcuts are continually alive having effortlessly gradients propagation. This allows us to obtain an important result with high up precision and rapidly training from noticeably augmented depth. It is clear that the motivation to select the hybrid segmentation and classification models is highly important act. In fact, classical methods of attitudinal segmentation or classification yield interesting clusters that are not chiefly valuable. Targeting techniques produce groups associated to an objective, and consequently beneficial, nonetheless they lack depth and are not interesting. Hybrid bloc for segmentation and classification task that produces segments are both fascinating and actionable. In this paper, we proposed a computerized method focused on two deep neural networks-based U-Net and SegNet architectures [32] for successfully handling the segmentation problems of brain tumor images.
The U-net and Seg-net constructions are two significant deep learning techniques supplying simpler models known as convolutional networks in order to rise in effectiveness as pertinent implementation of predicted segmentation learning process. By choosing progressively further representations from the layers, this learning displays a multilevel construction layer by-layer. The gradient problem; which can happen while training a standard neural network without pre-initialization; is typically avoided by the CNN Encoder-Decoder architecture.
The proposed contribution is divided into two folds. A fully ResNet is firstly trained in order to demonstrate the flexibility to complicated Glioblastoma brain tumor lesions segmentation. Using MRI dataset, a valuable segmentation is process is greatly enhanced in various preceding work from the state of the art. To automatically identify tumor type of the brain images, this work reports these outcomes and explains a classification scheme based on the supervised support vector machine (SVM) method. The superiority of this work is highlighted by the use of hybrid approach (ResNet and SVM) from three tumor categories (necrosis, edema, and enhancing regions) in order to recognize tumor type from ordinary cases. Using several experimentations, performance analysis system is accomplished by the means of accuracy and extra statistical measures.
The paper is organized as follows: Section 2 describes the proposed segmentation and classification model of Glioblastoma tumor, Section 3 deals with results and discussion of the methodology and Section 4 is dedicated to the conclusion section.
Data description
In this work, an overall of 372 Glioblastoma tumor images including (T1, T1c, T2, and Flair image sequence) collected from diverse MRI machines. The used data sets include three different tumor categories: 127 necrosis (N), 125 edema (E) and 120 enhanced tumor region (EN). The considered MRI data were collected from Brats 2020 dataset [51]. We have used the Neuroimaging Informatics Technology Initiative (NIfTI) image format from 3D MRI slices. The size of the used data is 240×240×155 pixels with a sample rate of 1mm3/voxel, were manually marked by four radiologists. The used PC for these computations has Intel Core i7-7200U CPU –8 GB RAM. Figure 2 reveals examples of the used MRI dataset in different directions: coronal, sagittal and axial.
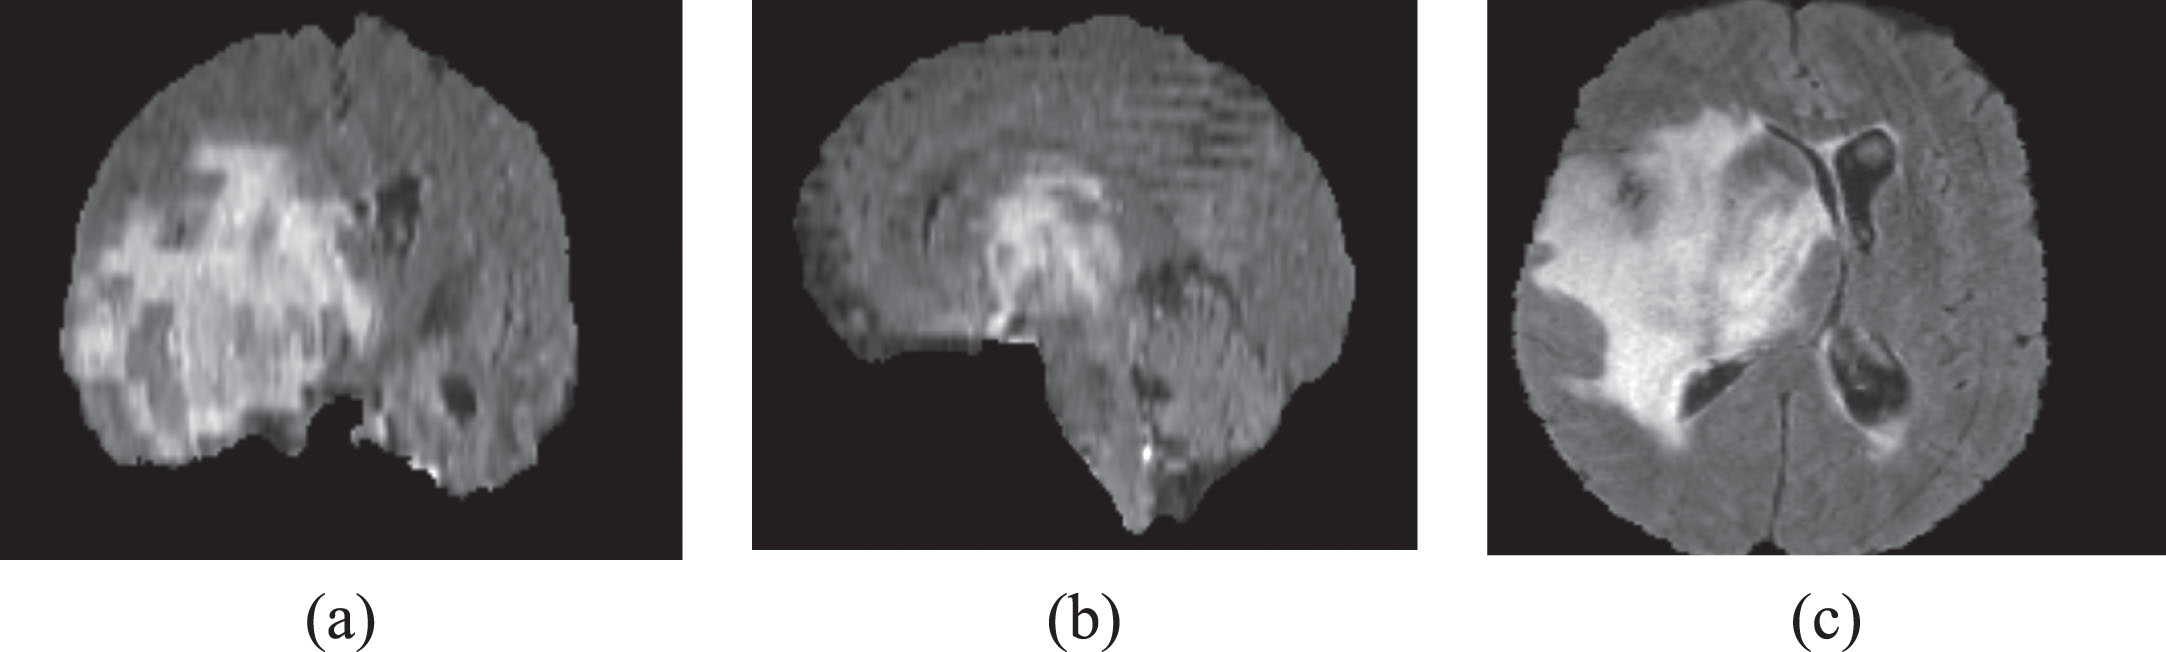
An example of the MRI database: (a) coronal, (b) sagittal and (c) axial directions.
Deep Neural Networks (DNN) are extremely efficacious methods for the automatic extraction of full brain tumor and intra-tumor region. Using Convolutional Neural Network (CNN) from small patches or using Fully Convolutional Networks (FCN) from the whole image, the brain tumor segmentation is extracted. The chief change between these two networks is in view FCN bloc that consists of convolutional layers without any fully connected layers.
In image processing field [37], Convolutional Neural Network (CNN) model is highly employed in brain tumor segmentation because it is focused on the network architecture design rather than extract features. In the work of Pereira et al. [19, 38], the CNN model is used in order to effectively segment the brain tumor regions using MRI images. Small 3×3 convolutional kernels and stack more convolutional layers instead of bigger 5×5 kernels are used in this method. The authors prove that they obtain the similar responsive field of one layer with bigger kernels when they used cascaded convolutional layers with small kernels. As revealed in Fig. 3, the CNN architecture [37]; containing three convolutional layers tracked by 2×2 Max Pooling layer and lastly three FC layers; is used in this work.
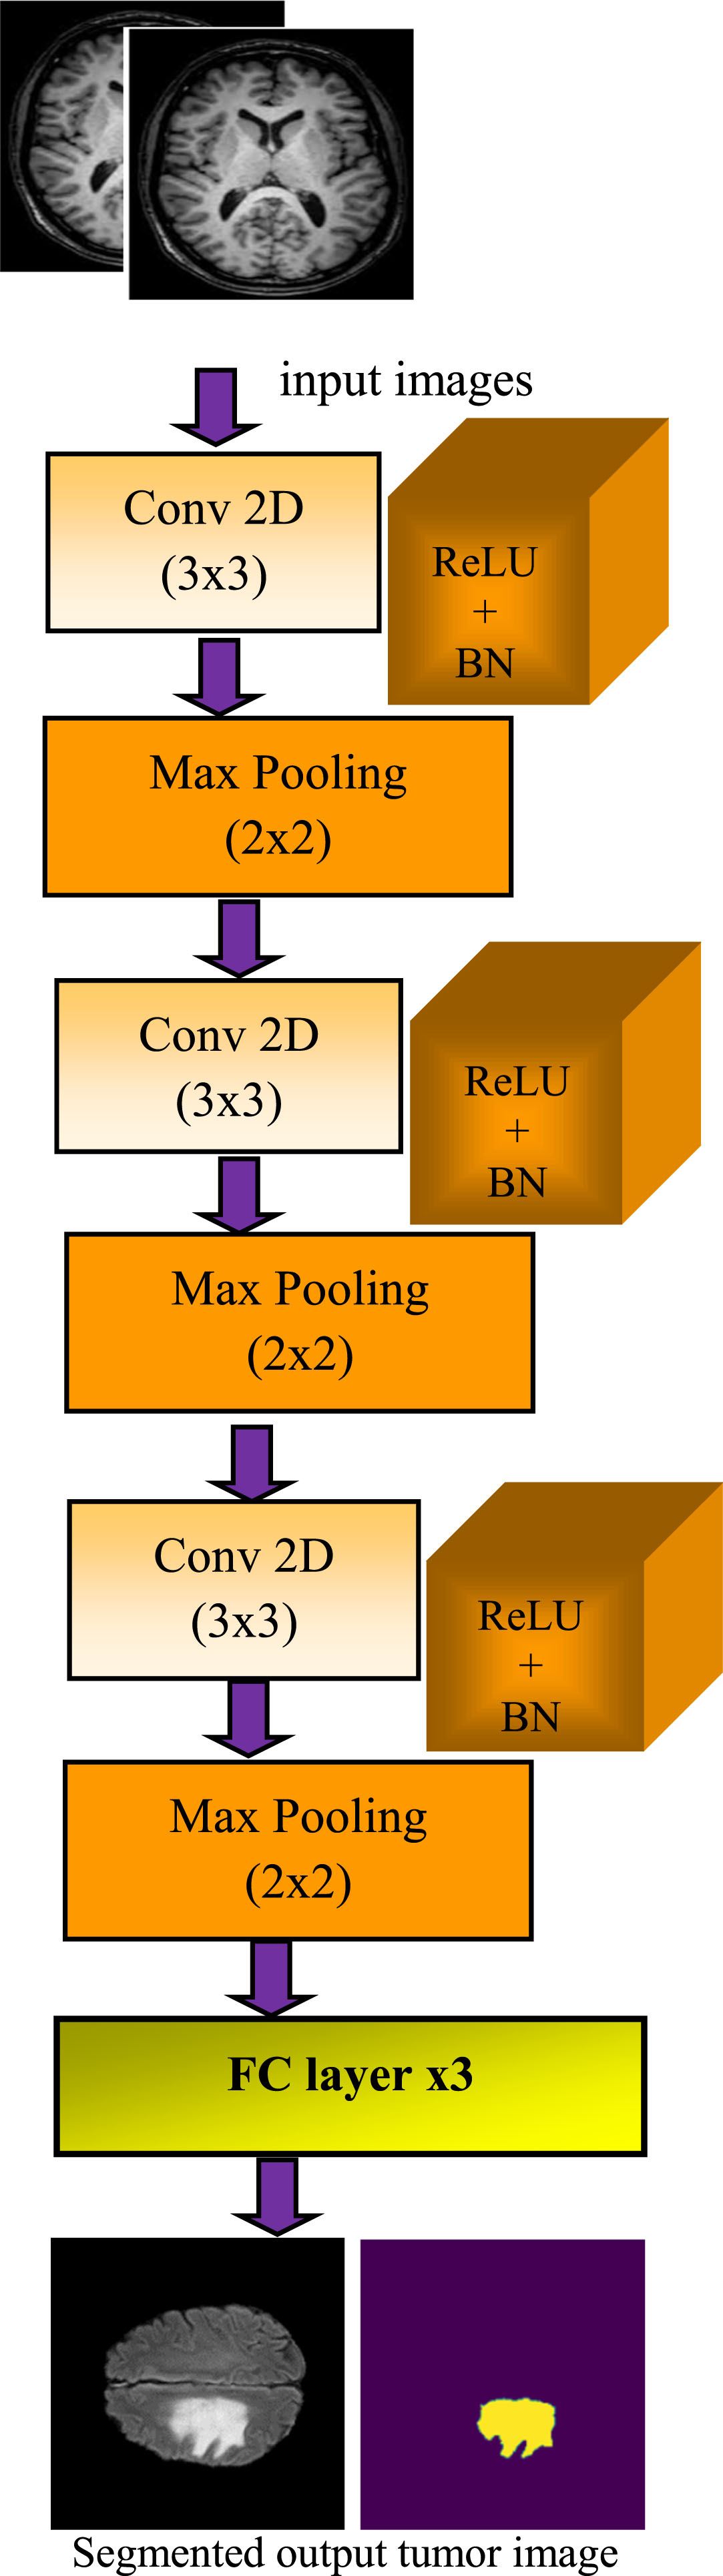
Automated CNN segmentation method.
The Convolutional Layer; is a filter band. Each
Batch Normalization is applied to decrease the internal covariate shift in activation function using a normalization through subtracting the batch mean and dividing by the standard deviation of the batch [39].
In the max-pooling layer resolution of the features in the convolutional layer is reduced in order to yield spatial invariance. It applies local pooling of feature maps using a max operation in the neighboring of the convolutional layer result.
In the FC layer, softmax classifier is used to generalize logistic regression and it is given by:
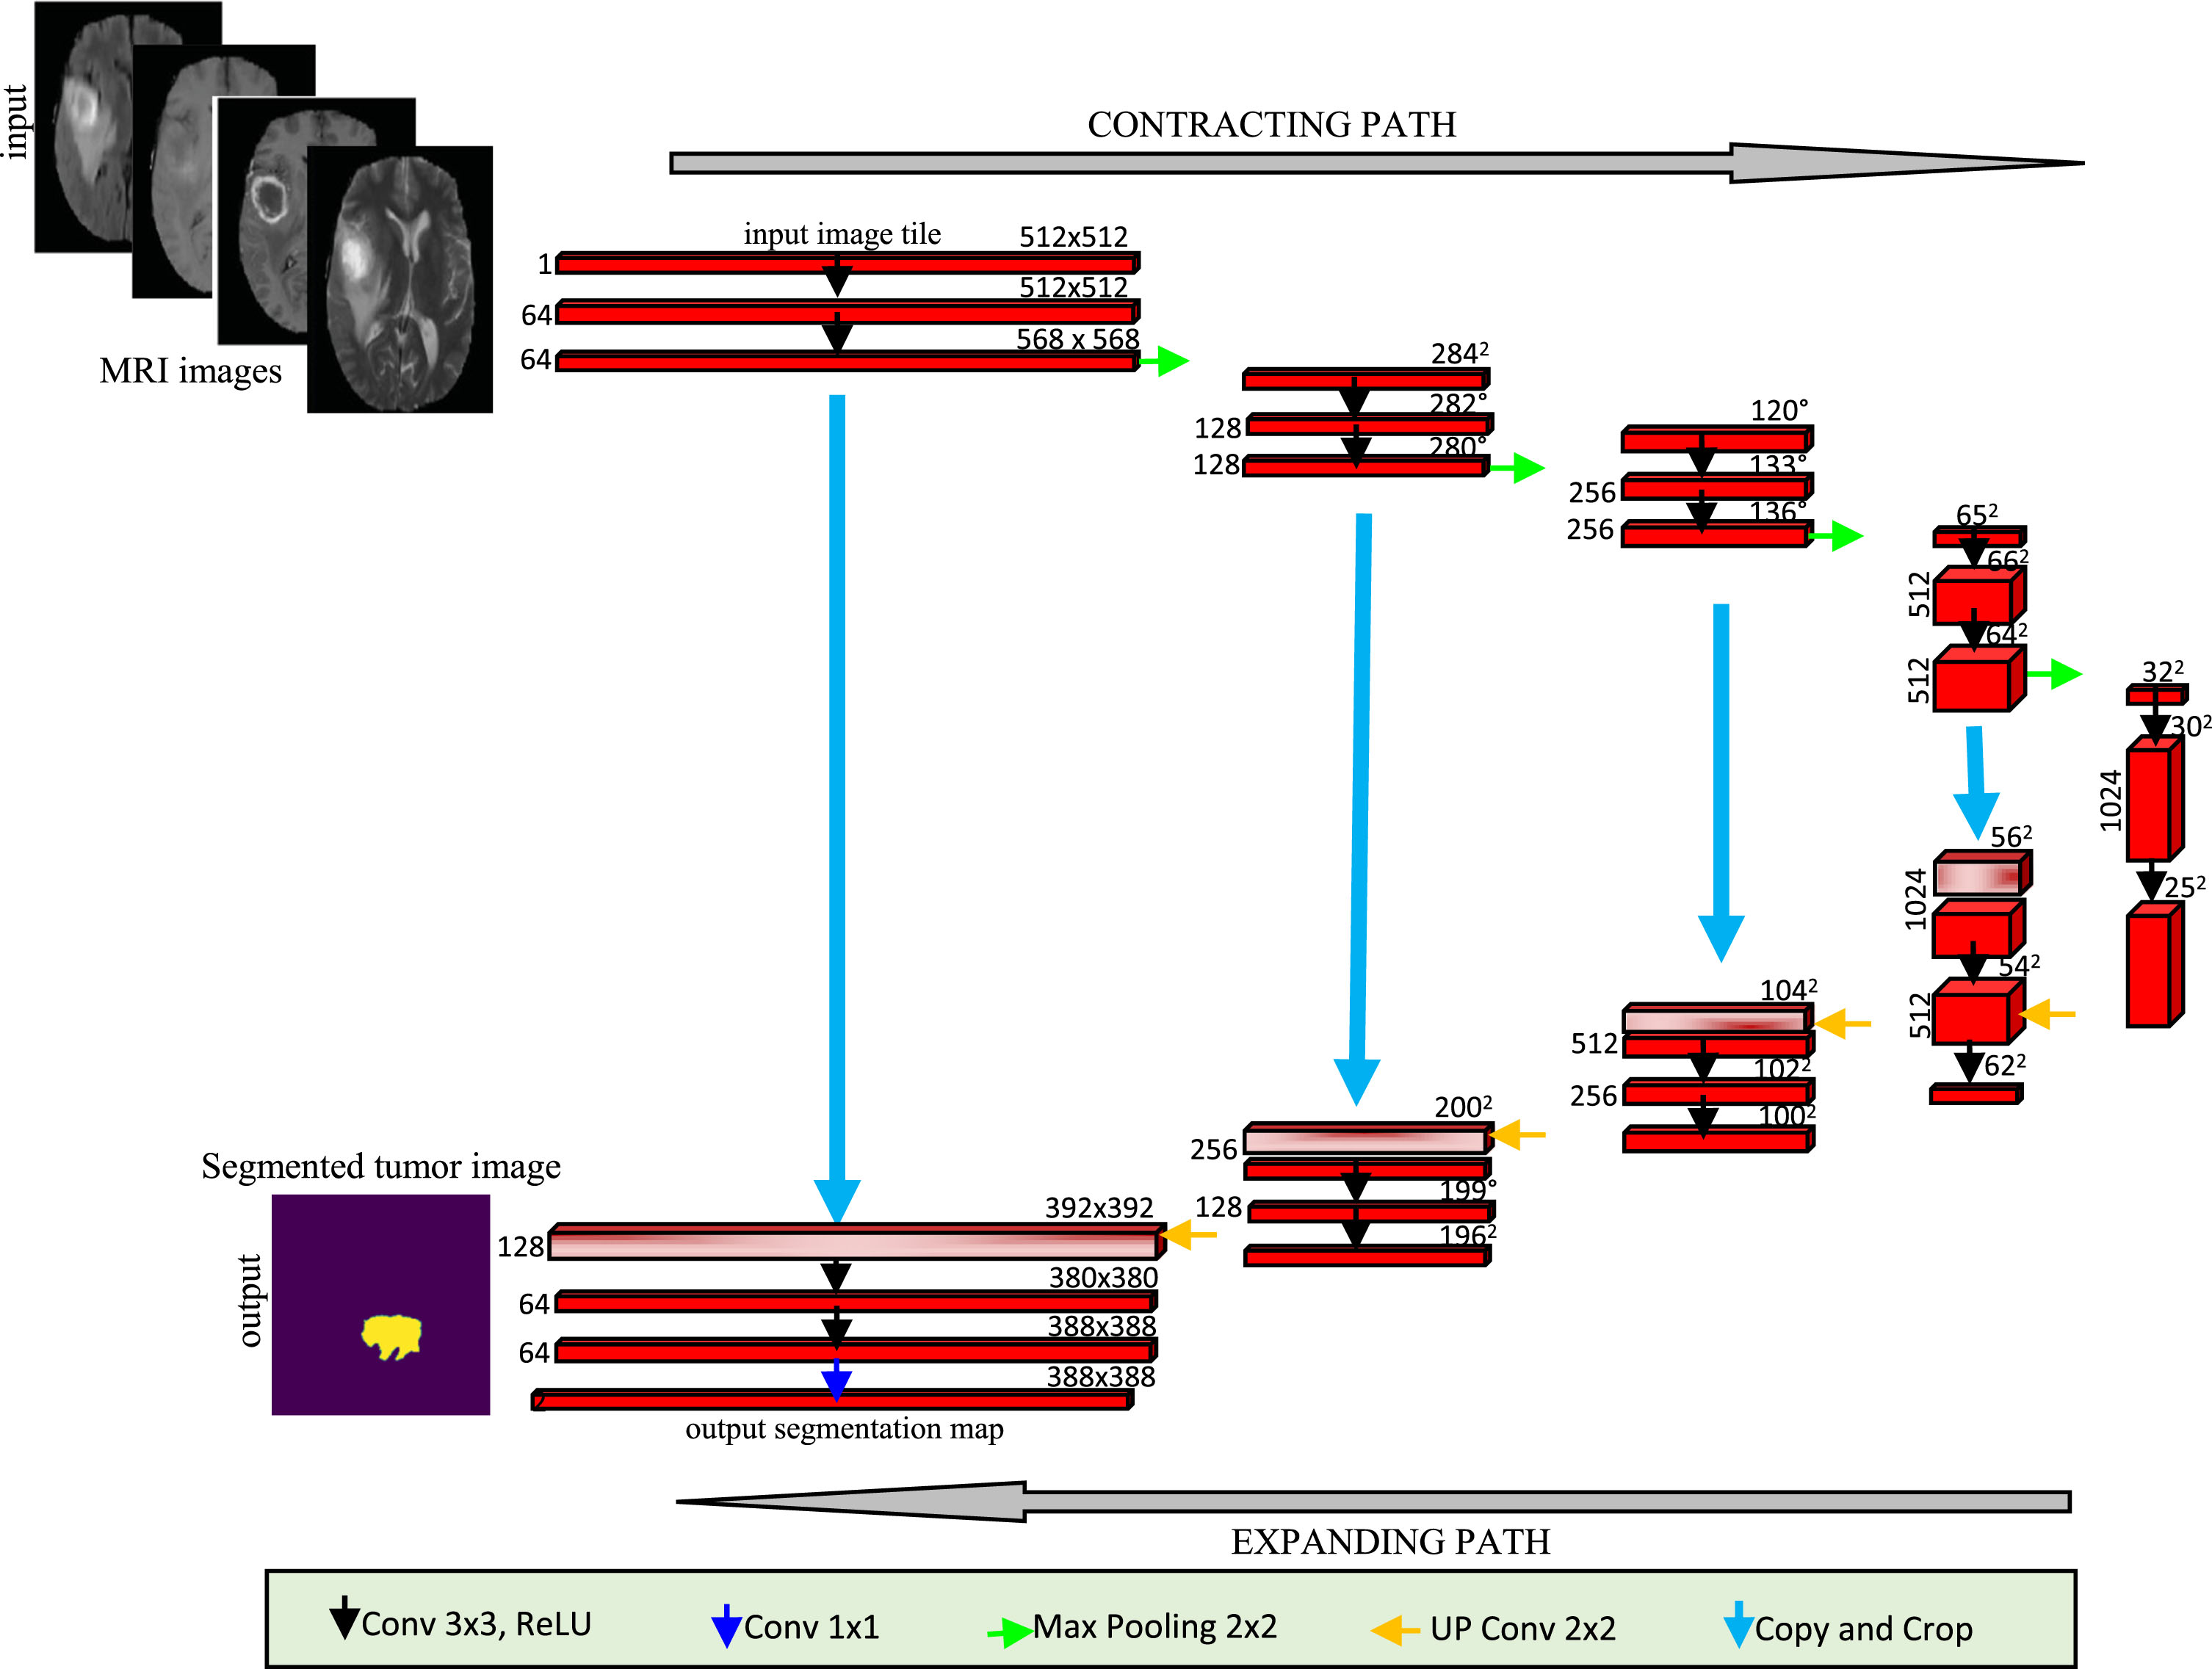
U-net architecture in term of multi-channel feature map.
In conventional neural network [19, 38], the vanishing gradient problem appears through the training process. As the training incomes, the gradient norm of previous layers reduced to zero. The Residual Network (ResNet) technique is employed [45] in order to disband this problem. The output of each residual layer is binded with its input being then the input of next layer. As revealed in Fig. 5, the contracting path is symmetric to the expanding path to become a U-shaped construction. According on the valid part of every convolution, the network is used without any fully connected layers. An improved U-net architecture is proposed by [42]. The authors planned to append residual blocks; as is exposed in Fig. 5. For creating a residual learning block, H(x) introduces the residual mapping. Figure 6 reveals the building blocks of the residual network. Only two stacked layers are employed in this architecture.
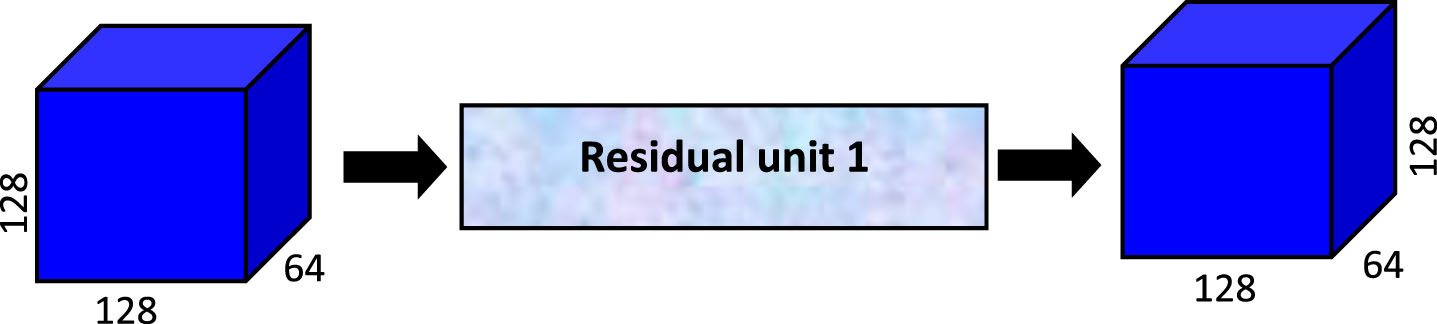
Enhanced block of U-Netnetwork.
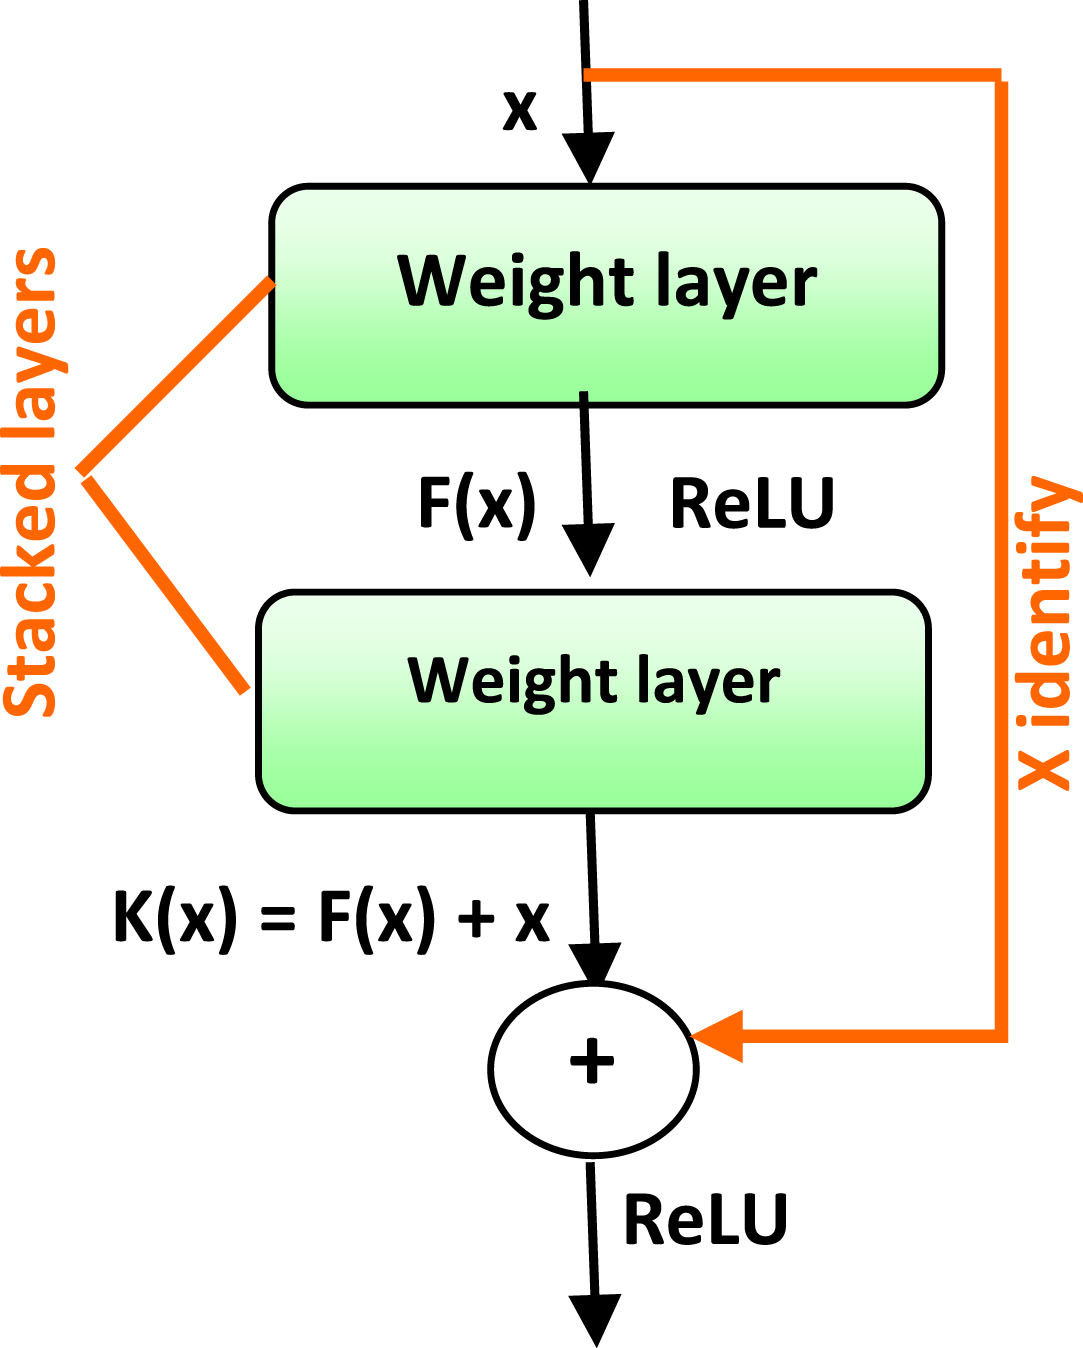
Residual network algorithm.
“K(x)=F(x)+x ” is almost computed by ResNet block. This formulation is identified by the feedforward neural schemes through shortcut connections [46]. Generally, a shortcut presents a connection between two faraway layers in the absence of requiring the set of layers between them. The shortcut connections amalgamate the stacked layer input and output via the identity mapping process without extra parameter. Consequently, the gradients can simply flow back to result in quicker training with much additional layers. Lately, an improved ResNet is projected through the addition to the network further identity connections. This method leads to the gradient backpropagation to previous layers immediately which makes the training easier. The ResNet method contains two chief blocks: identity block and convolutional block.
In ResNet algorithm, the identity block is distinct as [47]:
Figure 7 presents the identify block structure. The upper and the lower paths are respectively the shortcut and the principal ways. Table 1 displays the three components of the construction of the identity block. The channel axis normalization is performed through BN and the ReLU function intended for the nonlinear activation function. Before carrying out the ReLU activation function, the shortcut and the input are lastly combined.
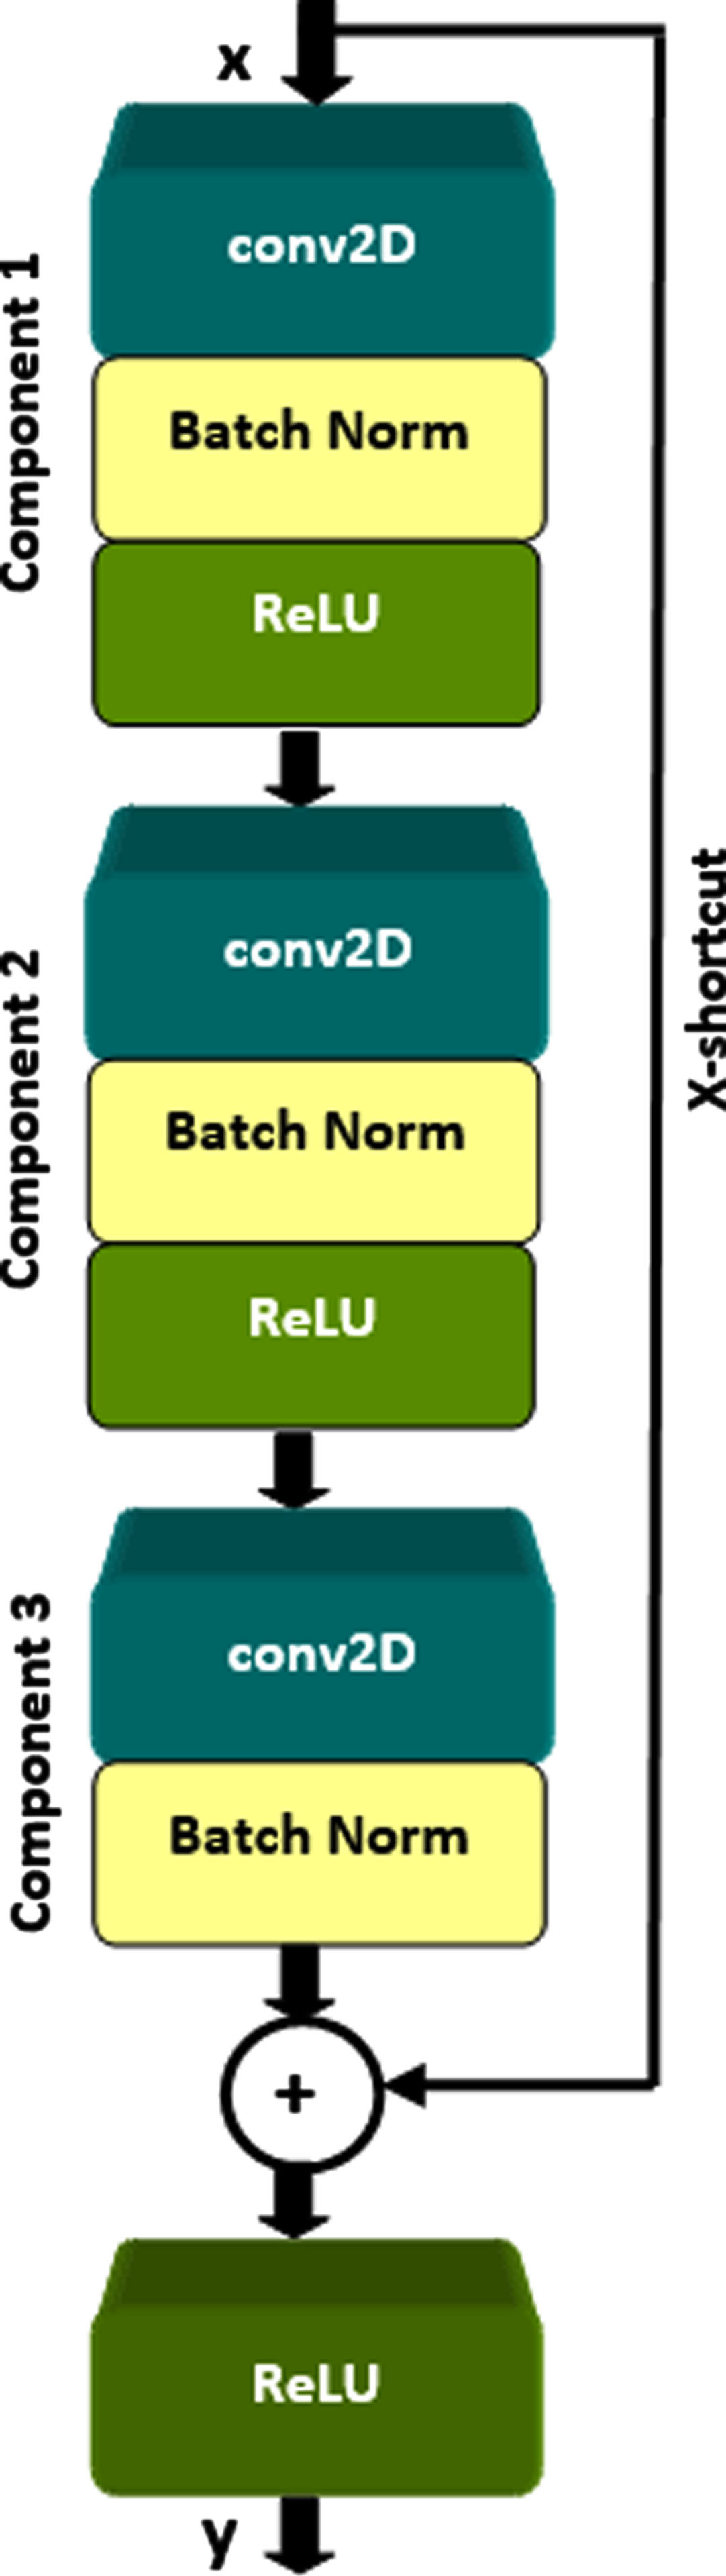
The identify block.
Three components of the identity block.
In the convolutional block, the input and output dimensions are not coordinated [48]. The shortcut connections achieve linear projection Ws for resizing the dimensions between x and F:

The convolutional block.
In this paper, we applied the ResNet model in order to prove the flexibility to complicated Glioblastoma brain tumor lesions segmentation. Then, classification strategy is based on the support vector machine method to effectively recognize tumor grades of the brain images. Hence, we propose to use the combined ResNet-SVM methodology for brain tumor detection from MRI images; as shown in Fig. 9. In this section, the proposed method is split into three important phases: pre-processing, ResNet based MRI image segmentation, post-processing and Brain tumor classification focused on supervised machine learning. Due to CNN approach allows all of the information limited in the input data to be used in the feature set selected in convolutional machine learning, feature extraction and optimization processes are automatically computed using convolution architecture.

The proposed methodology.
Due to the inclination field contortion in MRI images, a pre-processing stage is firstly applied. For each patient, the N4ITK technique [49] is used in order to rectify the bias field distortion of the MRI sequences. Yet, the intensity distribution still differs between patients. Consequently, the intensities across topics are normalized on separately sequence. The extracted patches of individually sequence are normalized to obtain unit variance and zero mean.
The proposed ResNet algorithm-based MRI image segmentation
In the residual network (ResNet) architecture, many ResNet systems of 18, 34, 50, 101 and 152 layers are proposed. In fact, each layer of ResNet model is divided into numerous blocks. The combination of the identity block (Ib) and the convolutional block (Cb) is for generating a ResNet method. In this work, we realized the ResNet 50 for MRI image segmentation. Due to ResNet 50 has deeper layers compared to ResNet 34 and evidently fewer parameters when compared to ResNets 101,152, this model is employed in this study having quicker training time. The proposed ResNet 50 model is exposed in Fig. 10. The model input was proceeded via Zero-padding pads ‘Zero Pad’ (3,3) and included of five steps each with the convolution block and the identity block; as highlighted in Table 2. In the output layer, we employed 2×2 Average Pooling ‘Avg Pooling’, at that time the output is flattened. Finally, the completely connected (Dense) layer is exploited to reduce its input to the classes’ number based on the softmax activation.
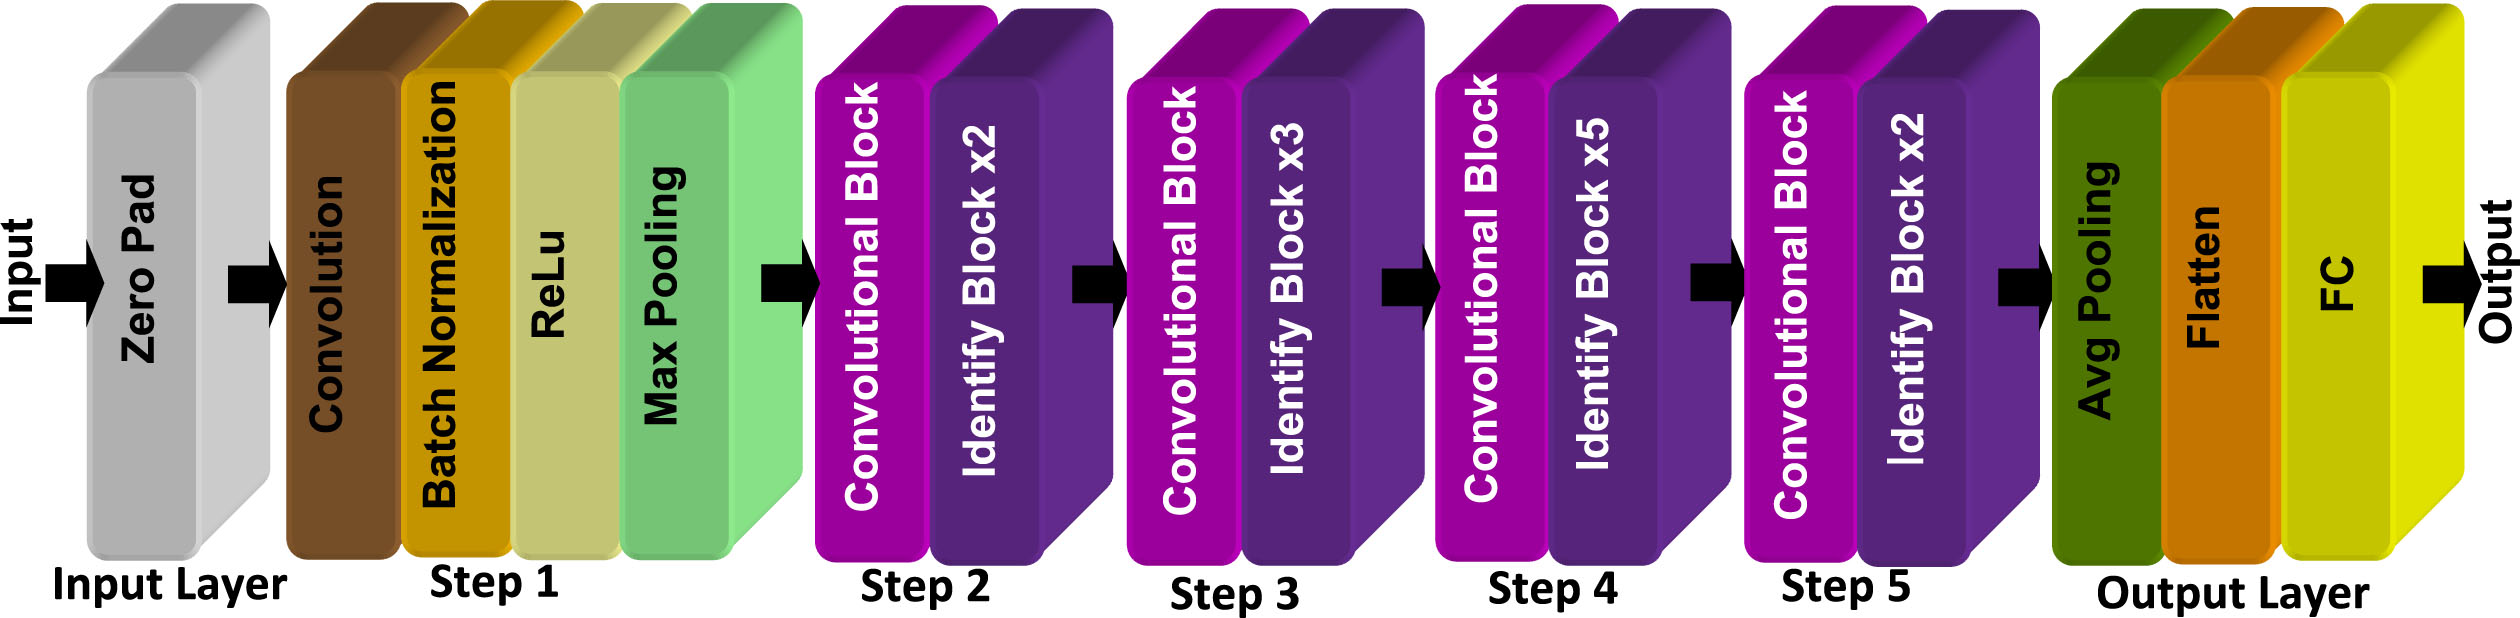
The proposed ResNet architecture.
Steps of ResNet 50 algorithm
The FLAIR images are considered as the ground-truth image to detect the entire brain tumor. As exposed in Fig. 11, three classes of large connected region are in brain tumors. To differentiate between classes, a specific color is assigned to each class such as ‘green’ for enhancing region, ‘red’ for necrosis, ‘yellow’ for edema.
In the segmentation system, the validation and testing process of the proposed method is 30% of the entire database, while the training procedure presents the main important data set (70%). The used data sets are split in three classes: 127 necrosis (N), 125 edema (E) and 120 enhanced tumor region (EN). The training, testing and validation processes for the proposed method contain 260 (90 N, 88 E, 84 EN), 112 (39 N, 37 E, 36 EN) subjects; respectively. In fact, the testing and validation sets are equally used.
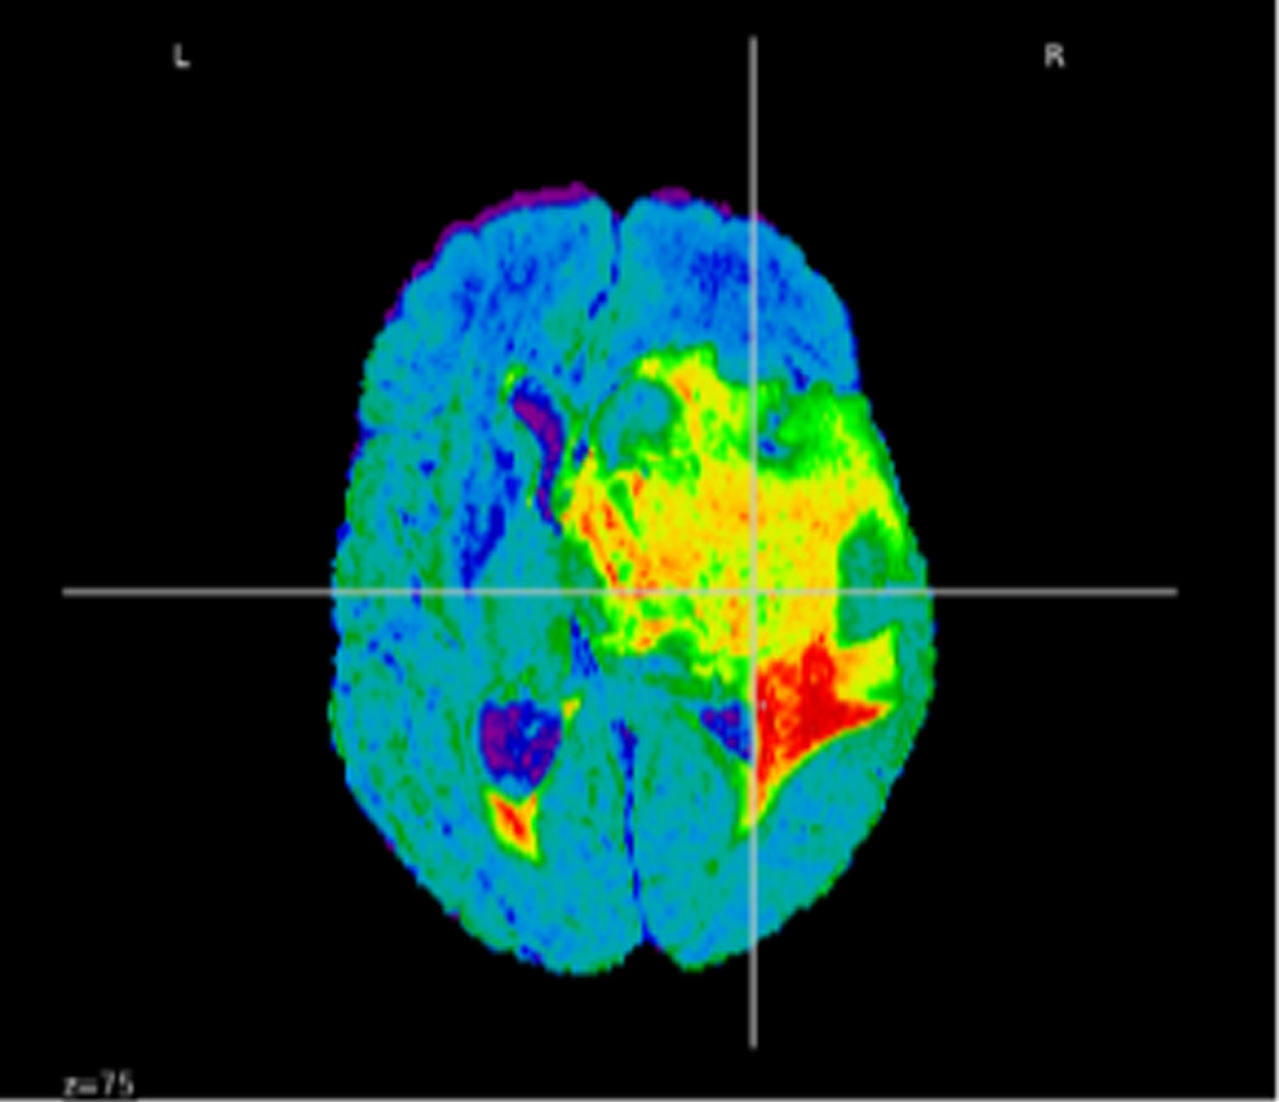
Segmented brain tumor in term of classes region.
Data augmentation is executed to the training MRI image based on random acts in view of rotations, translations... In each training epoch, new training examples were shaped. Different cases were made for 1000 epochs to efficiently train the network. The linear transformations are applied for the prevention of non-real tumors in the validation system.
Supervised classification techniques still remain among the powerful algorithms that dominate the field of signal processing, either for signal recognition or feature classification, through prior learning of a set of data collected manually from signals. Among these techniques, we cite: the multilayer neural network (MNN) and the support vector machine (SVM) methods [50].
SVM is a binary classification method based on supervised learning using the data space change hypothesis. Indeed, the larger the dimension of the data representation space, the higher the probability of finding a separating hyperplane between the classes [50]. Consequently, the goal of SVMs is to choose an optimal hyperplane which properly separates the data and which is as far as possible from all the points to be classified. This amounts to maximizing the margin of separation between the classes by using a kernel function such as: polynomial, Gaussian, linear... The maximum margin hyperplane can be represented as a linear combination of We tested several kernel functions to determine the most suitable for our application; with the highest classification rate. In this classification phase, the used training method is “the radial basis function (RBF)”. The chosen kernel function is Gaussian; its equation is as follows:
For multiclass classification, SVM method holds up binary classification and separating data samples into two classes. The same attitude is exploited after breaking down the multi-classification problematic into numerous binary classification problems. The principle is to map data samples to high dimensional space to improve mutual linear separation between two other groups. For breaking down the multiclass difficult into various binary classification problems, the one to one system is applied as a binary classifier per each pair of classes.
The classification makes it possible to separate subjects into three groups: brain tumors with different types necrosis edema and enhanced region tumor. The classification process based on the SVM classifier is divided into two different phases: (i) the training phase where we used the largest part of the database (70%) for network training. However, in the test and validation phase (ii), the SVM method is validated and tested by the smallest part of the MRI image database (30%). The used datasets are divided into two groups: 260 for training and 112 for validation and testing datasets. It is clear that the training set is larger than that of the test, this being in order to have a pertinent learning of the network and to guarantee better classification results.
The SVM structure is designed during the training experiences. Our network has an input layer containing a reduced number of features which is extracted from the ResNet model, a single hidden layer containing 30 neurons and an output layer. The desired output is equal to “–0.7, 0.7, 0.7” for N cases, “0.7, –0.7, 0.7” for E cases and “0.7, 0.7, –0.7” for EN cases. The optimal number of neurons in the hidden layer is selected using multiple experiments in order to have the smallest error rate (highest classification rate). The best structure of the SVM classification is also selected by choosing the hidden layer size that leads to the minimum validation error.
In many medical imaging applications, evaluation metrics are applied for brain tumor segmentation. These evaluation metrics are employed in the three sub-areas: N, E and EN. The segmentation yield is estimated by region of interest extraction. In fact, the ground truth segmentation of a similar MRI tumor image is created by different radiologists [52]. This is considered the desired result.
Dice Similarity Coefficient (DSC) and the mean IoU are defined as follow; extremely used for the comparison between two images: segmented brain tumor image and ground truth image.
The specificity (SP), accuracy (AC) and precision (PR) measures are presented by the following equations:
Segmentation results based on ResNet architecture
Figure 12 shows the segmentation results of the proposed approach. From left to right, we present the original image of the tumor in flair, ground truth, the segmented image containing all the classes or sub-regions obtained after automatic segmentation, the image of the detected class necrosis, edema and finally the image with segmented enhanced tumor.

Overview of the segmentation results of the proposed method.
The ResNet model relays on shortcut connections that complete personality aping. The connections outputs are linked to the output of the stacked layers without added parameter. In ResNet architecture, the layers are attempting to learn the residual of input and output while in CNN and U-Net models the layers learn only the true output. Consequently, the gradients can simply flow back when compared to CNN and U-Net methods. In ResNet technique, the shortcut connections dominate the vanishing gradient problem. In fact, this lets the system to acquire an identity function in order to effectively ensure that the higher layer will effect as adequate as the lower layer. The training set contains 248 images data and 124 testing and validation image data for different brain tumor classes. Each patient has four MRI scanning sequences ‘flair’, ‘t1’, ‘tice’ and ‘t2’ with image size of 240 × 240 × 155. Three categories of intra-tumoral regions (N, E, and EN) are frequently presented in brain tumors segmentation. In this work, the proposed segmentation approach is validated on three sub-tumoral regions for each patient:
Table 3 demonstates the hyperparameters of the proposed approach. In [19], the applied hyperparameters are used in order to train the ResNet method based on MRI dataset. About 220,000 patches are extracted with size 33×33×4, focused on Tensorflow technique, the proposed model is implemented.
Hyper parameters of the proposed approach
Figure 13 exposes ‘flair’, ‘t1’, ‘tice’, ‘t2’ and the corresponding segmented images to validate the performance of the proposed scheme. Effective comparison is completed regarding the average computation time of the segmentation process using the test topics from HGG images. The average time is calculated per patient for all segmented test images.

Illustrations of MRI Brats 2020 images: Flair, t1, tice and t2 with the corresponding segmentation. The tumor class is showed by a unique color: green: enhanced tumor, red: necrosis and yellow: edema.
For localizing the tumors in brain images, the testing set is applied to the method regarding to testing process. Over other methods, the proposed approach is assessed in terms of different evaluation metrics such as computation time. Three sub-regions: necrosis ‘N’, edema ‘E’, enhanced region ‘EN’ are used to judge the obtained results by computing defined metrics. The proposed method is compared to others computer aided methods such as Conventional Neural Network [19], Unet-Res [24], and Fully Conventional Network (U-Net) [25]. In the data set (Necrosis, edema, enhanced tumor), we calculated all metrics for every patient. Then, we estimated the average value of these metrics for all patients. Figure 14 proves that the proposed method has significant performance in view of dice score ‘DSC’, specificity ‘SP’ and precision ‘PR’ measures though having the highest accuracy results. This confirms that the proposed model accomplishes respectable classification performance for medical practice. Figure 15 displays the training and the validation processes for the proposed ResNet model using 30 epochs. Training and validation Accuracy, Loss, dice coefficient and mean IOU are revealed in Fig. 15. The training error linearly reduces and the training accuracy rise after each epoch. While the ResNet model has the highest accuracy, it has evidently smallest training error which makes it decreases very fast. Figure 16 authenticates that the proposed system has the minimum average computation time when compared to others models [19, 25].
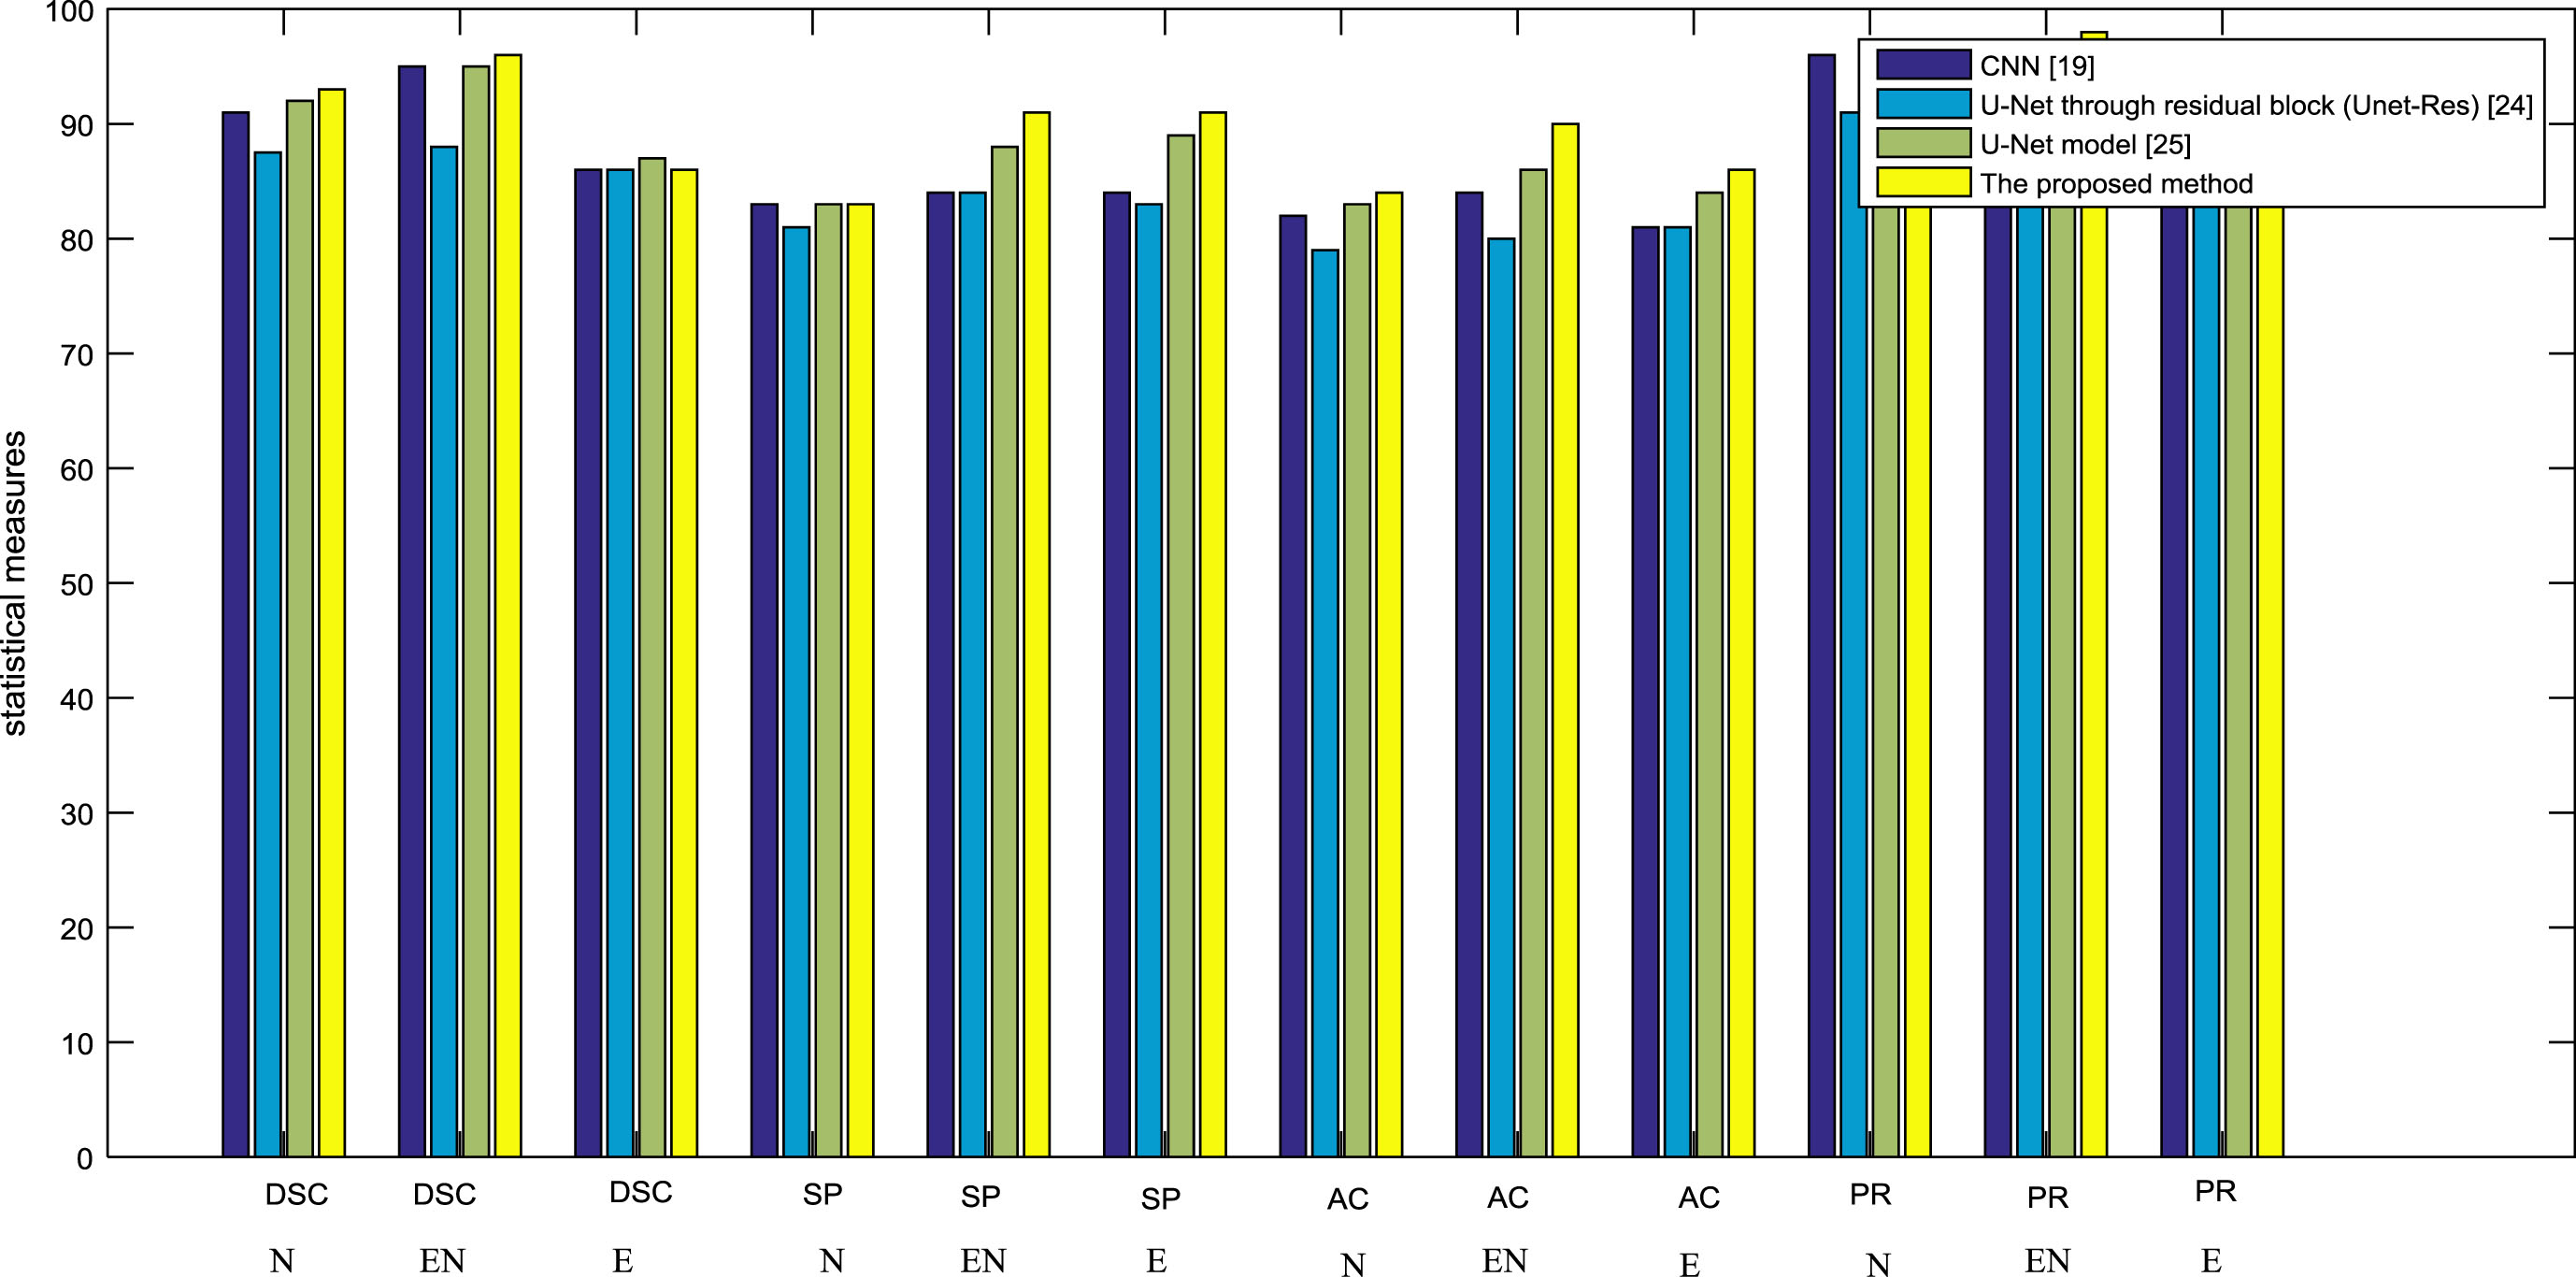
Performance comparison of proposed approach.
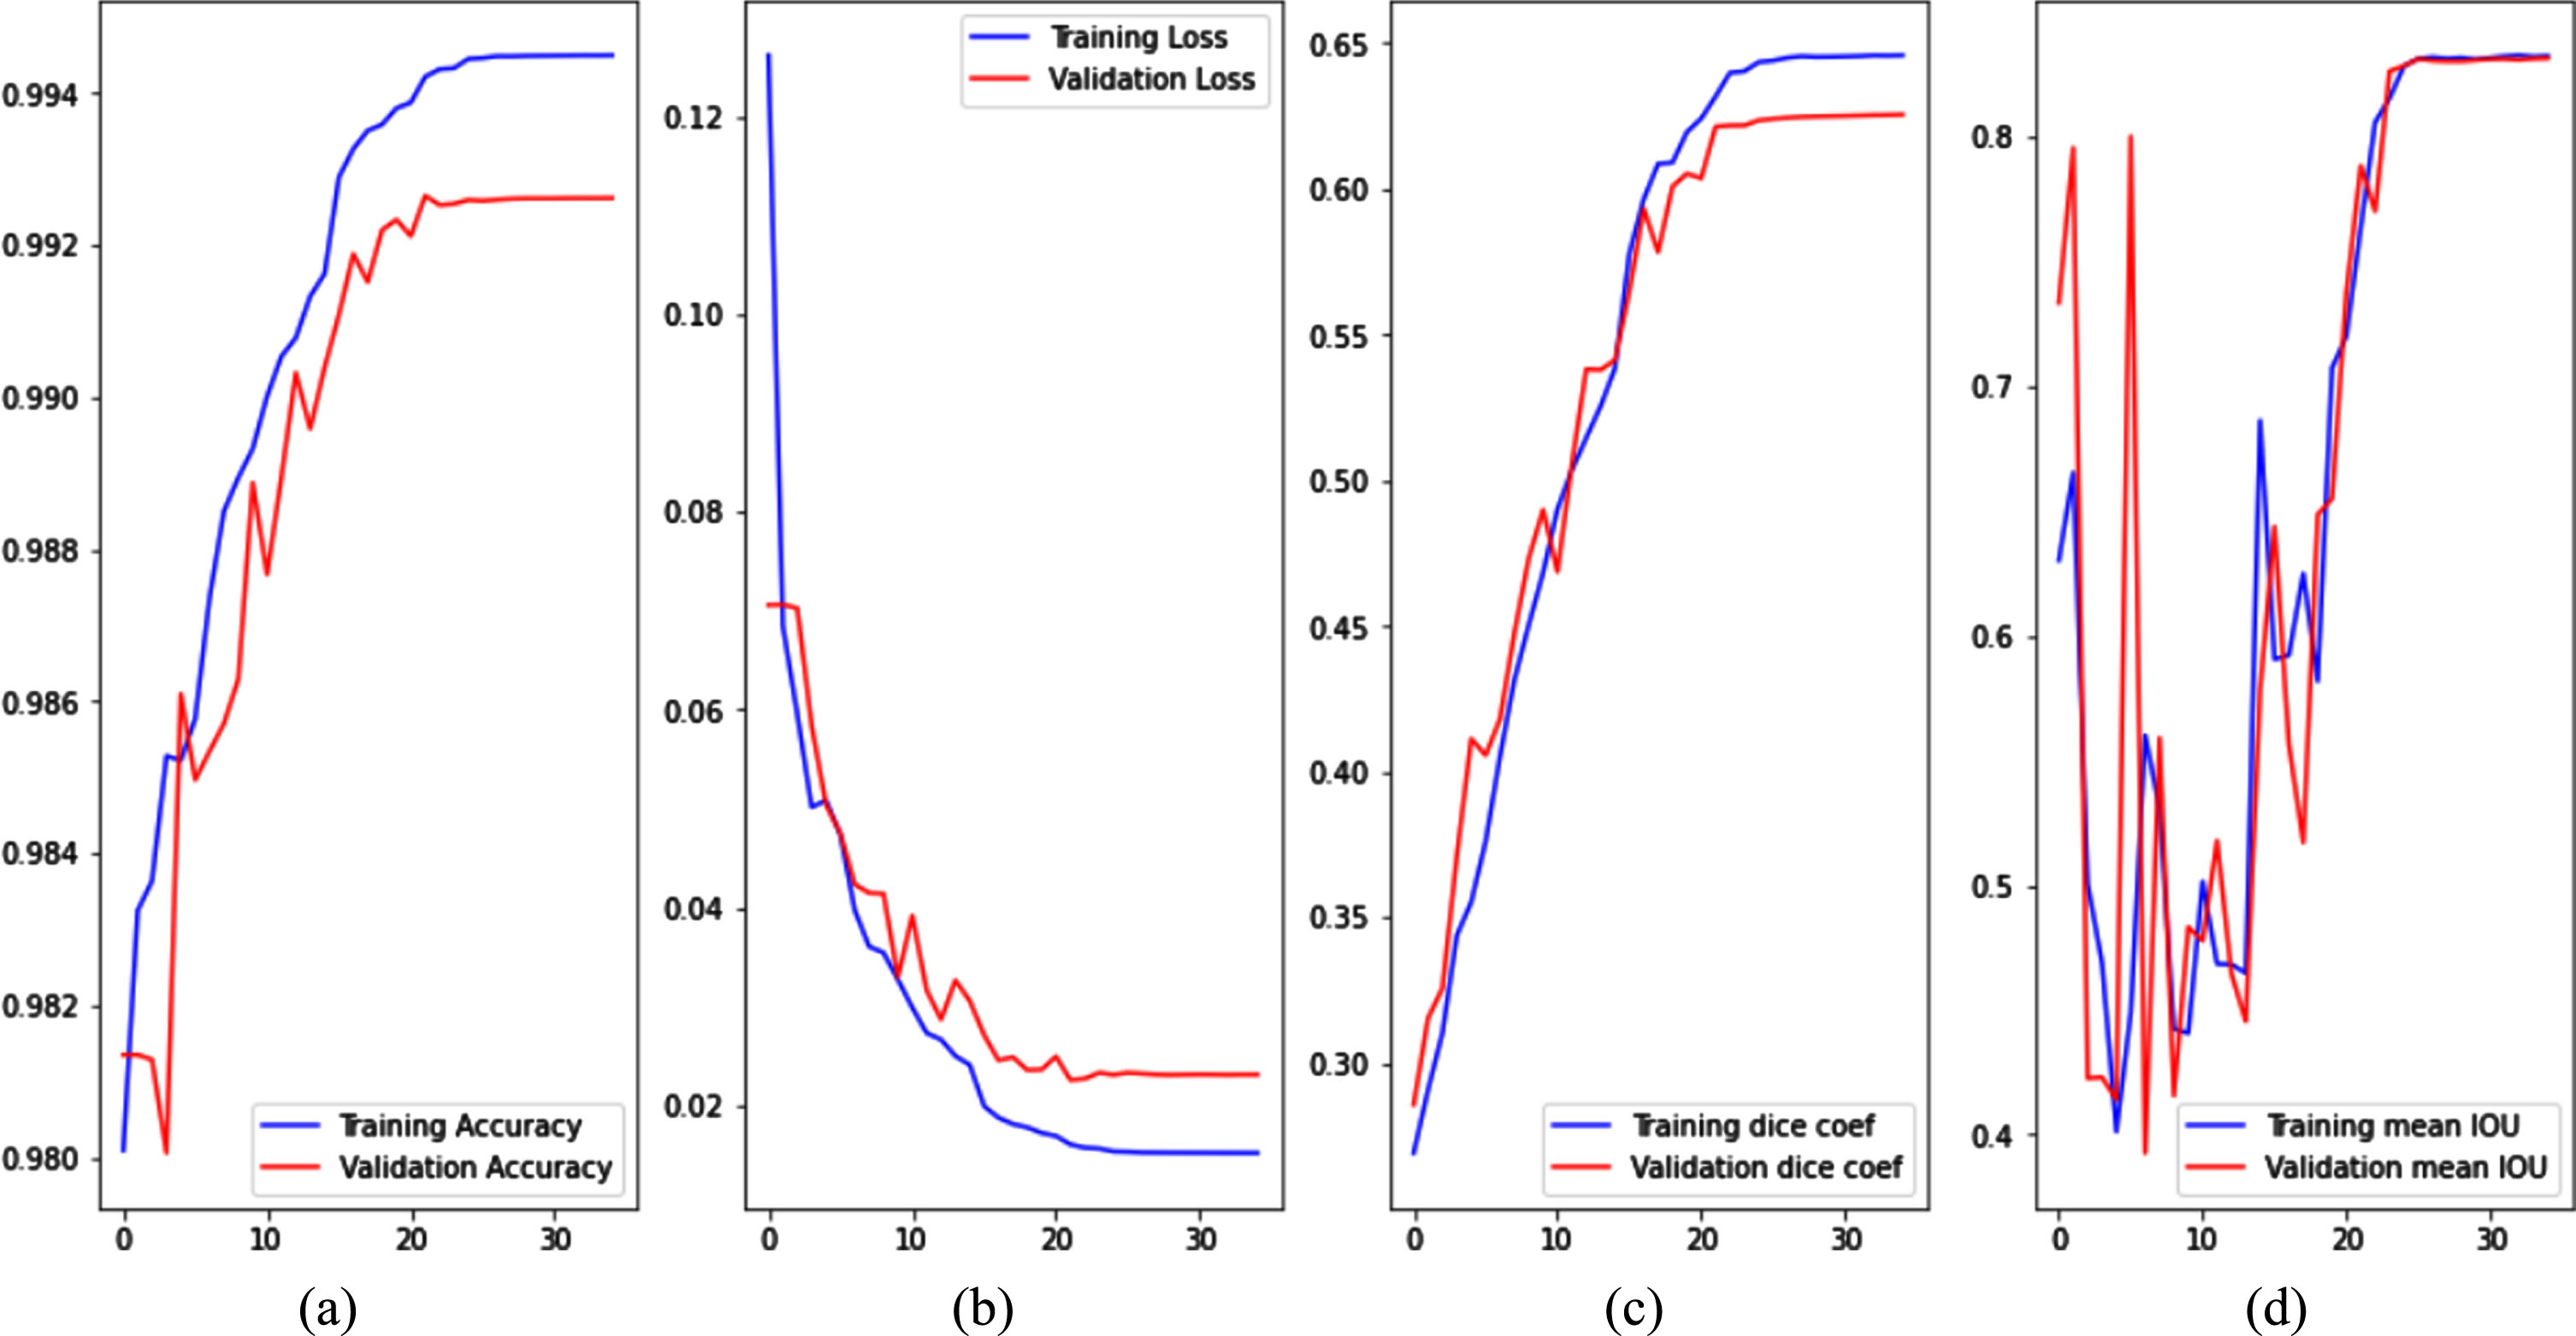
Performance of the proposed ResNet via (a) Training and validation Accuracy, (b) Training and validation Loss, (c) Training and validation dice coefficient and (d) Training and validation mean IOU.
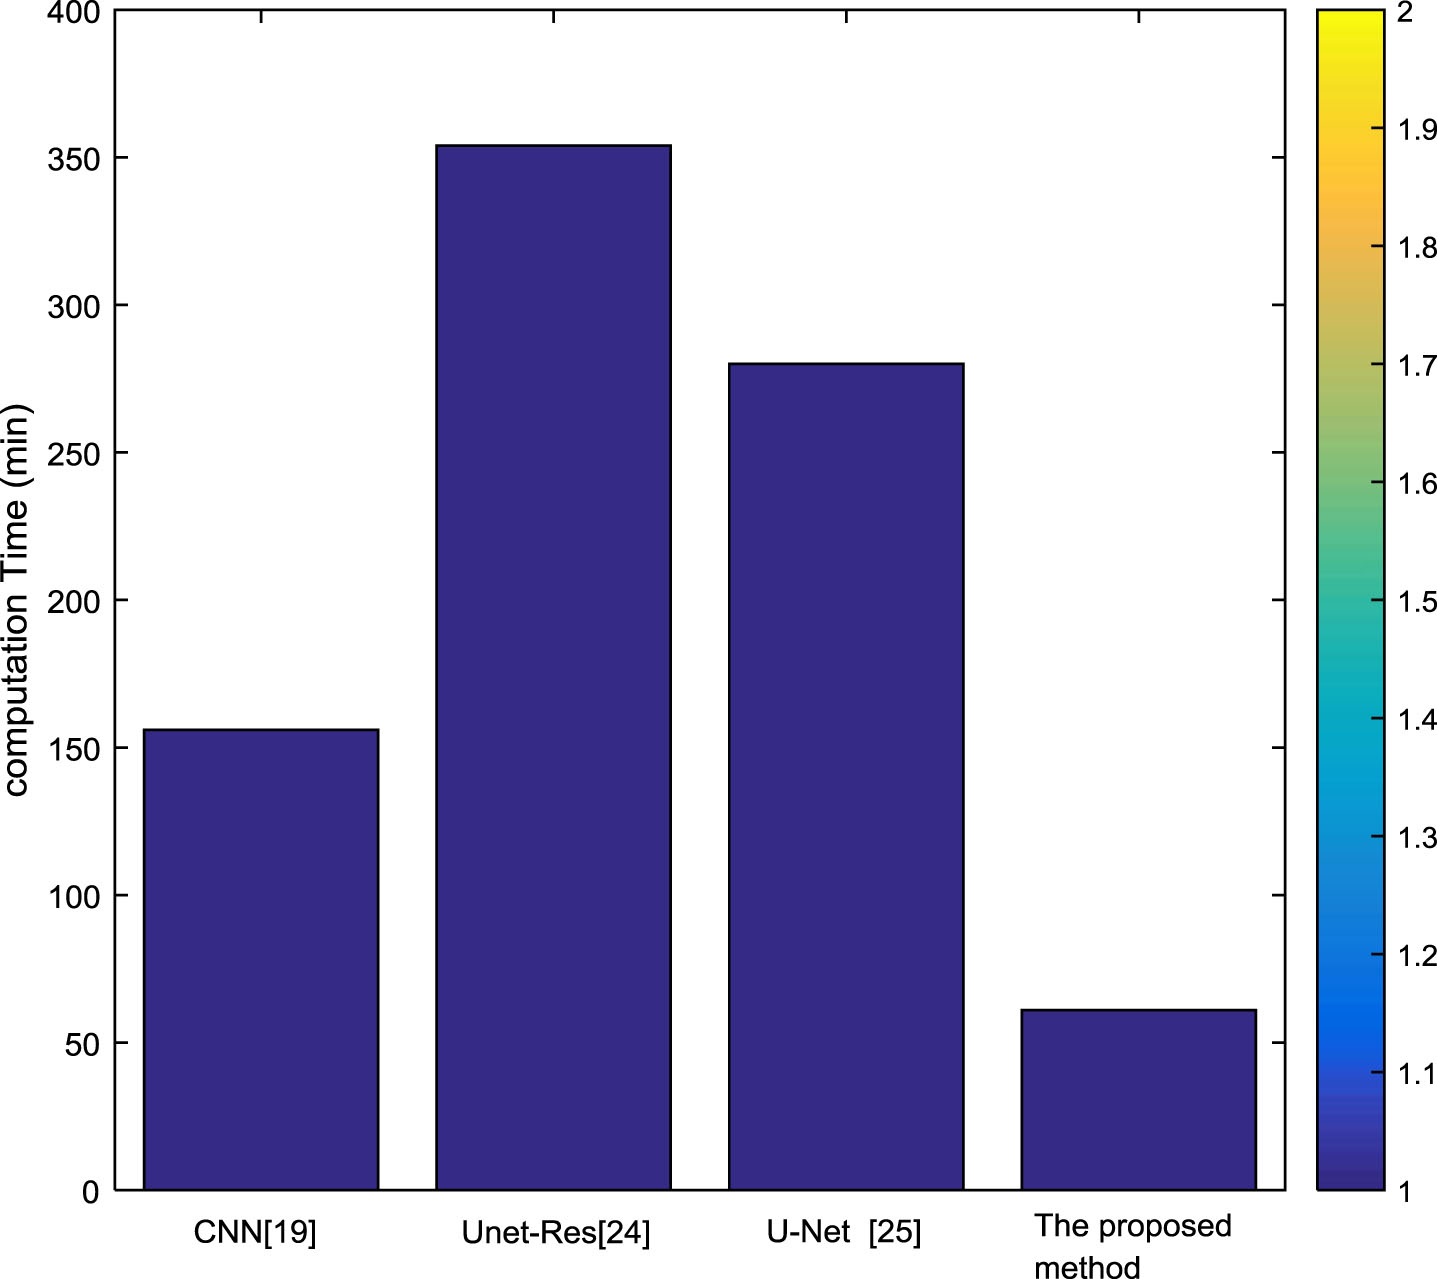
Average of computation Time per patient.
The results of Glioblastoma tumor classification are described in Table 4. We display the efficiency of the proposed method established on the SVM procedure employing a large MRI dataset. The proposed system was able to distinguish three Glioblastoma types (necrosis, edema, and enhancing regions) with a precision average of 90.12% in the whole MRI dataset, when compared to the quantification given by experts. From these results, we conclude that the proposed ResNet segmentation and SVM classification technique can reliably be employed to support neurologist doctors by supplying a second evaluation for indeterminate cases that requires additional attention.
Results of the computer-assisted Glioblastoma tumor on the complete MRI dataset (mean values±standard deviation)
Results of the computer-assisted Glioblastoma tumor on the complete MRI dataset (mean values±standard deviation)
Statistical measures are achieved using SVM which are exemplified in Table 4. The accuracy, specificity and the precision of the testing dataset using the SVM method for Glioblastoma are 89.36%, 92.52%, and 90.12% for the three classes (necrosis, edema, and enhancing regions). To demonstrate the efficacy of the proposed categorization methodology, the classification results are presented using SVM method compared to tested classifiers K-nearest neighbors (KNN) and multilayer neural network (MNN). For the evaluation process, the testing dataset is processed after the training stage. In fact, the classification metrics (AC, PR, SP) are computed for each validation experiment. Moreover, hyper-parameters for each tested classifier KNN and MNN designed for automatic Glioblastoma tumor detection are got after numerous experiences. In fact, classification parameters represent the finest combination that provides the greatest accuracy rates through all experiments. The KNN technique is principally based on a distance function and the neighbor number. In this study, the Euclidian distance is selected and the neighbor number is fixed to 3 for attaining the greatest value of classification error percentage in the validation stage. Regarding to MNN method, we applied the conjugate gradient as a training method using 1000 epochs. MNN network has an only hidden layer containing 30 neurons and an output layer. In fact, the desired output is equal to “–0.7, 0.7, 0.7” for N topics, “0.7, –0.7, 0.7” for E topics and “0.7, 0.7, –0.7” for EN topics.
Figure 17 presents box and whisker plots that reveals the used performance measures. The employed metrics are computed by the equations defined in the subsection 3.4. As shown in Fig. 17, the classification results of SVM method are compared to those achieved by KNN and MNN systems.
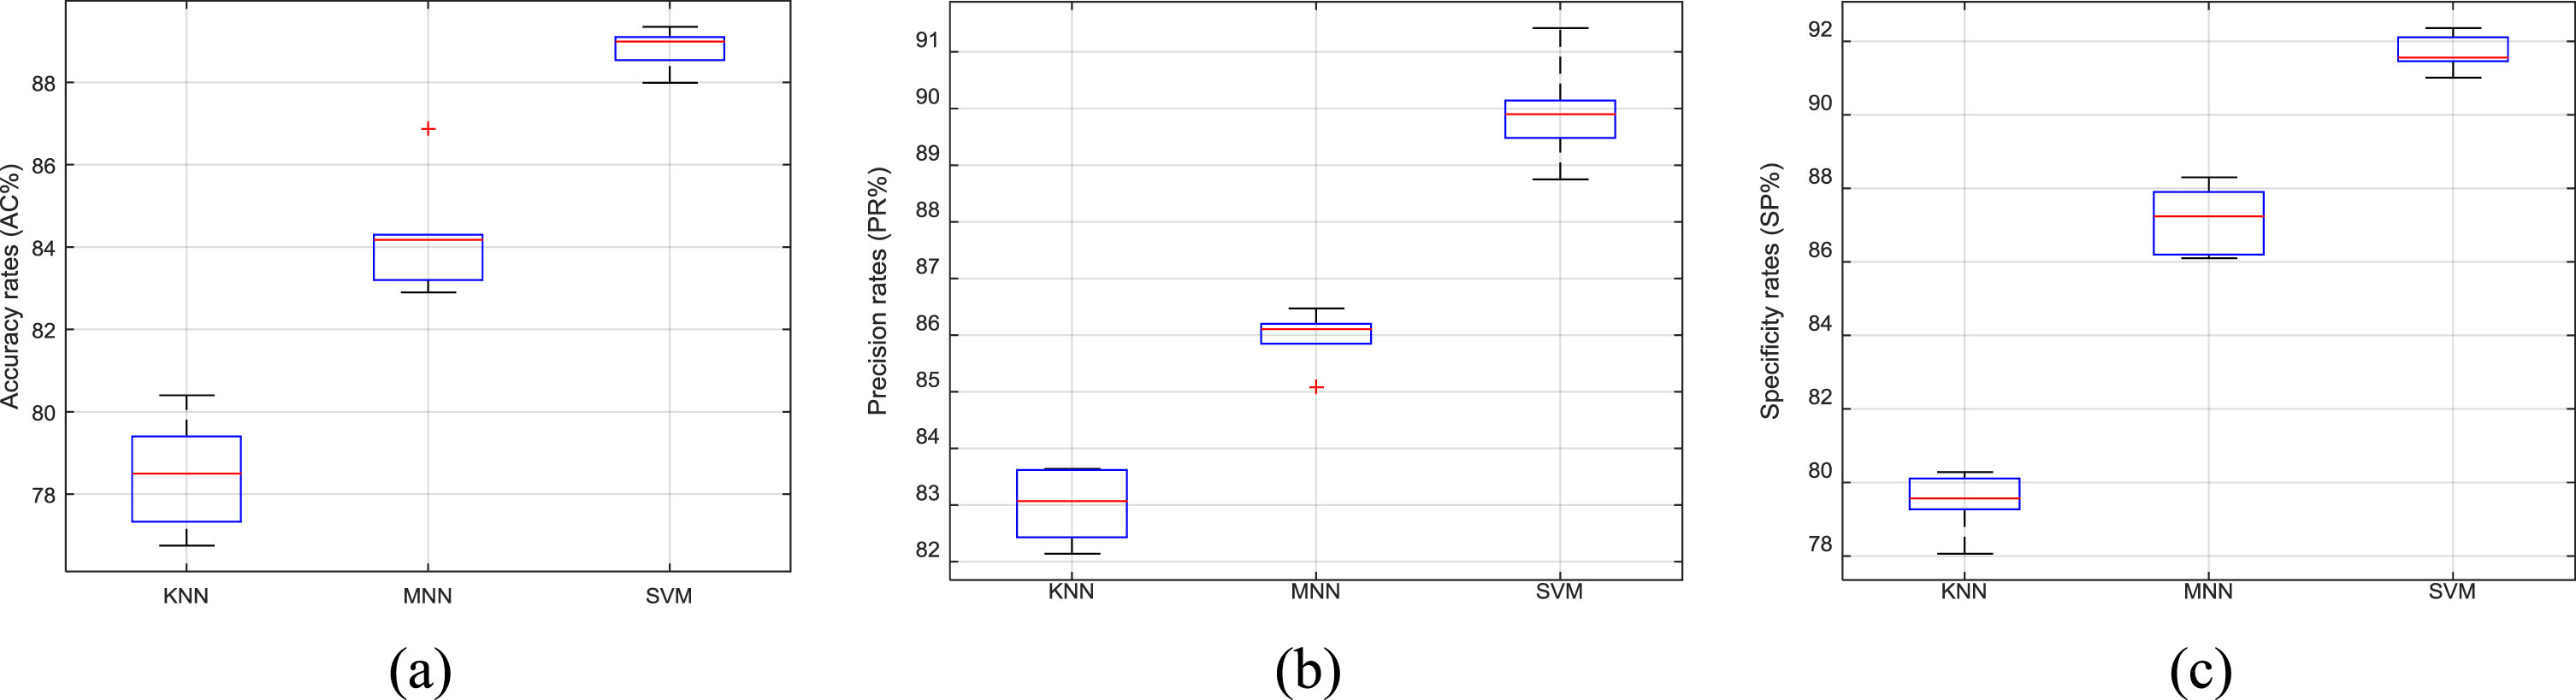
Box and whisker plots of Glioblastoma classification results using KNN, MNN, and SVM methods in terms of (a) AC, (b) PR and (c) SP.
The box plot representations highlight the similarity between manual and computerized Glioblastoma diagnosis focused on appropriate features and it is mainly useful to prove the variety between peoples. We expose the highest precision of our proposed Glioblastoma recognition method on the considered database compared to the KNN and MNN techniques. In order to validate the obtained results of the proposed approaches, we applied the confusion matrix.; as shown in Fig. 18.
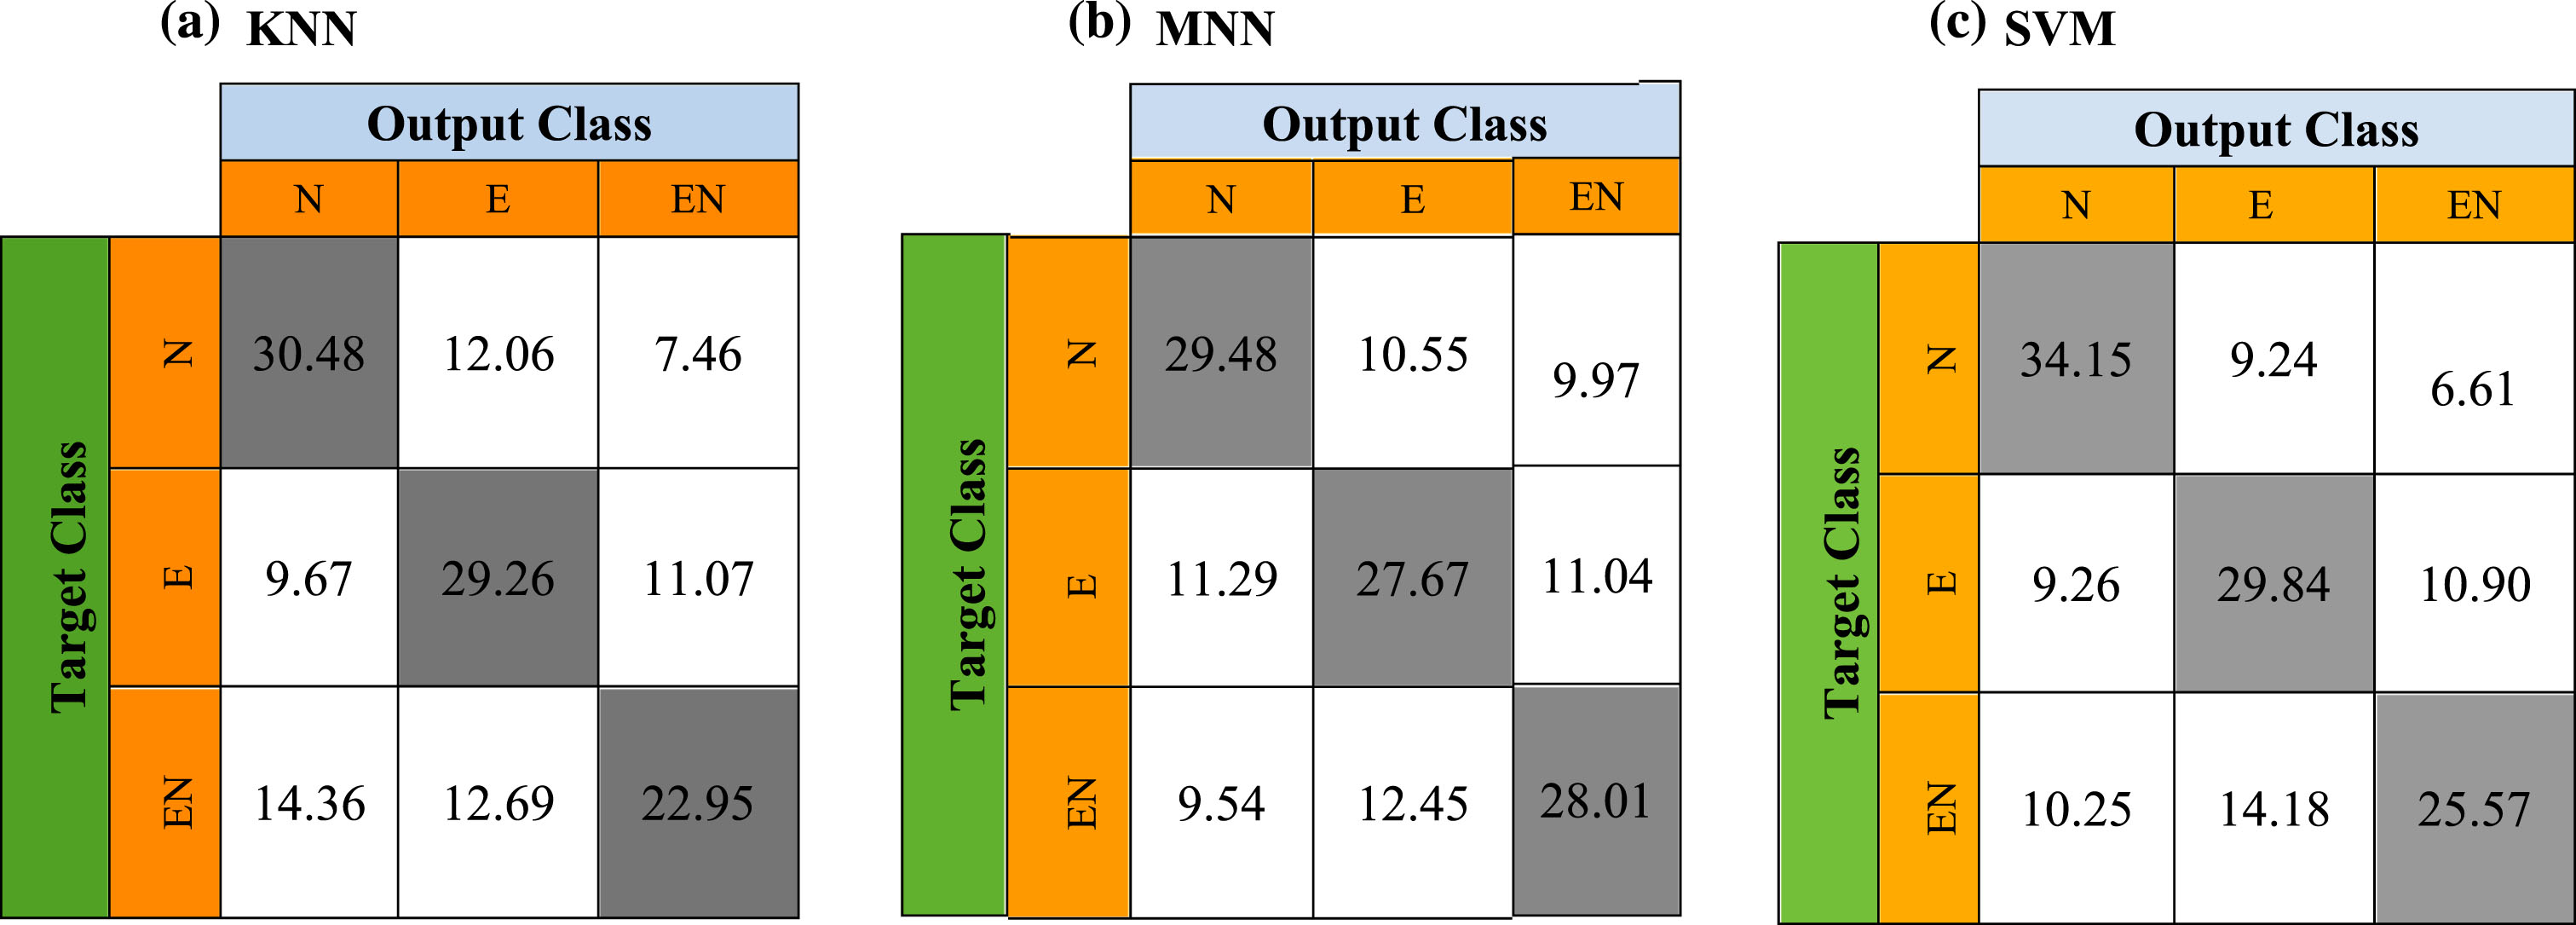
Confusion matrix using (a) KNN, (b) MNN, and (c) SVM.
Table 5 discloses the proposed segmentation technique compared to other existing frameworks in terms of evaluation criteria. Compared to other tested state-of-the-art studies, we report that the proposed segmentation approach demonstrates an operative segmentation exactitude regarding to the segmentation accuracies. Thus, we computed the p-values measure between the ground truth and the predicted segmentation area. The proposed method reaches a p-value of 0.042. The obtained p-value is significant because it is inferior to 0.05. Table 5 displays the gotten results based on the ResNet architecture compared to other segmentation approaches. Compared to advanced segmentation methods [19, 25], a failed result is reached a higher p-value, Dice and IoU results for defining the difference between the ground truth labels and other segmentation approaches.
Summary of Glioblastoma tumor segmentation methods using MRI data
Summary of Glioblastoma tumor segmentation methods using MRI data
Tumor segmentation and classification is a crucial advance in the treatment plan of cancer disease. Deep neural networks are valuable assets to achieve segmentation. Yet, these methods evidently suffer from the problem of vanishing gradient that appears in the training process. In this paper, the combined Residual Network and support vector machines (ResNet-SVM) is proposed to overcome this problem and classify brain tumors with high-grade and low-grade. In ResNet architecture, the gradient is backpropagated to prior layers based on the identity shortcut connection. The proposed technique attains minimum computation running time and higher accuracy compared to other methods for brain tumor detection from MRI images. Focused on SVM classifier, the proposed process can be used to detect different brain tumor regions.