
Abstract
Background:
With the popularity of computed tomography (CT) technique, an increasing number of patients are receiving CT scans. Simultaneously, the public’s attention to CT radiation dose is also increasing. How to obtain CT images suitable for clinical diagnosis while reducing the radiation dose has become the focus of researchers.
Objective:
To demonstrate that limited-angle CT imaging technique can be used to acquire lower dose CT images, we propose a generative adversarial network-based image inpainting model—Low-dose imaging and Limited-angle imaging inpainting Model (LDLAIM), this method can effectively restore low-dose CT images with limited-angle imaging, which verifies that limited-angle CT imaging technique can be used to acquire low-dose CT images.
Methods:
In this work, we used three datasets, including chest and abdomen dataset, head dataset and phantom dataset. They are used to synthesize low-dose and limited-angle CT images for network training. During training stage, we divide each dataset into training set, validation set and testing set according to the ratio of 8:1:1, and use the validation set to validate after finishing an epoch training, and use the testing set to test after finishing all the training. The proposed method is based on generative adversarial networks(GANs), which consists of a generator and a discriminator. The generator consists of residual blocks and encoder-decoder, and uses skip connection.
Results:
We use SSIM, PSNR and RMSE to evaluate the performance of the proposed method. In the chest and abdomen dataset, the mean SSIM, PSNR and RMSE of the testing set are 0.984, 35.385 and 0.017, respectively. In the head dataset, the mean SSIM, PSNR and RMSE of the testing set are 0.981, 38.664 and 0.011, respectively. In the phantom dataset, the mean SSIM, PSNR and RMSE of the testing set are 0.977, 33.468 and 0.022, respectively. By comparing the experimental results of other algorithms in these three datasets, it can be found that the proposed method is superior to other algorithms in these indicators. Meanwhile, the proposed method also achieved the highest score in the subjective quality score.
Conclusions:
Experimental results show that the proposed method can effectively restore CT images when both low-dose CT imaging techniques and limited-angle CT imaging techniques are used simultaneously. This work proves that the limited-angle CT imaging technique can be used to reduce the CT radiation dose, and also provides a new idea for the research of low-dose CT imaging.
Keywords
Introduction
Since the first commercial X-ray computed tomography (CT) was born in the 1970s, it has been widely used in many fields such as medicine, industry, biology and so on [1]. However, excessive radiation exposure can lead to a potential risk of cancer. To overcome these shortcomings, low-dose CT imaging has become a popular area of research. At present, low-dose CT often obtains data by reducing the radiation dose in a single time scan, and then processes the data through denoising techniques or iterative reconstruction algorithms [2], to obtain CT images that can be used for diagnosis. Numerous researchers are involved in research to improve the quality of low-dose CT imaging, such as Hu et al. [3] used the WassersteinGAN to remove artifacts of low-dose dental CT; Li et al. [4] used a residual neural network to remove streak artifacts for low-dose CT images; Cui et al. [5] proposed an artifact-assisted feature fusion attention network to reduce artifact and denoise in low-dose CT and Wu et al. [6] proposed a low-dose CT reconstruction algorithm which does not need normal-dose CT images for training. However, the blind pursuit of lower radiation dose may lead to too much noise and artifacts, making it difficult for some small structures such as lung marking to be restored by reconstruction algorithms, which will reduce the accuracy of the reconstructed CT images. Therefore, how to further reduce the radiation dose during scanning on the premise of ensuring the quality of image reconstruction has become an urgent problem to be solved. The limited-angle CT imaging technology is probably the key to solving this problem. When acquiring limited topographic data, fewer projection angles mean that patients are less exposed to radiation and receive lower radiation doses. Therefore, we propose a image inpainting method based on generative adversarial networks (GANs) using limited topographic data to further reduce the CT radiation dose, which also provides a new idea for applying limited data to the field of low-dose CT research.
According to whether the projection angle is missing, the obtained data can be divided into complete topographic data and limited topographic data [7]. Complete tomographic data means the projection data obtained from the detector when the scanning range of X-ray is π; however, when some projection angles are limited, the scanning range at this time is less than π, and the data obtained in this case is called limited tomographic data. Limited tomography is a common problem in some medical and industrial applications, such as dental radiology, surgical imaging, mammography [8] and linear trajectory imaging system [9]. Compared with complete data, the reconstruction of limited data is more challenging. Firstly, the traditional reconstruction algorithms [10] are not suitable for the special case of limited data, they must strictly require complete data for image reconstruction. Secondly, limited data is lack of projection data in some angles, that means if we translate limited-angle CT image to sinogram, we can find that at some angles, the projection data is deleted, as shown in Fig. 2(d). Furthermore, a lot of noise and artifacts are created when reconstructing limited-angle data [11]. Although it is very challenging to reconstruct limited data using traditional algorithms, researchers have also conducted a lot of research on this problem, such as reconstruct extended data using radon transform [12, 13]; use prior information to reconstruct piecewise constant or otherwise sparse object [14–16] and reconstruct limited data with the algebraic and regularization method [17–19].
As an extension and expansion of traditional neural networks, deep learning technology has made considerable progress and development recently. Compared with traditional neural networks, it has more network layers, which greatly enhance its feature extraction ability and information expression ability [20], making it show great advantages in the fields of image processing[21, 22] and natural language processing [23]. Since the advent of GANs [24] in 2014, it has been regarded as one of the most significant technological breakthroughs in deep learning in the field of unsupervised learning. To now, GANs have played an important role in many fields, for example, Zhu et al. [25] and Isola et al. [26] used the CycleGAN and pix2pix model to transform image style, respectively; Pathak et al. [27] constructed Context encoders to fill the in complete image; Ledig et al. [28] and Wang et al. [29] used the SRGAN and ESRGAN to generate super-resolution images from low-resolution images; Chen et al. [30] used GAN-based noise modeling to blind denoise of images. Additionally, it is difficult to collect high-quality images due to the imaging equipment, radiation dose and other factors when medical images are collected, while medical images have higher requirements for imaging quality. Therefore, the use of GAN to generate images with specific uses based on the original image has become a hot spot in the research field. Many researchers have attempted in this field and achieved good results, such as You et al. [31] used GAN-CIRCLE generated super-resolution CT images; Liao et al. [32] used the CycleGAN to remove metal artifacts in CT. Liu et al. [33] used the TomGAN to generate high-quality CT images from low-dose images. Podgorsak et al. [34] developed a reconstruction technique based on DCGAN to reduce artifacts during CT data acquisition.
Since CT images cannot be obtained directly, a series of mathematical translations are needed to obtain CT images that can be used for clinical use based on the collected projection data. Therefore, deep learning can be widely applied to the reconstruction process from projection data to CT images, and can also be applied to the post-processing of CT images. At present, many researchers have used GANs to reconstruct and post-process limited data. According to the different roles of GANs play in the process of limited data image reconstruction or inpainting, there are three methods: (1) reconstructing images directly based on limited tomographic data, where, GANs can be used to fit the traditional algorithms [35, 36]; (2) GANs are used to repair the sinogram to obtain the complete projection data, and then the traditional algorithm (e.g. filtered Back Projection, FBP) is used for reconstruction [37–40]; (3) the traditional algorithm is used to reconstruct limited sinogram directly, and then GANs are used to post-process the images. Although the first and the second methods can effectively reconstruct images, there are still with some shortcomings. Images reconstructed using the first method are far from images reconstructed by complete data in some evaluation indicators which cannot meet the quality requirements of clinical CT images; Compared with the first method, the image quality of the second method has been greatly improved, but since GANs repair the missing data on the sinogram, the algorithm requires extremely accuracy, otherwise the quality of the reconstructed image will be greatly reduced [41]. At present, most researchers focus on inpainting limited-angle CT on sinograms, but our method is to post-process the reconstructed CT images. In view of the special application background of clinical medical images, the existing image post-processing methods, whether traditional methods or deep learning methods, cannot repair limited-angle CT images well. On the basis of reducing the CT scan dose to obtain low-dose CT images, the scanning range of X-ray is reduced, which will further increase the difficulty of image processing. So we proposed a GANs-based model for inpainting CT images in the composite case of low-dose imaging and limited-angle imaging—LDLAIM (Low-dose imaging and Limited-angle imaging inpainting Model). The proposed model consists of a generator and a discriminator. The generator is used to inpainted the input image, reduce noise and artifacts, and generate high-quality CT images. The discriminator is used to distinguish the authenticity of the input image.
Our work has two important innovations. First, we use limited-angle imaging technique for low-dose CT images, demonstrating that this technique can further reduce the radiation dose during scanning; Second, compared with other existing algorithms, the inpainting effect of LDLAIM on CT images in the composite case of low-dose imaging and limited-angle imaging is better than some state-of-the-art models on low-dose CT images.
The remaining part of the article is organized as follows: Section 2 introduces datasets and methodology of this work included the preprocessing of dataset and the details of network. Section 3 gives the computed results of this method. In Section 4, we compared and discussed the result of present algorithm with another’s work and finally, the work concluded in Section 5.
Materials and methods
Dataset
In this work, we used three different high-quality CT image sets to evaluate the performance of the proposed method. As shown in Fig. 1, these three datasets have very different characteristics.
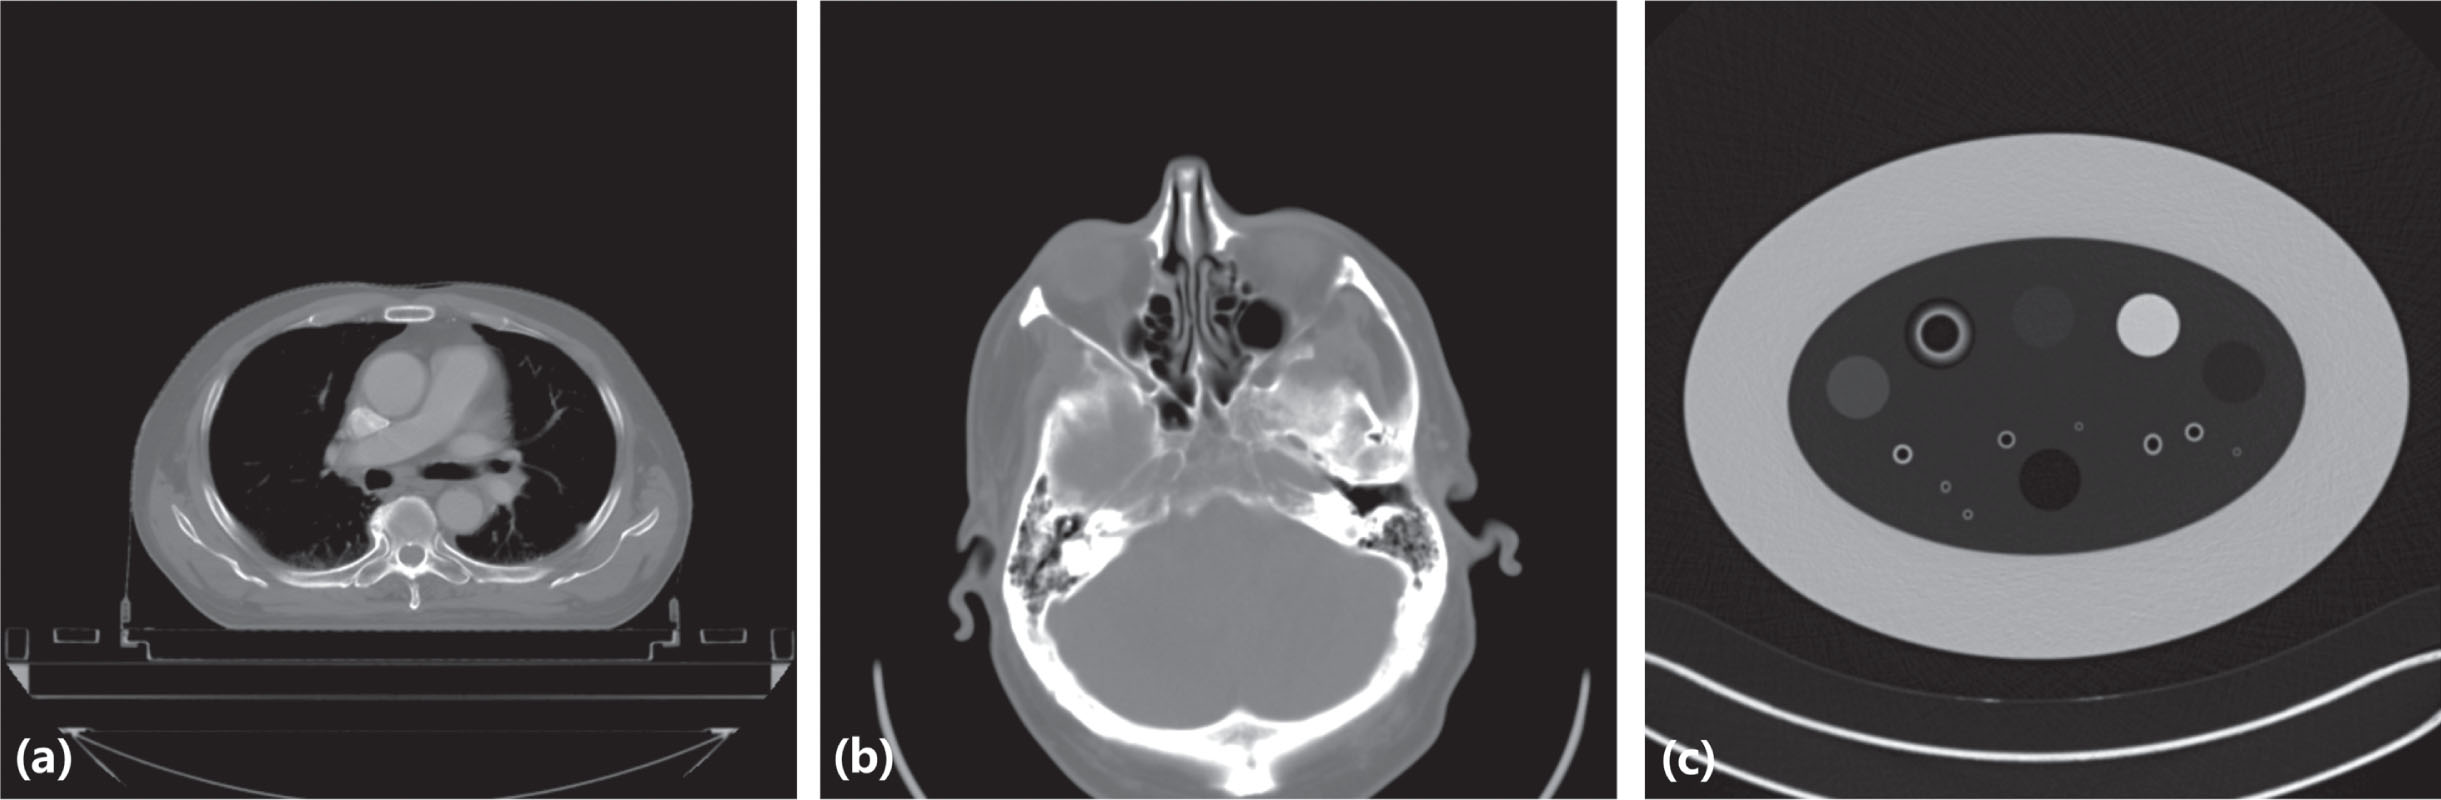
(a) The image of chest and abdomen dataset. (b) The image of chest and head dataset. (c) The image of phantom dataset.
Chest and abdomen dataset: This dataset is from Hefei Cancer Hospital, Chinese Academy of Science, Hefei, Anhui, China. This dataset contains 56 clinical chest and abdomen cases, we used these data to train our network, all cases are randomly divided into training cohort, validation cohort and test cohort, and the training cohort contains 44 cases, the validation cohort contains 6 cases and the test cohort contains 6 cases. Each case in this dataset was acquired with a PHILIPS Brilliance Big Bore CT system. The CT scans were performed at tube voltage of 120 kVp and exposures from 300 to 350 mA. The other scanning parameters were exposure time from 800 to 1090 ms, slice thickness of 0.5 mm.
Head dataset: This dataset is the part of 2016 NIH-AAPM-Mayo Clinic Low Dose CT Grand Challenge which is authorized by Mayo Clinic [42]. This dataset contains 50 head cases, 40 cases data was randomly selected into the training cohort, and 10 cases data was randomly selected into the validation and the test cohort, each cohort contains 5 cases. This data was acquired with a Siemens Somatom Definition Flash CT system. The CT scans were performed at tube voltage of 120 kVp and exposures from 248 to 343 mA. The other scanning parameters were exposure time is 1000 ms, slice thickness of 0.5 mm.
Phantom dataset: In this study, our phantom dataset is from “Extensible Neuroimaging Archive Toolkit-XNAT" [43]. The scan object for these data was COPDGene Phantom II of the Phantom Laboratory. All data were randomly assigned into the training, validation and test cohort, and the training cohort contains 16 cases and the validation cohort contains 3 cases and the test cohort contains 3 cases. More CT scanner details and image acquisition parameters can be find in Reference [43].
Take the chest and abdomen data as an example, in this work, we first needed to obtain low-dose CT data, so we translated the original image (Fig. 2(a)) through the radon transform of parallel beam projection to get its projection data, then noise is added to the projection data according to the method in Reference [44], to synthesize low-dose CT with a dose of 25% and 17% of the original data, as shown in Fig. 2(b) and Fig. 2(c). Next, the radon transform of parallel beam projection is used to translate the image with 25% dose, and its projection data can be obtained, as shown in Fig. 2(e). The spiral CT scan dose can be expressed as CTDI
vol
[45]:
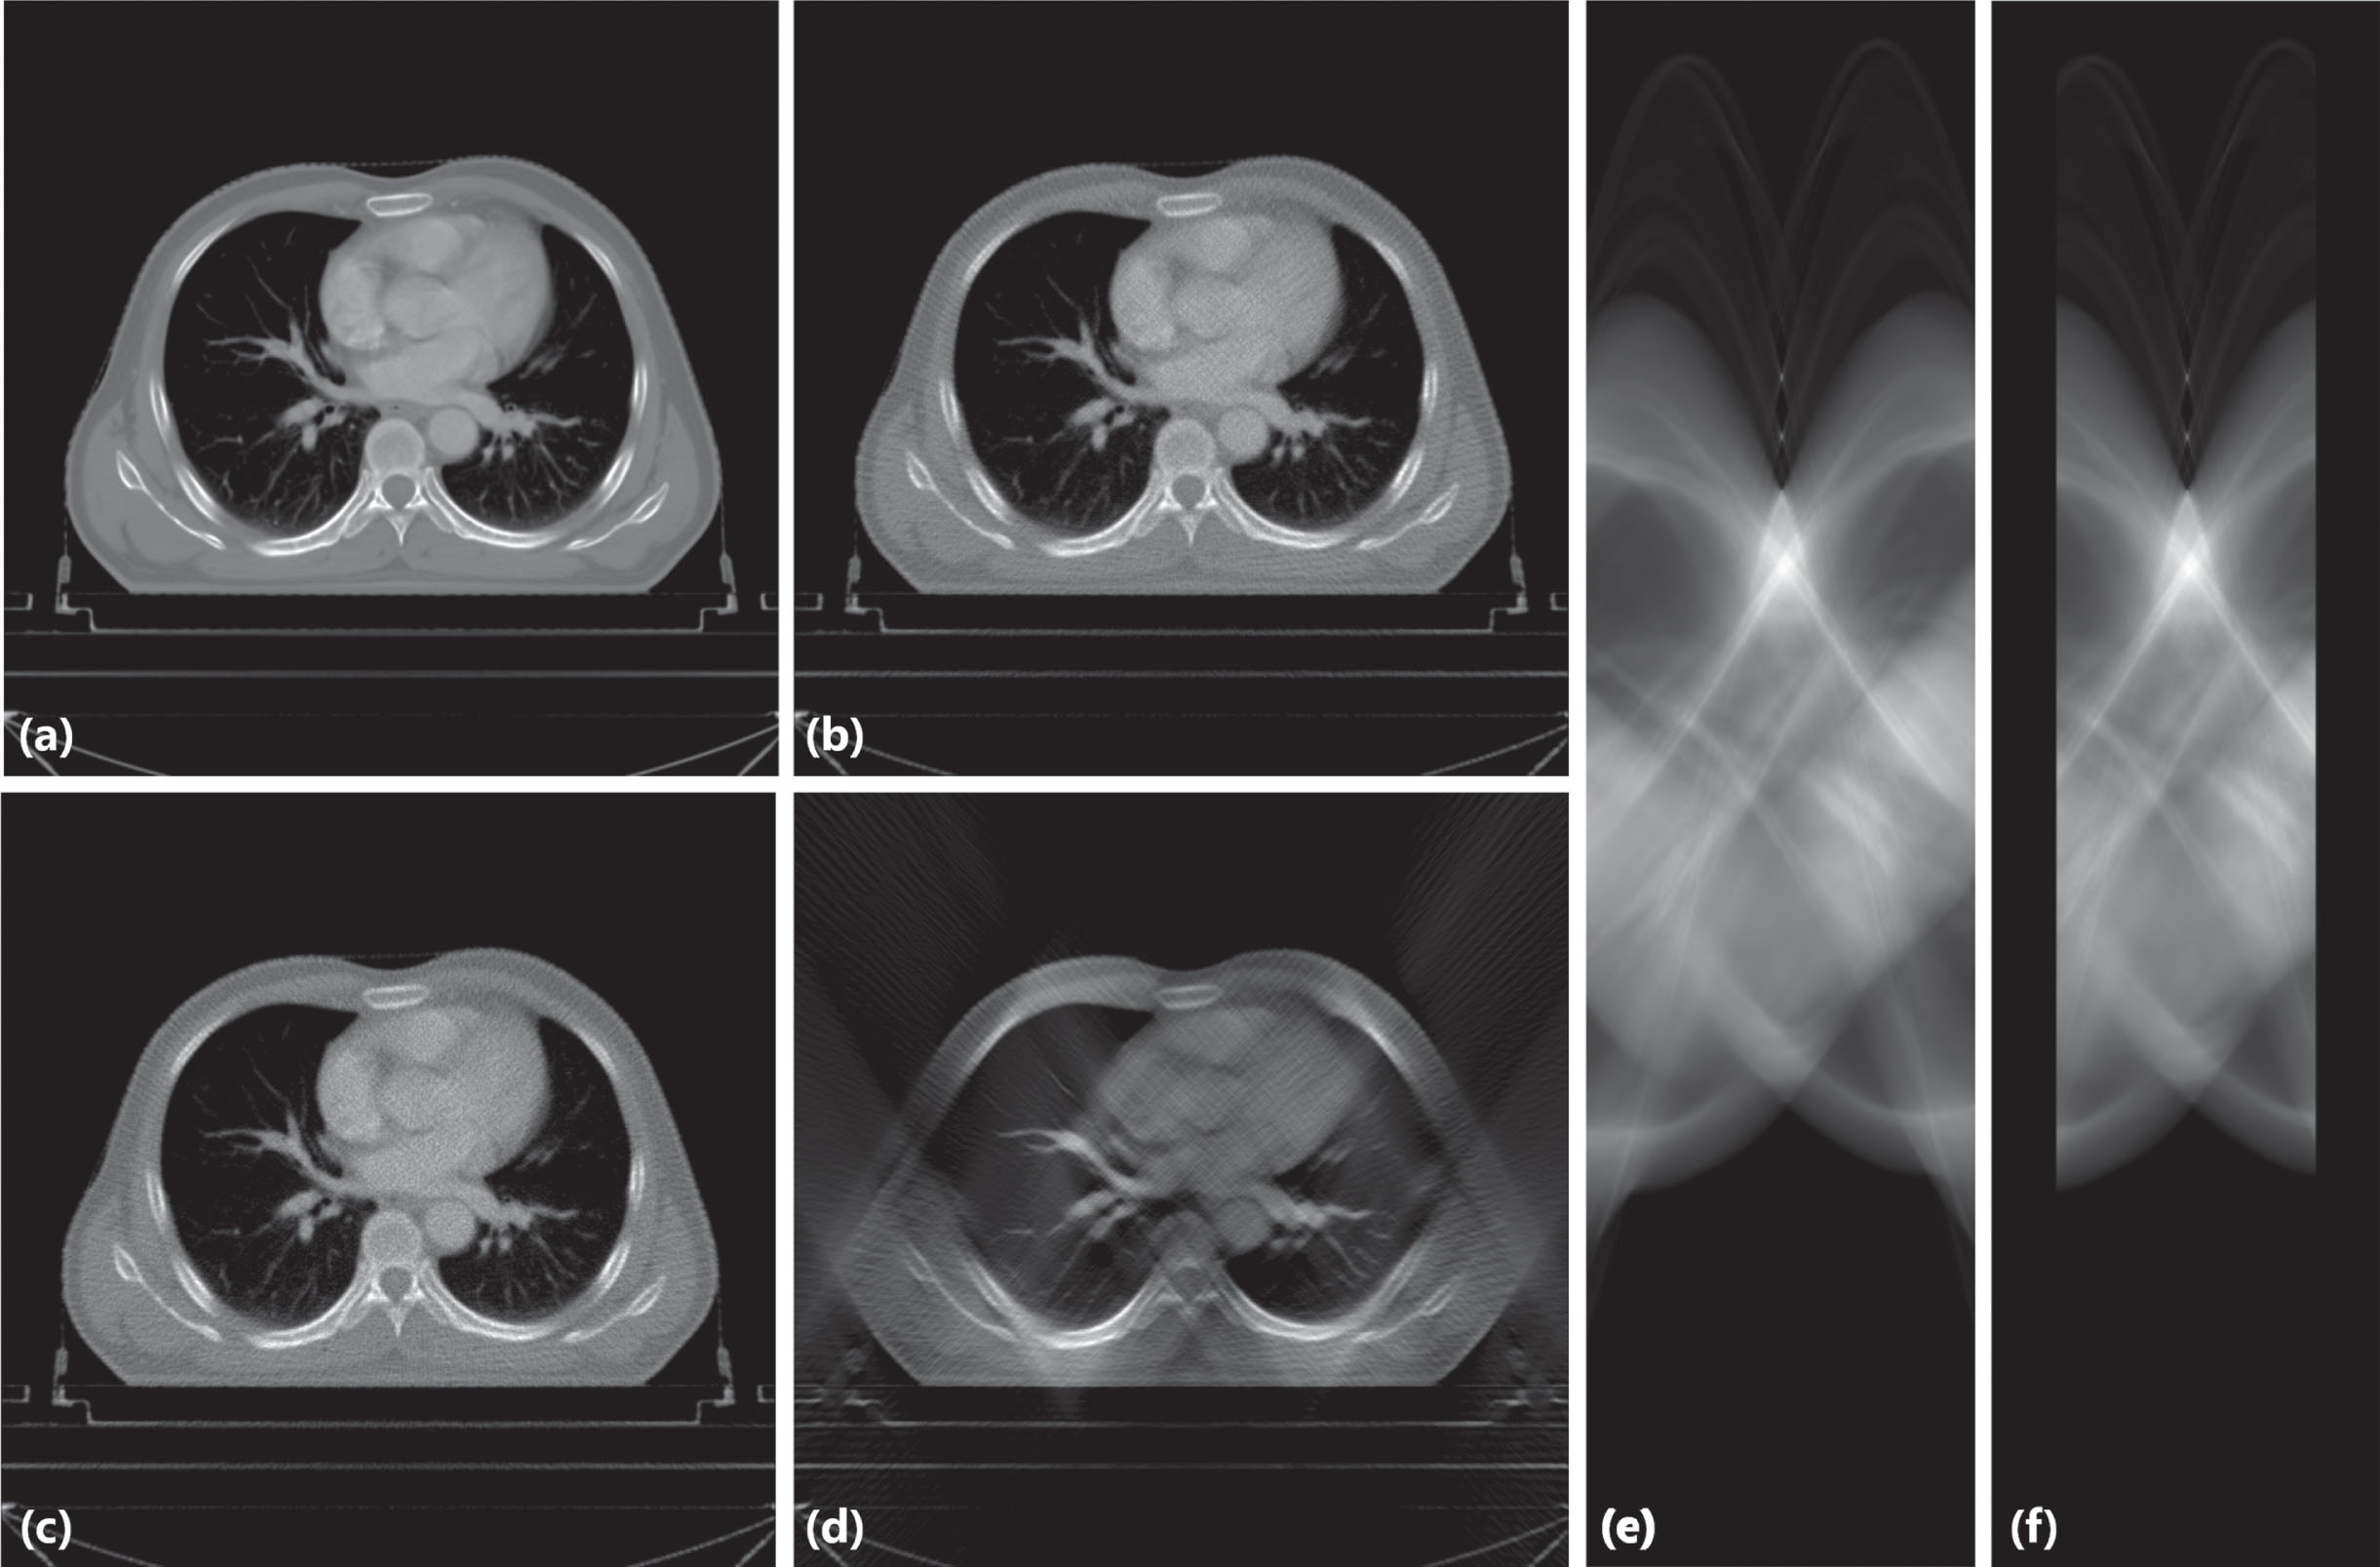
(a) The original image. (b) The low-dose CT with a dose of 25% of the original data. (c) The low-dose CT with a dose of 17% of the original data. (d) The image is translated by inverse radon transform of the parallel beam projection from (f). (e) The sinogram of (b). (f) The sinogram of (e) at
where, N represents the number of slices produced by one rotation scan; T represents the thickness of the scanned slices, d represents the distance that the X-ray tube moves per rotation of the examination table; CTDI
w
is the weighted CT dose index. CTDI
w
[45] can be expressed as the following:
where, CTDI100[45] is the most basic characterization quantity used to reflect the CT scan dose characteristics, C represents the radiation dose measurement at the center of the phantom, and P represents the average of the radiation dose measurements at four different locations around the phantom. And CTDI100 can be expressed as the following:
where T is the slice thickness, N is the number of scanning slices, and D is the dose distribution. According to equation 1, if the projection angle is reduced, the radiation dose will also be proportionally reduced, which can be expressed as the following:
When preprocessing the chest and abdomen data, we set the projection data at
Since the format of the original CT data is 16-bit Digital Imaging and Communications in Medicine (DICOM), directly processing the data in this format and then inputting them into the network will greatly increase the time required for training, so we use the windowing process commonly used in medical image processing. The processing method converts data in DICOM format into 8-bit portable network graphics (PNG) images according to parameters such as window center and window width, and uses these images for training.
In this work, the proposed LDLAIM is a generative adversarial network-based model, so its structure is the same as other GANs models, and it also includes a generator and a discriminator, which can be expressed as:
Where

The architecture of LDLAIM.
The generator of LDLAIM is mainly composed of several residual blocks and an encoder and decoder. First, input the 8-bit PNG format image into the network, it goes through a convolutional layer with 32 channels followed by a batch normalization layer and a PReLU activation function [46]. After this convolutional layer, the input image will have more channels, and its size will not be changed, which can make the subsequent residual block easier to play the role of denoising. After PReLU are two residual blocks, and the architecture of each residual block is shown in Fig. 4(a). In this paper, the residual block can be defined as:
Where m and n are the input and output of the residual block. The function
The encoder-decoder part is a continuous process without additional operations, so encoder and decoder can be defined as y = h (x) and y = g (x), respectively. Therefore, the generator can be fully represented as:
Here x and y represent the input and the output of the generator, respectively. In the parts of encoder-decoder, the encoder is composed of five encoder blocks, each of them consists of a convolution layer, a batch normalization layer (after first convolutional layer without batch normalization layer) and a Leaky RELU [48] activation function, its architecture is shown in Fig. 4(b). The number of convolutional channels were 64, 64, 128, 256, 512, respectively, with kernel size of 3 × 3, stride of 1 and padding of 1. After encoder, a 1 × 1 convolutional layer with stride 1 and 4000 channels was employed to connect with encoder and decoder. This layer can be used to propagate information within activations of each feature map [27]. The process of decoding is almost the reverse process of encoding, in order to restore the size and channels of the image to the state of the input. Decoder consists of five decoder blocks, each of them with an up-convolutional layers [49, 50], a batch normalization layer and a Rectified Linear Unit(ReLU) activation function [51]. The architecture of the decoder block can be shown in Fig. 4(c). Up-convolution can be understood as a process of upsampling and then convolution [52]. The number of convolutional channels were 512, 256, 128, 64, 16, respectively, with kernel size of 3 × 3, stride of 1 and padding of 1. Subsequently, we employed a convolutional layer with 1 channel and a Tanh activation function.
In the discriminator, we employed five convolutional layers each of followed by an instance normalization [53] and a Leaky ReLU activation function (first convolutional layer without instance normalization and the last convolutional layer without instance normalization or activation function). A convolutional layer, an instance normalization and a Leakey ReLU constitute a discriminator block, its architecture can be shown in Fig. 4(d). The number of convolutional channels were 64,128,256,512,1,respectively, with the kernel size of 3 × 3, the stride of 2,2,2,1,1, respectively.

(a) shows the architecture of residual block. (b) shows the architecture of encode block. (c) shows the architecture of decode block. (d) shows the architecture of descriminator block.
In order to ensure that LDLAIM can have better ability to generate images and restore details, and the generated images have better visual effects, the loss of the generator can be expressed as least absolute deviations (LDA) weighted with a control parameter λ1 between the output of the generator and the ground-truth image, summed with the mean square error(MSE) between the discriminator’s decision using the generator output and the adversarial ground-truth with another control parameter λ2. This function can be described as the following:
where G loss is generator loss, λ1 and λ2 as different control parameters, in this work, we set λ1 = 0.999 and λ2 = 0.001. LDA{ Gen, Truth } is the LDA between the generator output and the ground-truth image, MSE{ Disc, Valid } is the MSE between the discriminator’s decision using the generator output and the adversarial ground-truth.
Evaluations
In this work, structural similarity index (SSIM)[54], peak signal-to-noise ratio (PSNR)[55] and root mean square error (RMSE)[56] are used to evaluate the similarity between the results from a given methods and the ground-truth.
In addition, two radiologists were asked to independently evaluate 20 groups of images restored by different methods in terms of noise suppression, artifact correction, detail restoration and comprehensive quality on a five-point scale (1 is the worst, both of 1 and 2 are unacceptable for diagnostic interpretation; 5 is excellent, 3,4 and 5 are acceptable for diagnostic interpretation; each image as ground-truth will be used as a benchmark, so their comprehensive quality scores are 5). Each group contains contained 7 images (ground-truth and six images processed by different methods) of the same image slice.
Experimental setup
In this work, we use different datasets to validate the inpainting performance of the proposed method on low-dose limited-angle CT images, these datasets contain CT data of human chest, abdomen, head and phantom, and they are collected from different brands of CT systems. In the process of data preprocessing, we first generate a low-dose CT image, and on this basis, we delete some data on the CT projection data to obtain a lower-dose CT image, and use inverse radon transform to obtain low-dose limited-angle CT images (Fig. 2(d)). At the same time, noise will continue to be added to the synthesized low-dose CT image to synthesize a low-dose CT image with the same dose as the limited-angle data, as shown in Fig. 2(c). To further demonstrate the performance of our method, we quantitatively compared our result with different algorithms, including three traditional methods: median filtering[57], total variation(TV) method[58], algebraic reconstruction techniques(ART)[59] and two deep learning algorithms: DnCNN[60] and FBPConvNet[61]. By comparing Fig. 2(c) and (d), it can be found that although the doses of these two groups data are same, the restoration difficulty of the data used by LDLAIM is significantly higher than that of the CT data used by several other methods.
In this work, we trained all networks in a desktop machine with the following configuration: 12th Gen Intel(R) Core(TM) i9-12900KF CPU 3.19 GHz processor with 32GB RAM, NVIDIA GeForce GTX 3090 24GB GPU processor, and Windows 10Professional operating system. The code was implemented with MATLAB R2019b (data preprocessing), Python 3.6 and PyTorch 1.7.1(LDLAIM training). During the training stage, we set the batch size to 4 and use the Adam optimizer with 2 × 10⁻⁴ learning rate to minimize the objective function. According to the size of the dataset, the number of different training epochs are set for the three datasets, the number of training epochs of chest and abdomen dataset, head dataset, phantom dataset are 60, 150 and 300, respectively.
Quantitative results
Experimental results on chest and abdomen dataset
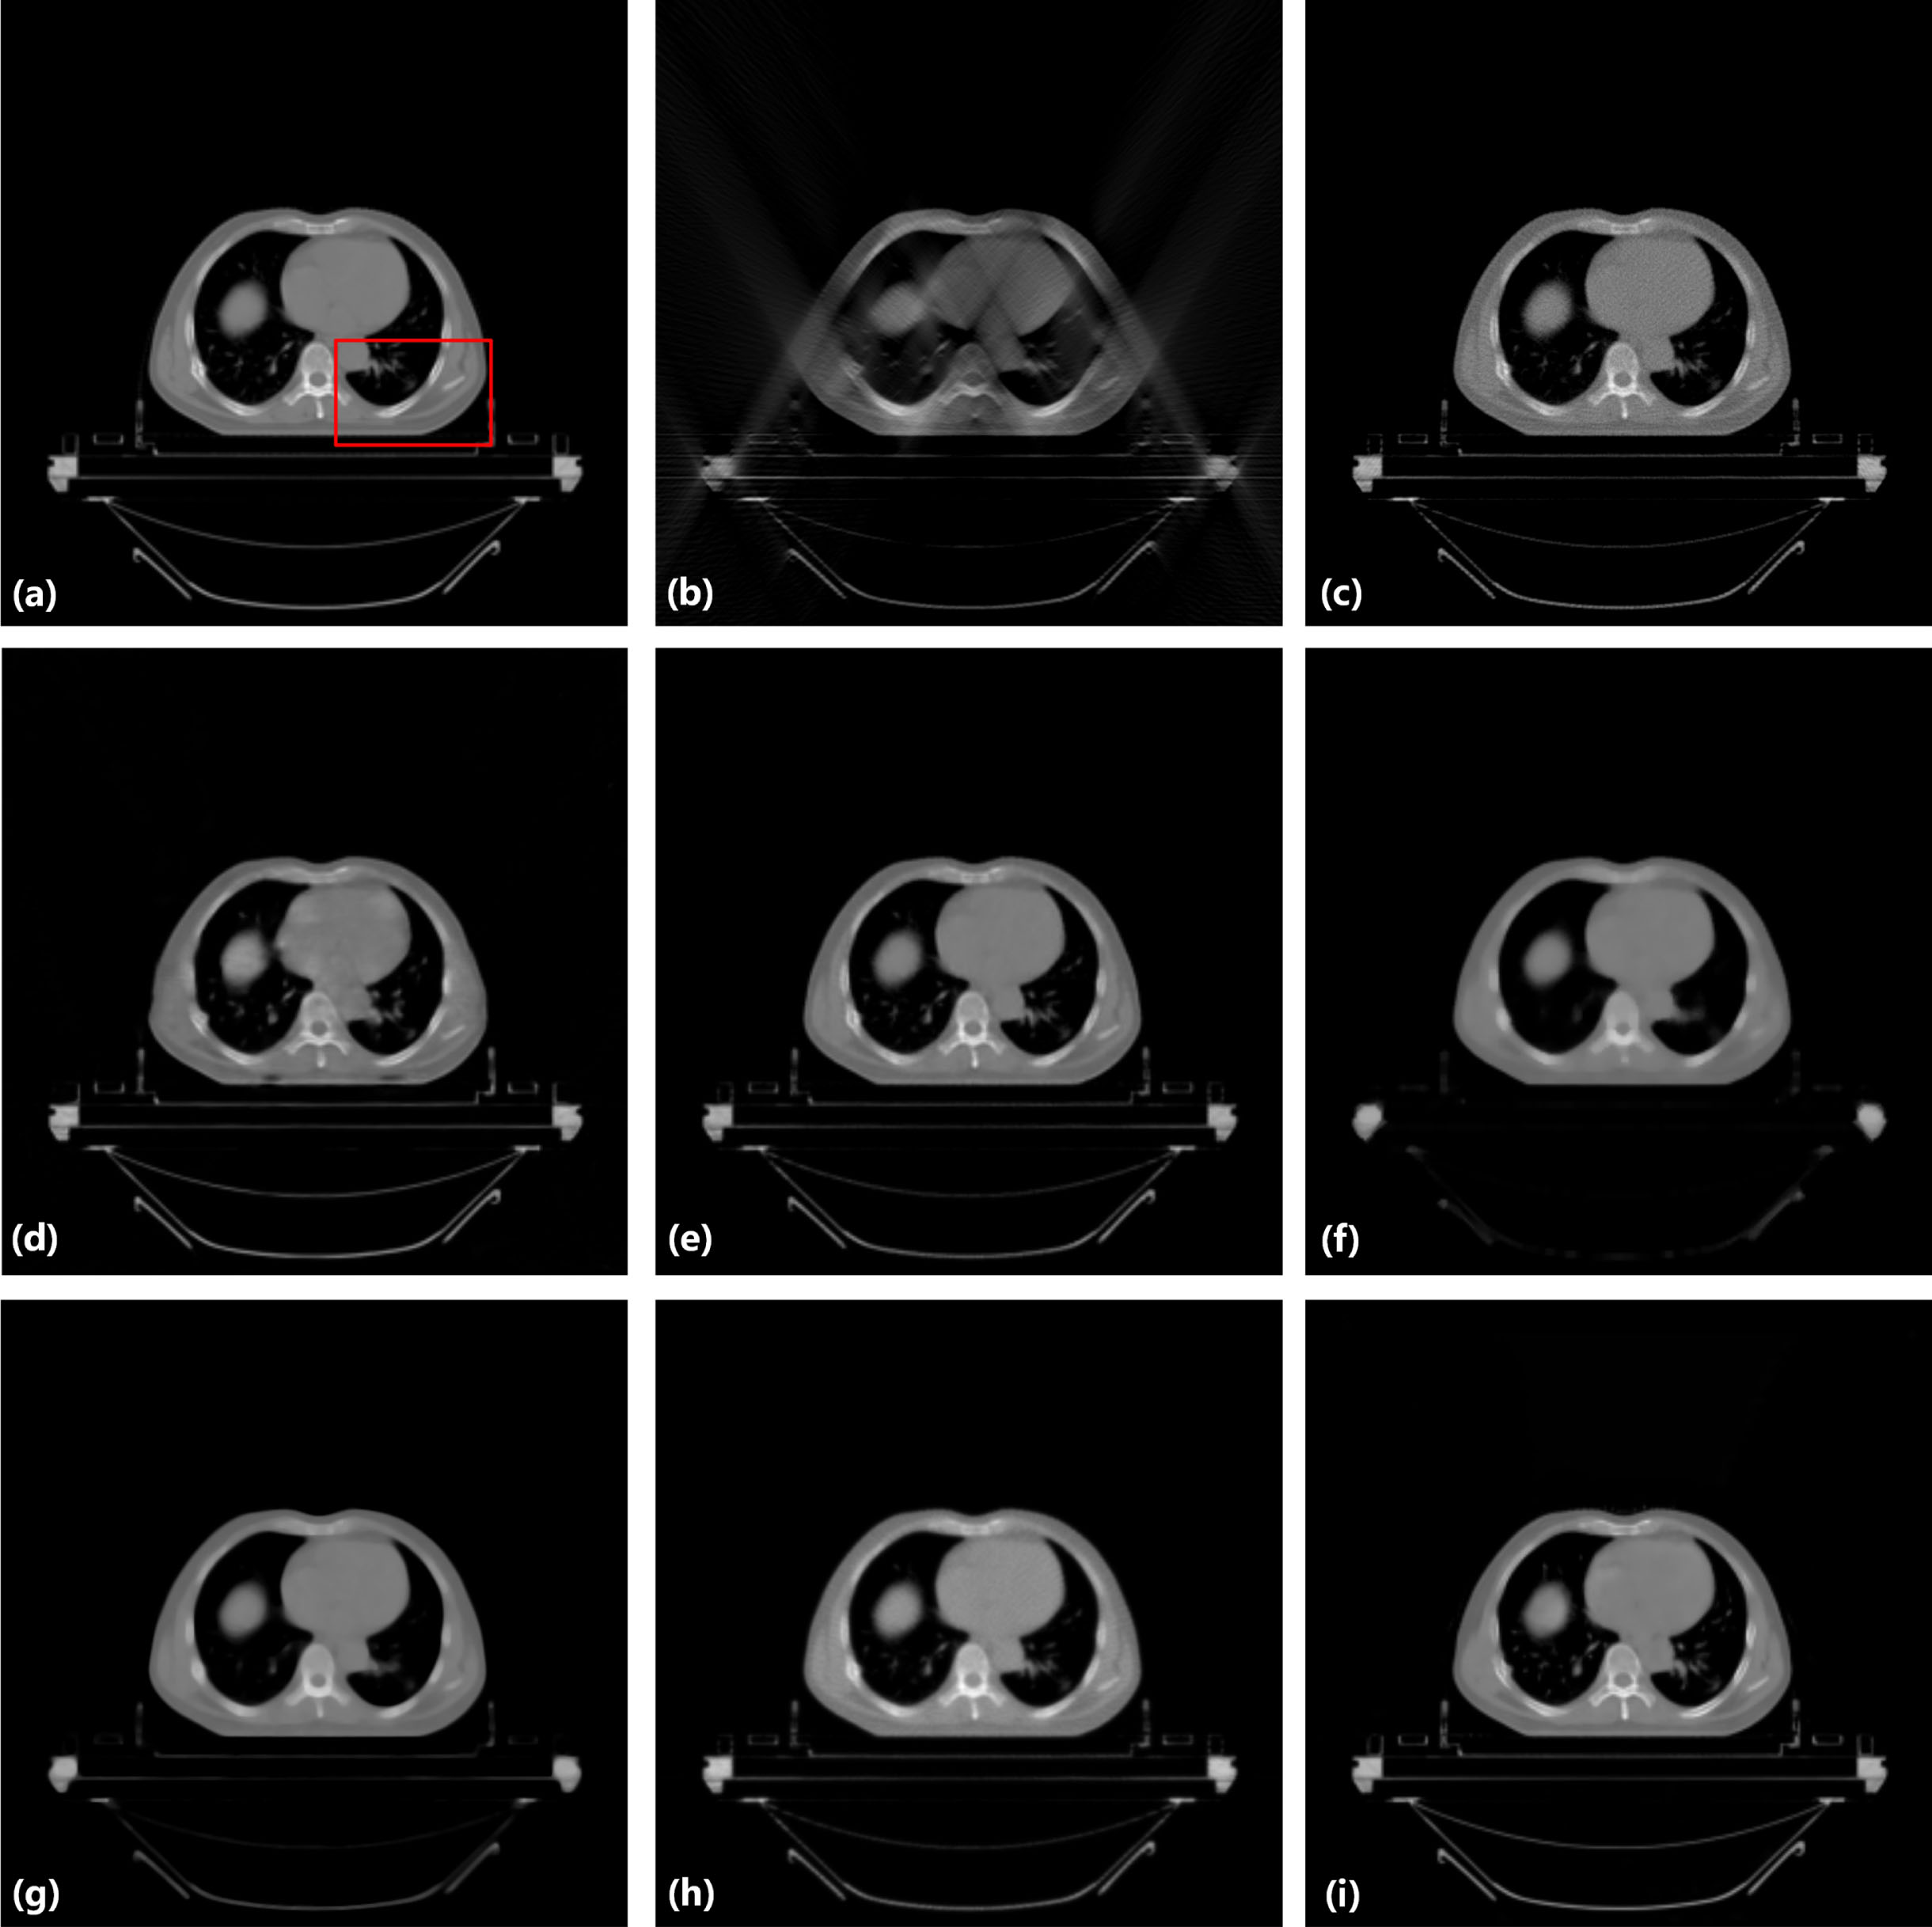
In this section, the restored images of chest and abdomen dataset by different methods are shown in Fig. 5 and Fig. 7. In each image, (a) is an example ground-truth of CT slice from the test cohort; the input of the LDLAIM is shown in (b); the input of other methods is shown in (c); from (d) to (i) are shown the results of DnCNN, FBPConvNet, median filtering, TV, ART and LDLAIM, respectively. Fig. 6 and Fig. 8 are shown the zoomed images over a region of interest (ROI) in Fig. 5 and Fig. 7. In order to evaluate the effect of these methods on the repair of the ROI area, we selected a ROI area for each case in the testing cohort, quantitatively analyzed the restoration results of the various methods on this area, and calculated the SSIM, PSNR, RMSE between the area and the ground-truth, the results are shown in Table 1. To further show the results of various algorithms, the absolute difference images relative to the original image is shown in Fig. 9.
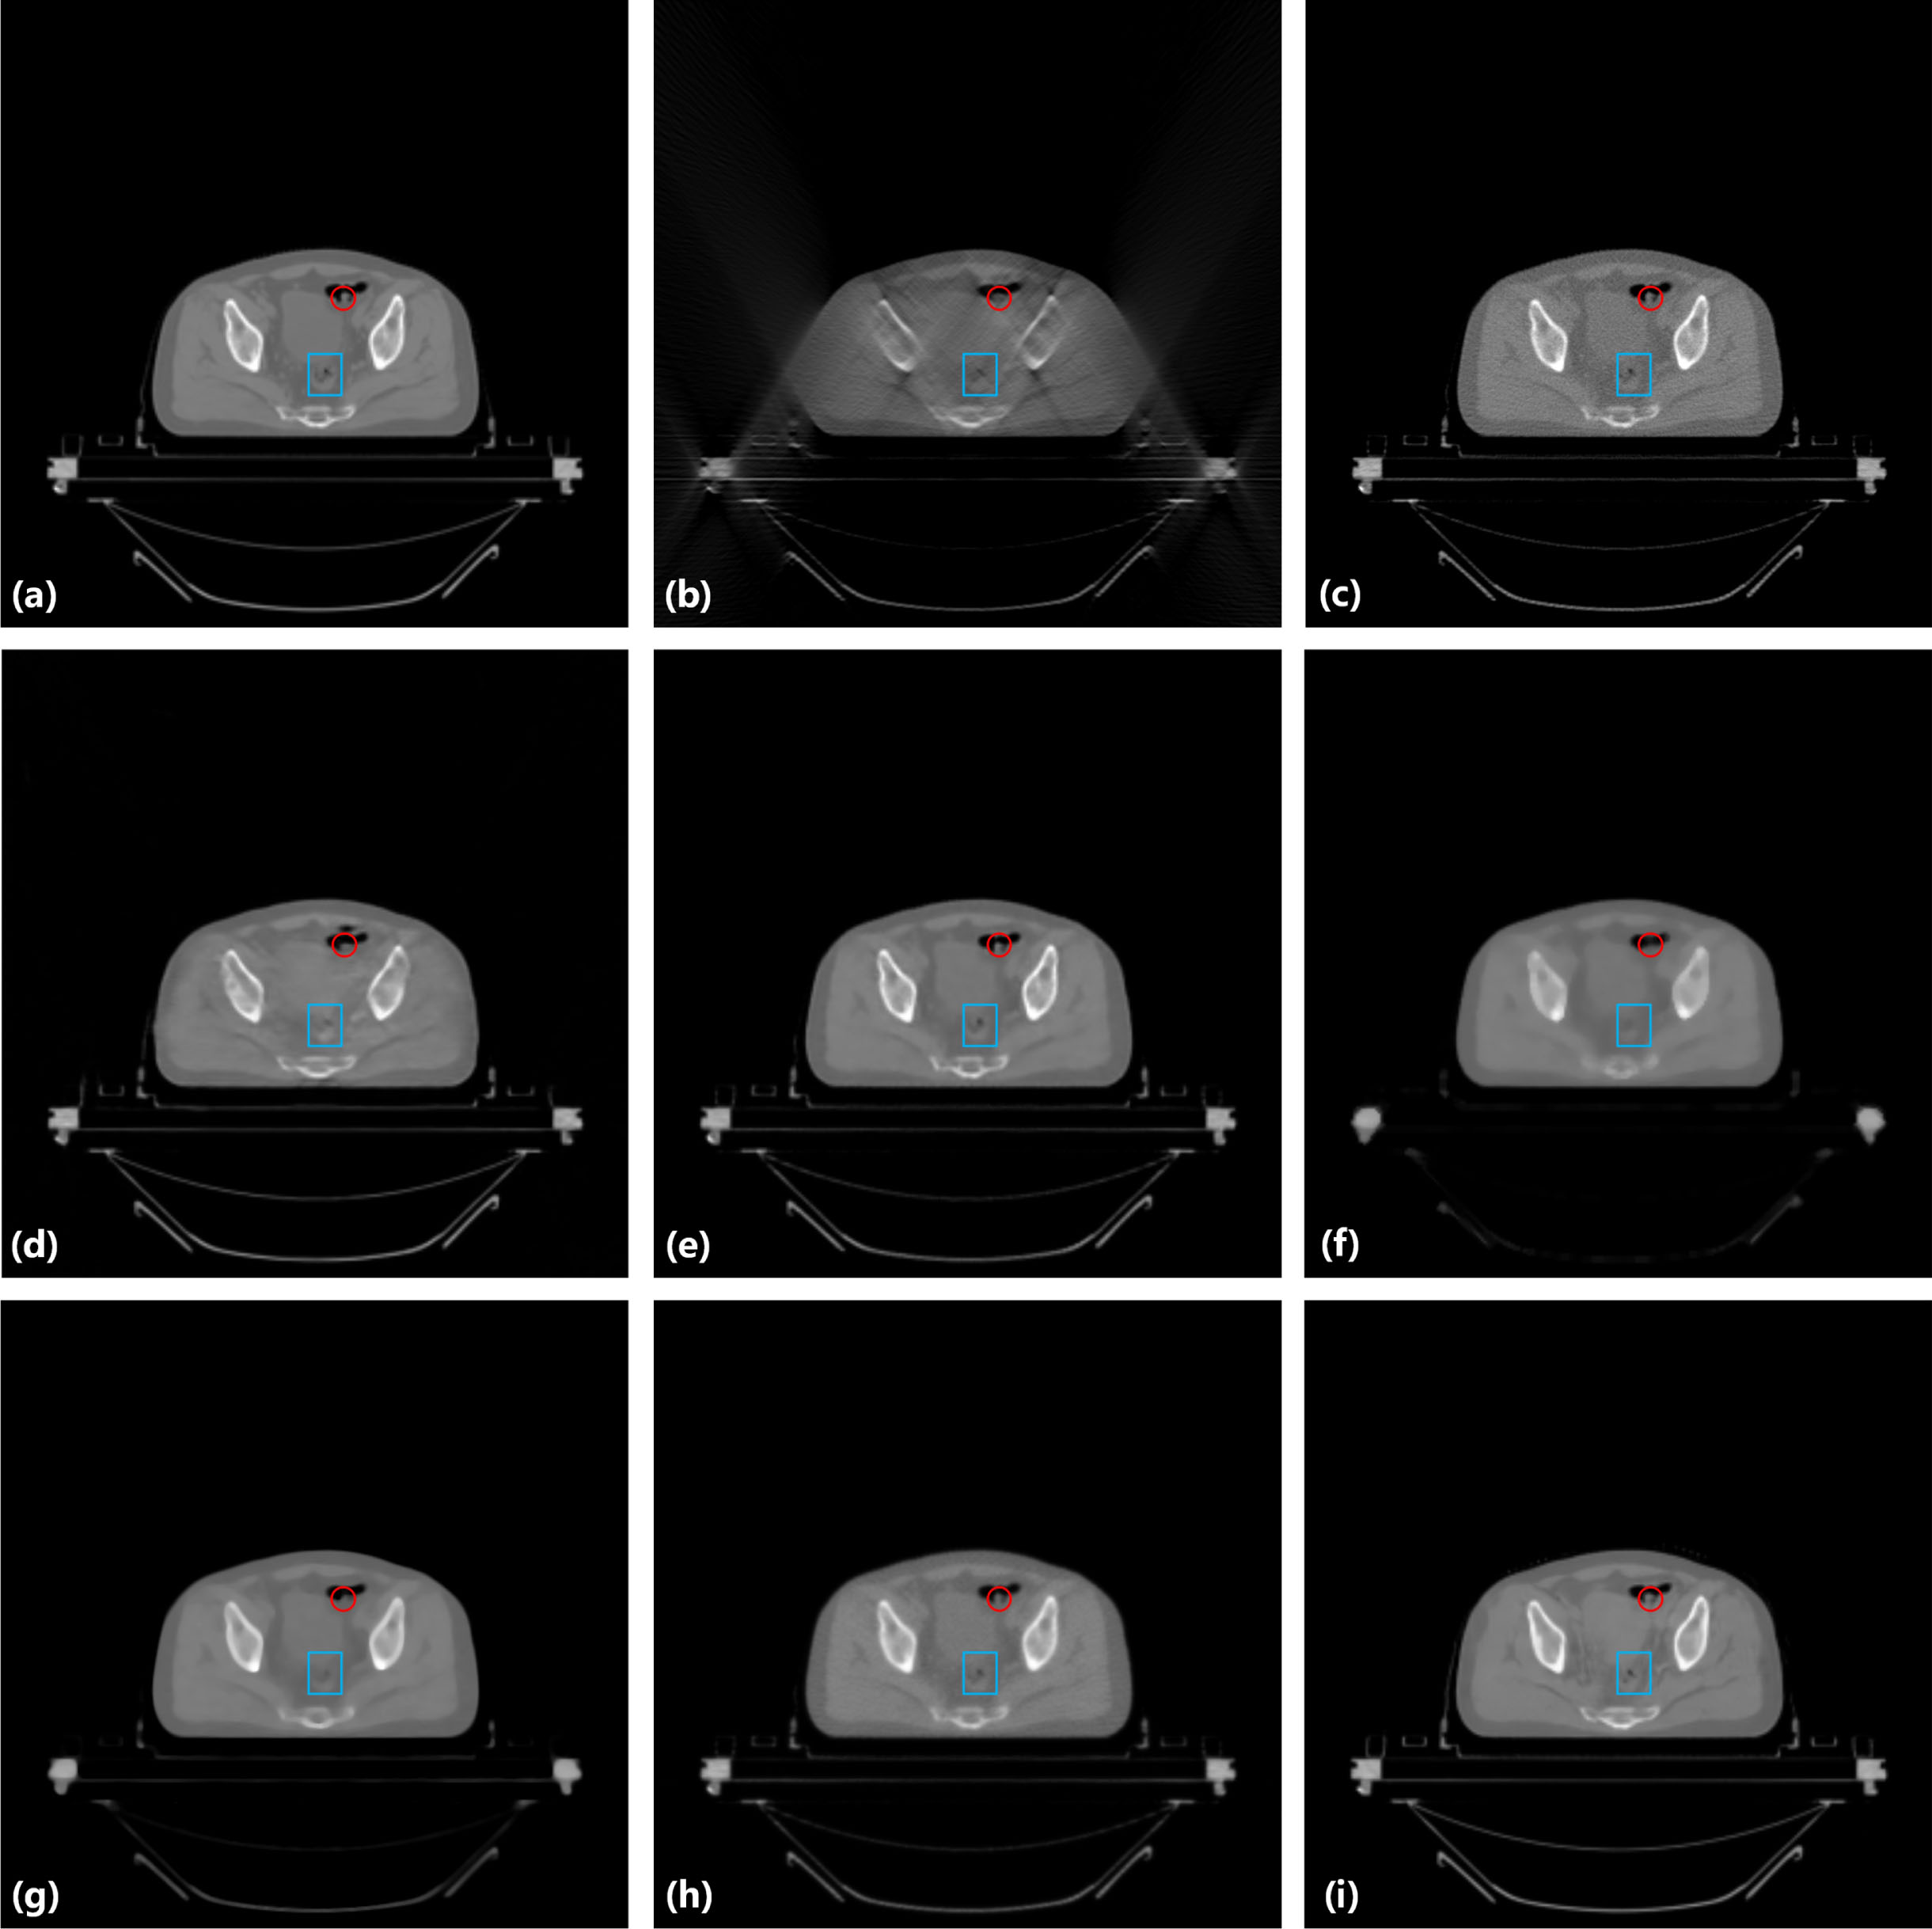
Result from the hip image for comparison. (a) the original image, (b) the input image of LDLAIM, (c) the input image of other methods, (d) the result of DnCNN, (e) the result of FBPConvNet, (f) the result of median filtering, (g) the result of TV, (h) the result of ART and (i) the result of LDLAIM. The red and blue boxes indicate the regions zoomed in Fig. 6.
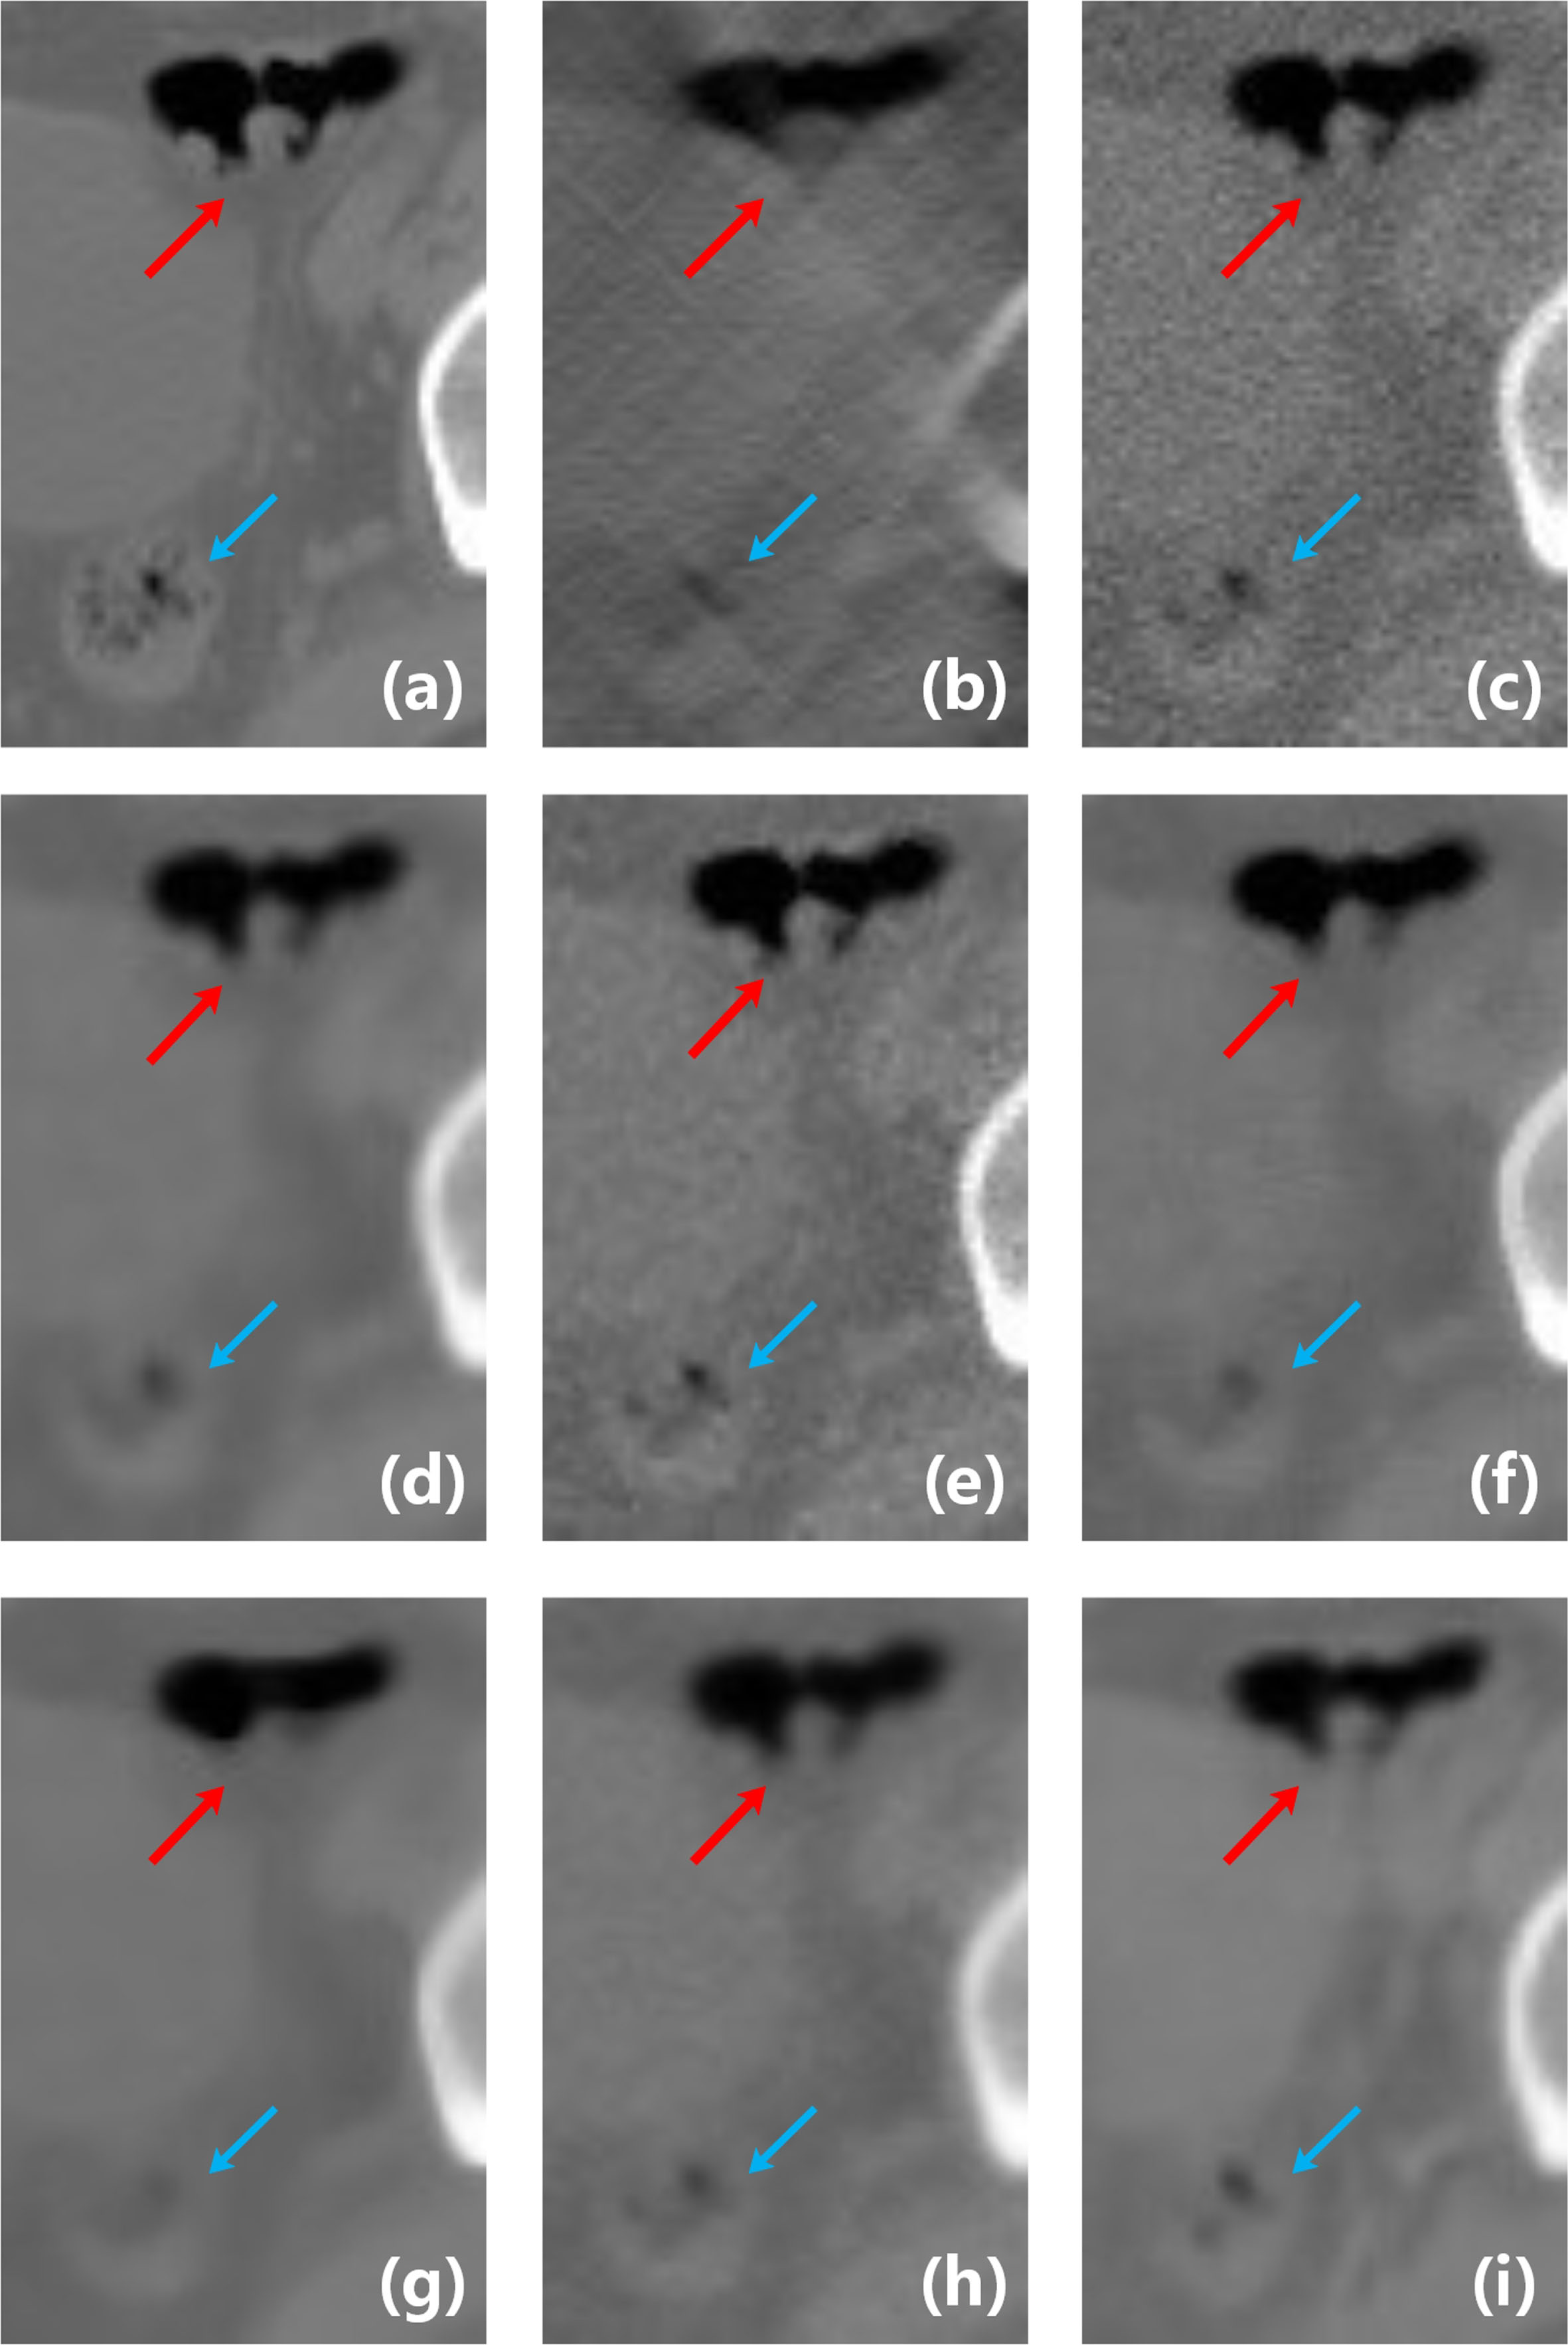
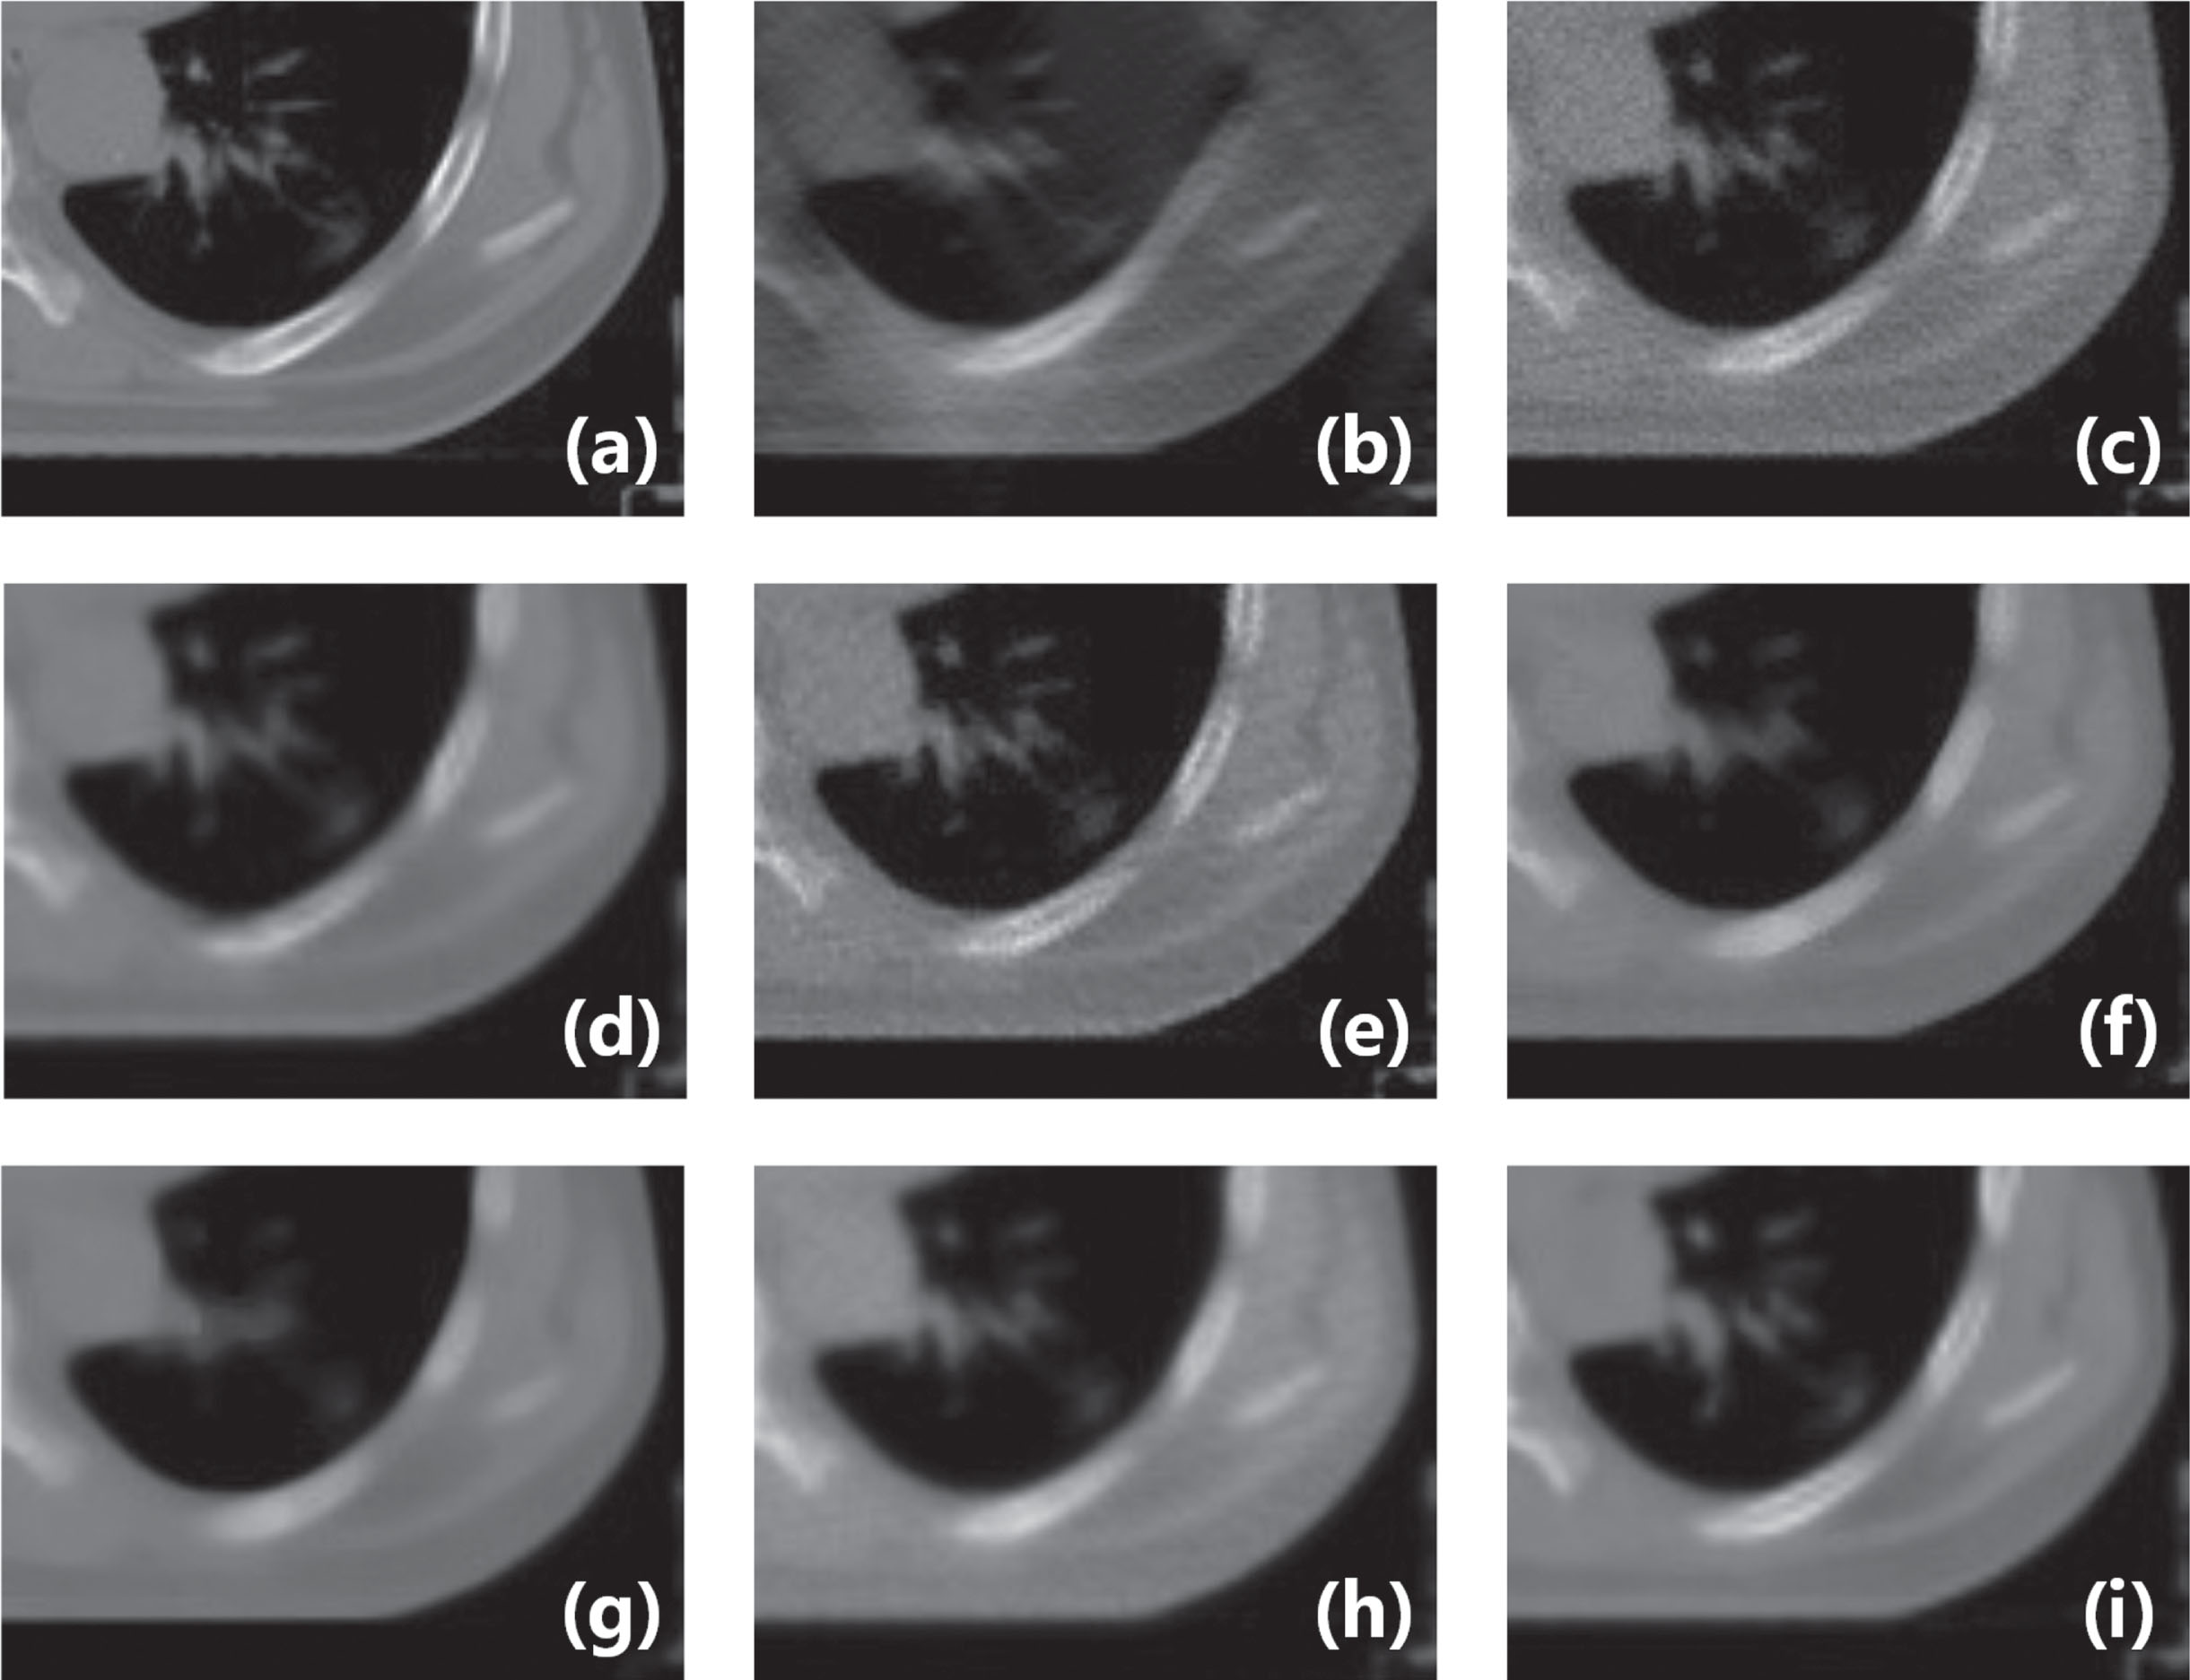
Zoomed parts over the region of interest (ROI) marked by the red and blue boxes in Fig. 4(a). (a) the original image, (b) the input image of LDLAIM, (c) the input image of other methods, (d) the result of DnCNN, (e) the result of FBPConvNet, (f) the result of median filtering, (g) the result of TV, (h) the result of ART and (i) the result of LDLAIM. The red and blue arrows indicate two regions for visual differences.
Result from the chest image for comparison. (a) the original image, (b) the input image of LDLAIM, (c) the input image of other methods, (d) the result of DnCNN, (e) the result of FBPConvNet, (f) the result of median filtering, (g) the result of TV, (h) the result of ART and (i) the result of LDLAIM. The red box indicates the region zoomed in Fig. 8.
Zoomed parts over the region of interest (ROI) marked by the red box in Fig. 6(a). (a) the original image, (b) the input image of LDLAIM, (c) the input image of other methods, (d) the result of DnCNN, (e) the result of FBPConvNet, (f) the result of median filtering, (g) the result of TV, (h) the result of ART and (i) the result of LDLAIM.
In addition, we also counted the mean SSIM, PSNR and RMSE along with standard deviations, between the images restored by the different algorithms and the ground-truth in the testing cohort, and we also calculated the mean time for various algorithms to process an image the results are shown in Table2. Fig. 10 presents the results of two radiologists independently evaluated 20 groups of images restored by different methods in terms of noise suppression, artifact correction and detail restoration and comprehensive quality.
In this section, the results of restoring the head dataset using different methods are shown in Fig. 11. In Fig. 11, (a) is an example ground-truth of CT slice from the testing cohort; the input of the LDLAIM is shown in (b); the input of other methods is shown in (c); from (d) to (l) are shown the results of DnCNN, FBPConvNet, median filtering, TV, ART and LDLAIM, respectively. Table 3 shows the mean SSIM, PSNR and RMSE along with standard deviations, between the results in the testing cohort and the ground-truth.
Experimental results on phantom dataset
In this section, we performed ablation study on LDLAIM using phantom data. During the experiment, we deleted the discriminator of LDAIM, the residual blocks and the encoder-decoder in the generator, respectively. In the following we refer to these three ablation studies as ablation study I, ablation study II, and ablation study III, respectively.
The results of different comparison experiments and ablation studies are shown in Fig. 12. In Fig. 12, (a) is an example ground-truth of CT slice from the testing cohort; the input of the LDLAIM is shown in (b); the input of other methods is shown in (c); from (d) to (l) are shown the results of DnCNN, FBPConvNet, median filtering, TV, ART and LDLAIM, ablation study I, ablation study II, and ablation study III, respectively. Table 4 shows the mean SSIM, PSNR, RMSE along with standard deviations between the results in the testing cohort and the ground-truth. The average loss of each algorithm (including three ablation studies) in each training epoch is shown in Fig. 13.
The quantitative analysis results of ROI in chest and abdomen dataset testing set
The quantitative analysis results of ROI in chest and abdomen dataset testing set
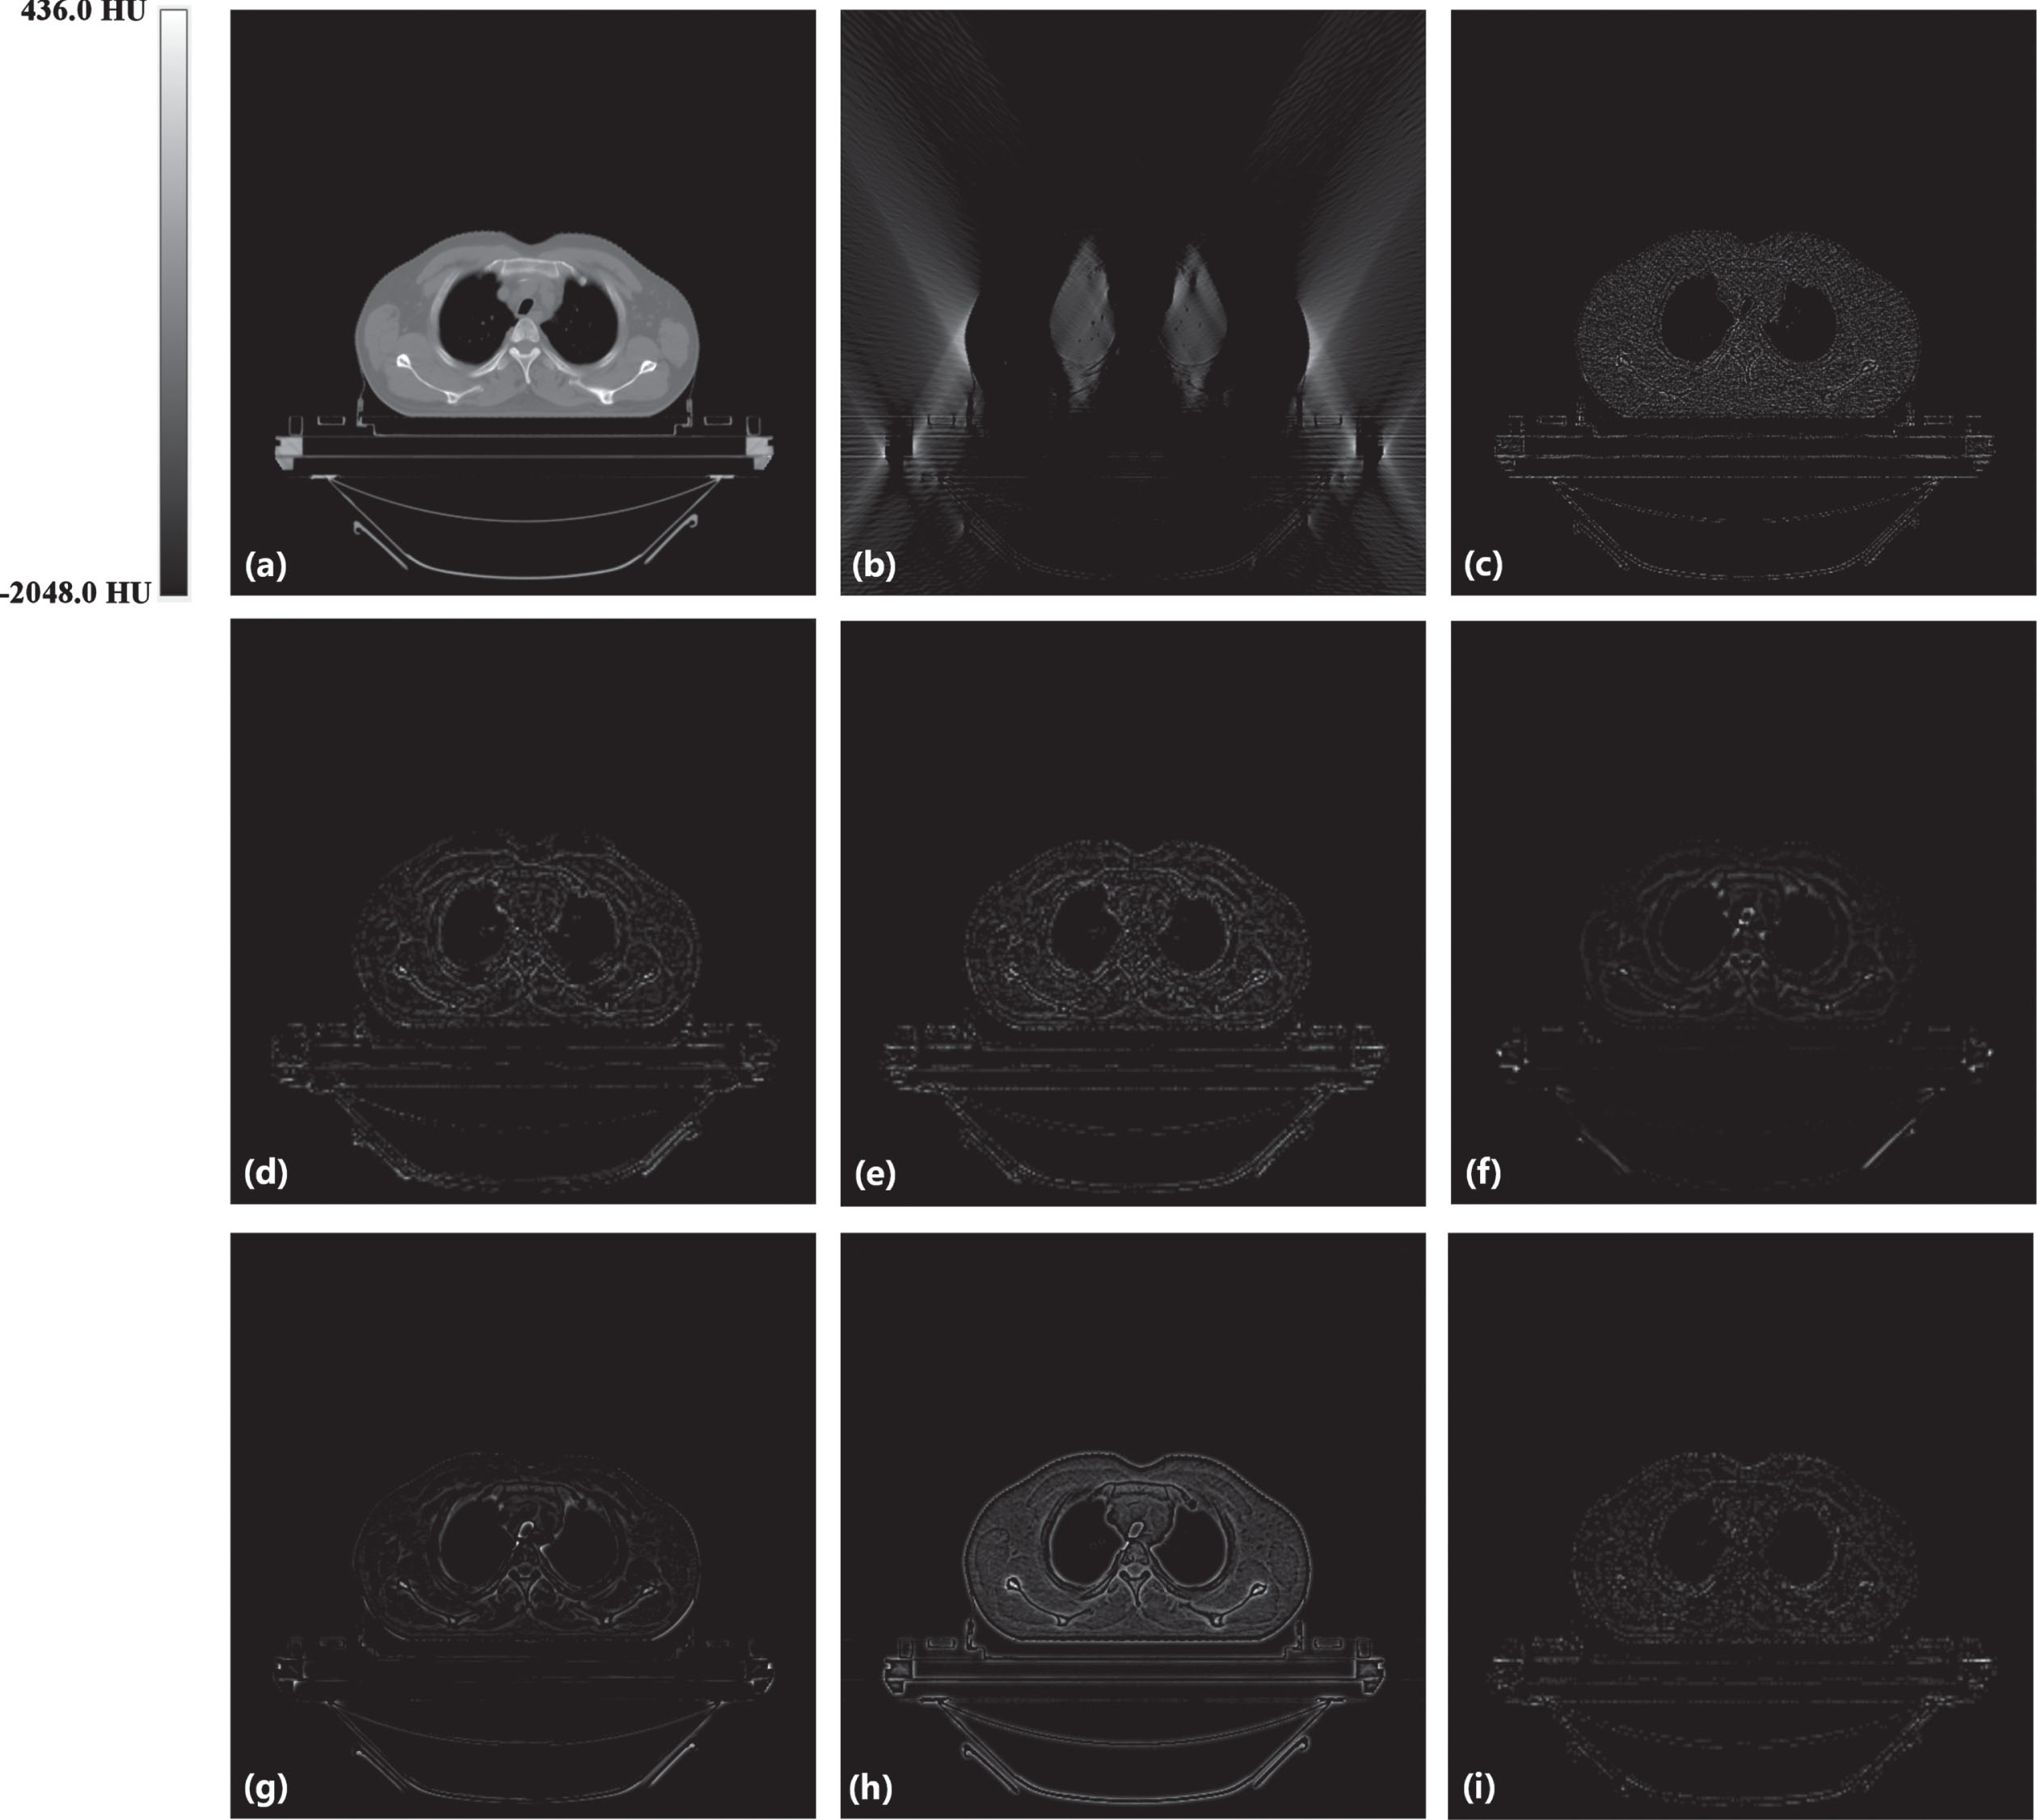
Absolute difference images relative to the original image. (a) the original image, (b) the input image of LDLAIM, (c) the input image of other methods, (d) the result of DnCNN, (e) the result of FBPConvNet, (f) the result of median filtering, (g) the result of TV, (h) the result of ART and (i) the result of LDLAIM.
This section evaluates the inpainting effect of LDLAIM on images in limited-angle imaging situations. We compare this result with that of other methods under the same radiation dose conditions. Fig. 5 shows our result from the hip image. As the input image, although Fig. 5(b) and (c) with same scan dose, but the image quality of Fig. 5(c) is better than that of Fig. 5(b), this means that Fig. 5(c) is easier to generate high-quality images. In other words, compared with other methods, LDLAIM has the greatest difficulty in recovering images. From Fig. 5(d) to (i), all the methods which are applied by us suppressed noise and reconstructed image to different degrees. In Fig. 5(d) and (f), DnCNN and median filtering smoothened many small structures in bladder. And other methods eliminated most noise and artifacts from input images, while restored the structural features better than the DnCNN and median filtering. More restored details are shown in zoomed image in Fig. 6. The red and blue arrows in the Fig. 6 mark the two segments of the large intestinal lumen. Since their gray values are too different from those of other tissues on the grayscale image, more attention should be paid on the boundary contour for them. In Fig. 6(d), (f), (g) and (h), the area marked by the red arrow is over-smoothed, and the outline changes significantly, especially the result of TV in Fig. 6(g), which smoothes most of the details in the image, making the outline of this area change significantly. However, FBPConvNet and LDLAIM are significantly better than other algorithms for the shape and contour recovery of the red arrow area, and even retain some features of the original image at the blue arrow area. But it is undeniable that although FBPConvNet has a good recovery ability for position information such as the contour boundary of the target area, this ability leads to the loss some ability of smoothing, so compared with FBPConvNet, the images generated by LDLAIM has better image quality. At the same time, by comparing the three indicators of SSIM, PSNR and RMSE in the zoomed area in Table1, we can find that the results of the three deep learning algorithms with higher SSIM, PSNR and lower RMSE, and the LDLAIM results are slightly better than DnCNN and FBPConvNet. Therefore, both visual effects and quantitative analysis results show that LDLAIM can better restore the structural information of images and generate images that are closer to ground-truth.
Fig. 7 shows our result from the chest image. Fig. 7(d) to (i) show the results of six methods. In Fig. 7(d) DnCNN changes the shape of the heart and liver in the image and creates new holes in the soft tissue of the back. In Fig. 7(f) and (g), median filtering and TV over-smooth the image, resulting in almost all tiny lung-marking being removed as noise. In this image, we have zoomed the left side of the ribcage(red box area in Fig. 6(a)), which includes the left ribs, lung marking, and some soft tissue, the zoomed image as shown in Fig. 7. Observing Fig7(c), (e) and (h), it is not difficult to find that FBPConvNet and ART have insufficient suppression of noise, and the strip artifacts in Fig7(c) still exist on the image; and the streak artifacts in Fig7(c) still exist on these images; after zooming in these result images, it can be found that median filtering and TV have changed the shape of the tiny lung-marking, making it lose its original features. By comparison, it can be found that the image processed by LDLAIM not only removes artifacts and suppresses noise caused by the lack of projection angle, but also retains the structural information of each tissue, completely restores the image, and makes reconstructed image most similar to the ground-truth.
In Table2, we quantitatively analyze the data in the whole test cohort. The average SSIM of LDLAIM is 0.984, which is 1.3% and 1.9% higher than the results of FBPConvNet and DnCNN respectively, and is significantly higher than other algorithms. The average PSNR of LDLAIM is 35.385, which is 6.6% and 15.2% higher than the results of DnCNN and TV, respectively, and only slightly lower than that of FBPConvNet. Its average RMSE is 0.017, which is 10.5% and 22.7% lower than the results of FBPConvNet and DnCNN, respectively, and lower than other algorithms. Comparing the standard deviation of each parameter, the standard deviation of LDLAIM is also lower among these algorithms, indicating that the quality of the images generated by this algorithm is relatively stable. Meanwhile, the average time for LDLAIM to process an image is 4ms, which is slightly less than the other two deep learning algorithms, but this processing time is only 1/1300 of the ART and 1/70 of the TV, so LDLAIM has the advantage of computing time. These results show that the low-dose imaging and limited-angle imaging techniques are used simultaneously in CT scanning, and our proposed LDLAIM can still restore images quickly and accurately, and obtain high-quality reconstructed images. It is worth noting that the quality of the input LDLAIM image is much lower than algorithms inputs, even in this case, the images restored by LDLAIM still has better results, which is enough to show that LDLAIM has excellent performance. Fig. 10 shows the evaluation results of 20 sets of images by two radiologists. These algorithms have high scores in noise suppression, but in the other indexs, traditional algorithms significantly lag deep learning algorithms. Comparing the three deep learning algorithms, it is not difficult to find that, as a general denoising network, DnCNN can suppress the noise in the images very well, but its ability in detail restoration is weak. As a state-of-the-art method suitable for low-resolution CT image reconstruction, FBPConvNet has a good performance in dealing with low-dose CT, and its reconstruction results have been affirmed by two radiologists. LDLAIM is basically the same as FBPConvNet in all aspects, and the higher score in comprehensive quality also proves that the algorithm is suitable for clinical diagnosis.
Fig. 11 shows result from the head dataset. In this experiment, we simulated a low-dose CT image with 20.8% of the original dose, so the projection data of
Quantitative evaluations of results by different algorithms for chest and abdomen dataset testing cohort
Quantitative evaluations of results by different algorithms for chest and abdomen dataset testing cohort
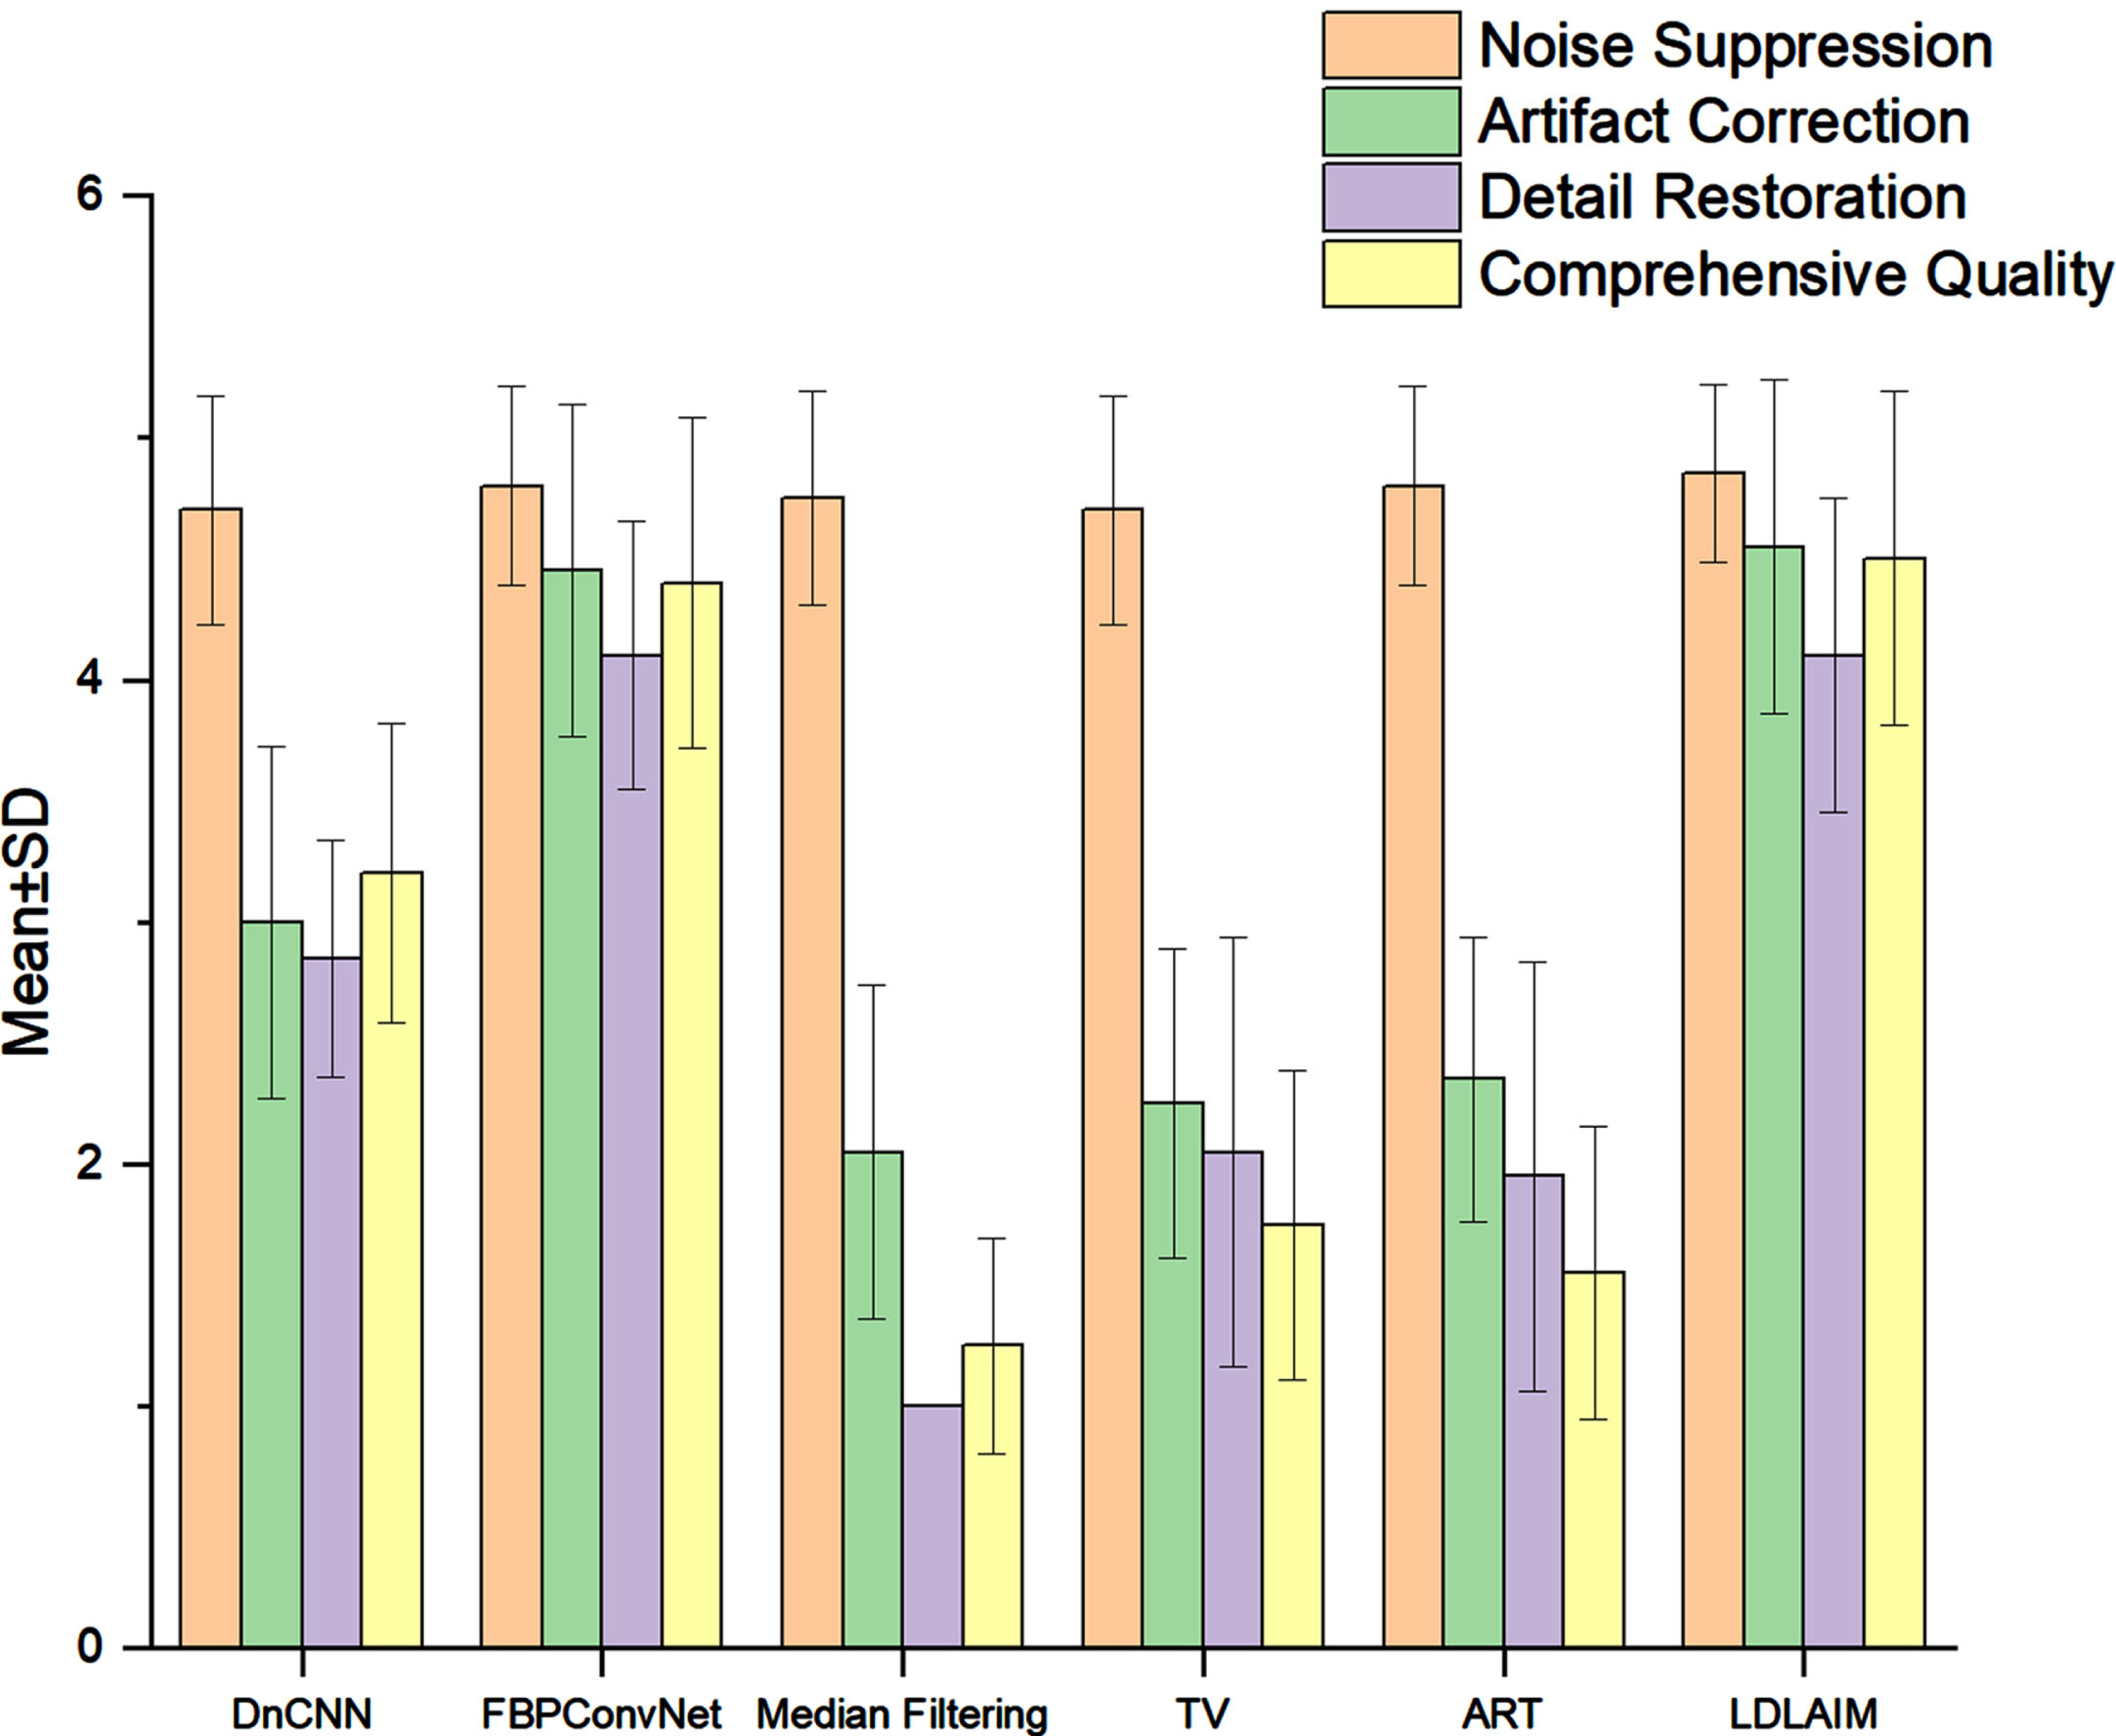
Subjective quality score (mean ± SD) comparisons for the images as restored by the different methods.
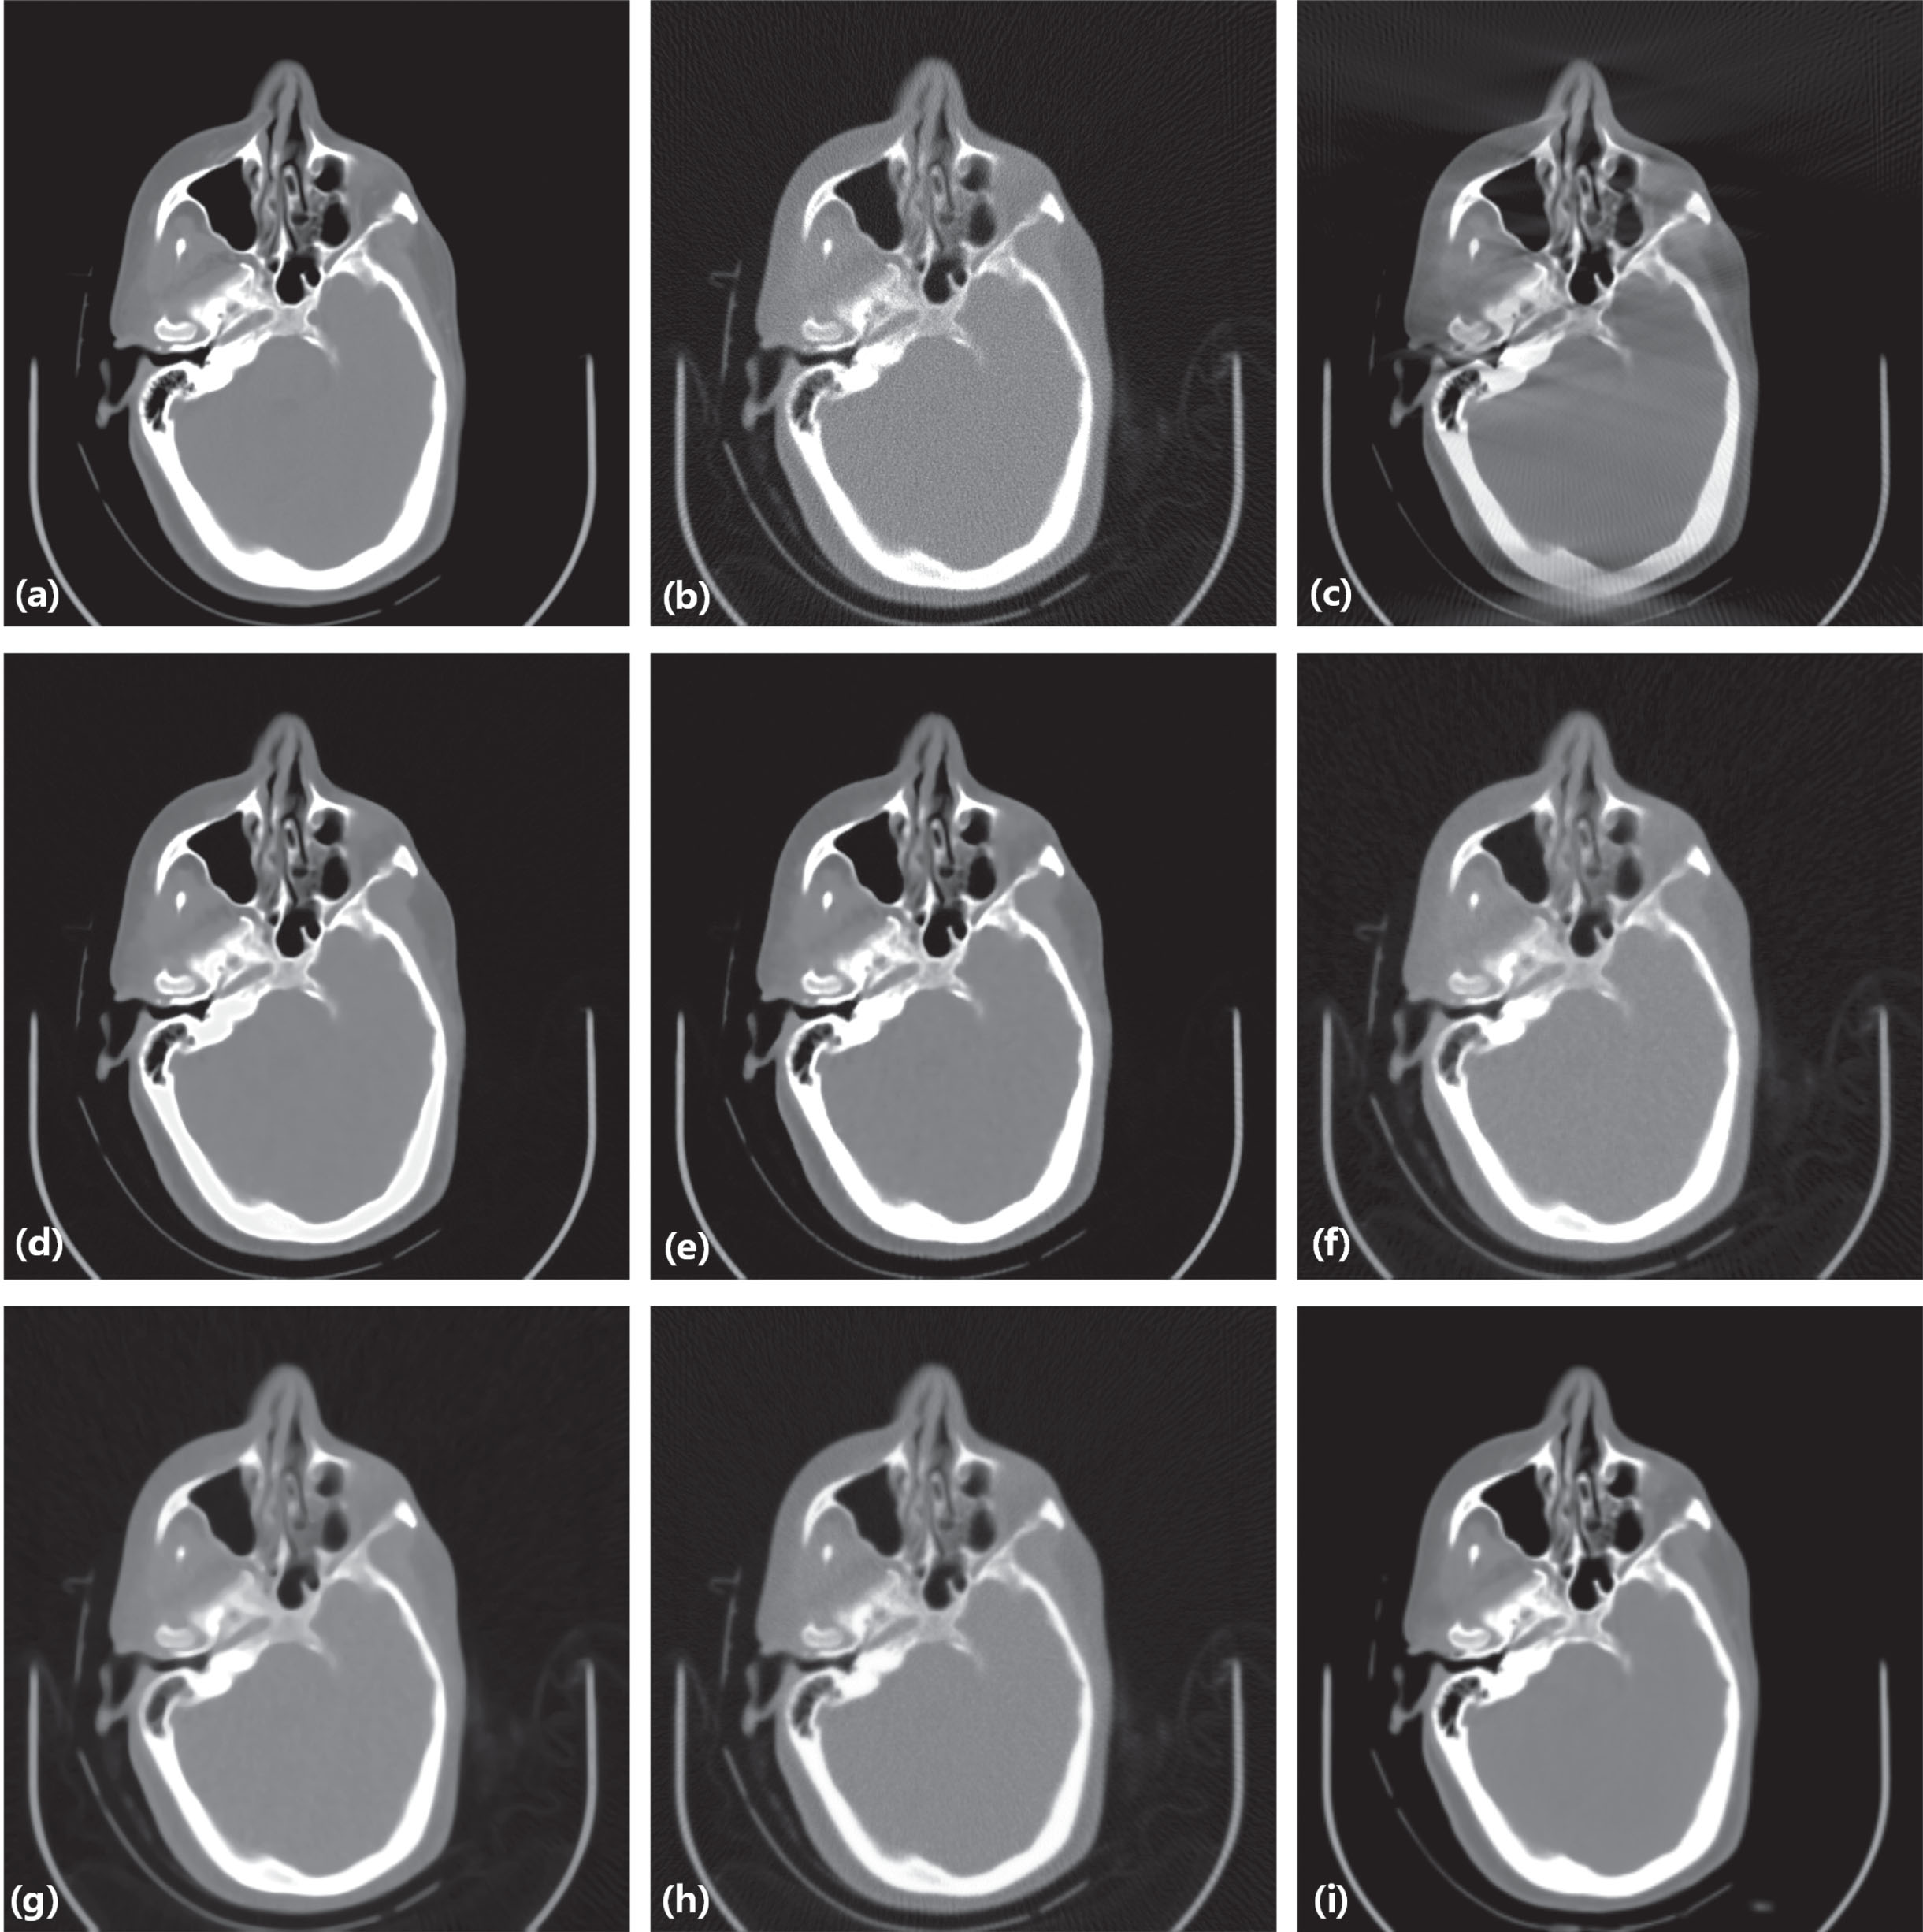
Result from the head image for comparison. (a) the original image, (b) the input image of LDLAIM, (c) the input image of other methods, (d) the result of DnCNN, (e) the result of FBPConvNet, (f) the result of median filtering, (g) the result of TV, (h) the result of ART, (i) the result of LDLAIM.
The quantitative analysis results by different algorithms for head dataset testing cohort
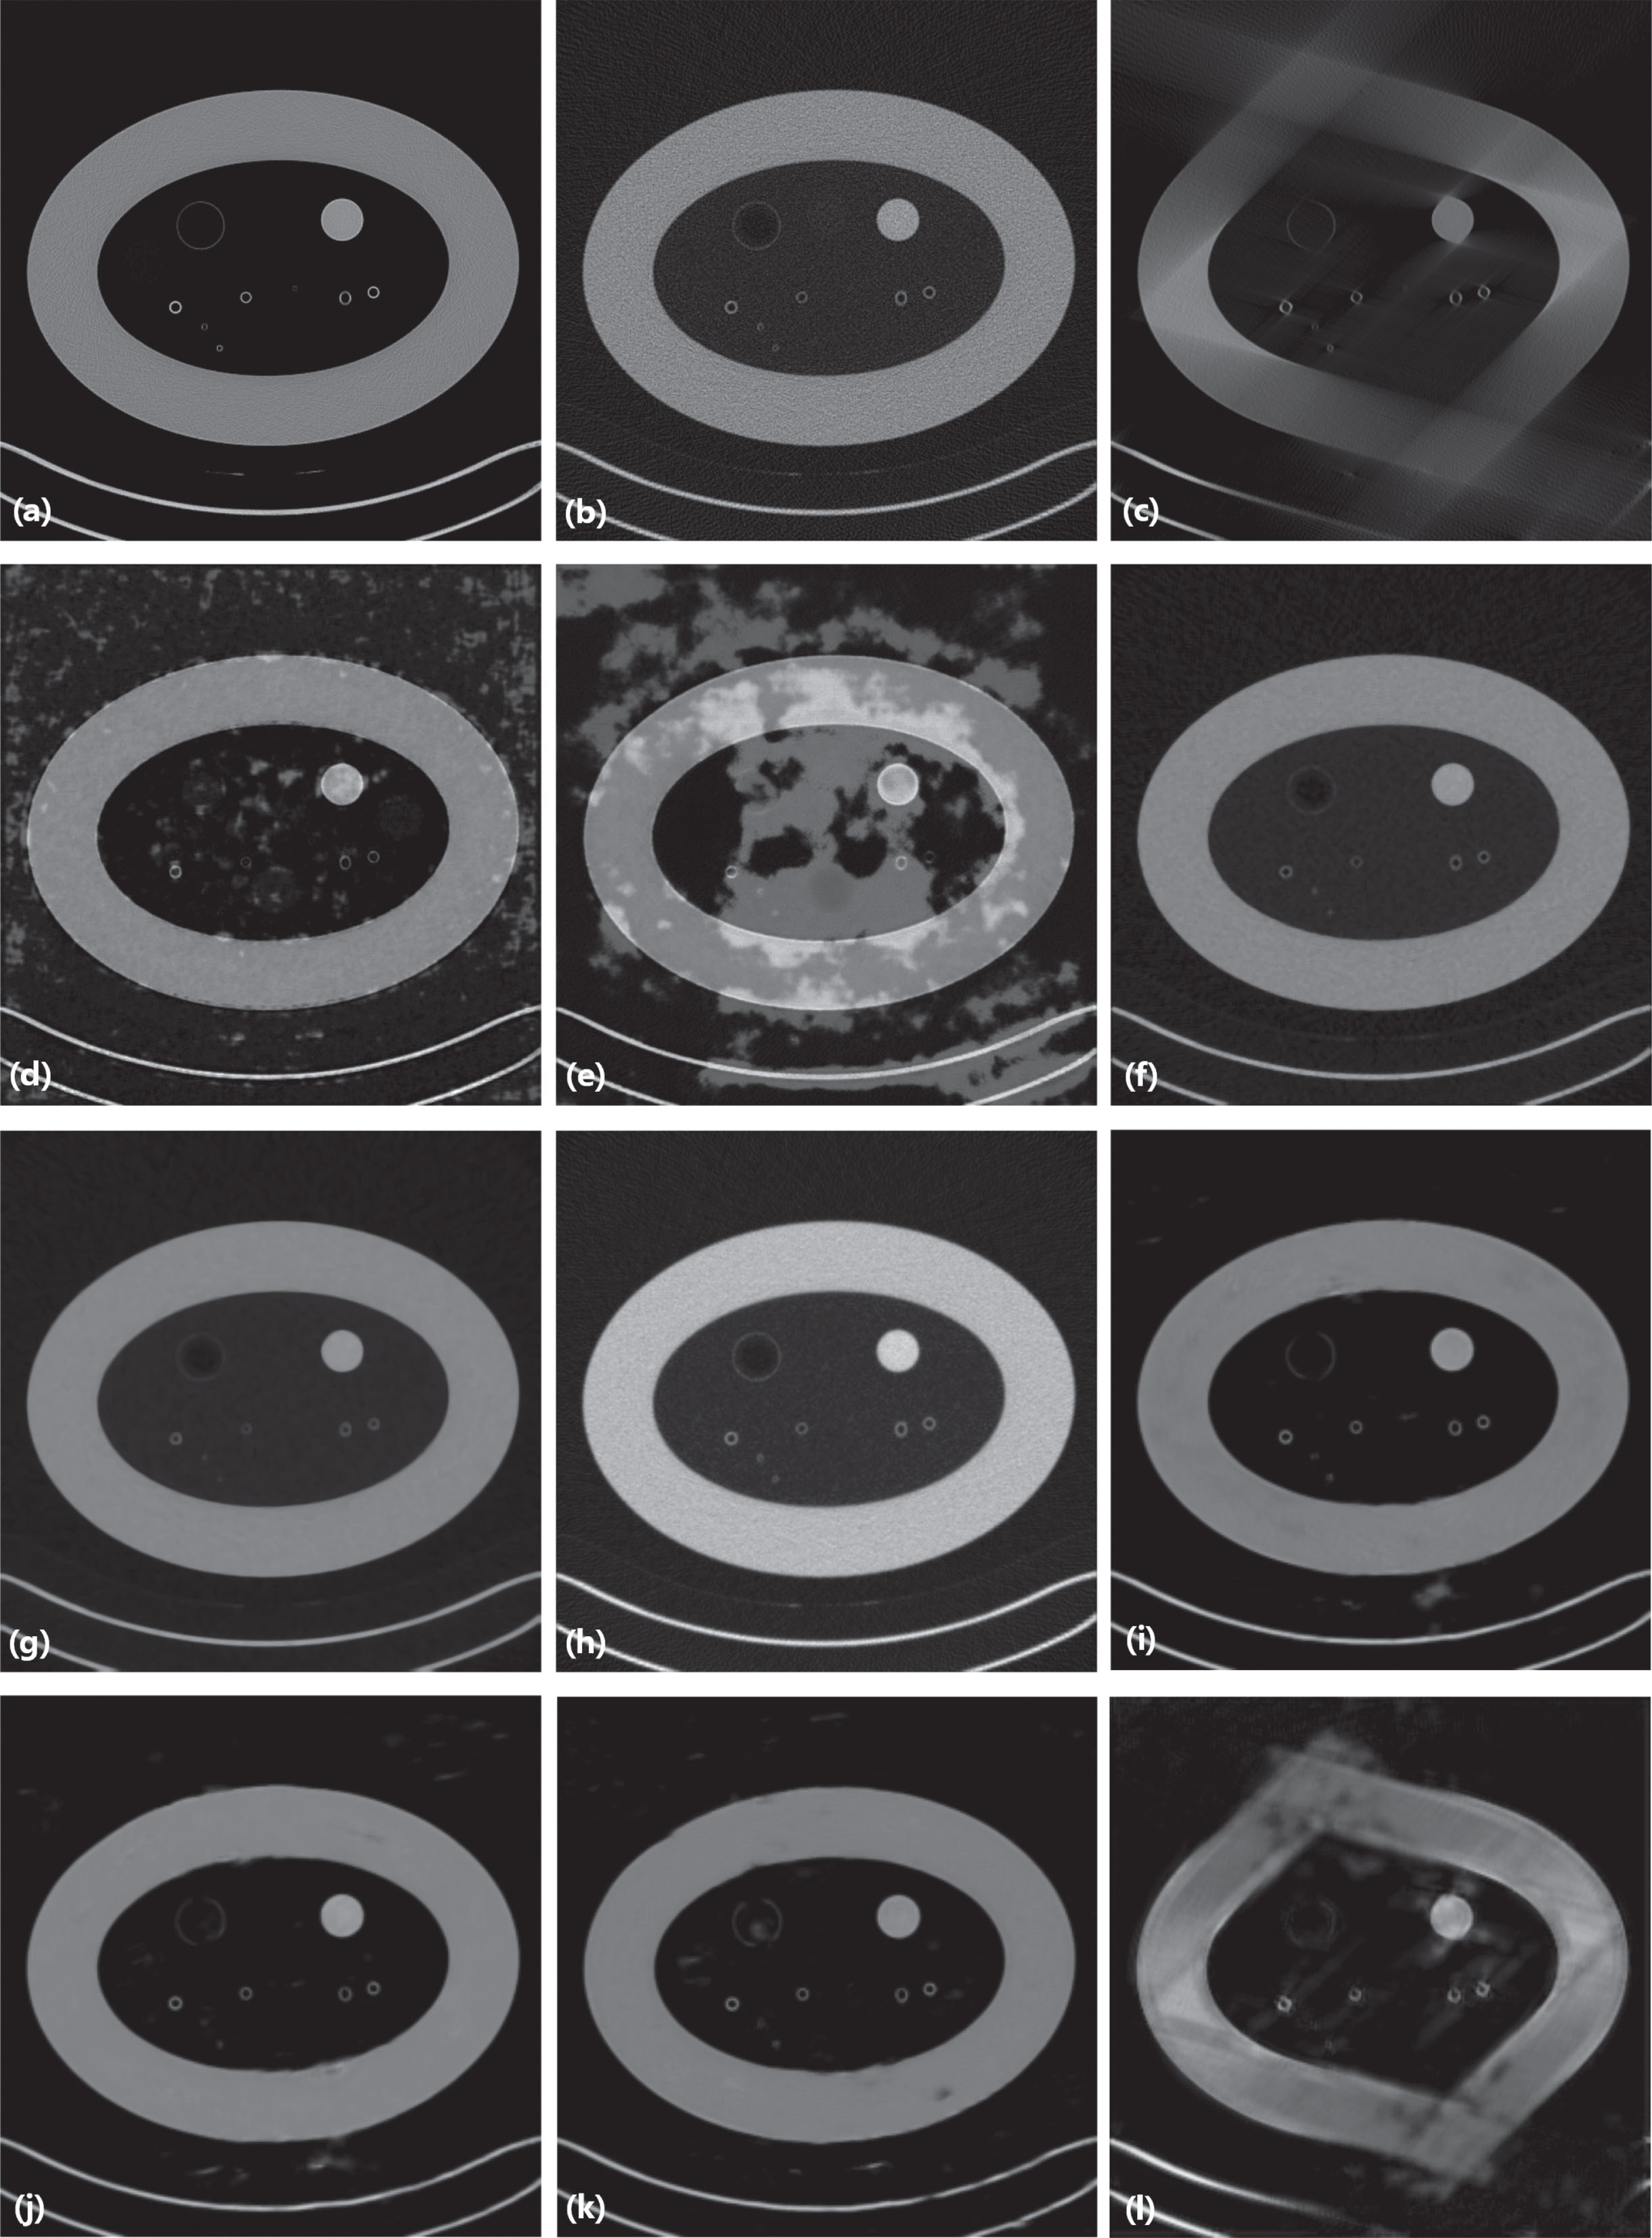
Result from the phantom image for comparison. (a) the original image, (b) the input image of LDLAIM, (c) the input image of other methods, (d) the result of DnCNN, (e) the result of FBPConvNet, (f) the result of median filtering, (g) the result of TV, (h) the result of ART, (i) the result of LDLAIM (j) the result of ablation study I, (k) the result of ablation study II, (l) the result of ablation study III.
Fig. 12 shows result from the phantom dataset. Fig. 12(d) to (i) show the restoration results of three deep learning methods and three traditional methods. Fig. 12(j) to (l) show the results of three ablation studies. Since the data in this dataset have different window widths and window centers, DnCNN and FBPConvNet cannot repair images well, and there are a lot of light-colored patches in their results, resulting in uneven colors in the images. When the three traditional methods process images, they only process one image at a time, which is less affected by other images in the data set, so the colors of the generated images are more uniform and similar to the ground-truth. Compared with the other two deep learning methods, our proposed LDLAIM algorithm has a deeper network structure, so it can restore images with large differences in the phantom dataset. In Fig. 12(j) and (k), we delete the discriminator, and residual blocks in generator, respectively. Compared with Fig. 12(i) generated by the complete LDLAIM, these two images have obvious defects at the phantom shell, with blurred borders and uneven colors. Based on the quantitative analysis in Table 4, the quality of the images generated by these two experiments is still better than other algorithms. The experiment of Fig. 12(l) removes the encoder-decoder structure in the LDAIM generator, and the quality of the generated image is much lower than that of Fig. 12(i)(j)(k). And compared with the input image Fig. 12(c), the distortion caused by the missing projection angle in the image is not improved. Therefore, the results of these ablation studies show that the encoder-decoder structure in the generator plays a key role in the restore of the image, the discriminator and residual blocks can further improve the quality of the image and further restore the detailed information in the image.
In Table 4, due to the inconsistency of window width and window center in the same data set, the results of DnCNN and FBPConvNet have dropped significantly, while the other three traditional algorithms only process one image at a time, which is not disturbed by other data in the dataset, so the obtained results are also better than two deep learning methods. The indicators of ablation study I and ablation study II are slightly behind the complete LDLAIM, indicating that the deleted structures in these two experiments do have a certain impact on the accuracy of the network, while the results of ablation study III are significantly behind LDLAIM, it means that the encoder-decoder structure in the generator plays a decisive role in the generation quality of the image. These conclusions are consistent with the results obtained from the analysis of Fig. 12.
Quantitative evaluations of results by different algorithms for phantom dataset testing cohort
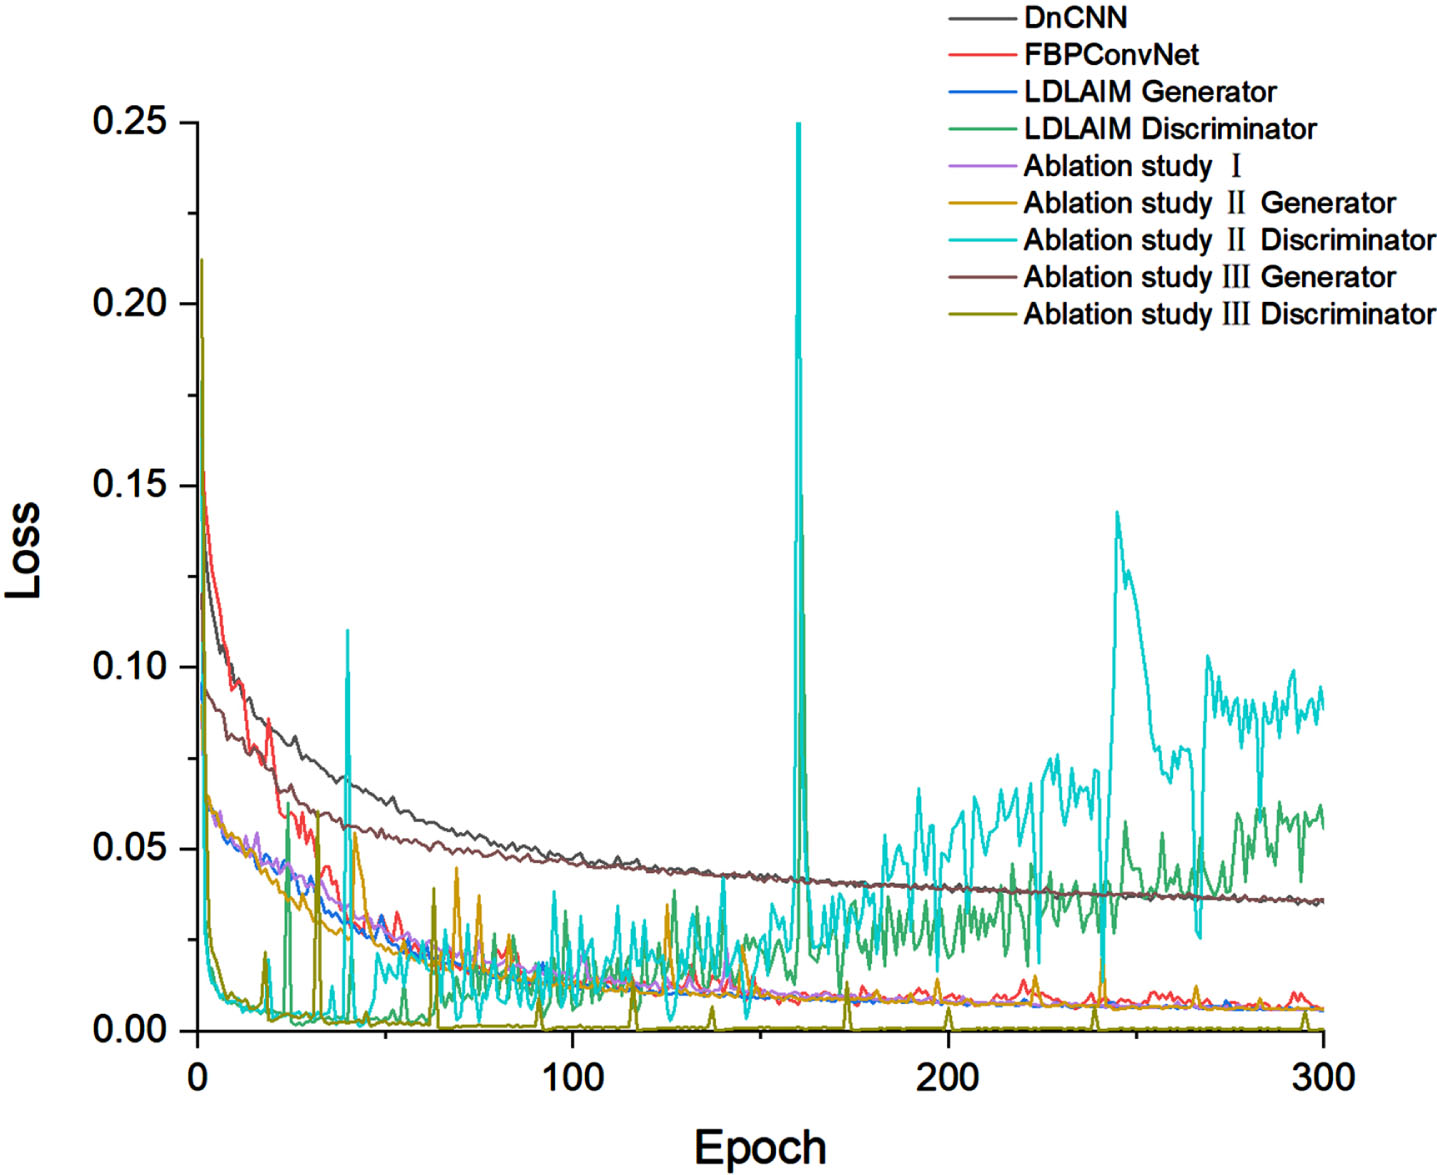
The average loss of each algorithm in each training epoch.
In this work, we use GANs to inpainting low-dose limited-angle CT images. We use residual blocks and encoder-decoder structures in series to form a generator, and then use a discriminator to discriminate the generated images to help train the generator. The encoder-decoder structure of the network is mainly used to generate high-quality images according to the input low-dose limited-angle CT images, while the residual blocks and discriminators can optimize the details of the generated images to make the images more similar to the ground-truth. Compared with existing deep learning methods, the performance of the proposed method is more stable, and images can be recovered with higher quality in different datasets. And it also has a good image inpainting effect on CT images of different parts of the human body. At the same time, due to the deeper network structure, the algorithm is more adaptable to images, so it can repair images with large differences in the same data set.
Our results demonstrated that the proposed method, LDLAIM, can be used to inpainting CT images in the combination of low-dose imaging and limited-angle imaging. Metrics like SSIM, PSNR, RMSE and subjective quality score were used to quantitatively assess the performance of our framework, and the results show that the model outperforms some denoising techniques when inpainting CT images with the same radiation dose. It is worth noting that since the limited-angle also limits the radiation dose of CT scanning, this framework also provides a new research idea for low-dose CT imaging.
In this work, we deleted 1/3 of the projection data, but these deleted data were randomly selected by us, and we did not analyze the sampling strategy of these angles, this means that perhaps removing more projection data at a particular location could achieve the same results as this experiment. Therefore, in future work, we plan to use deep learning method to simulate the process of sparse sampling, analyze the sampling strategy of projection data, and hope to obtain CT images that can be used for clinical diagnosis with the least scanning angle.
Footnotes
Acknowledgments
This work was supported by the Natural Science Foundation of Anhui Province, China (2108085QF285), the Natural Science Foundation of Hefei City, China (2021003) and the Anhui Provincial Key Research and Development Program, China (202104j07020047).
This work is also supported by Hefei Cancer Hospital, Chinese Academy of Science, Sun Create Electronics Co., ltd. and Hefei Advanced Computing Center. And thanks for the V&V support by Institutional Center for Shared Technologies and Facilities of Institute of Nuclear Energy Safety Technology, Hefei Institutes of Physical Science, Chinese Academy of Sciences.
Conflict-of-interest
The author declares that there is no conflict of interest regarding this manuscript.
Ethics statement
This is an observational study. The Hefei Cancer Hospital, Chinese Academy of Scienc Research Ethics Committee has confirmed that no ethical approval is required.