
Abstract
PURPOSE:
This study aims to evaluate the value of applying X-ray and magnetic resonance imaging (MRI) models based on radiomics feature to predict response of extremity high-grade osteosarcoma to neoadjuvant chemotherapy (NAC).
MATERIALS AND METHODS:
A retrospective dataset was assembled involving 102 consecutive patients (training dataset, n = 72; validation dataset, n = 30) diagnosed with extremity high-grade osteosarcoma. The clinical features of age, gender, pathological type, lesion location, bone destruction type, size, alkaline phosphatase (ALP), and lactate dehydrogenase (LDH) were evaluated. Imaging features were extracted from X-ray and multi-parametric MRI (T1-weighted, T2-weighted, and contrast-enhanced T1-weighted) data. Features were selected using a two-stage process comprising minimal-redundancy-maximum-relevance (mRMR) and least absolute shrinkage and selection operator (LASSO) regression. Logistic regression (LR) modelling was then applied to establish models based on clinical, X-ray, and multi-parametric MRI data, as well as combinations of these datasets. Each model was evaluated using sensitivity, specificity, and area under the receiver operating characteristic curve (AUC) with a 95% confidence interval (CI).
RESULTS:
AUCs of 5 models using clinical, X-ray radiomics, MRI radiomics, X-ray plus MRI radiomics, and combination of all were 0.760 (95% CI: 0.583–0.937), 0.706 (95% CI: 0.506–0.905), 0.751 (95% CI: 0.572–0.930), 0.796 (95% CI: 0.629–0.963), 0.828 (95% CI: 0.676–0.980), respectively. The DeLong test showed no significant difference between any pair of models (p > 0.05). The combined model yielded higher performance than the clinical and radiomics models as demonstrated by net reclassification improvement (NRI) and integrated difference improvement (IDI) values, respectively. This combined model was also found to be clinically useful in the decision curve analysis (DCA).
CONCLUSION:
Modelling based on combination of clinical and radiomics data improves the ability to predict pathological responses to NAC in extremity high-grade osteosarcoma compared to the models based on either clinical or radiomics data.
Keywords
Introduction
Children and young adolescents are prone to osteosarcoma, the most common form of primary malignant bone cancer. The current treatment options for non-metastatic osteosarcoma typically use neoadjuvant chemotherapy (NAC) to reduce primary tumour volume, induce chemotherapy-induced necrosis, and facilitate subsequent tumour resection [1]. The addition of adjuvant and neoadjuvant multiagent chemotherapy to surgery has increased success rates from 20% to 60–70% for nonmetastatic high-grade osteosarcoma [2]. However, in the treatment of osteosarcoma, the recommended treatment depends on the histological response to NAC. Clinicians can adjust the treatment strategy based on early evaluation of patient response, thus improving treatment outcomes. Therefore, a new method of identifying those patients who are likely to have a good or poor response to NAC is crucial. It is essential for patients with osteosarcoma to undergo chemotherapy urgently if chemotherapy can be easily recommended at the time of diagnosis. Conversely, in patients who are likely to respond poorly, the limitations of ineffective chemotherapy treatment (e.g., toxicity) can be avoided and alternative treatment options can be considered. The presence or absence of reliable clinical, biological, or conventional radiological signs can allow early identification of NAC failure in osteosarcoma [3].
Further, osteosarcoma patients are frequently adversely affected by chemotherapy, and their survival rates are reduced due to a high incidence of relapse [4]. Until now, histopathology was the gold standard for evaluating the effectiveness of NAC [5]. However, this procedure is invasive and requires a longer evaluation time. Therefore, a non-invasive method to predict the clinical response to NAC before surgical resection is greatly needed. The Modified Response Evaluation Criteria in Solid Tumours (RECIST) were used in the non-invasive evaluation of response to NAC using computed tomography (CT) and magnetic resonance imaging (MRI) to measure changes in tumour size [6], which sometimes correlate weakly with histopathological evaluation in osteosarcoma [7]. Previous studies have demonstrated MRI evaluation of physiological functional in the form of diffusion-weighted imaging (DWI), dynamic contrast-enhanced MRI (DCE-MRI), and intravoxel incoherent motion MRI (IVIM-MRI) to be useful for the evaluation of chemotherapy response in osteosarcoma [8–10]. No previous studies have demonstrated whether X-ray images can be used to predict the pathologic response to NAC in osteosarcoma. The role of routine MRI in the early assessment of response to chemotherapy in patients with osteosarcoma is limited and may only be of help in the early identification of poor responders [11]. As radiomics has the potential to extract multiple quantitative imaging features and capture intra-tumour and inter-tumour heterogeneity, we used X-ray and routine MRI radiomics for the preoperative prediction of the pathologic response to NAC in osteosarcoma.
Radiomics is an innovative method for analysing medical images, allowing the comprehensive evaluation of intra-tumour heterogeneity and aggressiveness [12, 13]. In other types of cancer such as breast [14], cervical cancer [15], nasopharyngeal carcinoma [16], rectal cancer [17], gastric cancer [18] and soft tissue sarcoma [19], CT or MRI-based radiomics has been demonstrated to provide valuable evaluations of the treatment response. Such techniques are commonly applied in bone tumours using T1-weighted, T2-weighted, and contrast enhanced (CE)-T1-weighted MRI. It has been demonstrated that multiple MRI contrast mechanisms such as DWI, T2-weighted MRI/fat saturation (FS)-T2-weighted MRI, and CE-T1-weighted MRI can provide more detailed information about tumours, increasing their specificity. The radiomic analysis of such images in bone and soft tissue tumours facilitated favourable outcomes [20–23]. To the best of our knowledge, statistical radiomic features derived from X-ray images in osteosarcoma have not yet been investigated as imaging biomarkers for NAC response evaluation. Consequently, the purpose of the present study was to investigate the prognostic value of radiomic features extracted from X-ray and multiparametric MRI (T1-weighted, T2-weighted, and CE-T1-weighted). We also developed and validated models using combinations of X-ray, multiparametric MRI, and clinical features to predict NAC response in patients with osteosarcoma.
Materials and methods
Patient selection
We received approval from our institutional review board to conduct this retrospective study and the requirement for informed consent was waived. The chemotherapy regimen was the Cooperative OsteoSarcoma Study (COSS) regimen, consisting of adriamycin (ADM), cisplatin (DDP), high-dose methotrexate (HDMTX), and ifosfamide (IFO). The inclusion criteria were as follows: (i) osteosarcoma that had not been treated surgically or medically before diagnosis; (ii) X-ray and multiparametric MRI including T1-weighted, T2-weighted, and CE-T1-weighted imaging were performed pre-treatment in each patient; (iii) diagnoses of osteosarcoma were confirmed by biopsy or surgical resection and histopathological results; (iv) Huvos grade system was used to assess the postoperative histologic response after definitive surgery. [24] Patients with good responses (GRs) and poor responses (PRs) were defined by chemotherapy-induced necrosis percentages of≥90% and < 90%, respectively. Examples of pre-treatment imaging and postoperative histologic responses are shown in Figs. 1–4. The four patients shown exhibited similar X-ray and MRI findings, but different histologic responses.
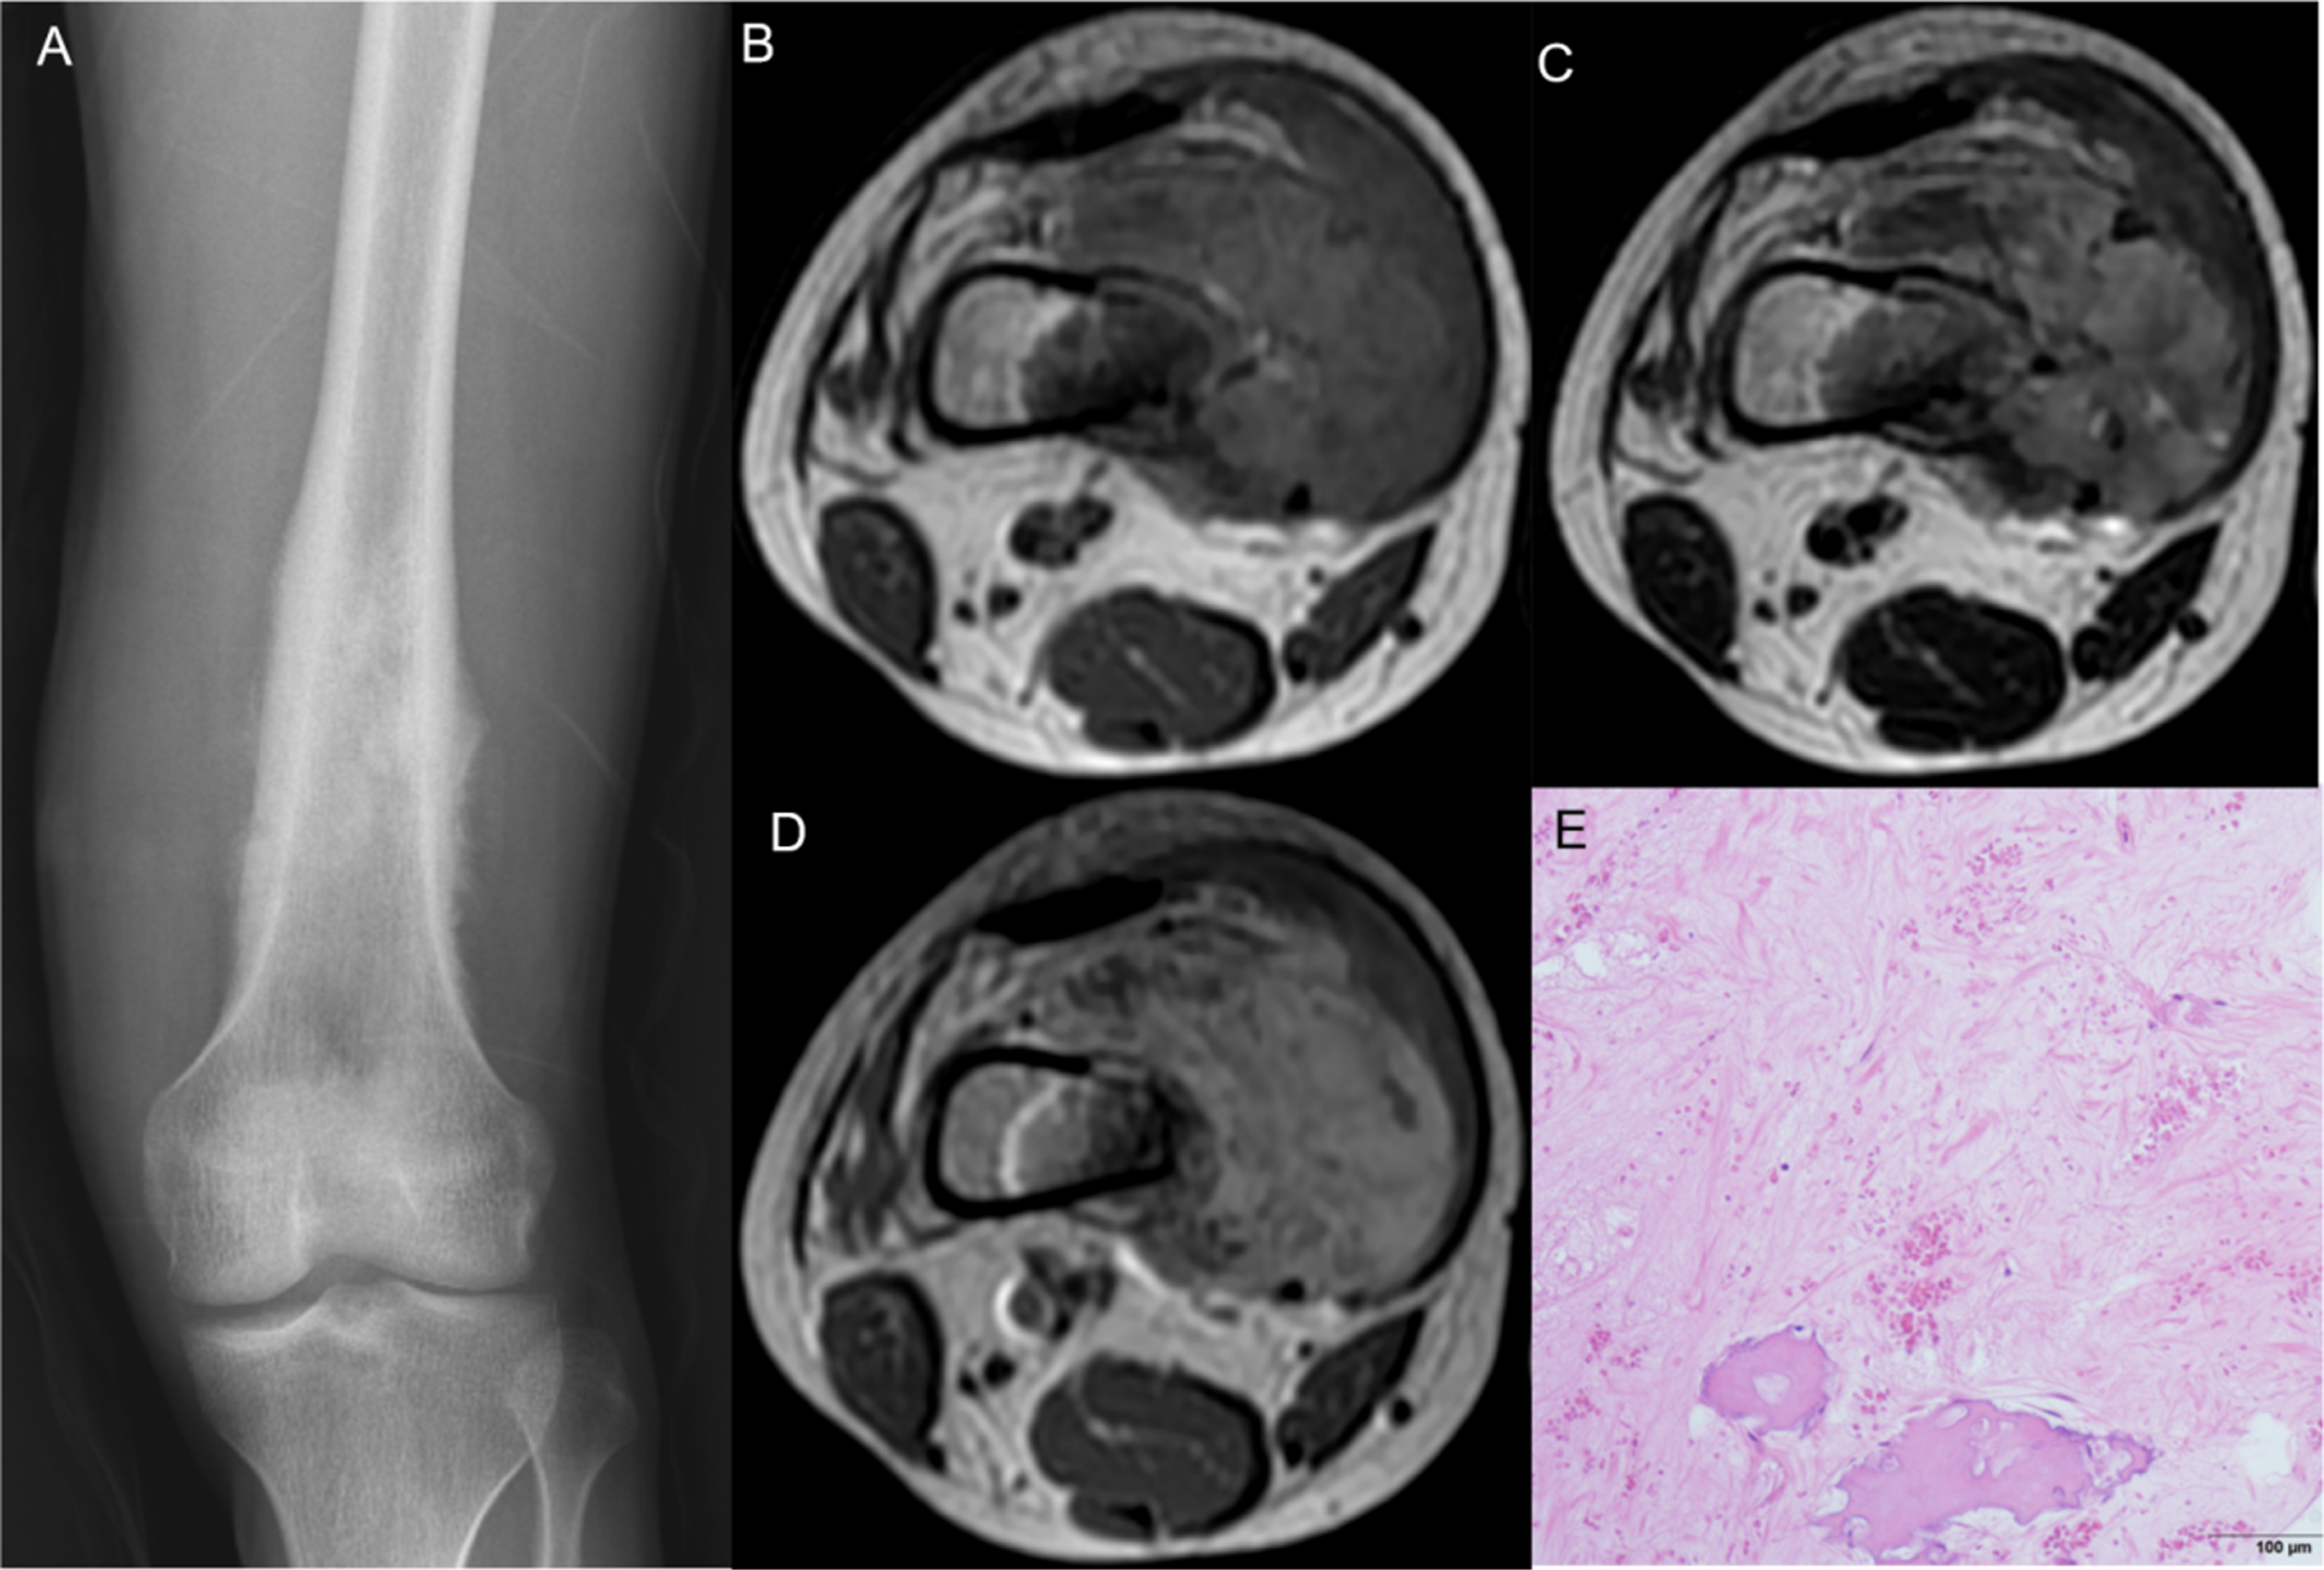
Huvos Osteosarcoma Necrosis Grade I in the left femur of a 20-year-old male. Results showed a mix bone destruction on X-ray (A) and the tumor appeared heterogeneous signal intensity on axial T1 and T2-weighted sequence (B, C) and heterogeneous enhancement on axial T1-contrast enhanced T1 weighted image (D). Pathology revealed the necrosis rate of tumor was 30% (E).

Huvos Osteosarcoma Necrosis Grade II in the left femur of a 14-year-old male. Results showed a mix bone destruction on X-ray (A) and the tumor appeared heterogeneous signal intensity on axial T1 and T2-weighted sequence (B, C) and heterogeneous enhancement on axial T1-contrast enhanced T1 weighted image (D). Pathology revealed the necrosis rate of tumor was 50% (E).

Huvos Osteosarcoma Necrosis Grade III in the right humerus of a 12-year-old male. Results showed a mix bone destruction on X-ray (A) and the tumor appeared heterogeneous signal intensity on axial T1 and T2-weighted sequence (B, C) and heterogeneous enhancement on axial T1-contrast enhanced T1 weighted image (D). Pathology revealed the necrosis rate of tumor was 99% (E).
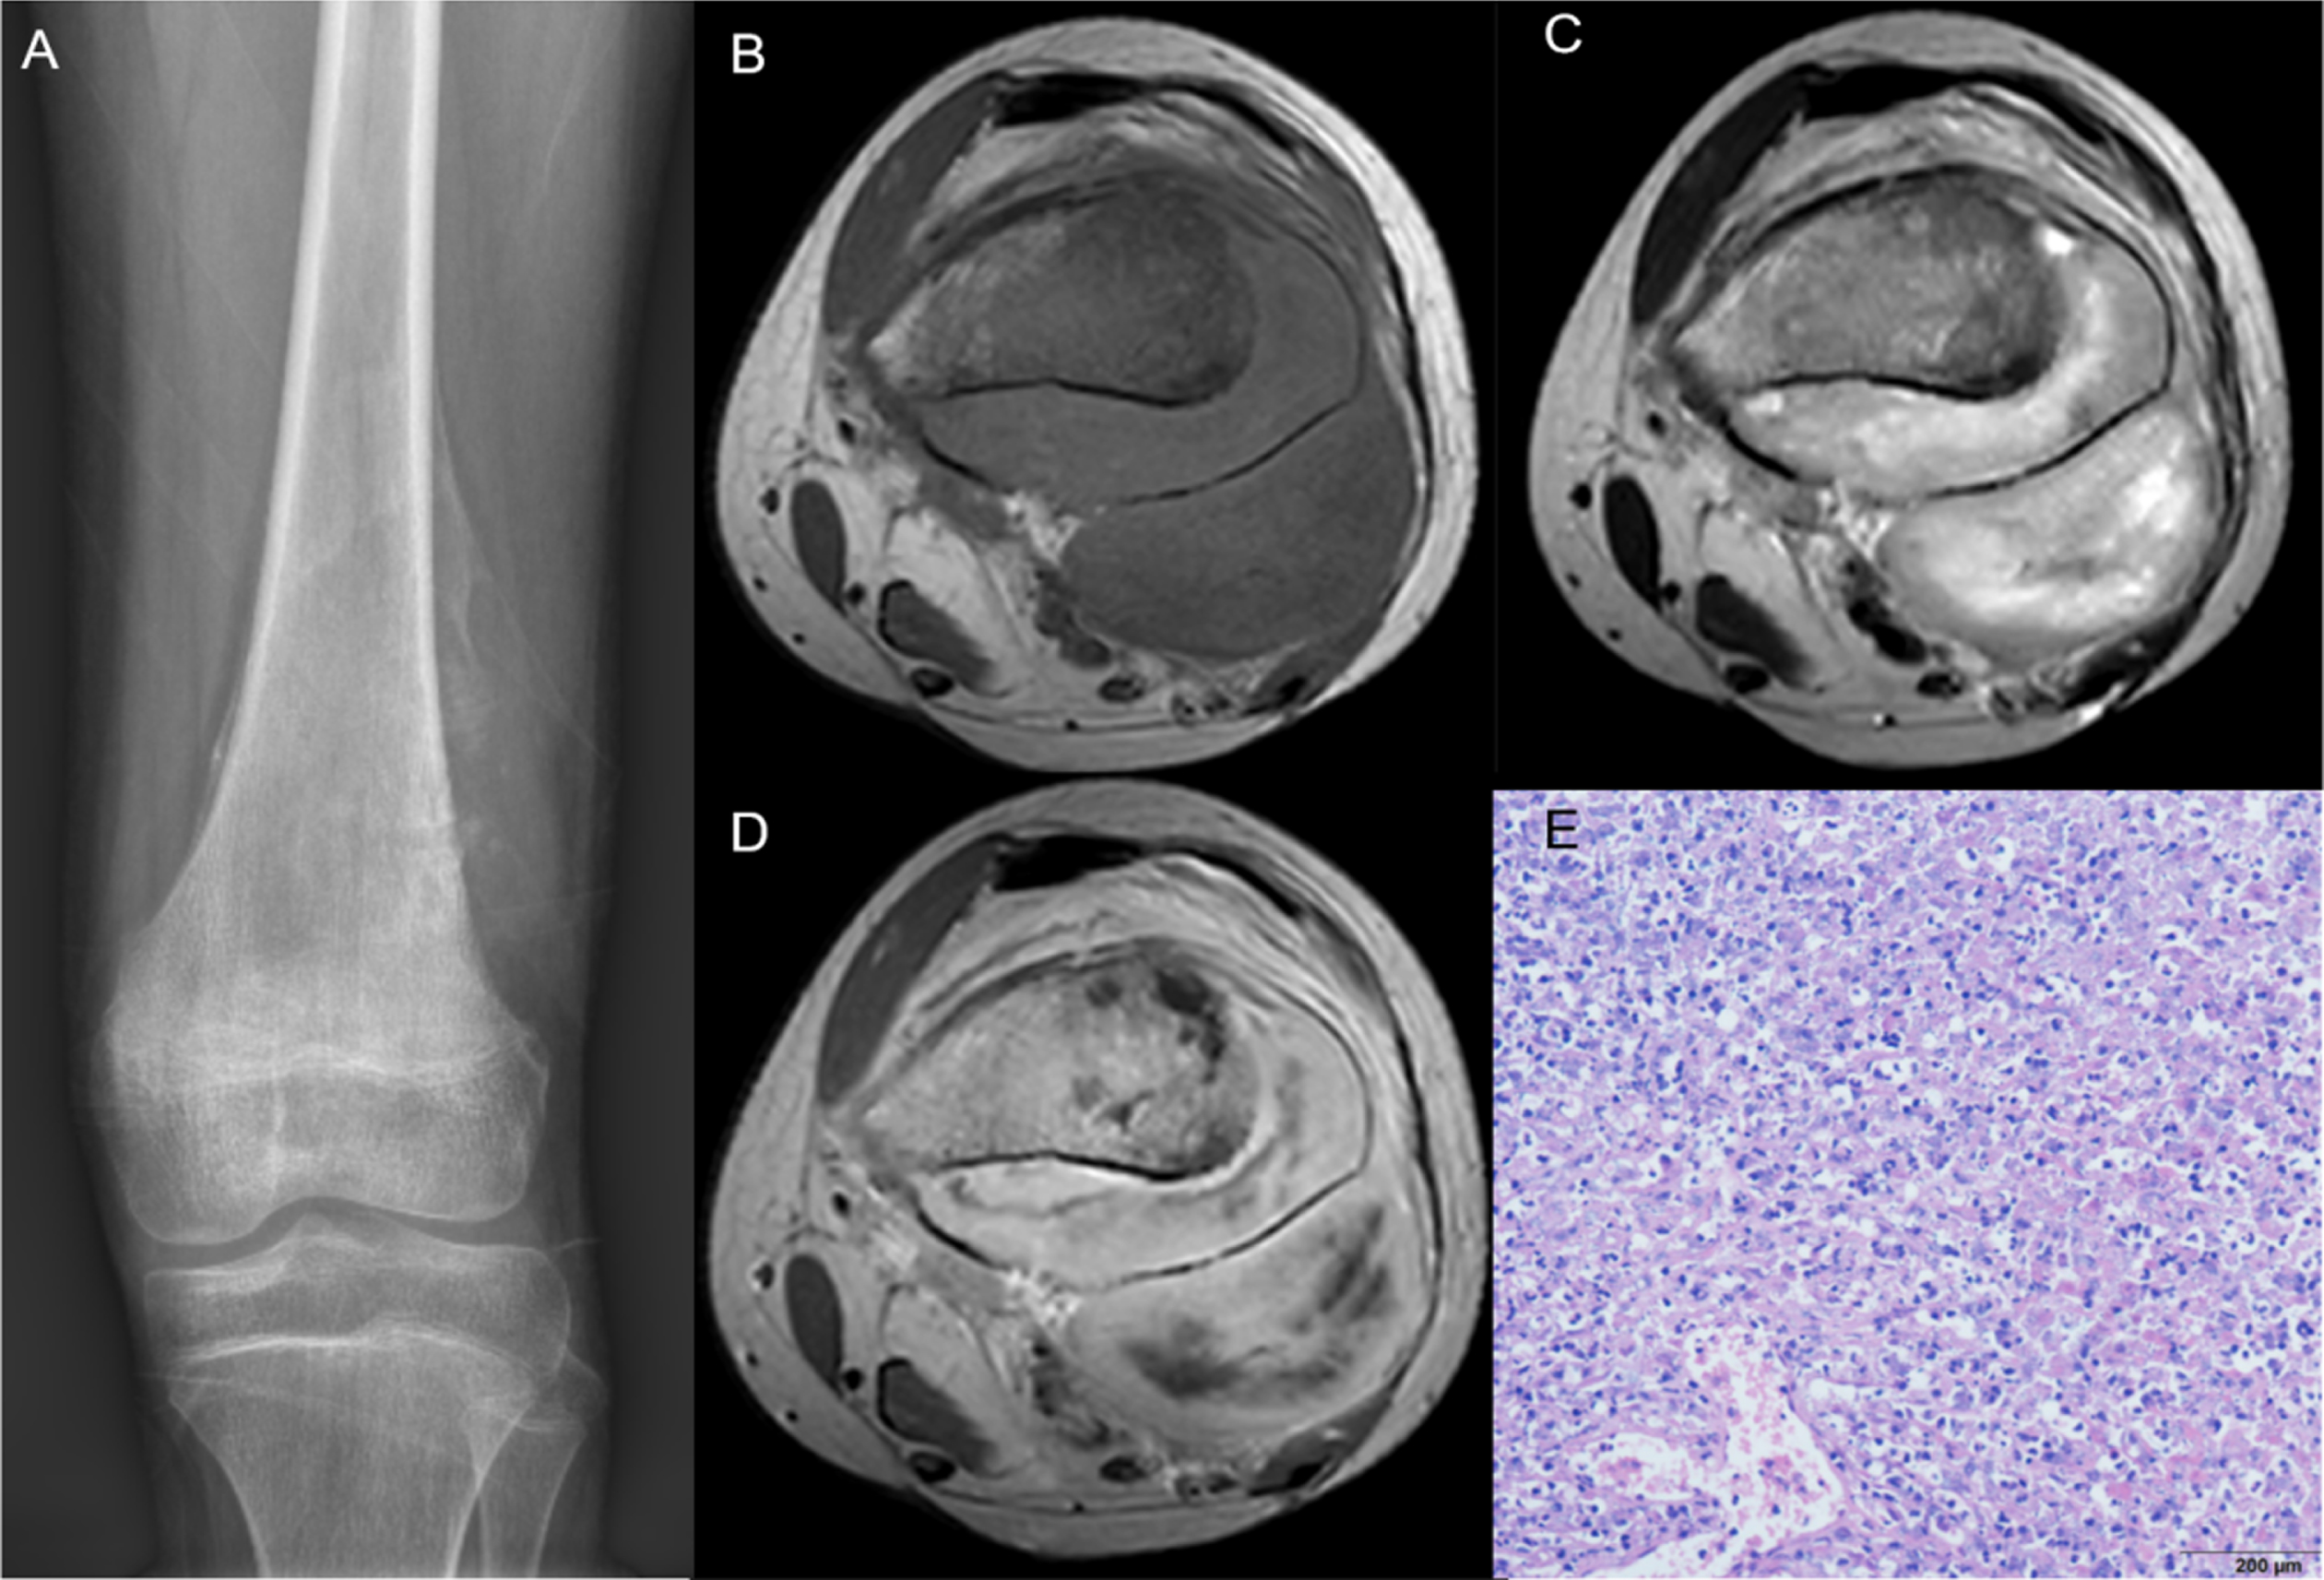
Huvos Osteosarcoma Necrosis Grade IV in the left femur of a 13-year-old male. Results showed a mix bone destruction on X-ray (A) and the tumor appeared heterogeneous signal intensity on axial T1 and T2-weighted sequence (B, C) and heterogeneous enhancement on axial T1-contrast enhanced T1 weighted image (D). Pathology revealed the necrosis rate of tumor was 100% (E).
The exclusion criteria were as follows: (i) biopsy and locoregional therapy before MRI and X-ray imaging; (ii) low-quality images rendering poorly during analysis (such as metal artefacts or motion artefacts); (iii) missing images; (iv) no treatment with NAC; (v) the postoperative histopathologic grade was not defined according to the Huvos grading system.
The study enrolled 102 patients who met all criteria. Patients were randomly divided into two groups, one for training (72 patients) and one for validation (30 patients). The training group was used for dimensionality reduction and modelling, and the validation group was used for model validation.
The following clinical characteristics were collected: age, gender, tumour size, pathological type, tumour location, type of bone destruction, and alkaline phosphatase (ALP) and lactate dehydrogenase (LDH) levels. Clinical characteristics were coded for analysis as follows: gender (male = 0, female = 1), pathology type (osteoblastic = 0, others = 1), location (femur = 0, tibia = 1, others = 2), type of bone destruction (osteolytic = 0, osteoblastic = 1, mix = 2). Age, clinical measurements (tumour size), and biochemical parameters (ALP and LDH) were expressed as numbers. Based on the clinical characteristics, a univariate logistic regression was applied, and statistically significant features were selected (P < 0.05).
Anteroposterior X-ray examination of lesions was conducted using either a GE Revolution XR/d or Philips Digital Diagnost X-ray machine. The voltage was anteroposterior 53–66 kV, at an electric current of 500 mA.
All MR images were acquired on 1.5- or 3.0-T MR systems (Siemens Magnetom Aera 1.5, Siemens; United Imaging uMR780 3.0, United Imaging Healthcare; or GE Signa Excite and HDx 3.0, GE Healthcare). Parametric MRI included axial T1-weighted (TR: 457–798 ms, TE: 6.7–13.2 ms), T2-weighted (TR: 3262–7904 ms, TE: 83.0–106.3 ms), and CE-T1-weighted (TR:457–798 ms, TE:6.7–13.2 ms) images. Gadolinium contrast agent was used at an injection rate of 2.5 ml/s and a dose of 0.1 mmol/kg body weight using an intravenous line (via the cubital vein). To analyse the imaging datasets of each patient, we retrieved Picture Archiving Communication System (PACS) images from our institutes and downloaded images in Digital Imaging and Communications in Medicine (DICOM) format.
Image feature extraction and selection
For image registration, Medical Imaging Interaction Toolkit (MITK) software (version 2018.04) was used, and all voxels were resampled to a uniform pixel size of 1×1×1 mm3. A radiologist with more than five years of diagnostic imaging experience segmented the ROI of the tumour, layer-by-layer, using ITK-SNAP (version 3.8.0, https://www.itksnap.org/), which automatically merged each layer of a region of interest (ROI) into a volume of interest (VOI). Segmentation accuracy was confirmed by another radiologist with more than 10 years of diagnostic imaging experience. Any disagreements on specific image segmentation and discrepancies were resolved by consensus.
X-ray ROIs were manually drawn around the soft tissue mass and bone destruction. MRI ROIs were manually drawn around all of the visible tumour, necrosis, cyst degenerate, haemorrhage, periosteal reactions, and peritumoral oedema. A z-score was used to normalize each slice of each MRI volume and X-ray image to obtain a standard distribution of image intensities. Features were extracted from ROIs of X-ray and multiparametric MRI using the pyradiomcs package (https://pyradiomics.readthedocs.io/). The ROIs of 30 randomly selected X-ray images and MRI volumes were segmented again two months after the initial segmentation by the same radiologist to evaluate interobserver agreement. Intraclass correlation coefficients (ICCs) were computed to measure inter-rater reliability. ICCs were categorised as being poor (less than 0.5), moderate (between 0.5 and 0.75), good (between 0.75 and 0.9), and excellent (greater than 0.9) [25]. In the feature selection process, only features with ICCs greater than 0.75 were included.
The strategy for selecting features was as follows: first, we ranked features based on mRMR (minimum-redundancy-maximum-relevance). The top 15 features were selected for the subsequent classifiers. Top features were selected based only on features from the training images. The least absolute shrinkage and selection operator (LASSO) method was applied to all features to grossly select those features with discriminative ability. The LASSO method restrains some feature coefficients to zero by adjusting the parameter λ. The area under the receiver operating characteristic curve (AUC) was then achieved for varying log(λ) values using tenfold cross-validation.
Machine learning model
A logistic regression model was constructed to identify GRs and PRs, including X-ray, multiparametric MRI radiomics, and combinations of X-ray and MRI radiomics. Clinical features with statistical significance (P < 0.05) were included in a combined model (clinical+X-ray+MRI). A validation cohort was used to validate the models. In parallel to this, receiver operating characteristic (ROC) curves were generated to evaluate the capability of clinical features to differentiate GRs from PRs. Using a confusion matrix, we also assessed the diagnostic performance characteristics of these two cohorts based on sensitivity, specificity, and accuracy. Finally, the clinical utility of the five models was evaluated using decision curve analysis (DCA), to evaluate whether the model was sufficiently robust for practical application. Figure 5 shows the radiomics framework for our study. To avoid bias, we employed a Cross Validation method, wherein each validation saw all 102 cases split into 72 training cases and 30 testing cases, repeated 5 times, to calculate the mean and standard deviation of the 5 validation results. Through Cross Validation, we were able to effectively mitigate case bias stemming from single-division, thus allowing us to attain more reliable and accurate prediction accuracy information.
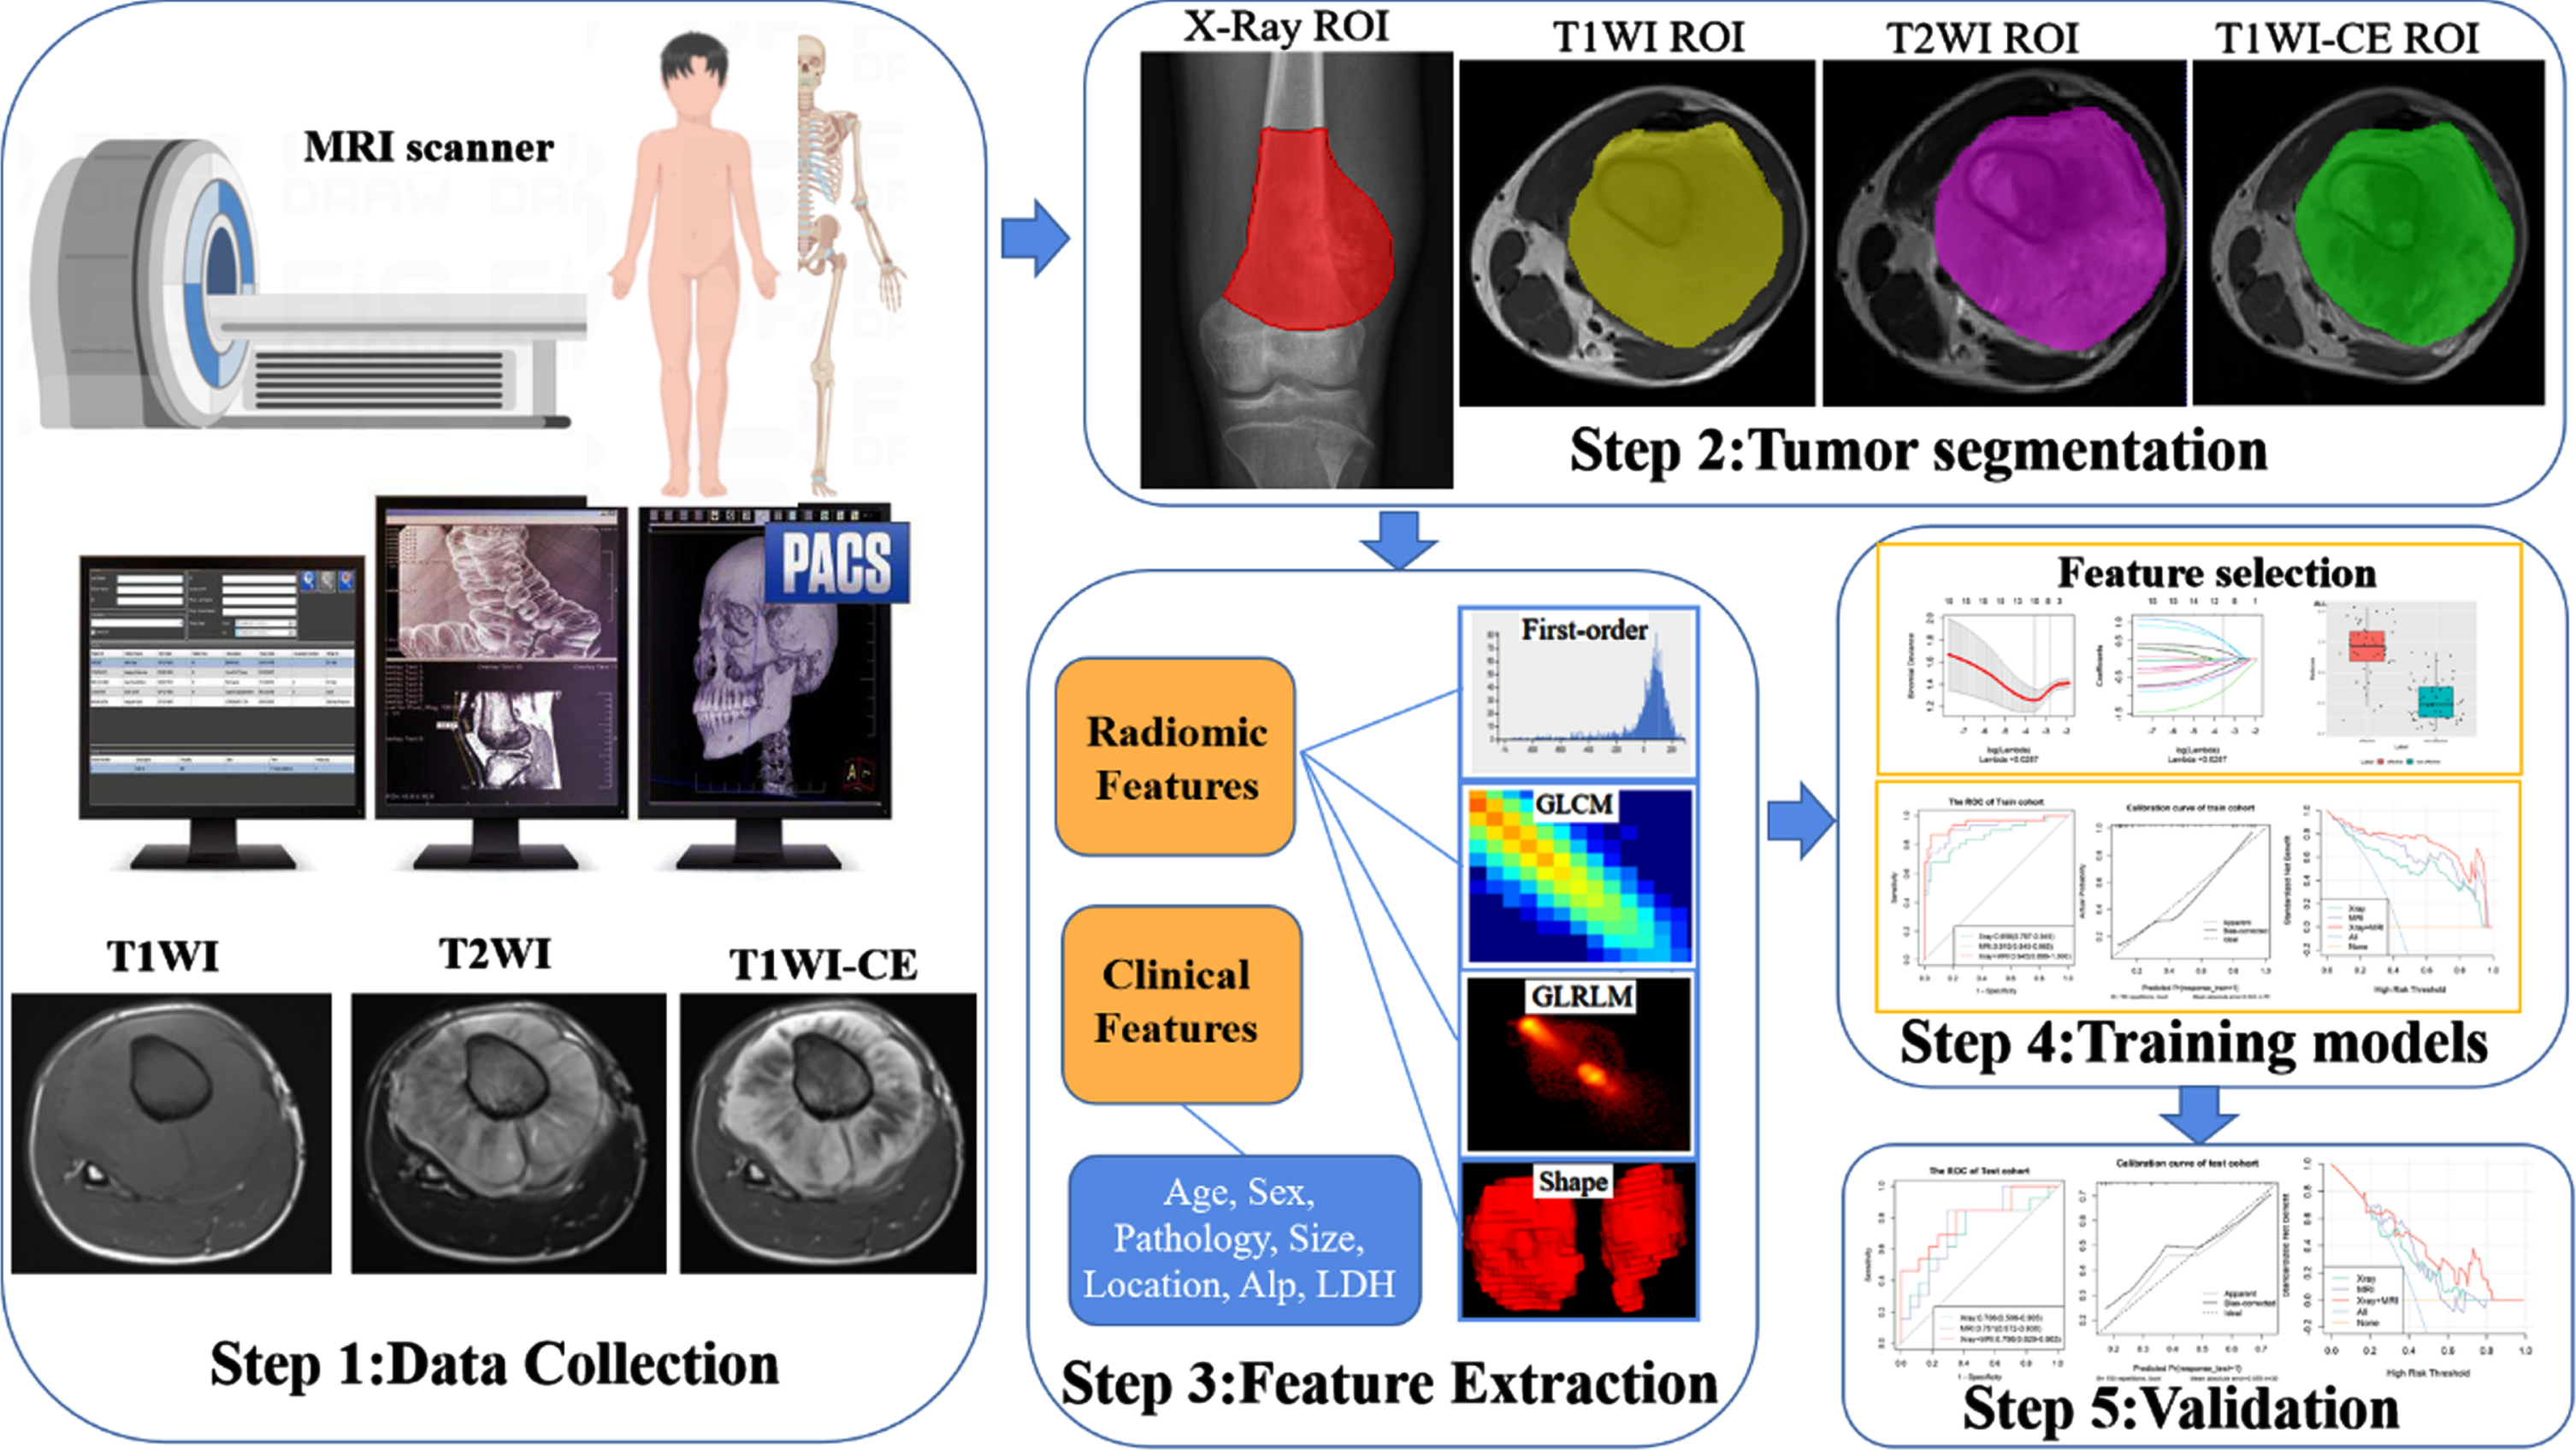
The proposed radiomics framework of our study.
A chi-squared test or Fisher’s exact test was used to compare variables between groups, while a T-test or Mann-Whitney U-test was used to compare continuous variables. For all statistical tests, P values were Bonferroni corrected for multiple comparisons. The performance of the model was evaluated using ROC curves. We calculated the sensitivity, specificity, and AUC. The statistical significance of differences between ROC curves was determined using DeLong’s method. Further comparisons of the performance abilities of the various prediction models were conducted using NRI (net reclassification improvement) and IDI (integrated discrimination improvement) statistics. R 3.5.1 and Python 3.5.6 were used to conduct statistical analyses. A 2-tailed p-value of 0.05 was considered significant.
Results
Tumour characteristics
A total of 102 osteosarcoma patients were included in the study (63 men and 39 women), comprising 44 GRs and 58 PRs. Patients were randomly divided in a ratio of 7 : 3 into training and validation cohorts. There was a statistically significant difference in ALP between the groups (P < 0.05). The GR and PR groups showed no significant differences in age, gender, pathological type, location, tumour size, bone destruction type, or LDH. (Tables 1, 2).
Clinical characteristics of 102 cases of osteosarcoma
Clinical characteristics of 102 cases of osteosarcoma
GRs good responders, PRs poor responders, ALP alkaline phosphatase, LDH lactate dehydrogenase.
Clinical characteristics of 102 cases of osteosarcoma in training and validation cohorts
GRs good responders, PRs poor responders, ALP alkaline phosphatase, LDH lactate dehydrogenase.
A total of 1,409 features were extracted from the T1-weighted, T2-weighted, and CE-T1-weighted images, and a total of 1,325 features were extracted from the X-ray images. There were no missing data in characteristics. Characteristic data containing outliers with values less than 0.5th percentile or greater than 99.5th percentile were removed and replaced with their lower or upper threshold values. The ICC criterion was used to select features with coefficients greater than 0.75. Finally, 1,037, 1,273, 1,316, and 1,307 features, respectively, from the T1-weighted, T2-weighted, CE-T1-weighted, and X-ray images were entered into the subsequent analysis. After data standardisation and dimensionality reduction using max-relevance, mRMR, and LASSO (Fig. 6), 7 features from the X-ray images, 10 features from the MRI, and 17 features from the combined X-ray and MRI were identified to construct the radiomics model on the basis of logistic regression. (Table 3). The differences in relative average deviation (RAD) scores between GRs and PRs in the training and validation cohorts were significantly different (P < 0.05) (Fig. 7).
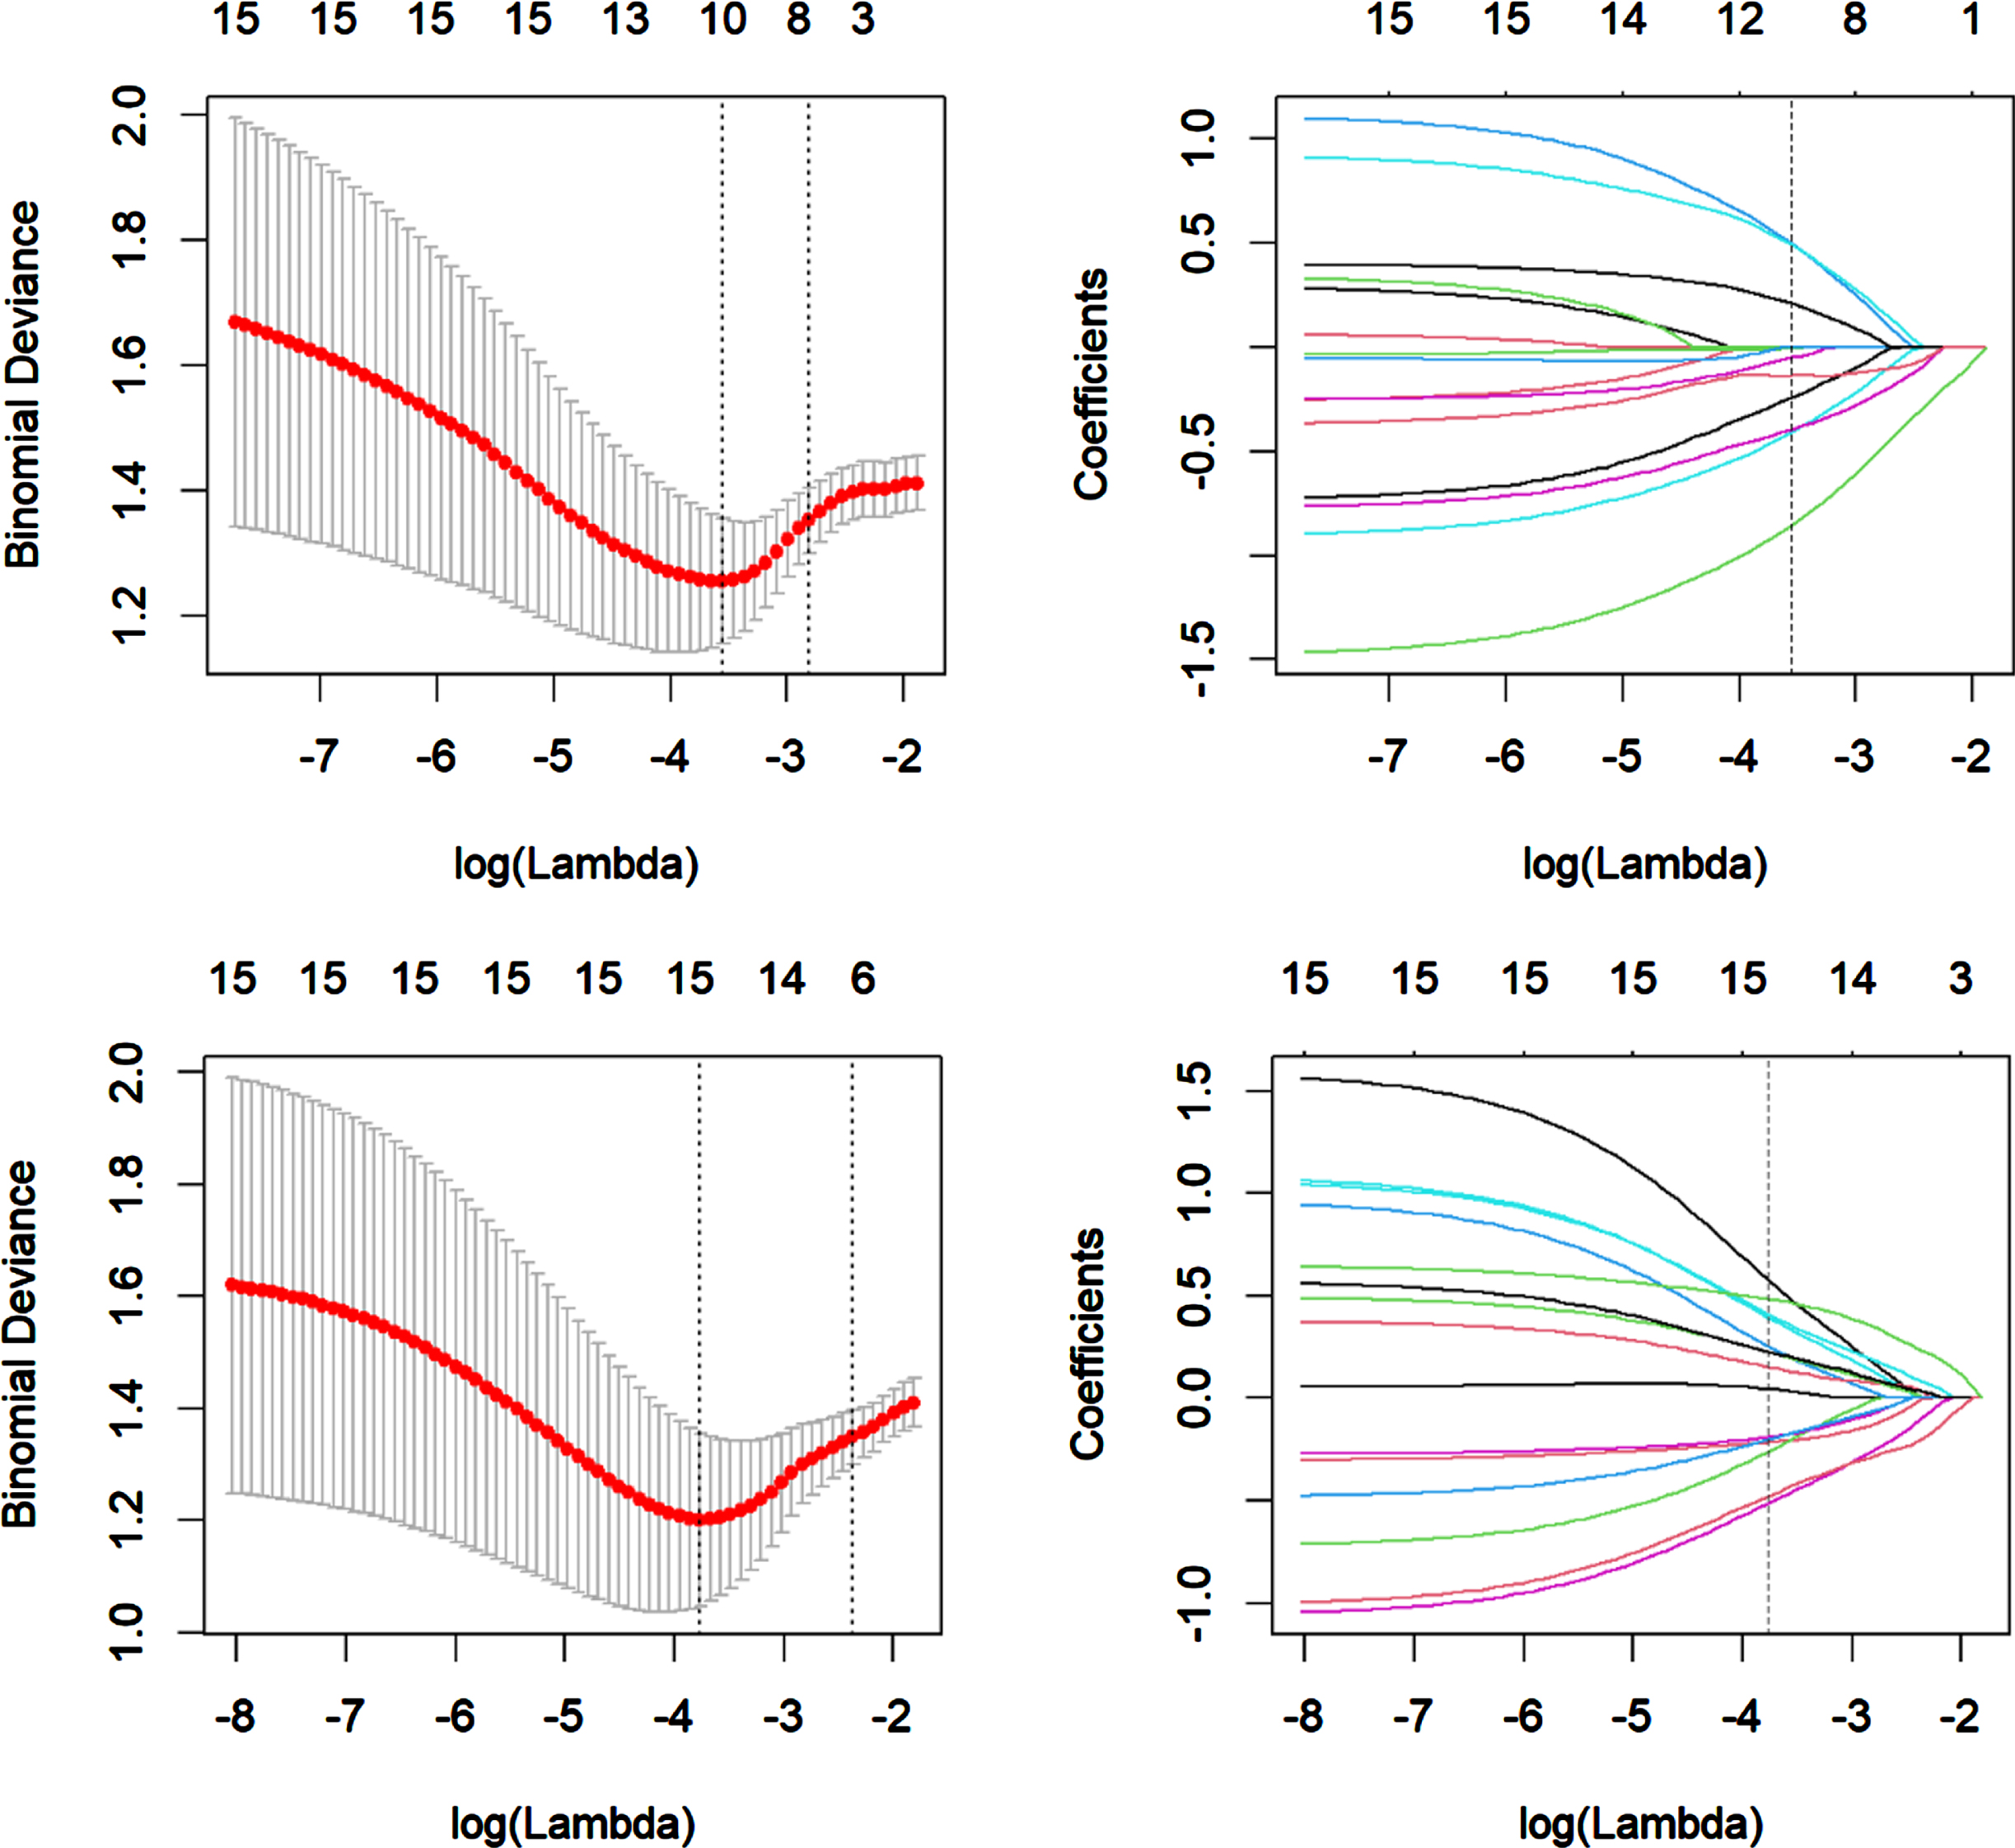
Feature selection using LASSO logistic regression of X-ray (A, B), MRI (C, D). The LASSO binary logistic regression model was used to select features and the regularisation parameter (λ) of the LASSO was used to perform 10-fold cross-validation (A, C). The coefficients were plotted against the log (λ) sequence, and the vertical line was drawn at the value selected using 10-fold cross-validation in the ln(lamda) sequence, nonzero coefficients were selected finally (B, D). LASSO, least absolute shrinkage and selection operator.
The most significant radiomics features of different models
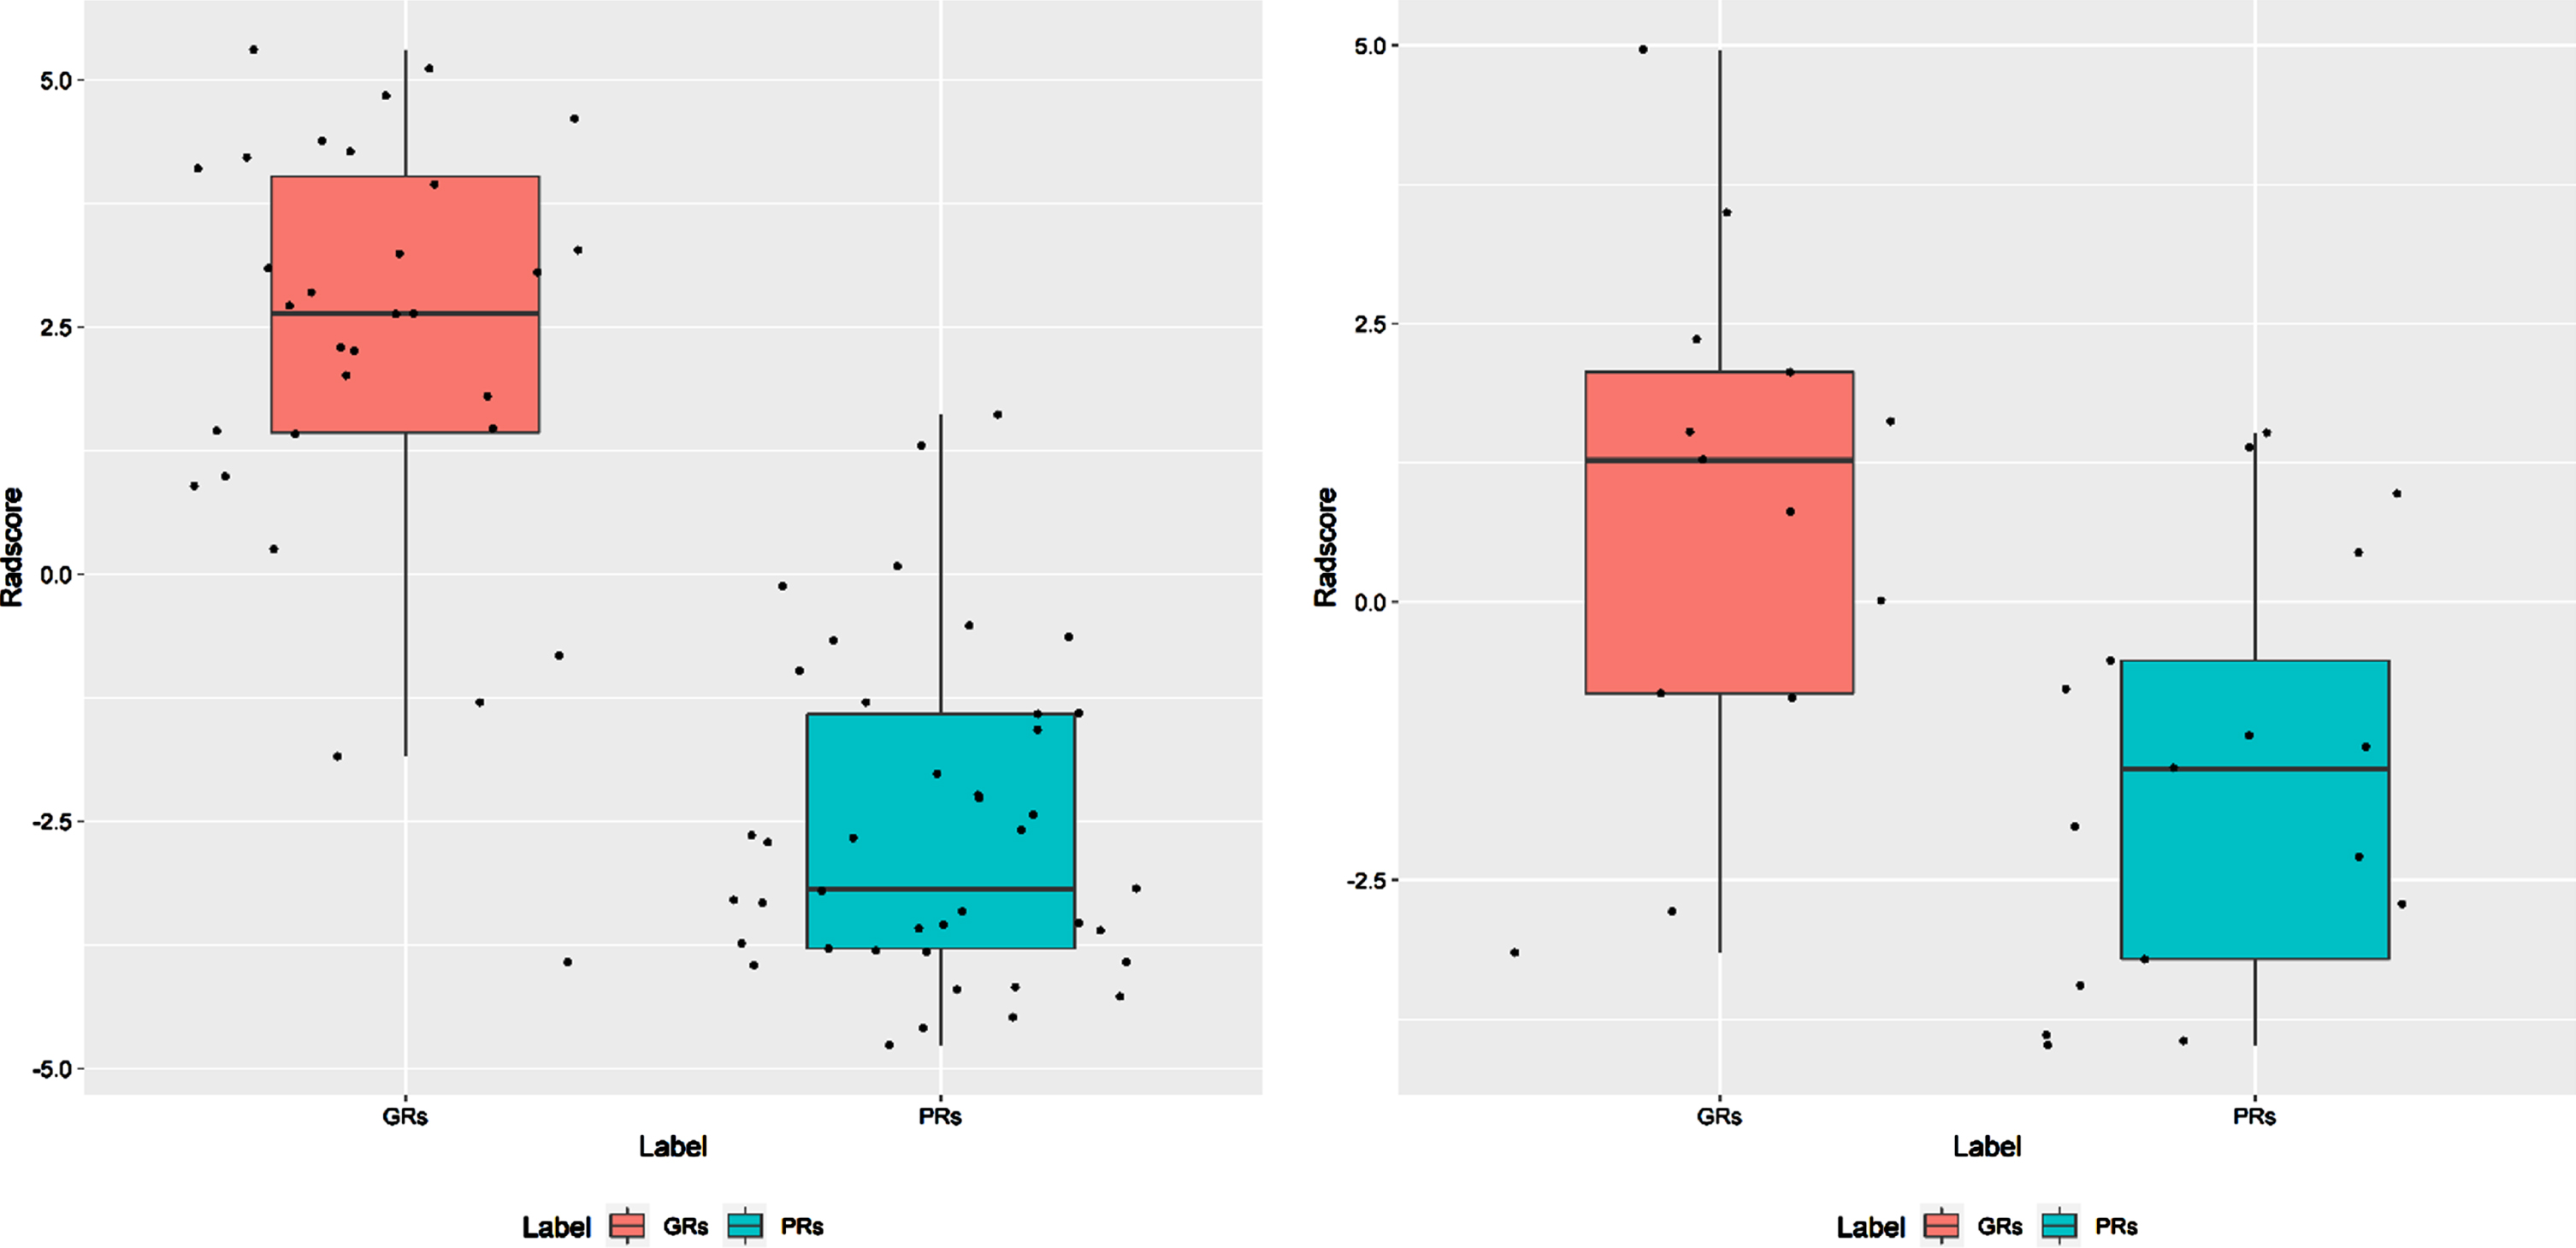
The comparison of GRs and PRs RAD scores in the training cohort (A) and validation cohort (B).
One clinical, three radiomics, and one combined model were established as follows: clinical, X-ray, MRI, X-ray+MRI, clinical+X-ray+MRI. The performance of each model was first assessed in the training cohort and then validated in the validation cohort (Table 4). As shown in Fig. 8A and B, the ROC curves for each radiomics model are shown in the training and validation cohorts. Among the five models, the combined model (clinical+X-ray+MRI) showed the best performance in validation (AUC = 82.8%, sensitivity = 84.6%, specificity = 76.5%, accuracy = 80%). In the DeLong test, however, no pair of models built for GRs/PRs classification significantly differed (p > 0.05). Further tests were conducted using NRI and IDI statistics to test the performance ability of various prediction models (Table 5). Compared to the other four models, the combined model (clinical+X-ray+MRI) had better performance in terms of both NRI and IDI. As shown in Fig. 9, the DCA curve demonstrated good performance for the combined model.
Differentiation performance of clinical model, radiomics model, and combined model in the training and validation cohorts
Differentiation performance of clinical model, radiomics model, and combined model in the training and validation cohorts
Training cohorts in front of the parentheses. Validation cohorts in parentheses. AUC, area under the summary receiver operating characteristic curve; ACC, accuracy; SEN, sensitivity; SPE, specificity; CI, confidence interval.
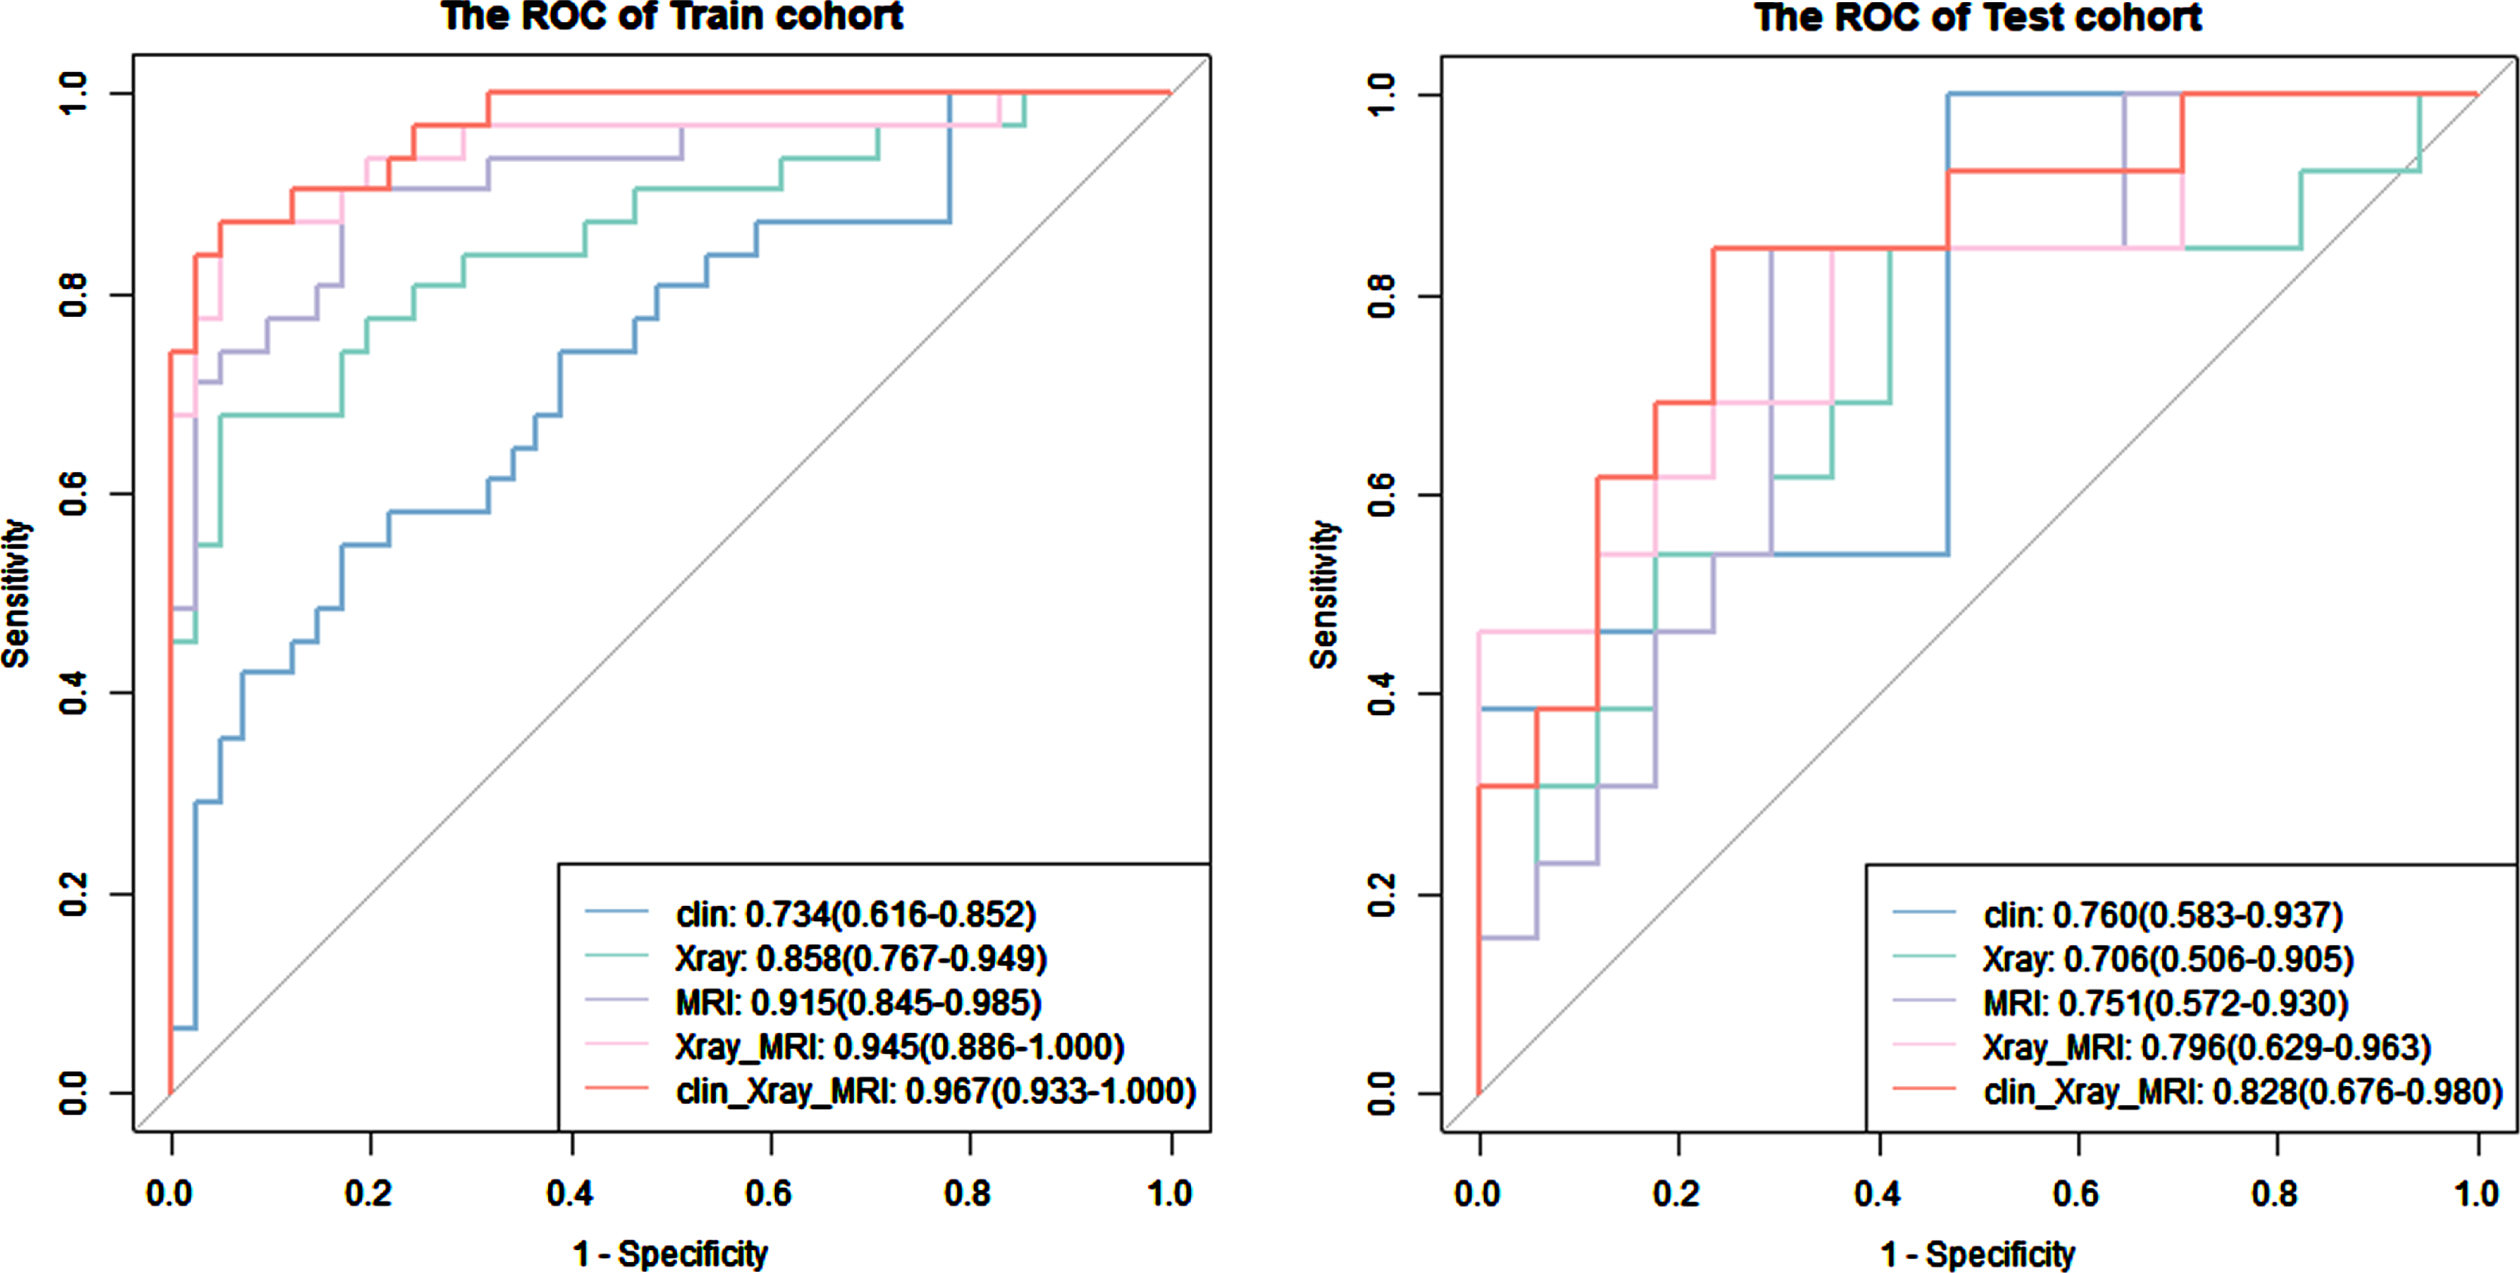
Comparison of the receiver operating characteristic curves of each model in the training (A) and validation (B) cohorts.
Comparison of prediction performance by net reclassification improvement (NRI) and integrated difference improvement (IDI) with relative 95% confidence interval (CI) and significance levels in the training and validation cohorts
Training cohorts in front of the parentheses. Validation cohorts in parentheses. NRI, net reclassification improvement; IDI, integrated difference improvement; CI, confidence interval.
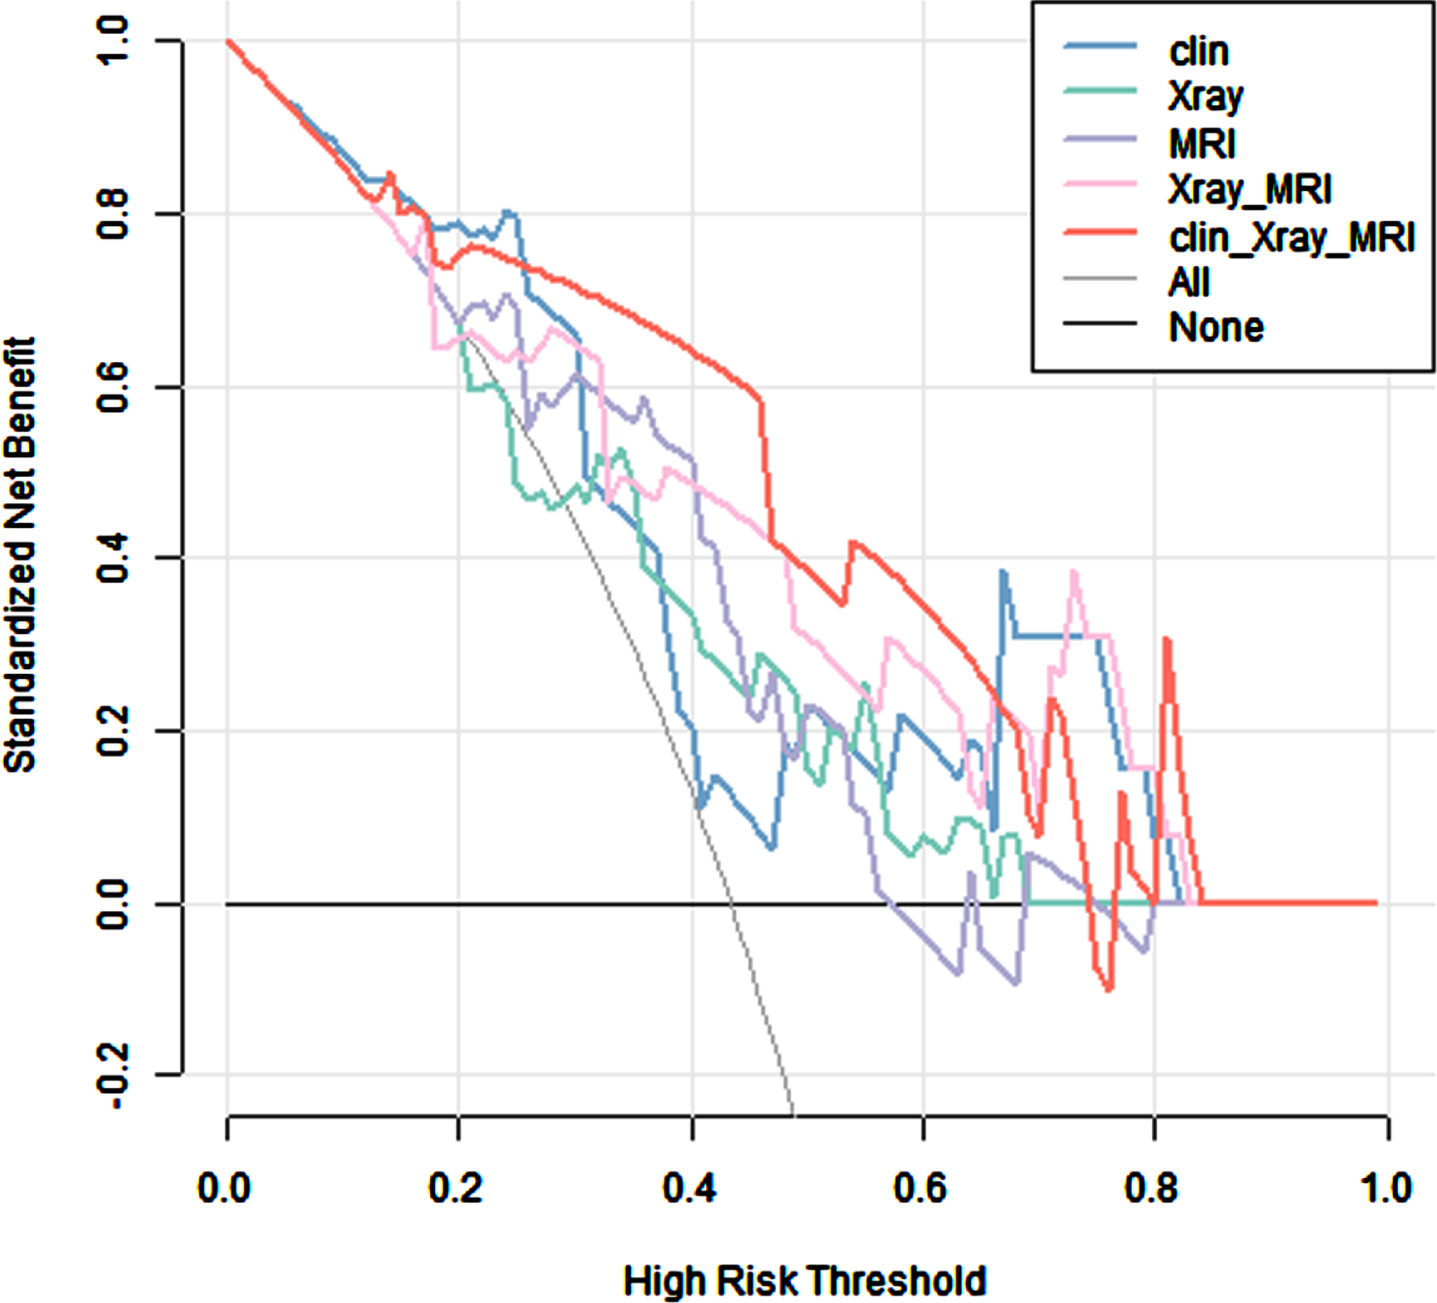
Based on the decision curve analysis curves of the clinical, radiomics and combined models, the combined model showed favourable clinical utility.
In this study, we used radiomics models based on X-ray and MRI data to predict responses to NAC in extremity high-grade osteosarcoma. Although X-ray is a widely used examination method for bone tumours, the study of X-ray radiomics is still rare [26]. In addition to its high resolution, cost effectiveness, and accessibility, X-ray is the primary imaging method of choice as it facilitates the visualisation of certain features of bone lesions (such as bone destruction pattern, periosteal reaction, and matrix mineralization) [27]. This study describes the use of preoperative X-ray radiomics to distinguish between GRs and PRs. The radiomic model based on X-ray images in GRs and PRs showed an AUC of 0.706 (95% CI, 0.506–0.905) in the validation cohort. Despite the selected X-ray features containing several high-dimensional features (grey-level co-occurrence matrix; GLCM, and grey-level dependence matrix; GLDM) that hold more detailed information about the tumour and to some extent reflect the tumour heterogeneity, this model did not obtain a high AUC value. The reason for this may be related to our choice of including 2D segmentation.
Previous studies have demonstrated improved results with 3D tumour segmentations, likely because they provide more radiomic features and points of heterogeneity [28, 29], but 3D tumour segmentations could not be performed on a single radiographic X-ray image in the present study. A previous study demonstrated the use of X-ray radiomics and demographic information to build machine learning models, resulting in AUCs of 0.79 and 0.90 on the internal and external test sets for the classification and differentiation of malignant and benign bone tumours [26]. This represents a substantial difference between the results of previous studies and ours, likely due to the difference in the patient populations studied. Patients included in the present study had a diagnosis of osteosarcoma, whereas those in previous studies included both malignant and benign bone tumours. The radiographic findings such as soft tissue mass and bone destruction provide value in the differential diagnosis of benign and malignant bone tumours. These imaging features were non-specific for the distinction between GRs and PRs.
MRI is the most frequently used method for primary bone tumour diagnosis and post-surgery tumour relapse detection [9]. A previous study reported that T2-weighted MRI radiomic features predicted histologic tumour necrosis in high-grade intramedullary osteosarcoma with a mean AUC of 0.708±0.046 [30]. Zhong et al. built a radiomics model based on coronal T2-fat-saturation images to predict responses to NAC in osteosarcoma patients and reported an AUC of 0.759 (95% CI, 0.589–0.937). The combination of T1-weighted, T2-weighted, and CE-T1-weighted imaging facilitates the detection of tumour blood supply and angiogenesis, as well as morphological information. The multiparametric MRI radiomics model showed an improvement in performance compared to the single-parameter MRI radiomics models. Previous studies in osteosarcoma and other cancers have yielded similar results [31–34].
In our study, the final ten features were selected from axial T1-weighted, T2-weighted, and CE-T1-weighted. Five features associated with GLCM, GLDM, and grey level run length matrix (GLRLM) comprised the MRI radiomic model used to classify GRs/PRs. According to the GLDM from T1-weighted imaging dependence non-uniformity normalized, GRs differ in terms of tissue homogeneity from GRs in terms of VOI homogeneity [35]. The GLCM provides a tabulation of how often different combinations of pixel intensity values occur between neighbouring voxels in an image. GLCMs from T1-weighted and T2-weighted imaging indicated the similarity of voxel values along that direction, homogeneity provided a measure of local grey level uniformity, and correlation reflected the consistency of image texture [36, 37]. Furthermore, the GLRLM from CE-T1-weighted indicated the size of homogeneous runs at each grey level, along with the directionality of intensity homogeneity. These results may suggest that intensity homogeneity differs between GRs and GPs. These results show that the AUC of the model based on radiomics features extracted from multiparametric MRI was 0.751. To obtain the most relevant features, it may be useful to extract radiomic features from the results of multiple different imaging techniques. In combination with X-ray features, the X-ray+MRI radiomic model achieved an AUC of 0.796, an accuracy of 0.733, a sensitivity of 0.846, and a specificity of 0.714 for predicting responses to NAC. The present study, as well as previous research [38], has shown that combining multiple models is highly advantageous, especially when the model performance is poor. The benefits of applying this method have been demonstrated. Although the performance of our MRI model was not as good as the optimal model established by Chen’s study [39], our study further confirms that the addition of X-ray features can better predict pathologic response to NAC in osteosarcoma than can a radiomics model based solely on MRI features.
The present study has demonstrated that, besides ALP, other clinical characteristics, including gender, age, location, tumour size, pathology, destruction, and LDH are not adequate as independent risk factors to predict the effectiveness of NAC for the treatment of osteosarcoma, in agreement with the findings of a previous study using traditional methods [40, 41]. The indices had good predictive performance in the training set (AUC = 0.734, 95% CI, 0.616–0.852) and validation set (AUC = 0.760, 95% CI, 0.583–0.937). The performance of the model was comparable to that of X-ray, MRI, and X-ray+MRI radiomics models (AUC = 0.706, 0.751, 0.796). As a result of incorporating these indices into a prediction model together with radiomics, a more stable prediction capability was achieved in both the training (AUC = 0.967, 95% CI, 0.933–1.000) and validation cohorts (AUC = 0.828, 95% CI, 0.676–0.980). Indeed, the addition of ALP to the radiomic models improved reclassification in both NRI and IDI analyses.
Additionally, this study compared three individual radiomics models, one clinical model, and one combined model. The AUC of the clinical model reached 0.760, which was comparable to that of the radiomic models. In comparison with other models, including the clinical model and radiomic models based on X-rays and multiparametric MRI, the combined model provided an improved predictive power. MRI may provide a more comprehensive picture of the tumour than clinical information alone, as clinical information may only take into account certain aspects of the tumour [42]. Consequently, we achieved better performance when we combined clinical and radiomic features. The machine-learning analysis based on X-ray and multiparametric MRI radiomic features in our study has the potential to predict the pathologic response to NAC in osteosarcoma.
Several limitations of the present study should be indicated. First, this study comprised a retrospective analysis. MRI data were acquired using different protocols and different scanners, which may have affected the extracted features. The study did not comprise a comparative phantom assessment of all scanners. To support the results of the current study, a prospective study should be conducted. Second, our study only included 102 patients, whereas radiomic models benefit from larger training and validation datasets. We excluded some patients who did not receive both X-ray imaging and MRI before surgery, which may have led to selection bias. Validation across multiple centres with a larger sample size is essential for obtaining high-quality evidence for future clinical applications. Third, the model comparison was only conducted between X-ray and T1-weighted, T2-weighted, and CE-T1-weighted MRI, whereas further research should include additional MRI (including, but not necessarily limited to DWI, DCE-MRI, and IVIM) to increase the information available and further improve the value of the model. Fourth, this study focussed on the clinical and MRI features of osteosarcoma. It is possible that other relevant signatures, such as biological, immune, and molecular features, may provide valuable insight for the current findings. Therefore, these factors need to be investigated in future studies.
Conclusions
To predict the pathologic response to NAC in cases of extremity high-grade osteosarcoma, we proposed and developed a non-invasive predictive technique that uses a combination of radiomics and clinical data. The model constructed with the combination of clinical and radiomics features was demonstrated to be more effective in evaluating the pathologic response to NAC of osteosarcoma than either the clinical or radiomics models alone. A predictive tool of this type could facilitate the selection of suitable patients for NAC and identify patients with PRs in need of more personalized care so that ineffective treatment courses can be avoided.