
Abstract
BACKGROUND:
Pulmonary granulomatous nodules (GN) with spiculation or lobulation have a similar morphological appearance to solid lung adenocarcinoma (SADC) under computed tomography (CT). However, these two kinds of solid pulmonary nodules (SPN) have different malignancies and are sometimes misdiagnosed.
OBJECTIVE:
This study aims to predict malignancies of SPNs by a deep learning model automatically.
METHODS:
A chimeric label with self-supervised learning (CLSSL) is proposed to pre-train a ResNet-based network (CLSSL-ResNet) for distinguishing isolated atypical GN from SADC in CT images. The malignancy, rotation, and morphology labels are integrated into a chimeric label and utilized to pre-train a ResNet50. The pre-trained ResNet50 is then transferred and fine-tuned to predict the malignancy of SPN. Two image datasets of 428 subjects (Dataset1, 307; Dataset2, 121) from different hospitals are collected. Dataset1 is divided into training, validation, and test data by a ratio of 7:1:2 to develop the model. Dataset2 is utilized as an external validation dataset.
RESULTS:
CLSSL-ResNet achieves an area under the ROC curve (AUC) of 0.944 and an accuracy (ACC) of 91.3%, which was much higher than that of the consensus of two experienced chest radiologists (77.3%). CLSSL-ResNet also outperforms other self-supervised learning models and many counterparts of other backbone networks. In Dataset2, AUC and ACC of CLSSL-ResNet are 0.923 and 89.3%, respectively. Additionally, the ablation experiment result indicates higher efficiency of the chimeric label.
CONCLUSION:
CLSSL with morphology labels can increase the ability of feature representation by deep networks. As a non-invasive method, CLSSL-ResNet can distinguish GN from SADC via CT images and may support clinical diagnoses after further validation.
Keywords
Introduction
Lung cancer (LC) is the most common malignant disease and a major cause of cancer-induced deaths around the world. According to GLOBOCAN 2018, LC is the leading cause of cancer morbidity and mortality worldwide, with 2.1 million new cases (11.6% of total cancer cases) and 1.8 million deaths (18.4% of total cancer deaths) [1]. Tobacco smoking, tobacco smoke carcinogens, electronic nicotine delivery systems and e-cigarettes, air pollution, occupational exposures (asbestos), genetic predisposition, history of cancer, and chronic lung diseases are leading causes of LC [2]. The five-year survival rate for LC is 18%, which is among the worst for all cancers [3]. Early diagnosis of LC can prevent its progression and metastasis, thus improving the survival rate of patients.
A solitary pulmonary nodule (SPN) appears as a rounded opaque entity that has a diameter of <3 cm and is surrounded by pulmonary parenchyma. It appears without other abnormalities and presents homogeneous soft-tissue attenuation in computed tomography (CT) images [4]. The American Cancer Society reports that approximately 20–30% of LC patients have an initial radiographic SPN finding [5]. Early diagnosis of SPN is very important in clinical practice because it may represent either a benign pulmonary nodule that does not require surgical resection or it could be an early and potentially malignant lesion. Currently, the recommended modality for assessment of SPN is chest CT. However, on CT imaging, solitary granulomatous nodules (GN) with a spiculated or lobulated appearance are morphologically similar to solid lung adenocarcinoma (SADC) [6]. According to previous reports, more than 26% of suspicious lung nodules removed in the United States each year are determined to be benign, which means that $600 million a year is wasted on unnecessary invasive surgery [7]. Therefore, the development of a non-invasive diagnostic method for SPN will be immensely helpful for clinical practice.
The emergence of computer-aided diagnosis (CAD) systems offers a good solution to this problem. Various research groups have developed high-performance CAD systems to distinguish GN from SADC [8–13]. For example, Yeng et al. [8] used radiomic features extracted from CT images, followed by regression models to screen for the best radiomic features to build a model that could differentiate GN from SADC. The area under the curve (AUC) of their internal test was 0.841, with sensitivity and specificity of 0.825 and 0.75, respectively. However, to apply such a CAD system in routine clinical practice, advanced methods are needed to improve the accuracy of the model.
Self-supervised learning uses pretext tasks to obtain valuable information from large-scale unlabeled data [14], which allows resulting visual representations to be successfully applied in the field of natural images [15–17]. In the past two years, self-supervised learning methods based on contrastive learning have developed rapidly [18–21]. Because self-supervised learning narrows the distance between positive pair representations and widens the distance between negative pair representations, it has proven to be very successful. Therefore, many researchers apply self-supervised learning to medical image analysis and shift the pre-trained models to downstream tasks, which can close the accuracy gap between unsupervised and supervised learning [22–25]. However, no research has addressed the application of self-supervised learning to classification and differentiation between GN and SADC.
Based on the available studies and state-of-the-art in the field, we propose a model to predict the malignancy of solitary pulmonary nodules based on chimeric label with self-supervised learning (CLSSL-ResNet). The core idea behind the CLSSL-ResNet method is to use a chimeric label as a pretext task for self-supervised learning. Chimeric labels are generated by combining original, rotated, and morphological labels during a single unified pretext task on the joint distribution of raw and self-supervised labels. The strengths of this model are that the original labels help correlate the features extracted from the model with the pathology of the lesions, the rotated labels enable the model to focus on the local features of the lesions while identifying their orientation and spatial location, and the morphological labels enable the model to focus on the overall characteristics of the lesions and identify their morphological volume.
The main contributions of this paper are four aspects. First, self-supervised learning is applied to the differentiation of GN and SADC via CT images. Second, a CLSSL-ResNet self-supervised neural network model has been proposed and tested using two datasets, which combines the original task with the self-supervised task and generates a single unified task with a joint distribution. Third, a pretext task is proposed, which combines original, rotated, and morphological labels to generate chimeric labels. Fourth, extensive ablation and comparative experiments have been performed to evaluate the proposed CLSSL-ResNet.
Materials and methods
Data collection
Two datasets from two hospitals with a total of 428 patients were collected and used in this retrospective study. Dataset1 included chest CT images of 307 patients, who were enrolled in the Fifth Affiliated Hospital of Guangzhou Medical University from January 2016 to December 2017. Dataset2 included CT images of 121 patients from Shengjing Hospital of China Medical University using the same inclusion and exclusion criteria. Dataset2 was used to verify the generalization ability of the model as an external validation dataset. This retrospective study was approved by the ethics committee of the Fifth Affiliated Hospital of Guangzhou Medical University and Shengjing Hospital of China Medical University; informed consent was waived.
There were three inclusion criteria. (1) The patient was confirmed with lung adenocarcinoma or GN (tuberculous or fungal granuloma) by the pathology acquired from the surgical resection or biopsy; (2) A non-contrast chest CT scan was performed within two weeks of surgery; (3) The SPN was solitary, solid with a diameter of 7–30 mm and presented spiculation, lobulations, and pleural indentations, but it did not present calcification, fat, atelectasis, or lymphadenopathy.
Meanwhile, there were two exclusion criteria. (1) The patient had nodules that were supposed to be benign (e.g., a tuberculous ball with caseous necrosis); (2) The patient had a history of other malignant or combined malignant lesions. Some typical examples (both CT and pathology images) can be seen in Fig. 1.

Sample lesion images (CT and pathology) of GN and SADC in the dataset.
Using the complete chest CT images as input of a convolutional neural network not only increases the computing consumption but also increases the interfering information around the lesion. Therefore, we used the patches of the lesion as input. Our data preprocessing steps were as follows: First, in Dataset1, chest CT images were acquired at 80 kVp (n = 1), 100 kVp (n = 6), 110 kVp (n = 57), 120 kVp (n = 201) and 130 kVp (n = 42), 308.54±179.22 mAs, and 2.15±0.71 mm slice thickness; In Dataset2, images were acquired at 120 kVp (n = 121), 189.81±104.52 mAs, and 4.17±1.14 mm slice thickness. During the data preprocessing stage, the original CT images were resampled using linear interpolation to achieve a pixel spacing of 1×1 mm and a slice thickness of 1 mm. Second, the window width and window level of the CT data were adjusted to 1400 HU and –500 HU, respectively. Third, according to the maximum lesion diameter of 30 mm, the patch size was selected to be 40×40 mm. Fourth, based on the center of the lesion in each patient, the patch with the maximum lesion cross-section area was captured in the transverse plane. The bounding box of this patch was then translated to the upper and lower slices to obtain the other two patches. In other words, the three patches were used to indicate a lesion. The process is shown in Fig. 2.
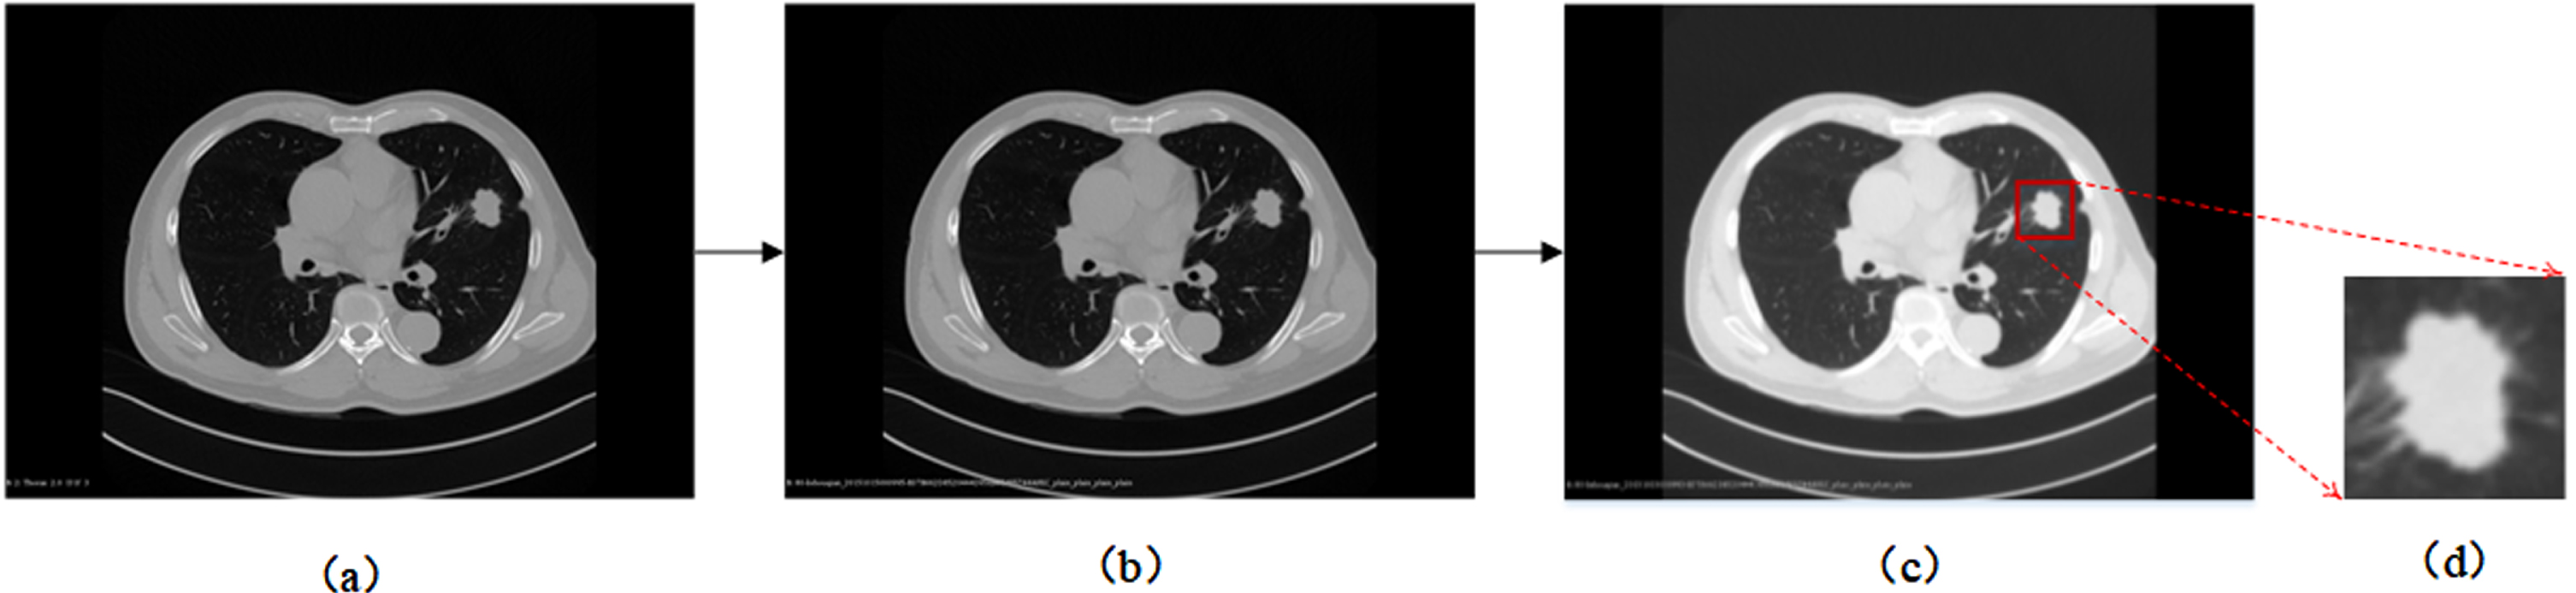
The process of obtaining the center patch of a lesion in the original CT image. (a) Original images; (b) After linear interpolation, the voxel spacing is 1×1 mm; (c) The window width is adjusted to 1400 HU, and the window level is set to –500 HU; (d) A patch of size 40×40 is extracted based on the center point of the lesion.
In Dataset1, patients and their image patches were divided into training sets, validation sets, and test sets at 7:1:2. To prevent information leakage, we performed patient-level partitioning when dividing the dataset into training, validation, and testing sets. As a result, patches extracted from the same patient’s CT images will not be assigned to different sets. We extract three consecutive slices from each lesion, including the central slice of each lesion and one slice before and after it, which were extracted as patches for training the neural network. The training set included 444 SADC patches from 148 patients and 198 GN patches from 66 patients. The validation set included 63 SADC patches from 21 patients and 30 GN patches from 10 patients. The test set consisted of 126 SADC patches from 42 patients and 60 GN patches from 20 patients. In Dataset2, there were 222 SADC patches from 74 patients and 141 GN patches from 47 patients. We summarize the details of the clinical characteristics of Dataset1 in Table 1.
Clinic characteristics of patients in Dataset1
*Indicates that the significance is available. a,bIndicates the two-sample t-test and Chi-square test, respectively.
The most advanced self-supervised representation learning methods are based on unlabeled data sets that lack manual annotation. In this section, we will elaborate on how self-supervised representation learning can significantly improve model accuracy on fully labeled datasets of the lung CT image. Figure 3 depicts the overview of the study procedure. First, the original dataset was passed through a chimerism process to generate transformed data for self-supervised learning, and chimeric labels were generated as pretext task training. The chimeric labeling approach is a more challenging task compared to conventional supervised training in computer-aided diagnosis schemes that rely on pathology-based “ground truth". By chimeric labels, the network is trained to simultaneously classify the rotation angle, morphological characteristics, and malignancy of the lesions. This allows the network to focus on both global and local features of the lesions during the training process, leading to improved performance in downstream fine-tuning compared to using only basic ground truth as labels. Then, image features were represented by using a feature extractor. Finally, the pretrained backbone network was transferred to and fine-tuned by the downstream task (the classification between GN and SADC).
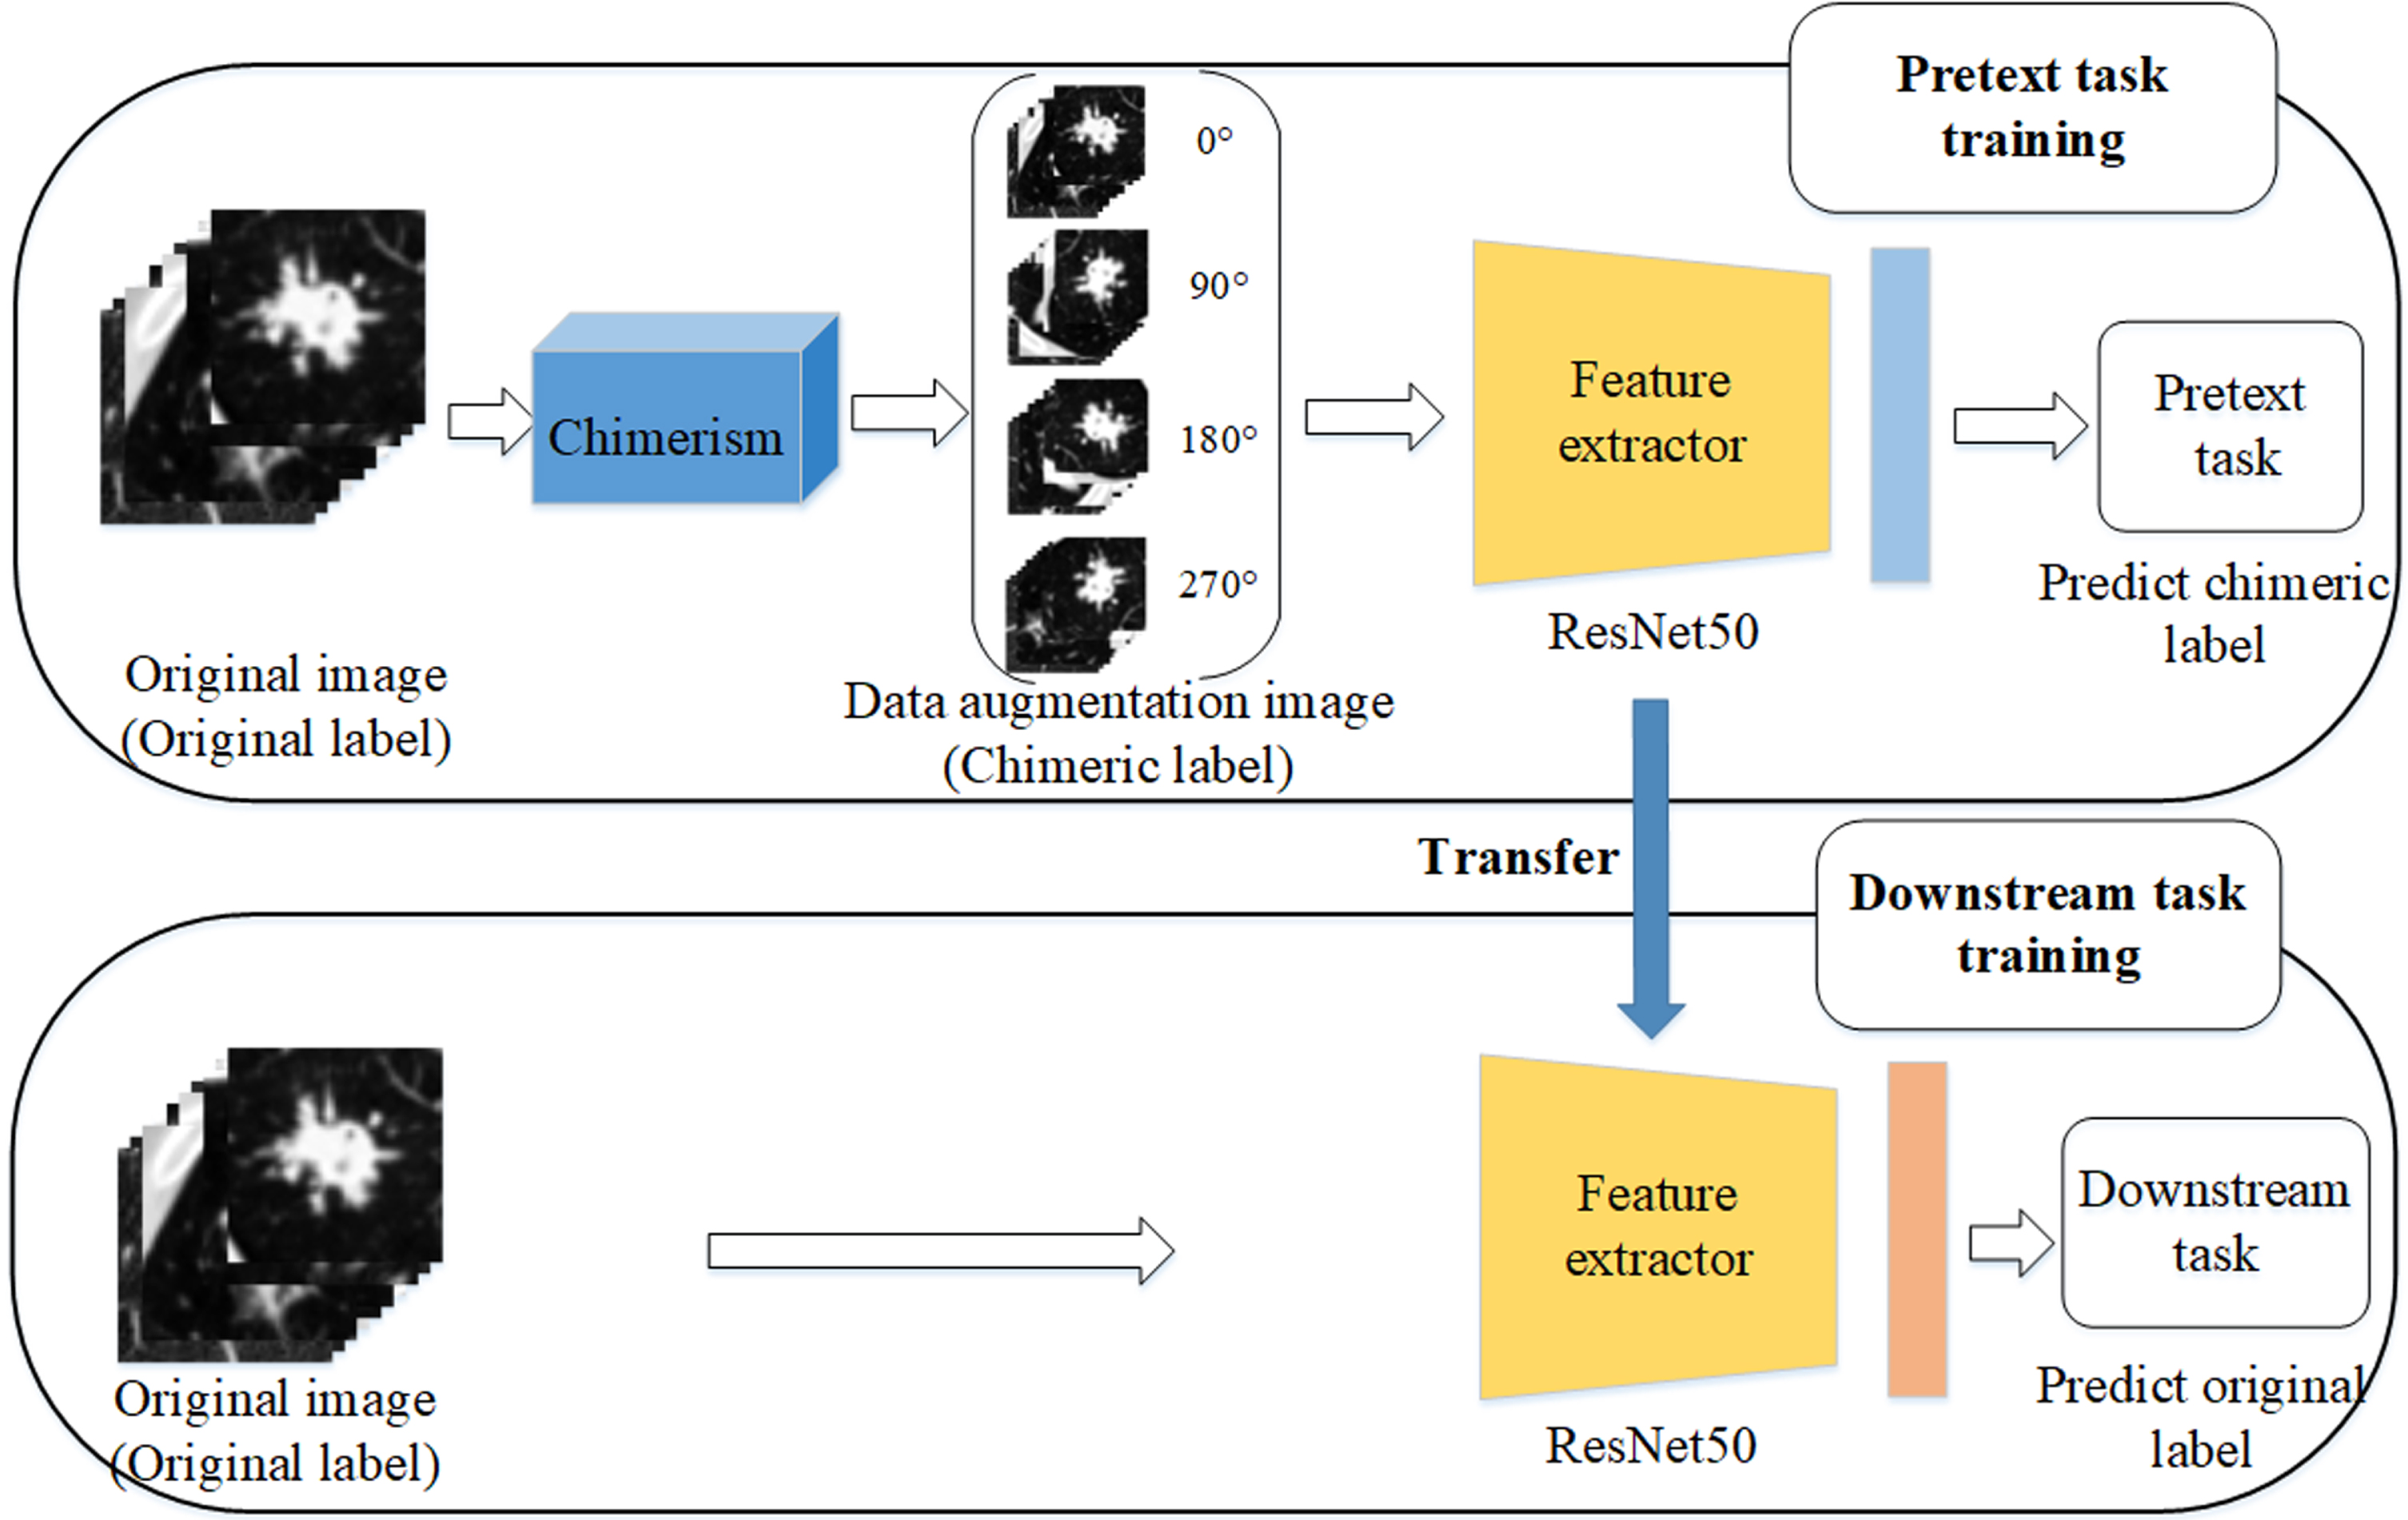
Overview of the study procedure.
Figure 4 shows the framework of our proposed CLSSL-ResNet method. The core idea here was to establish a single unified task of the original and self-supervised labels, namely the chimeric label. Chimeric labels are composed of three types of pseudo labels. In our study, the first type of pseudo label was the original label (0, 1), where “0” and “1” denote GN and SADC, respectively. The second type of pseudo label was the rotation angle recorded at four angles (0°, 90°, 180°, and 270°). The third type of pseudo label was the morphological feature of the lesion, which was determined by measuring the size of the lesion by calculating its maximum diameter. Finally, the three types of pseudo labels were chimerized to generate 16 categories of chimeric labels. The following sections give details on each step. ResNet50 was used as the feature extractor in this study, and its structure is shown in Fig. 5.
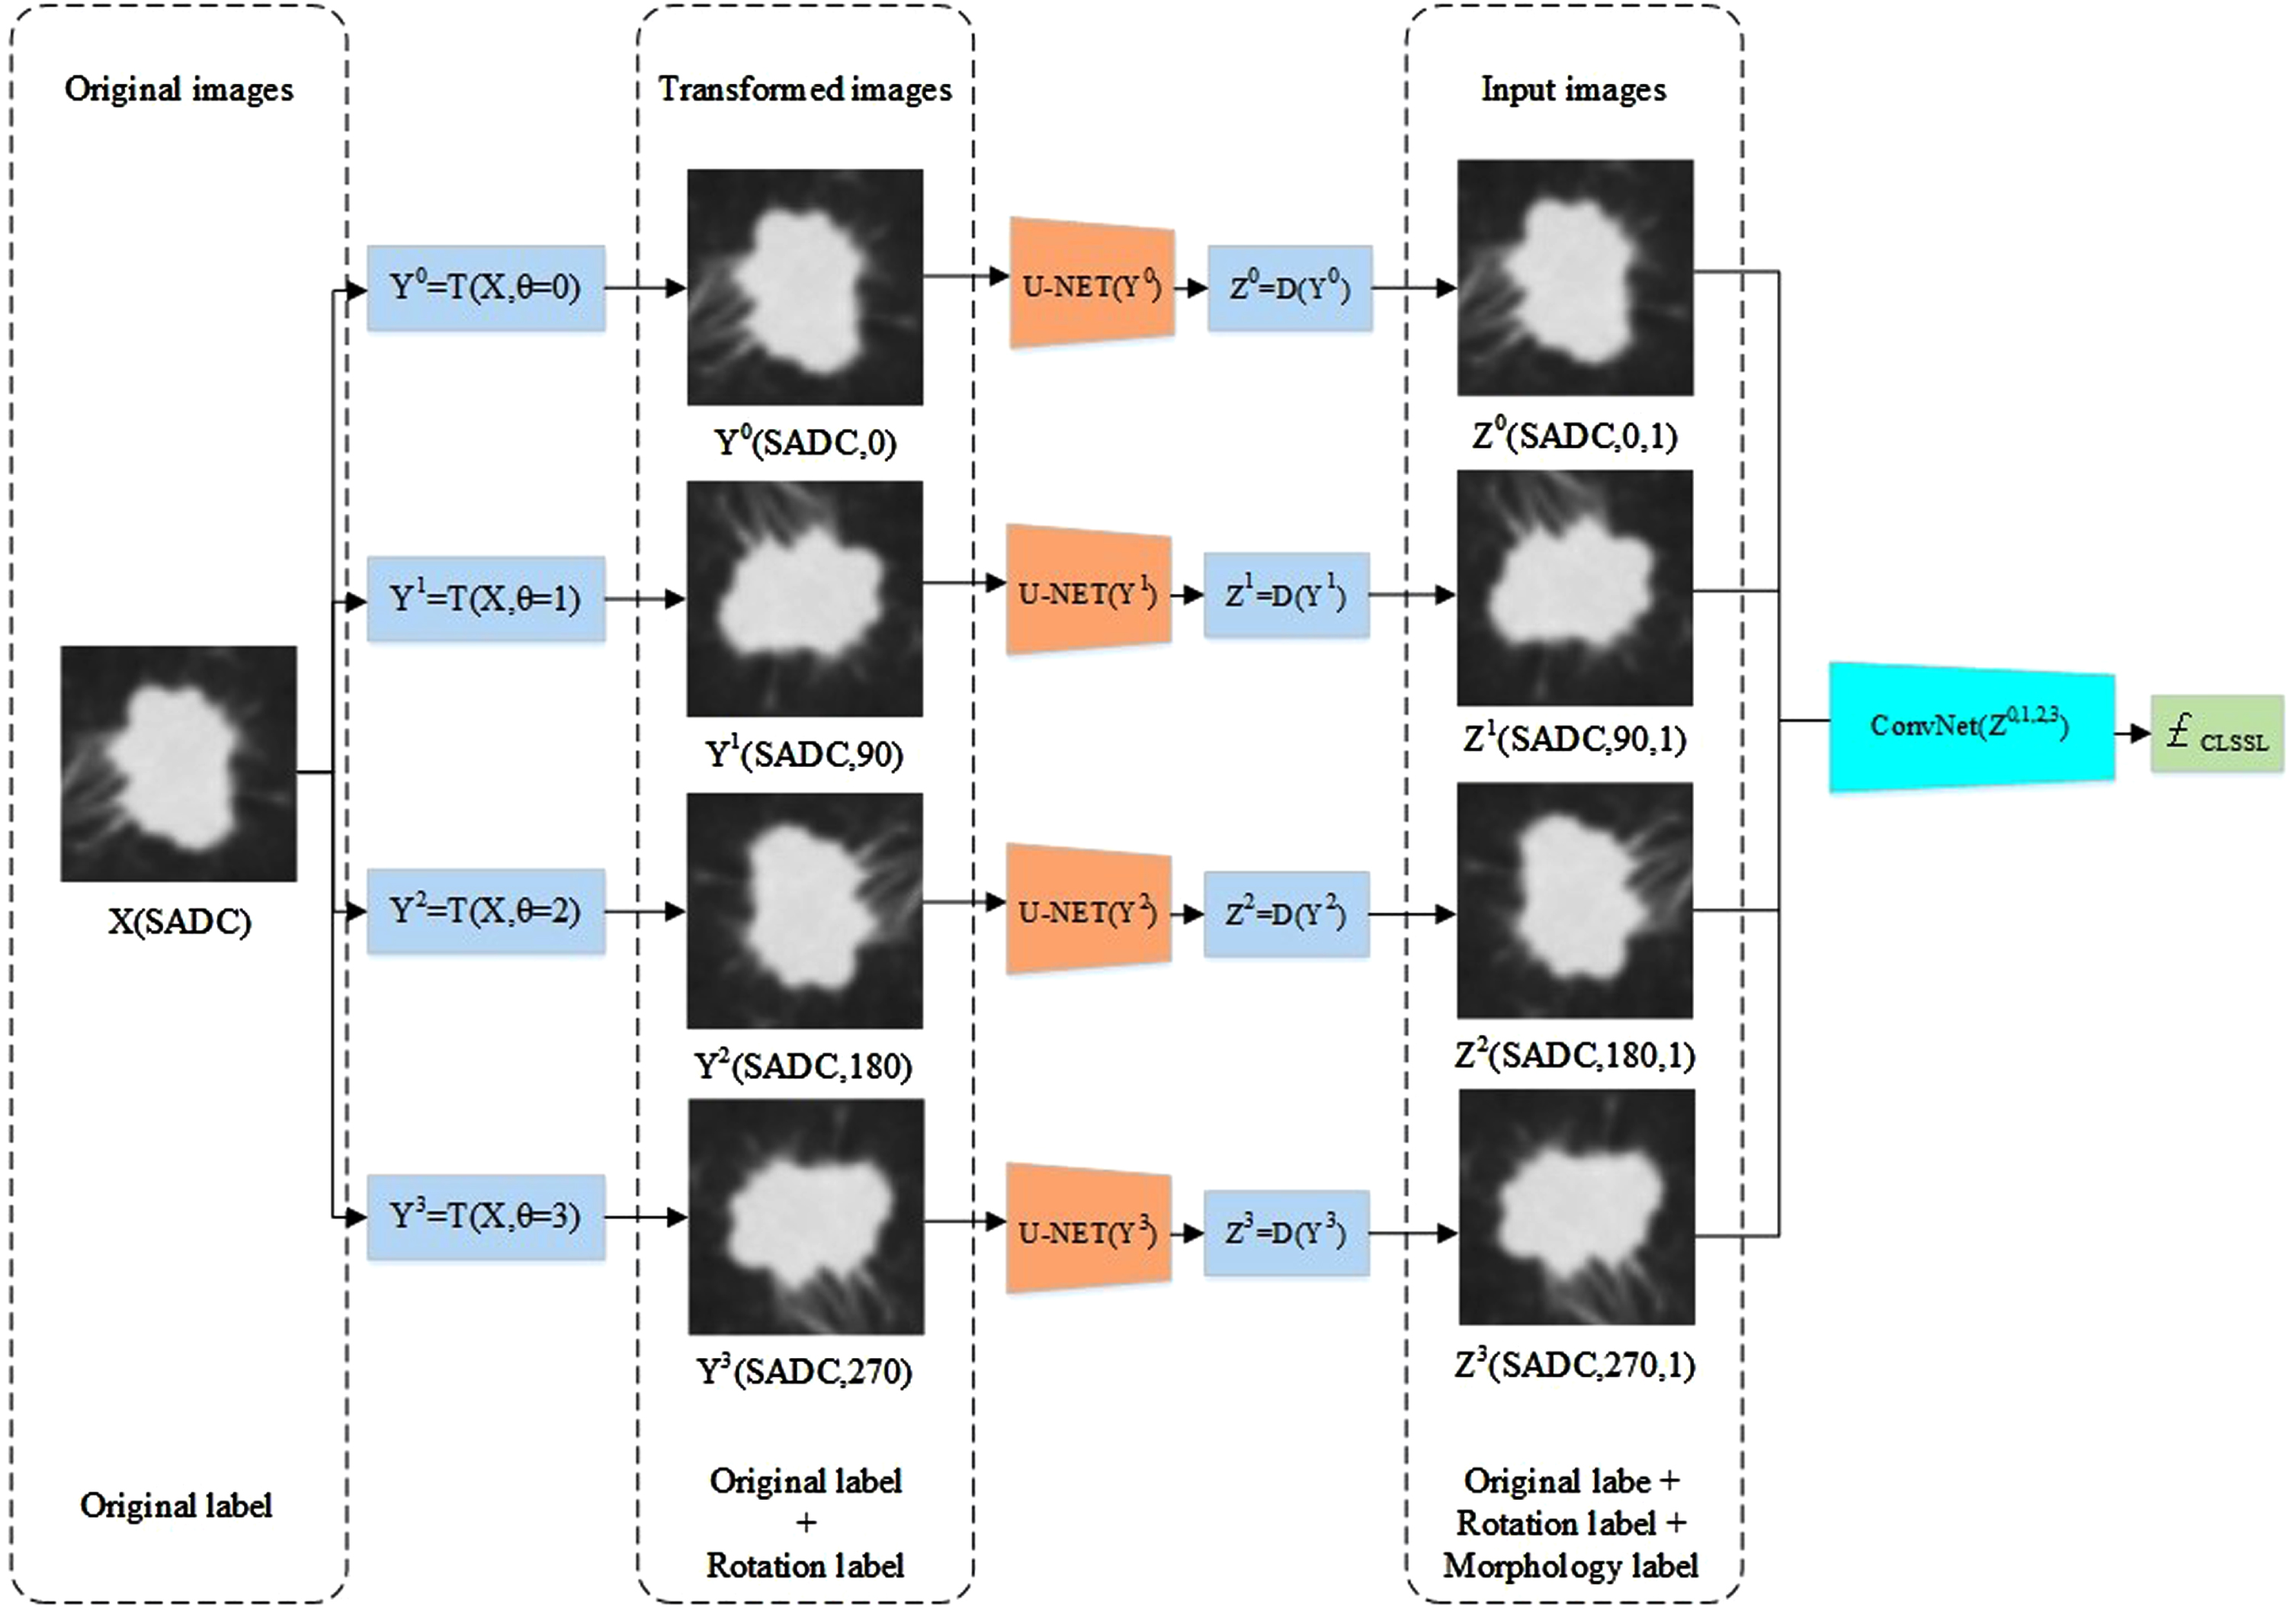
Framework of CLSSL-ResNet.

The architecture of the ResNet50.
The CT image patch of the lesion was rotated by a multiple of 90 degrees, that is, 2D images in the dataset were rotated by 0°, 90°, 180°, and 270°. According to the method of reference [15], different rotation transforms of N were introduced to operate on the dataset, and the geometric rotation set of the image was
The main purpose of rotating the image of the lesion and generating the geometric rotation pseudo-label was to enable the convolutional neural network to learn to recognize and detect the local features of the lesion. More specifically, to successfully predict the rotation angle of the lesion image, the convolutional neural network had to learn to locate the prominent local features of the lesion, identify its direction and spatial location throughout the lung, and then correlate these parameters with one another. However, such an approach ignores the overall characteristics of the lesion.
Image morphology label
Morphological features are obtained by the lesion size, which is defined as the maximum diameter of the lesion on axial images. We use the trained 2D U-NET model to segment lesions. The maximum diameter, dia (X), of the lesion was then calculated, and the maximum diameter was used to generate pseudo-labels of the morphological features of the lesion according to the threshold T.
where X is the CT image patch containing the lesion; dia (X) represents the maximum diameter of the lesion in X, D (X) ∈ {1 . . M}, where M is the number of classes; and the threshold was set to T = 1.95 cm. The selection of the threshold value was based on the advice of clinical physicians and analysis of the data presented in Table 1. The range of values corresponding to the average volume of the two lesion types was chosen as the threshold range. Extensive experimentation was conducted to compare the performance of the model using different threshold values. It was determined that the model achieved the best results when the threshold value was set to T = 1.95 cm.
According to the confirmation and statistical analysis of CT images in the dataset by professional physicians, solitary SADC had a larger lesion diameter than solitary GN in terms of morphological features. Therefore, to obtain morphological features of lesions, the convolutional neural network needed to focus more on the overall features of lesions, predict whether the lesions were benign or malignant, and then eventually associate the overall features noted with the benign and malignant nature of the lesions.
Chimeric labels are composed of three types of pseudo labels: original image, image rotation, and image morphology labels. Combining the original label with the self-supervised label can effectively make the convolutional neural network relax certain invariant constraints when learning both the original and the self-supervised tasks. This allows us to train the model more easily. In self-supervised labeling, the image rotation and image morphology labels were fused, so that the convolutional neural network could extract local and global features from the lesions respectively, which greatly improved the ability of the network to extract lesion features.
We used X ∈ R as input, and y as labels.
where the
We used AUC (95% CI (confidence interval)), accuracy (ACC), sensitivity (SEN), and specificity (SPE) to evaluate the performance of the model. True positives were positive samples that were correctly predicted to be positive by the model (TP). True negatives were negative samples that were correctly predicted to be negative by the model (TN). Negative samples that were falsely predicted to be positive were false positives (FP). Positive samples that were falsely predicted to be negative were false negatives (FN). ACC is the sum of the number of TP and TN as a percentage of the total number of subjects.
SEN is the percentage of all positive samples that were predicted to be positive.
The proportion of all negative samples predicted to be negative is SPE.
In the field of clinical medical examination, the receiver operating characteristic curve (ROC) can not only be used for comparison between different examination methods, but it also helps evaluate clinical standards of examination items. It can also be used for the determination of demarcation points between normal and abnormal items. AUC is the area enclosed by the ROC curve and the coordinate axis. 95% CI stands for confidence interval, which refers to the estimated interval of population parameters constructed from sample statistics.
An ablation experiment is a technique used to assess the contribution and impact of specific components or factors within a system or model. It involves systematically removing or disabling certain elements or features and observing the resulting changes in performance or behaviour. In the context of biomedical engineering, ablation experiments can be used to investigate the importance of certain model components, input features, or parameters in a predictive model or system.
Class activation mapping (CAM) is a technique used to visualize and understand the discriminative regions within an image that contribute to a specific prediction made by a convolutional neural network [26]. CAM provides insights into the areas of an image that the network focuses on to make its classification decision. By highlighting the regions that are most relevant to a particular class, CAM helps interpret the decision-making process of CNN. This process generates a spatial activation map, highlighting the regions that contribute most to the predicted class. By overlaying the activation map onto the input image, it becomes possible to visualize the areas that the model considers important for its classification decision.
Experimental environment
In this paper, all experiments were carried out on a local workstation with 64 GB RAM and Windows 10 Operating System. We programmed by using version 3.6 of the Python programming language. Pytorch 1.6.0 deep learning library was used to build the model. The GPU of the workstation was an NVIDIA GeForce RTX 3060 and the processor was an Intel(R) Core (TM) i7-10700 CPU @ 2.90 GHz. When training the neural network, we set the training batch size to 128 and the epoch to 500. In addition, we used the Kaiming method to initialize the weight; the initial learning rate was 0.0005, which decayed to 1/10 of the previous rate every 100 epochs, and the AdamW optimizer was used.
Results
Performance of CLSSL-ResNet
In the test set of Dataset1 that included 186 patches, CLSSL-ResNet achieved great performance: the AUC was 0.944 with a 95% CI of 0.910–0.968; the ACC was 91.3%; SEN and SPE were 91.67 and 91.27%, respectively. The ROC curve and confusion matrix are shown in Fig. 6. Within 60 GN patches, only 5 patches were incorrectly predicted as SADC. In addition, 11 of the 126 SADC patches were incorrectly predicted.
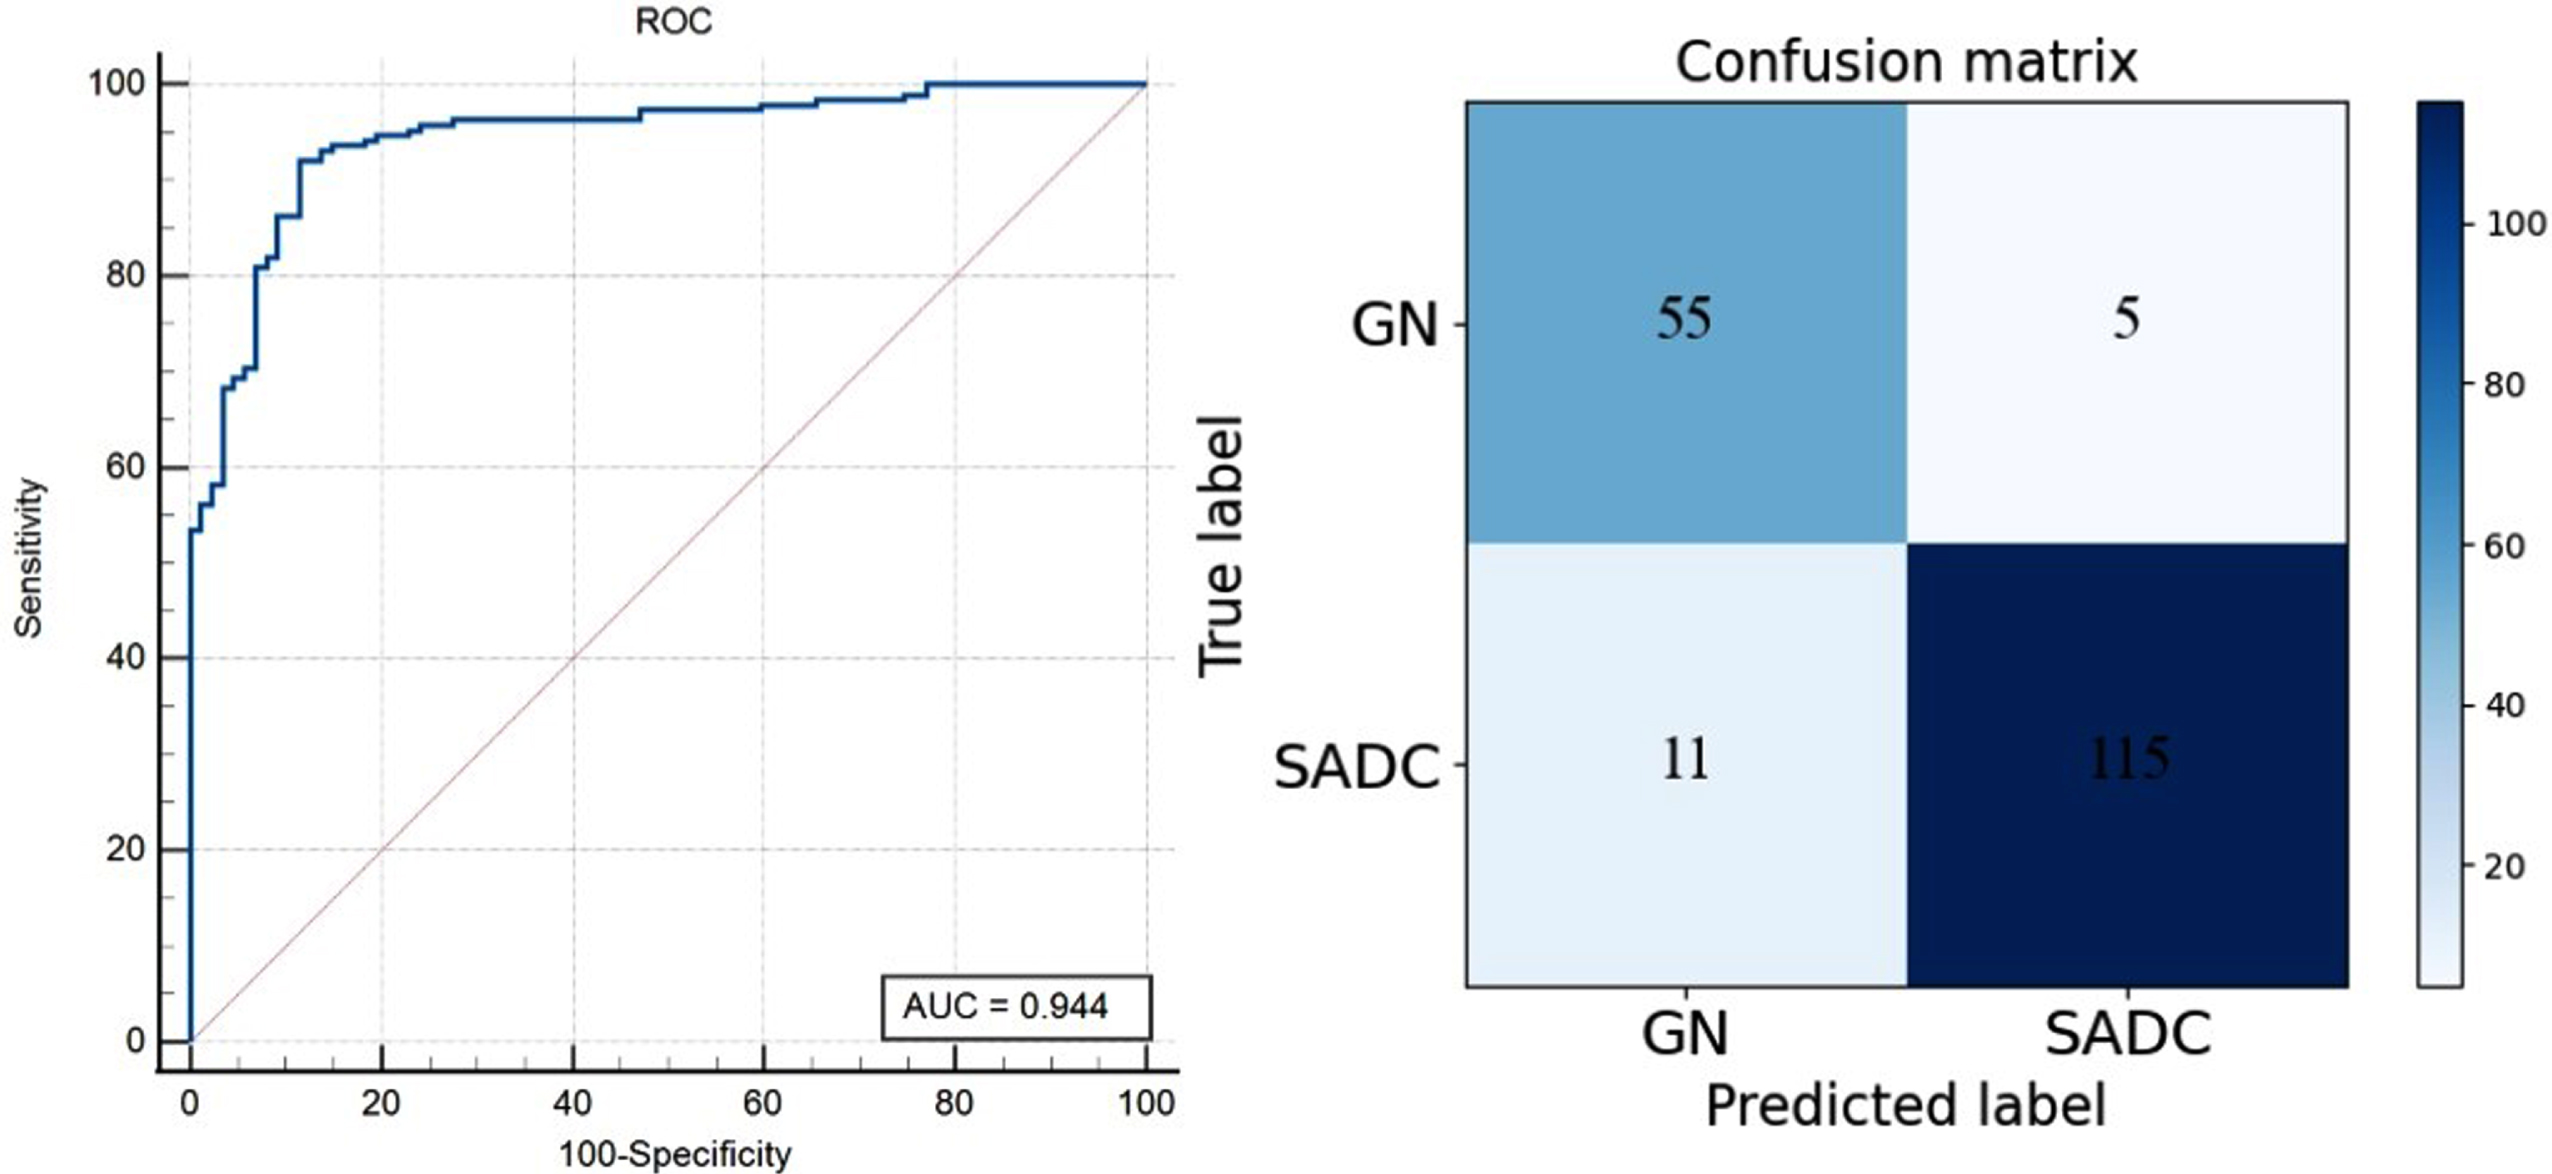
ROC curve and confusion matrix of CLSSL-ResNet at Dataset1 (Patch-level).
Since each lesion contains three patches, we achieved patient-level prediction through a soft-voting method. Soft voting involves combining the predictions of multiple patches to make a patient-level prediction. Soft voting calculates the average value of the confidence or probability scores of three patches. This approach considers the uncertainty and variability in the patch-level predictions and aims to provide a more robust and accurate prediction at the patient level. Its ROC curve and confusion matrix are shown in Fig. 7. The AUC, ACC, SEN, and SPE of CLSSL-ResNet were 0.954, 91.9%, 90.00%, and 92.86% respectively. We also counted the results of independent reviews by two chest radiologists with 5 to 10 years of clinical experience, and if their review results were inconsistent, a consensus was reached through discussion. The AUC, ACC, SEN, and SPE of chest radiologists were 0.795, 77.4%, 65.00%, and 83.33%, respectively. As compared to the chest radiologists, the CLSSL-ResNet developed here showed a superior prediction ability.
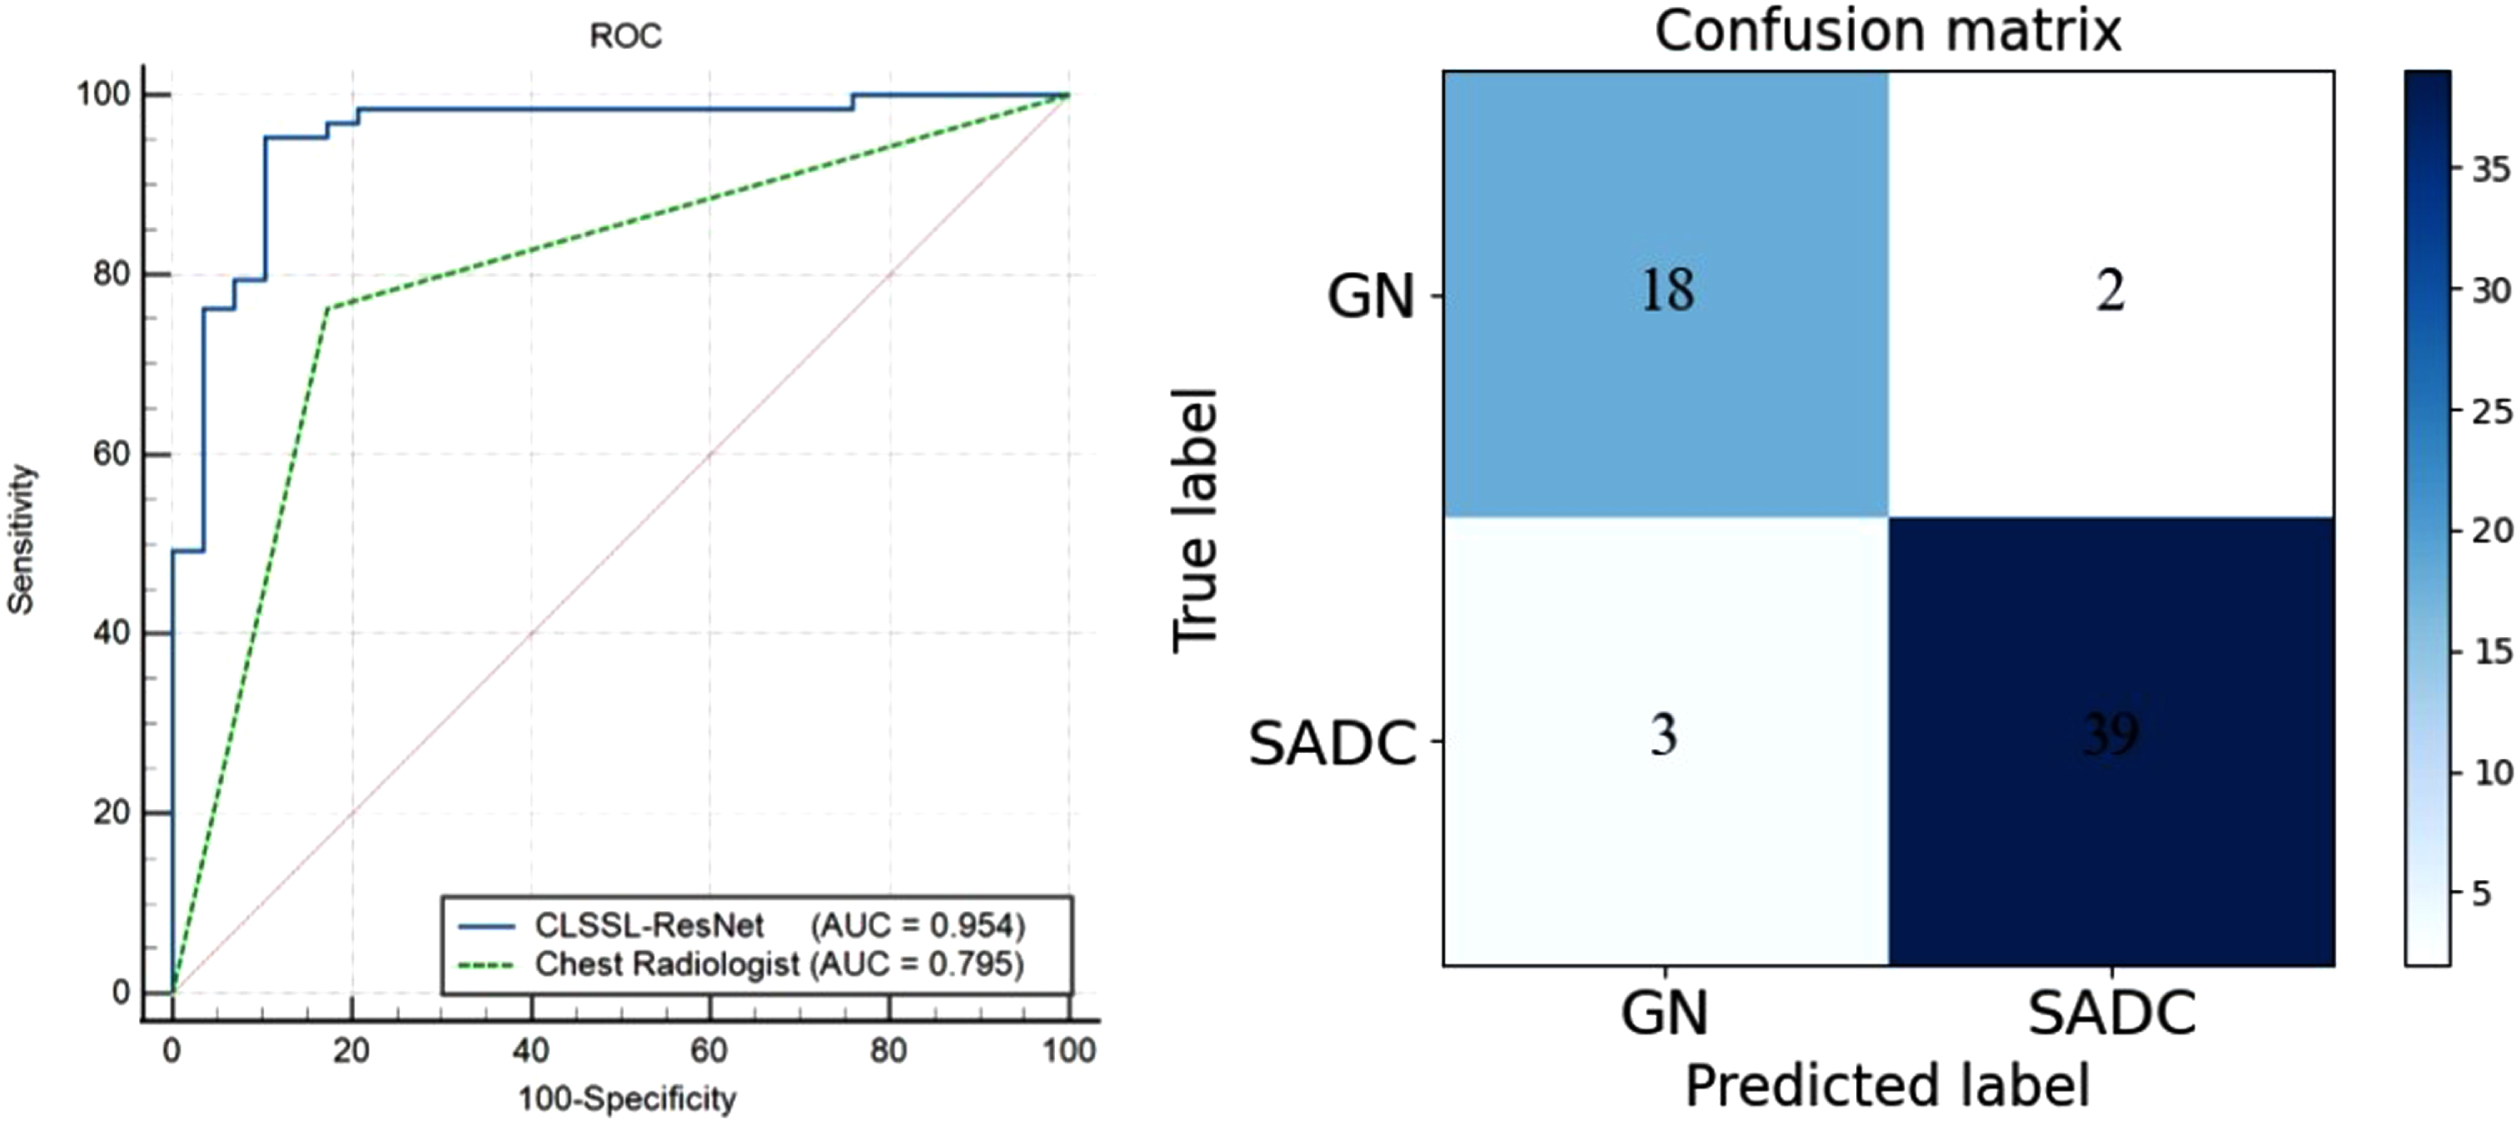
ROC curves and confusion matrix of CLSSL-ResNet at Dataset1 (Patient-level).
In Fig. 8, to demonstrate the hashing ability of CLSSL-ResNet, we use the T-SNE method to map the 2048-dimensional feature vector extracted by the convolutional neural network into 2D space. It was found that most of the GN and SADC patches in the training and test sets could be distinguished successfully. Only a few GN and SADC patches were mixed.
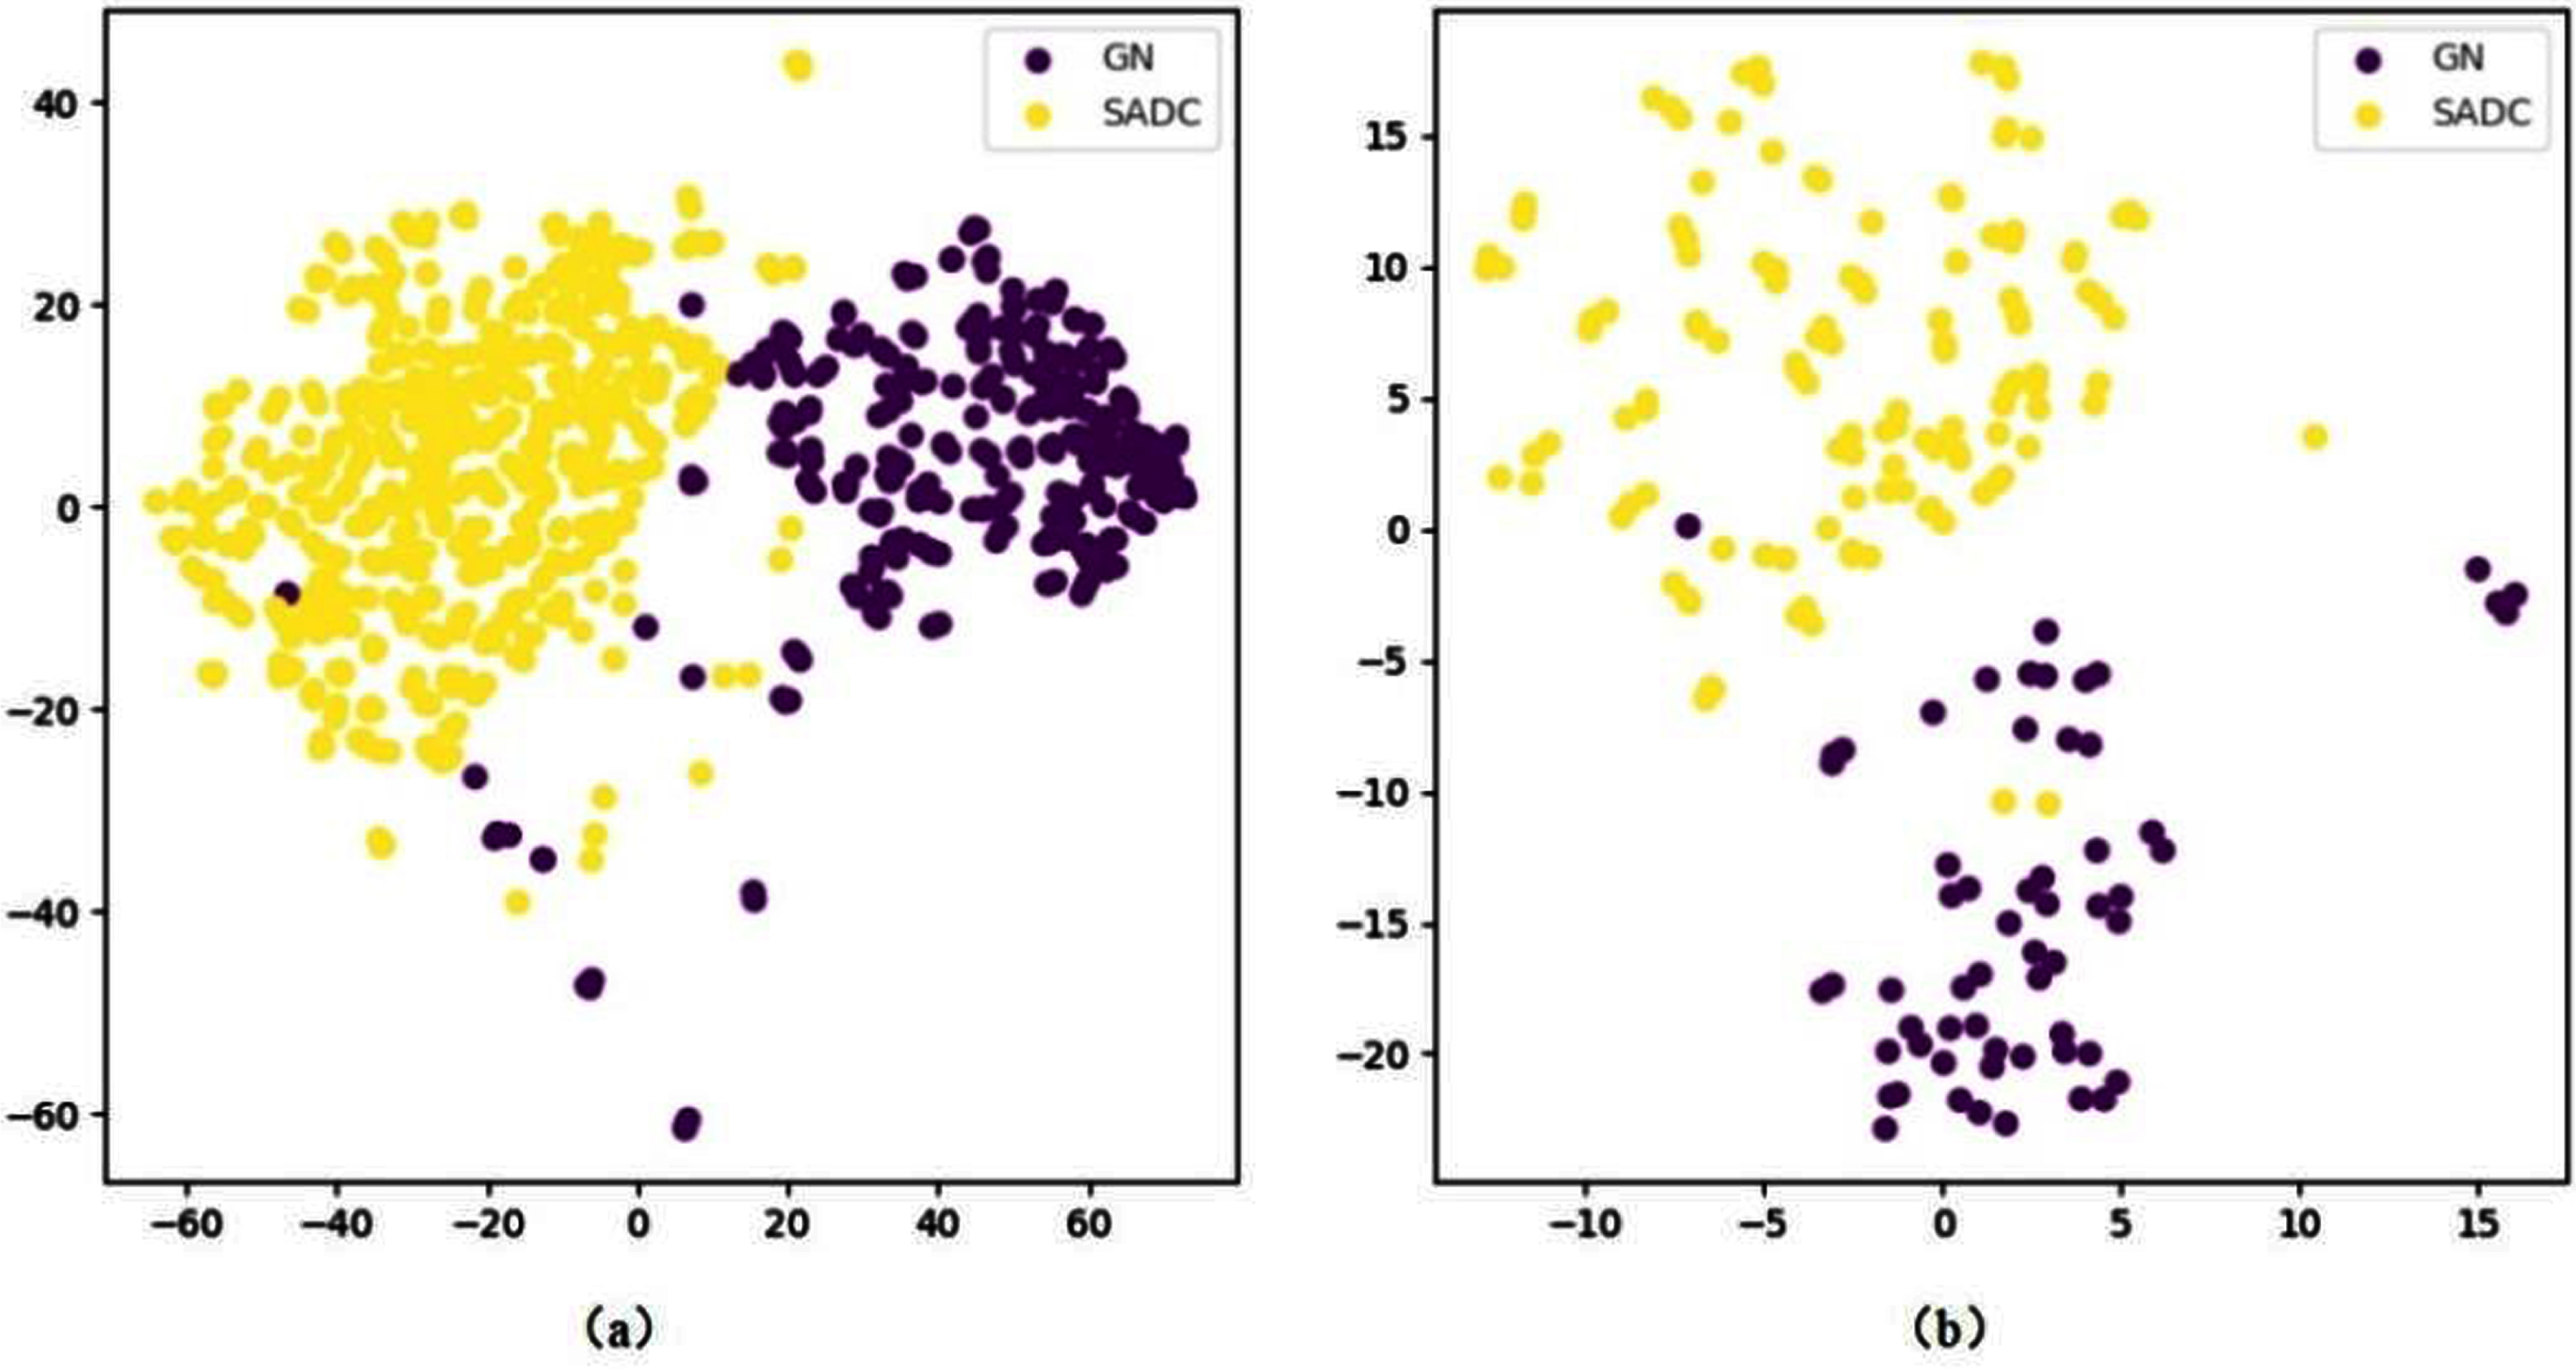
The 2D scatterplot by T-SNE. (a) T-SNE of the training set (b) T-SNE of the test set.
We used an external validation dataset to test the generalization ability of the CLSSL-ResNet method. The external validation dataset refers to an independent dataset that is separate from the datasets used for training, testing or validation in the study. It is used to assess the generalization ability and performance of a model. At the patch level, the ROC curve and confusion matrix are shown in Fig. 9. The AUC (95% CI), ACC, SEN, and SPE of CLSSL-ResNet were 0.923 (0.885–0.951), 89.3%, 85.82%, and 91.44%, respectively. Figure 10 depicts the ROC curves and the confusion matrix at the patient level. The AUC (95% CI), ACC, SEN, and SPE of CLSSL-ResNet were 0.925 (0.851–0.970), 89.3%, 85.10%, and 91.89%, respectively. These values strongly indicate that the CLSSL-ResNet method developed here offers excellent generalization ability.
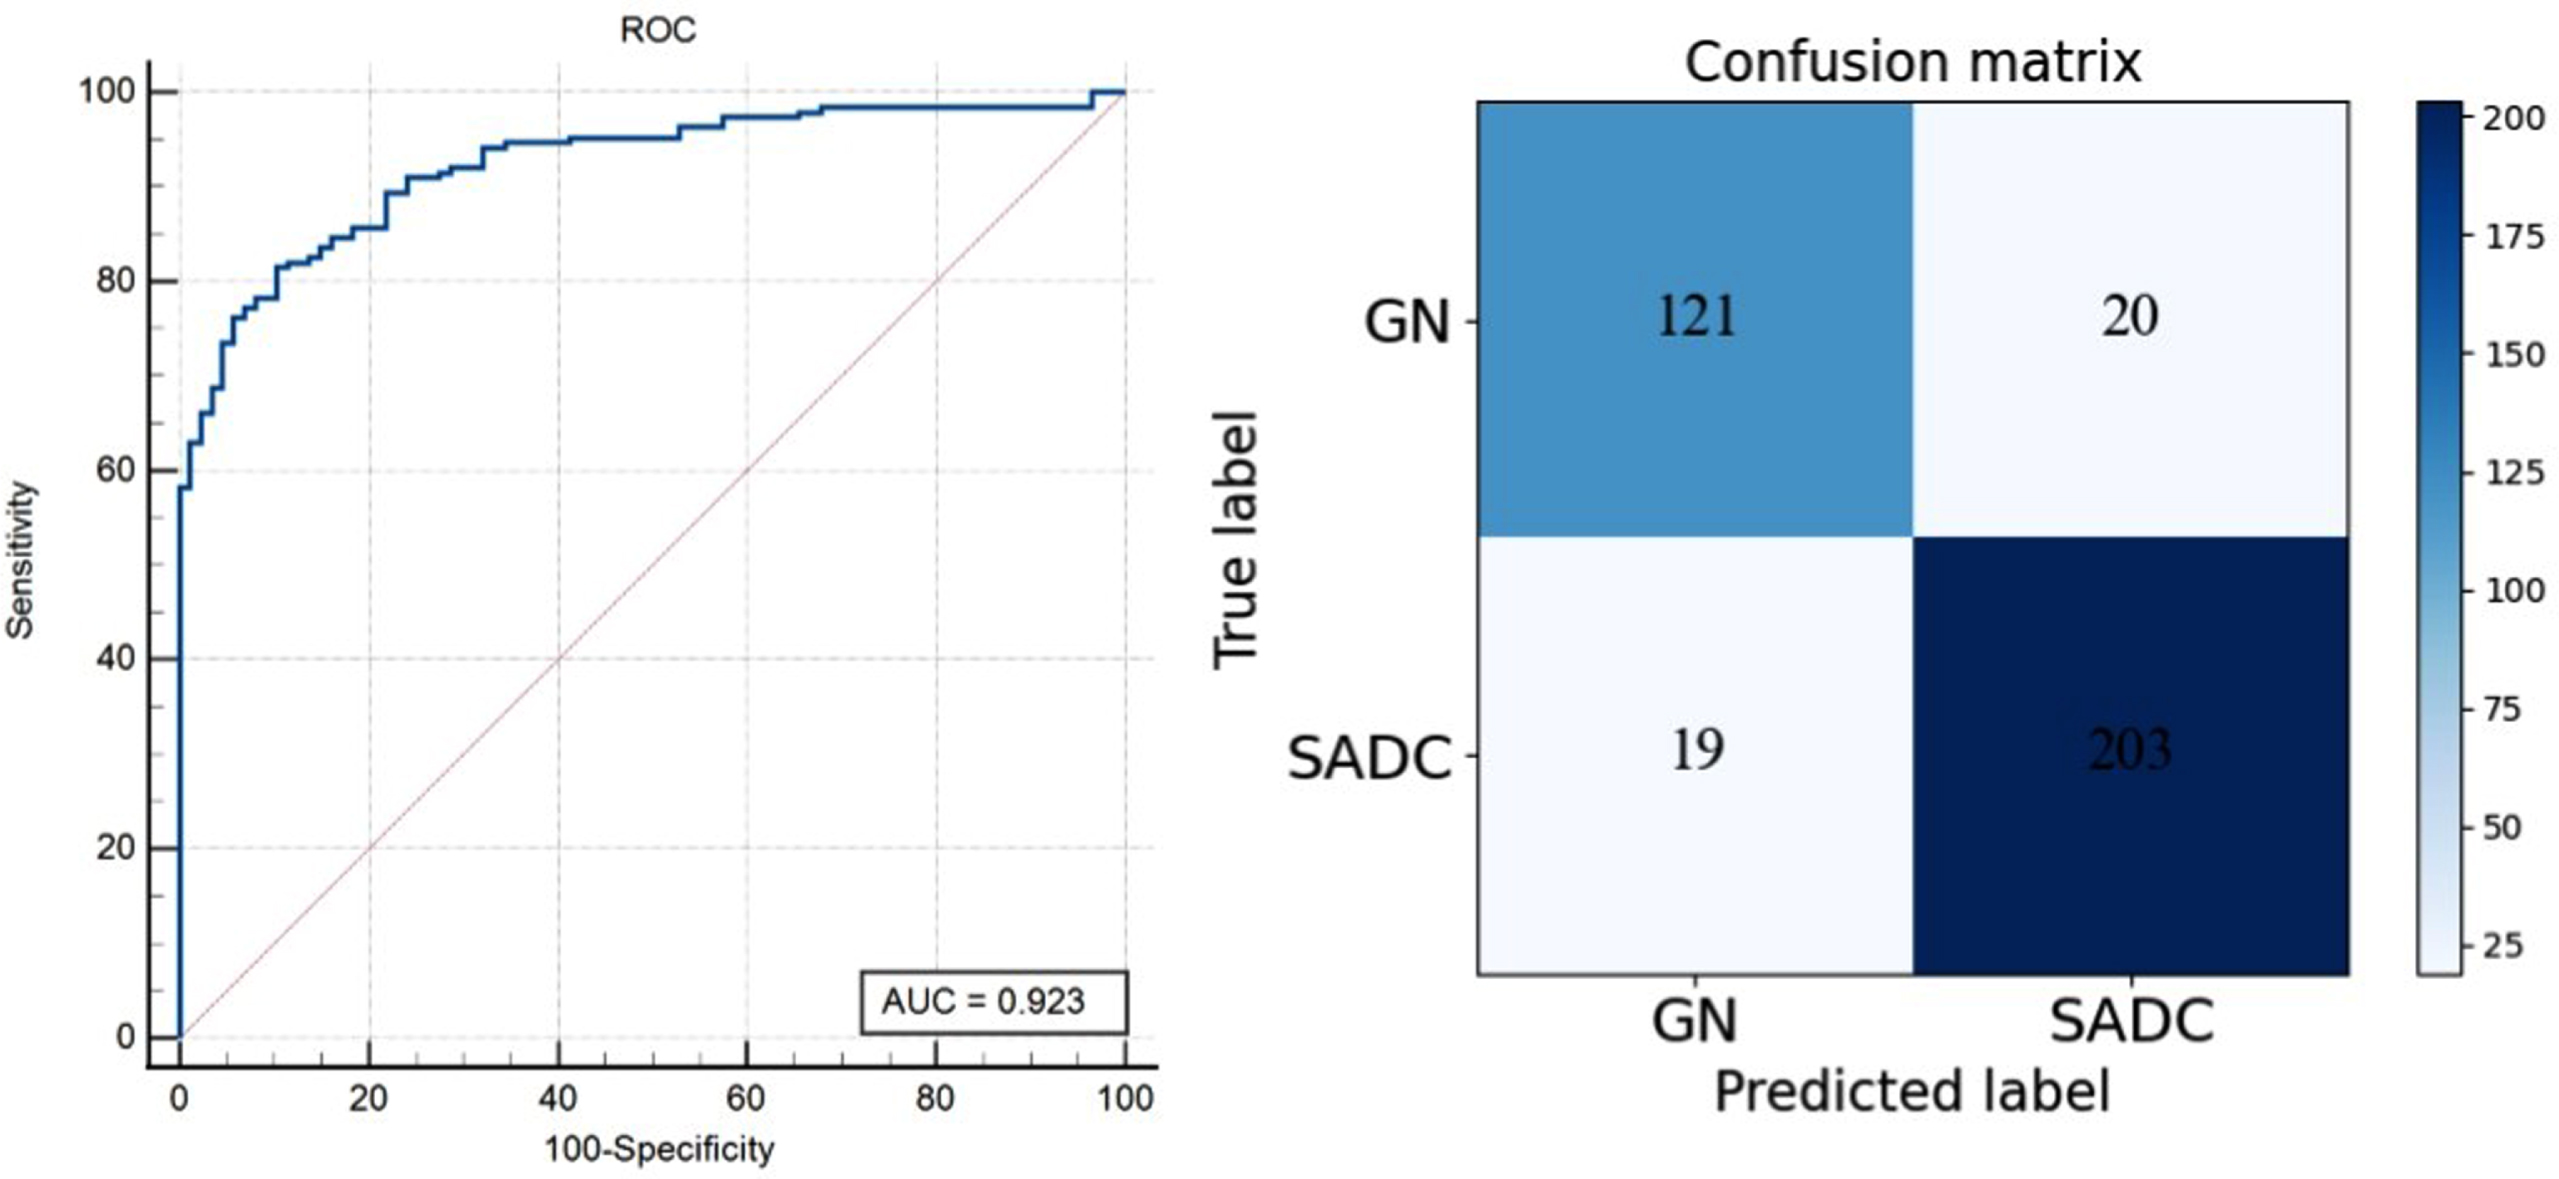
ROC curve and confusion matrix of CLSSL-ResNet at Dataset2 (Patch-level).
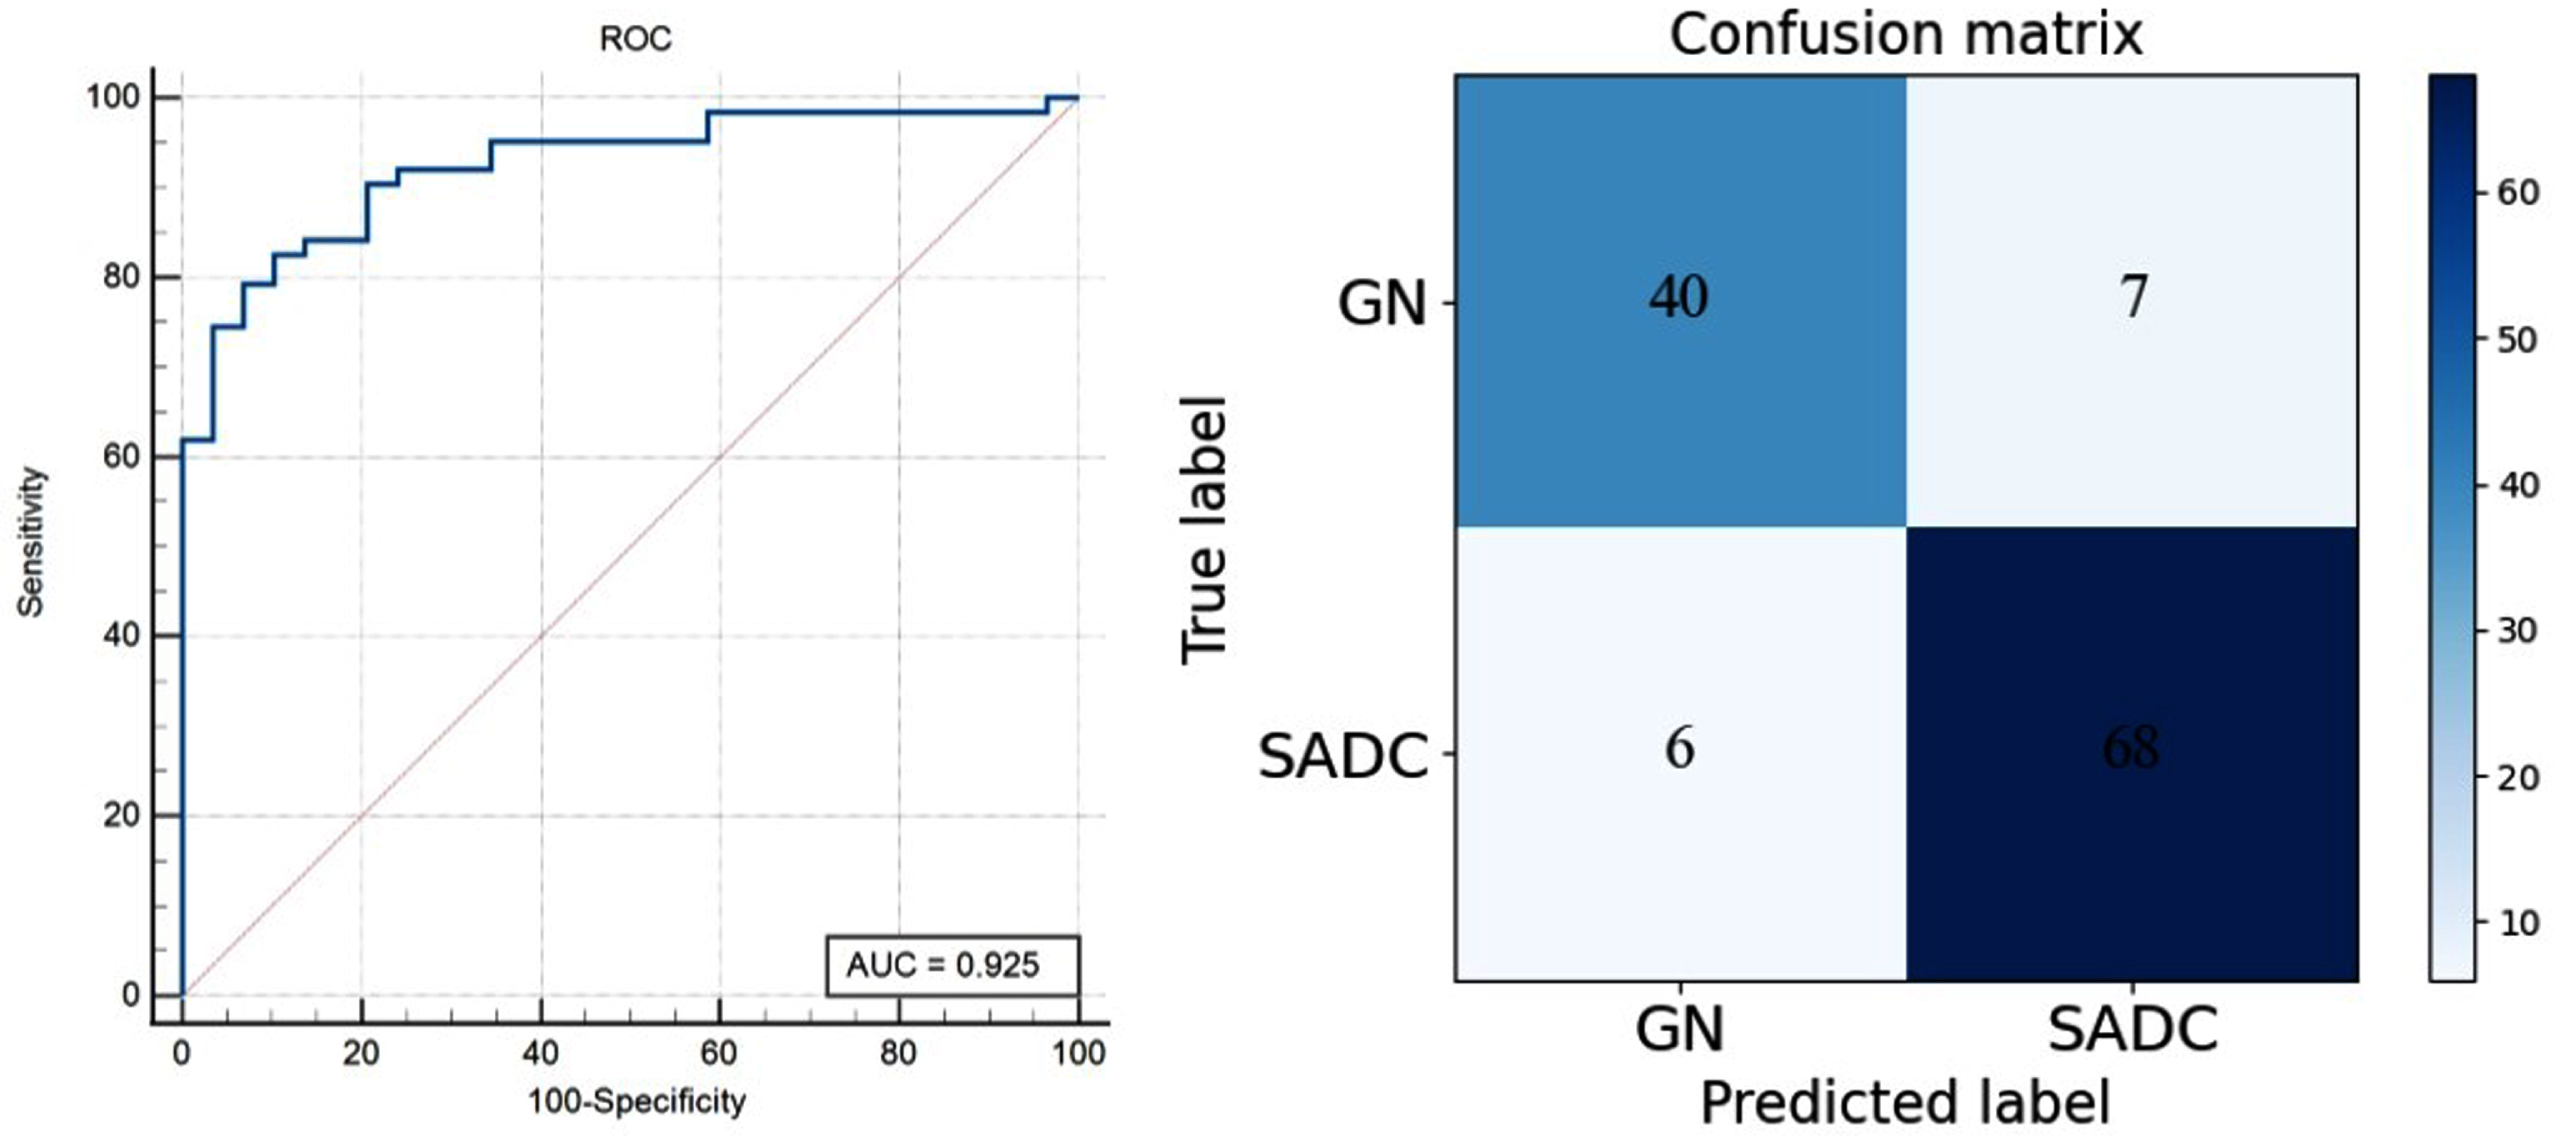
ROC curve and confusion matrix of CLSSL-ResNet at Dataset2 (Patient-level).
In this study, we evaluated the network performance on two datasets: Dataset1, which was used for training, testing, and internal validation, and Dataset2, which served as an external validation set. We observed that the network achieved better performance on the external validation Dataset2 compared to the internal validation Dataset1. The network might have learned domain-specific features during training that align well with Dataset2, leading to superior performance. This also proves that our model has good generalization ability.
A series of ablation experiments have been done to confirm that the CLSSL-ResNet method improves the ability to predict the malignancy of SPN. The chimeric label comprised three types of pseudo labels. Therefore, we had seven types of combinations: (1) only the original label (OL); (2) only the rotation labels (RL); (3) only the morphology label (ML); (4) the chimera of the original and rotary labels (ORL); (5) the chimera of original and morphology labels (OML); (6) the chimera of rotation and morphology labels (RML); (7) the chimera of the original label with rotation and morphological labels (Ours).
In the test data of Dataset1, the performance of CLSSL-ResNet in the above seven types of situations was compared (Table 2). It was observed that when using RL and ML methods, the performance of RL (AUC, 0.769; ACC, 75.8%) and ML (AUC, 0.746; ACC, 73.7%) was inferior to that of OL (AUC, 0.867; ACC, 84.4%). The performances of ORL, OML, and RML were superior to that of RL and ML and similar to OL. The AUC was 0.855, 0.882, and 0.834, respectively. Among all the models, the proposed CLSSL-ResNet obtained the best results and the ACC increased by about 7 to 91.3% as compared to OL. This demonstrated the effectiveness of CLSSL-ResNet.
The performance of CLSSL-ResNet in the ablation experiment
The performance of CLSSL-ResNet in the ablation experiment
In Fig. 11, we visualized two sets of attention maps, which were generated by training a supervised learning model and a CLSSL-ResNet model, respectively. The generation method of these attention maps has previously been described [26]. Briefly, a simple modification of the global average pooling layer was carried out, in combination with the class activation mapping (CAM) technique. The classification-trained convolutional neural network can classify the image and localize class-specific image regions. This method mirrors where the network puts most of its attention to classifying the input image.

Class activation mapping images. (a) Original images; (b) CAM images of the supervised model overlaid with the original images; (c) CAM images of the CLSSL model overlaid with the original images.
It was found that the CAM of CLSSL-ResNet focused on the center and outline of the lesion; however, it paid very little attention to the area around the lesion and the lung parenchyma. By comparing it with the CAM of the supervised model, it could be seen that both models focused on roughly the same lesion region, but the supervised learning model also broadly focused on other regions, which may be the reason for the decrease in its prediction accuracy.
To select the most suitable backbone network, 12 commonly used networks were tested and compared with ResNet50, including: AlexNet [27], VGG16 [28], VGG19 [28], GoogLeNet [29], ResNet18 [30], ResNet34 [30], DenseNet121 [31], DenseNet169 [31], InceptionV3 [32], Xception [33], MobileNetV2 [34], and ShuffleNetV2 [35].
Table 3 shows the results of different backbone networks in the test set. The ACC of ResNet50 was the highest among all backbone networks. It was nearly 2% higher than the 89.8% of the second-highest DenseNet169. In addition, ResNet50 also had the highest AUC and SEN. DenseNet169 had the highest SPE value of 92.06%, but its performance was lower than that of ResNet50 in other aspects. Therefore, we choose ResNet50 as the backbone network of the CLSSL-ResNet model.
Performance of CLSSL-ResNet with different backbone networks
Performance of CLSSL-ResNet with different backbone networks
We used linear classifiers to evaluate the features learned by our method against those learned by other self-supervised learning methods. We used ResNet50 as the backbone network for self-supervised learning training on Dataset1 and then trained a linear classifier by freezing the top of the backbone network. The evaluation results of the linear classifier on the test set are shown in Table 4.
Linear evaluation results of ResNet50 models on Dataset1
Linear evaluation results of ResNet50 models on Dataset1
Experimental results showed that CLSSL outperforms the in-image self-supervised learning methods. Specifically, as compared to Exemplar-CNN [36], Context [17], Rotation [15], JigPuz [16], Counting [37], and SLA [38], the accuracy of CLSSL increased by 16.6%, 14.4%, 15.6%, 10.7%, 12.3% and 7.4%, respectively. In addition, compared with the recently proposed comparative learning methods with superior performance, such as MoCo [18], SimCLR [19], and MoCO v2 [39], CLSSL also had an improvement of 5.3%, 2.1%, and 2.6%, respectively.
Deep learning versus radiomic methods
In clinical practice, the most malignant SPN is SADC, while a considerable number of benign SPNs are GN. In diagnosing SPN, distinguishing SADC from GN by visual inspection of CT images is difficult because both types of lesions have a similar spiculated or lobulated appearance. Therefore, to prevent patients from undergoing invasive diagnostics to obtain a clear identification of SPN, it is of great value to develop an efficient and non-invasive quantitative method.
Previous related studies used a radiomics approach to distinguish GN from SADC [8–13]. Radiomics is a promising tool for identifying malignant lung nodules by extracting quantitative features from CT images, including intensity, shape, texture, and wavelet features. Compared with these published models, our CLSSL-ResNet model shows unprecedented performance. Yeng et al. [8] used radiomics extracted from CT images. The AUC of their training cohort was 0.841, which was lower than that in our work, and no external validation dataset was available. Feng et al. [9] established a radiomics model to differentiate tuberculous granulomas and SADC in patients with SPN with AUC of 0.8869 and 0.8735 in internal and external validation cohorts; both these values are lower than the AUC in our work. Beig et al. [10] achieved an AUC of 0.80 by extracting 2D radiomic features of the largest representative slice and then combining the radiomic features of the intra-nodular and peri-nodular regions; however, the external validation set was not available in their study. Dennie et al. [11] used non-contrast CT-based texture analysis on a dataset that included 31 SADC and 24 GN patients and reported 88% sensitivity and 92% specificity (AUC = 0.90±0.06). However, their study sample was small, and their model was not validated on an independent external dataset. Lin et al. [12] used a 3D U-Net-based deep learning model for lesion segmentation and 3D radiomics feature extraction and achieved an AUC of 0.9069 for the identification of lung cancer and granuloma (915 cases in total). Chen et al. [13] developed a radiomics nomogram for predicting lung adenocarcinoma and granuloma lesions in patients with isolated sub-centimeter solid nodules. Their nomogram was a combination of clinical features, subjective CT findings, and radiomic features of the subjects and yielded an AUC of 0.885 (95% CI: 0.823–0.931) on a dataset of 214 patients.
The AUC of the internal validation set of our CLSSL-ResNet model was 0.944. Furthermore, the externally validated AUC was 0.923, which was higher than that reported by Feng et al. [9] (0.8735). The results showed that the model featured good generalization ability. As compared to traditional radiomics methods, our proposed CLSSL-ResNet with the advanced deep learning method showed more powerful capabilities in medical image analysis.
Self-supervised learning and chimeric labels
According to Y-Ann LeCun, “If intelligence is a cake, the bulk of the cake is self-supervised learning”. This statement reflects the belief that the way that artificial intelligence perceives the world is similar to how human beings perceive it, which entails gradual exploration and learning from large amounts of unmarked information [40]. At present, the most commonly used pretext tasks fall into two categories: in-image and inter-image tasks. The in-image task is to design an image transformation method and then train the network to learn the transformation. For example, there are Rotation [15], Jigsaw Puzzle [16], and Context [17]. The inter-image task requires the network to distinguish between different images. Currently, the most popular contrast learning method is to expand the distance between negative pair representations and narrow the distance between positive pair representations. For example, there are MoCo [18], SimCLR [19], BYOL [20], and SimSiam [21]. However, the self-supervised methods mentioned above train the neural networks by training the original and the pretext tasks independently, while sharing feature representation and maintaining two independent classifiers. In our research, the CLSSL-ResNet model cleverly combined the pretext task with the original task by generating chimeric labels and making full use of the fully supervised classification task, which led it to achieve higher accuracy. However, in our study, the chimeric label consisting of the rotation angle, morphological characteristics, and malignancy of lesions is utilized to pre-train a model as the pretext task. In the chimeric label, the task of predicting the rotation angle and morphological characteristics belongs to self-supervised learning, while the task of predicting the malignancy of lesions belongs to supervised learning. After the pretraining by pretext task, the model is fine-tuned in the downstream or real task of predicting the malignancy of lesions.
With the development of self-supervised learning technology, new self-supervised learning frameworks have blossomed. Although there are many differences between medical and natural images, amazing results have been achieved with in-depth studies on the potential use of self-supervised learning framework in medical image analysis and the increased application of self-supervised learning [23–25, 41]. However, to our knowledge, the CLSSL-ResNet model proposed in this study is the first study to apply self-supervised learning to GN and SADC classification tasks.
Limitations and further work
There are some limitations to this study and its outcomes. First, the study design was retrospective; the sample size was relatively small and there was only one independent external validation center. Second, only the SPN with surgically resected and histologically confirmed GN or SADC lesions were included. Therefore, our nodule samples may be biased towards more morphologically distinct or aggressive malignant nodules. Regardless, this inclusion criterion guaranteed a pathologically homogeneous sample of nodules.
In future work, we should recruit more patients from multiple sites to better train and validate the CLSSL-ResNet model. We will further optimize the CLSSL-ResNet method according to the characteristics of pathological images and introduce the concept of contrastive learning to combine with our learning framework.
Conclusions
CLSSL-ResNet which included morphology labels can enhance the ability of feature representation in deep networks. By introducing chimeric labels, this method enables the network to learn and fuse the pathological features seen in CT images, local features of lesions, and overall features of lesions, which greatly improves the feature extraction ability of convolutional neural networks, which can then be beneficial for credible medical image classification. CLSSL-ResNet developed here was tested on two datasets for the differentiation between GN and SADC. It presented higher accuracy than radiologists and an accuracy of 91.9% in the test set of Dataset1. As a non-invasive method, CLSSL-ResNet can distinguish GN from SADC via CT images and may support clinical diagnoses after further validation.
Footnotes
Acknowledgments
This work was partly supported by the National Natural Science Foundation of China under Grant (Nos. 82072008, 82272080, 62271131), Liaoning Natural Science Foundation (2020-BS-049, 2021-YGJC-21), and the Fundamental Research Funds for the Central Universities (N2119010, N2224001-10).
Conflict of interest
The authors declare that they have no conflict of interest.
Ethical approval
All procedures performed in studies involving human participants were in accordance with the ethical standards of the institutional and/or national research committee and with the 1964 Helsinki Declaration and its later amendments or comparable ethical standards.
Informed consent
Informed consent was waived for it is a prospective study.