
Abstract
BACKGROUND:
Imaging examinations are crucial for diagnosing acute ischemic stroke, and knowledge of a patient’s body weight is necessary for safe examination. To perform examinations safely and rapidly, estimating body weight using head computed tomography (CT) scout images can be useful.
OBJECTIVE:
This study aims to develop a new method for estimating body weight using head CT scout images for contrast-enhanced CT examinations in patients with acute ischemic stroke.
METHODS:
This study investigates three weight estimation techniques. The first utilizes total pixel values from head CT scout images. The second one employs the Xception model, which was trained using 216 images with leave-one-out cross-validation. The third one is an average of the first two estimates. Our primary focus is the weight estimated from this third new method.
RESULTS:
The third new method, an average of the first two weight estimation methods, demonstrates moderate accuracy with a 95% confidence interval of ±14.7 kg. The first method, using only total pixel values, has a wider interval of ±20.6 kg, while the second method, a deep learning approach, results in a 95% interval of ±16.3 kg.
CONCLUSIONS:
The presented new method is a potentially valuable support tool for medical staff, such as doctors and nurses, in estimating weight during emergency examinations for patients with acute conditions such as stroke when obtaining accurate weight measurements is not easily feasible.
Introduction
Imaging examinations are crucial in the diagnosis of acute ischemic stroke [1–3], as they are used to diagnose occluded vessels, infarcted areas, and the presence of cerebral hemorrhage. Contrast-enhanced computed tomography (CT) and magnetic resonance angiography (MRA) are used to diagnose occluded vessels. CT examinations have the advantages of a broad range of applicability and short examination time but the disadvantage of requiring contrast agents to diagnose occluded vessels. On the other hand, MRA has the advantage of being a non-contrast examination but the disadvantage of being an MRI examination, meaning that some patients with metal in their bodies or those who cannot undergo long examinations cannot be examined. Therefore, to diagnose acute ischemic stroke, some facilities use contrast-enhanced CT examinations, which can be performed rapidly. In contrast-enhanced CT examinations, the amount of contrast agent used is determined based on the patient’s weight, and in MRI examinations, the specific absorption rate is calculated using the patient’s weight.
In imaging examinations for acute ischemic stroke, speed is crucial [1–3]. In acute ischemic stroke, because the area of brain function loss expands over time, rapid treatment is required to preserve brain function. Treatment methods vary depending on the time from stroke onset. For example, intravenous thrombolysis (rt-PA) therapy [4] and thrombectomy therapy [5, 6] are used for endovascular treatment, and rapid treatment is required for their implementation. Thus, prompt diagnosis through rapid imaging examination is crucial to perform these treatments rapidly.
Rapid and simple weight measurements are necessary for quickly conducting contrast-enhanced CT scans [7, 8]. However, when a patient’s condition is critical, sufficiently rapid weight measurement can be difficult [8]. In emergency medicine, medical staff such as doctors and nurses may estimate a patient’s weight when the patient is unconscious. Nevertheless, weight estimations by medical staff can differ by up to 20% [9]. Studies have reported various methods for estimating patient weight, including the use of specific body part lengths [10], digital image-processing techniques [11], and CT-based approaches [12–14]. Each method has challenges in terms of accuracy and simplicity, especially when dealing with unconscious patients [10, 11]. CT-based techniques have been reported that use CT dose-modulation data during imaging [12], methods using specific anatomical site CT images [13], and deep learning using CT images of the trunk for positioning [14]. However, because imaging of the trunk is essential, these methods cannot be used for CT examinations that target patients with acute stroke. Existing methods of weight estimation require additional tests and procedures. Scout images are invariably taken at the outset of any CT examination, regardless of whether it is contrast-enhanced. Therefore, if weight can be estimated from these images, it would serve as a rapid weight estimation method that can be used with acute ischemic stroke patients.
Developing a method to estimate weight using head CT scout images can help facilitate quick examinations and reduce the load on both medical staff and patients. The CT examination process includes acquiring scout images, taking plain images, administering contrast agents, and capturing contrast-enhanced images. Rapid weight estimation is necessary after obtaining scout images, as estimation of weight and preparation of the contrast agent are required before administering the contrast agent. A straightforward measurement technique for weight estimation without added complexity would alleviate the burden of medical staff. In addition, because scout images are essential for CT examinations, no extra tests for weight measurement are needed, which further reduces the burden placed on patients and medical staff. In this study, we aim to develop a method for estimating weight using head CT scout images to expedite head contrast-enhanced CT examinations and help reduce the load on both medical staff and patients.
Methods
We collected head CT scout images and weight data sets from the radiology department system. All data were obtained from clinically necessary examinations. The ethics committee of Niigata University approved the use of data from the hospital information system, and an opt-out opportunity was provided. Figure 1 shows our flowchart. We examined three methods for estimating weight using the collected data: a method using the sum of pixel values in the CT scout images, a deep learning– based method, and a combination of both. For the pixel value summation method, we derived a regression equation between the sum of the pixel values and weight and evaluated the estimation accuracy using the absolute error between the estimated and actual weight. For the deep learning– based estimation method, we fine-tuned the Xception model [15] using the data set and evaluated the model using leave-one-out cross-validation. In addition, we calculated the average of the weights estimated by each method and assessed the accuracy using the absolute error between the estimated and actual weight.
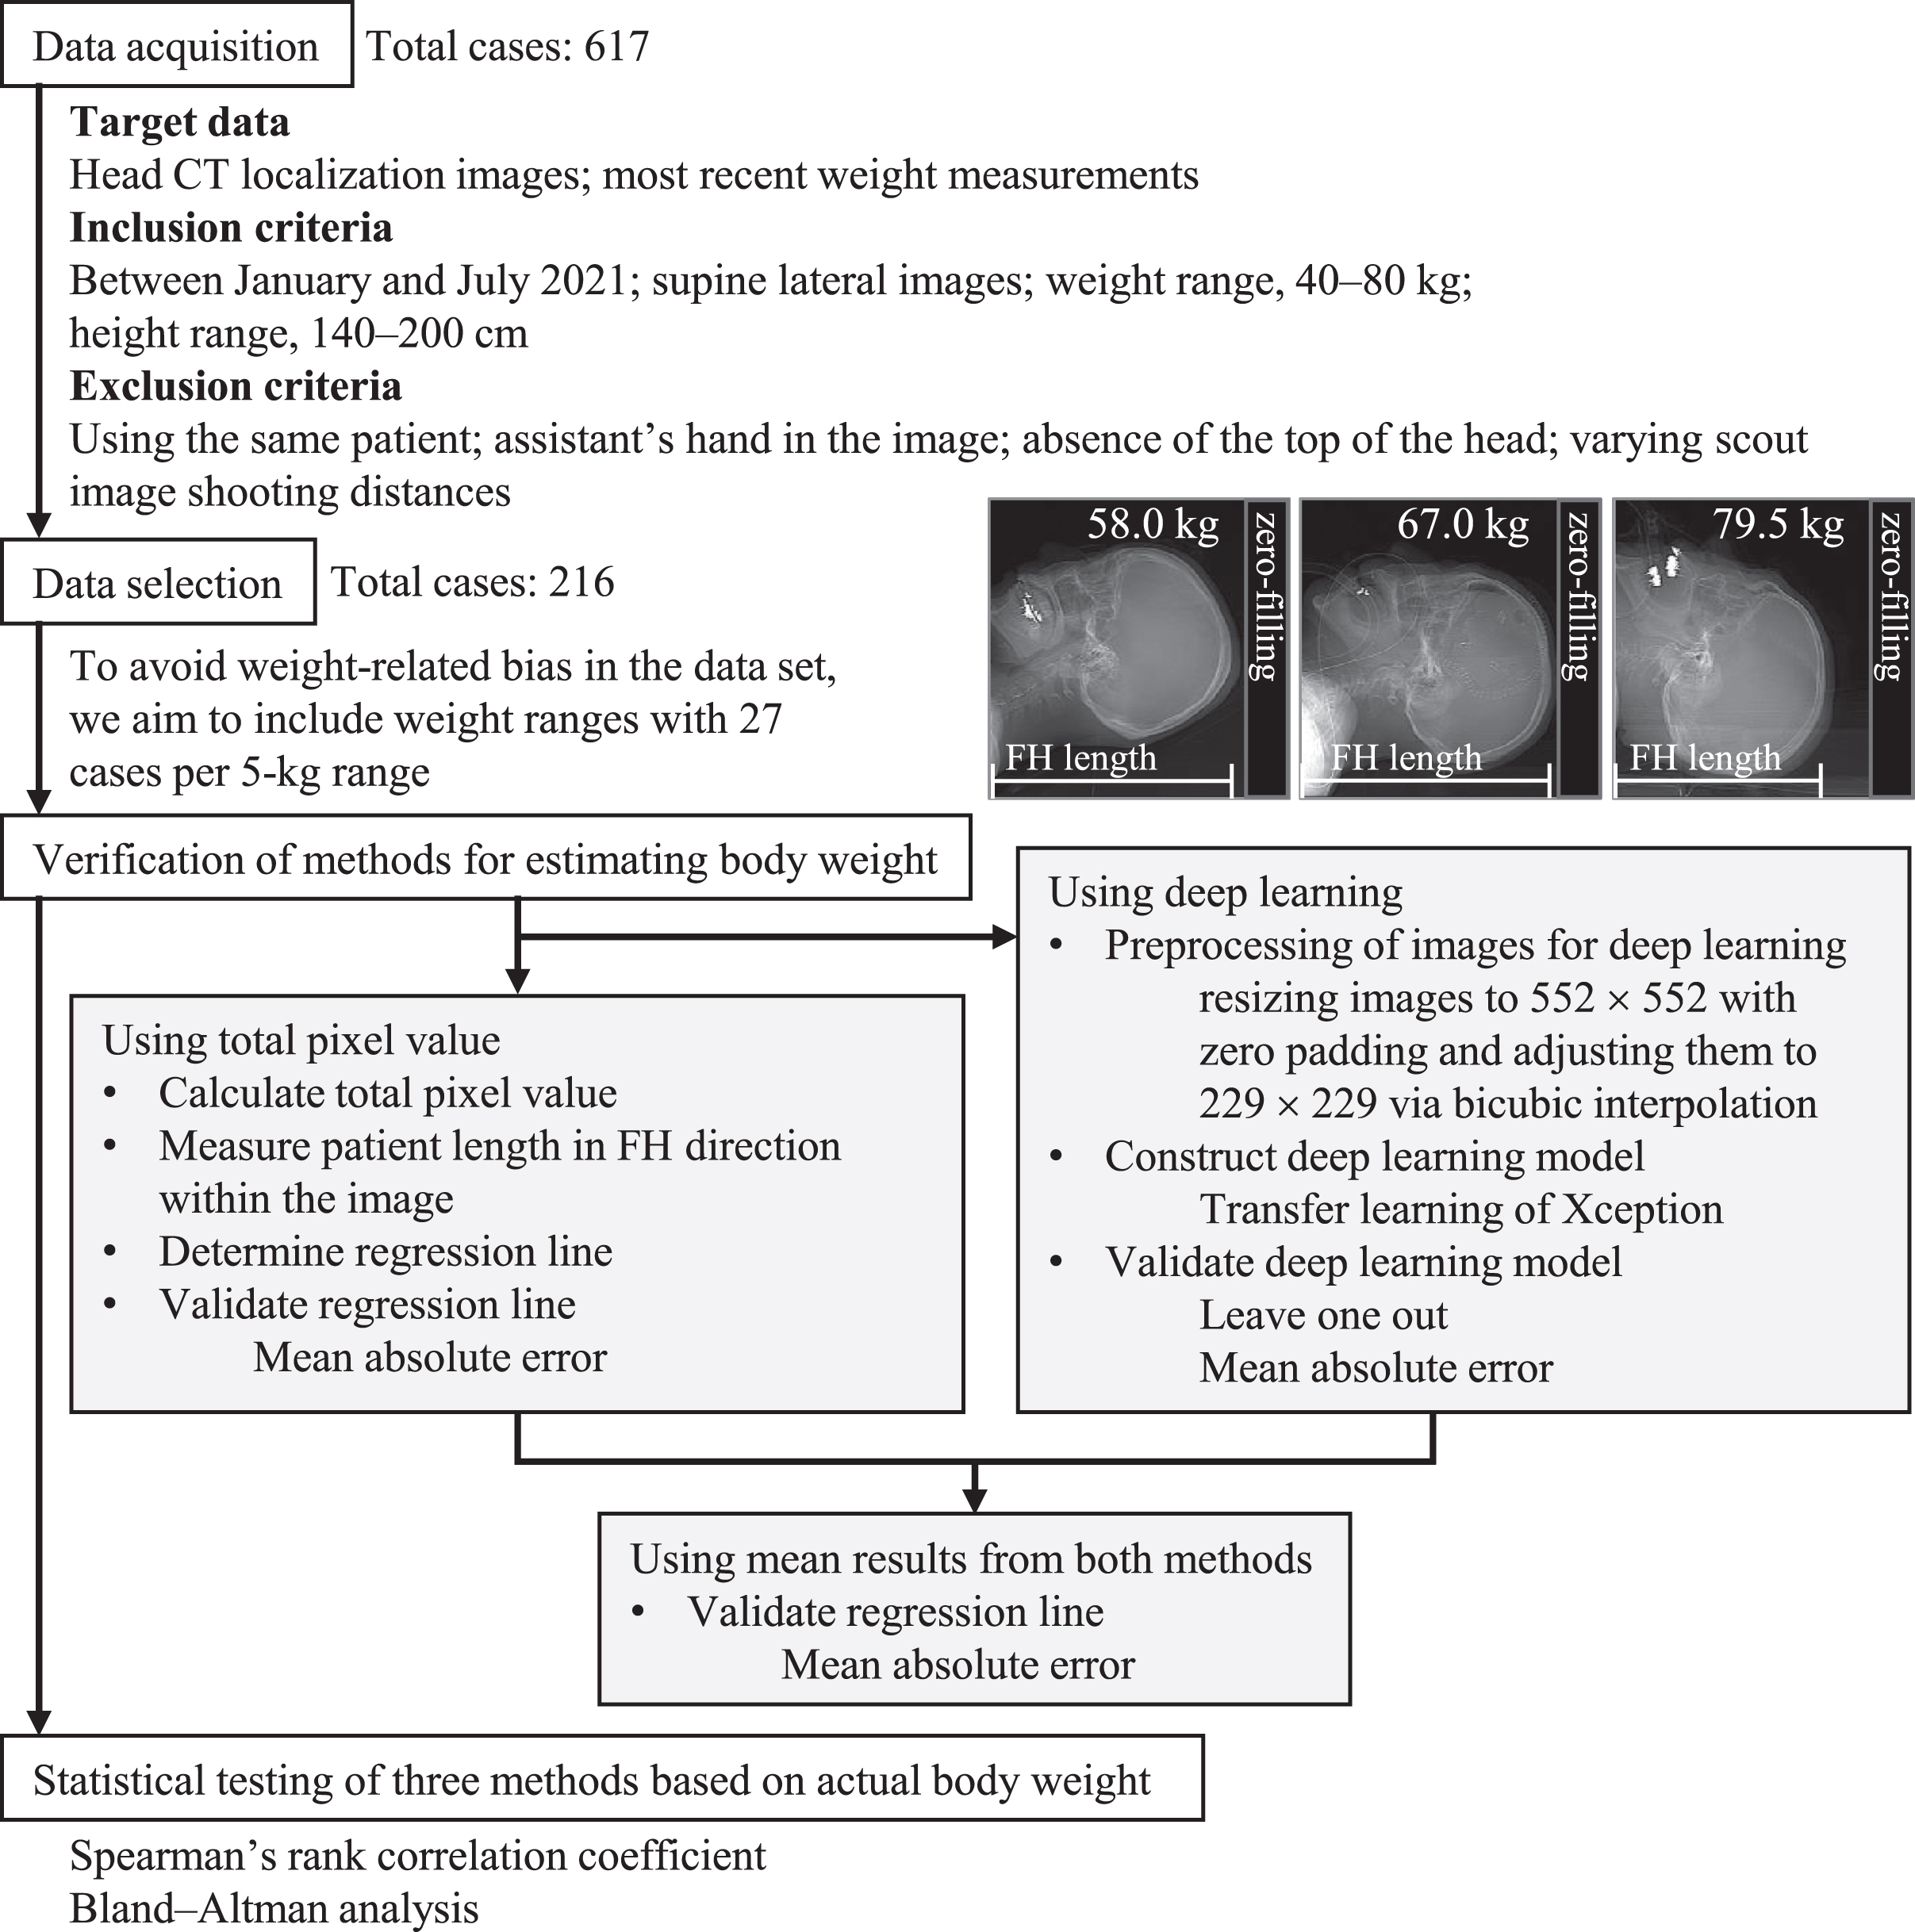
Flowchart illustrating the process of data acquisition, selection, and weight estimation method validation for predicting patient weight using head CT localization images.
We acquired head CT scout images and the most recent weight of the patients from the radiology department information system. The target head CT scout images were acquired not only for acute ischemic stroke examinations but also for various other conditions. Images were acquired at Niigata University Medical and Dental Hospital using an Aquilion ONE device. The criteria for inclusion were examinations conducted between January and July 2021, supine lateral images, a weight range of 40–80 kg, and a height range of 140–200 cm. Exclusion criteria included using the same patient, an assistant’s hand in the image, the absence of the top of the head, and varying scout image shooting distances. Based on these conditions, we collected a data set of 617 cases. We randomly selected cases to ensure an unbiased data set regarding weight. We chose 27 cases per 5-kg weight range, resulting in a total of 216 cases. The data set included 131 male and 85 female patients. The median (interquartile range) weight and height values were 59.9 (69.9–50.0) kg and 162.5 (168.2–155.0) cm, respectively.
Estimation method using total pixel values of head CT scout images
We calculated the total pixel values of the head CT scout images by summing all pixel values and adding a correction. We then derived a regression equation between the corrected total pixel values and the patient’s weight. Using this regression equation, we estimated the patient’s weight from the head CT scout images and compared the estimated weight with the actual weight.
Because the pixel values of CT scout images depend on the detected X-ray dose, they can serve as an indicator of the mass of the material within the image. When the X-ray exposure conditions are the same, the detected X-ray dose depends on the amount of X-ray radiation blocked by the material. The amount blocked is proportional to the density and thickness of the material; thus, high-density material such as bone has high signals, moderately dense soft tissue such as fat has moderate signals, and low-density material such as air has low signals. Therefore, we can assume that the sum of all pixel values in CT scout images serves as an indicator of the mass of the material contained within the image.
Because the total pixel values of head CT scout images are affected by factors such as the imaging range, correction is required before they can be used as an indicator for weight estimation. Factors that influence the total pixel values of head CT scout images include the patient’s length in the FH (feet– head) direction, immobilization devices, the CT scanner bed, and metallic patient devices. The patient’s length in the FH direction within the CT scout image depends on the imaging range and the starting position of the image acquisition. Although the imaging range is constant, the starting position is visually determined during the examination and varies for each patient. The starting position of the head CT scan can influence the range of the image that includes only air at the top of the head, which subsequently affects the patient’s FH direction length in the scout images. Such variations in the patient’s FH direction length can affect the total pixel values in the image. To minimize this impact, we measured the patient’s range in the FH direction and divided the total pixel values by the measured length. However, it should be noted that we made no corrections for the effect of immobilization devices, CT scanner beds, or metallic patient devices that may influence the total pixel values in the image during the imaging process. Therefore, the total pixel value includes background pixels.
We established a linear equation for the computation of estimated weight based on the corrected total pixel values. The actual measured weight of the patient was the independent variable (x), and the corrected total pixel value was the dependent variable (y), from which a linear equation was created. The slope (a) and intercept (b) for the linear equation were computed using the following formulae:
Here,
We performed a fine-tuning approach and leave-one-out cross-validation using a pre-trained Xception model. Xception is a sophisticated deep-learning model renowned for its ability to extract features from images. It has been widely utilized in various fields, including medical imaging. The model uses depth-wise separable convolutions to deconstruct a standard convolution into two distinct operations: spatial convolution and pointwise convolution. Spatial convolutions are performed independently for each input channel, followed by pointwise convolutions using a 1×1 kernel. The Xception model consists of 14 residual blocks, each containing three regular convolution layers and 33 separable depth-wise convolutions. The three regular convolution layers are components of the model’s preprocessing module. The deep learning environment consisted of the following: Intel Core i9-9920X CPU, NVIDIA TITAN RTX GPU, and MATLAB2022b software from The MathWorks Inc. To adapt the pre-trained Xception model for regression tasks, we replaced the final fully connected layer, softmax layer, and classification output layer with a new fully connected layer and a regression layer. Preprocessing was performed on the images in the data set to make them compatible with Xception’s input requirements, including zero padding to resize the images to 552×552 pixels and bicubic interpolation to adjust them to 229×229 pixels. Transfer learning was conducted on the pre-trained Xception model using the preprocessed image data set and weight data set under the following conditions: optimizer, adam; mini-batch size, 8; initial learn rate, 10-4; max epochs, 60; and validation data, none. In addition, to evaluate the model using leave-one-out cross-validation [16], we performed training and testing iteratively, ensuring that all data points were used as test data. To visually assess the learning status of the Xception model, gradient class activation maps (Grad-CAM) were also generated [17].
Mean estimation of weight using both total pixel values from head CT scout images and deep learning methods
Then, in this study, we also tested a fusion method that computes the mean value of two body weight estimation techniques, which employs the total pixel values computed from the head CT scout images and those estimated by using a deep learning method as described in above two subsections.
Statistical testing and evaluation of each estimation method
To assess the correlation between actual weight and the estimated values from each method, we used Spearman’s rank correlation coefficient. Because the patient’s weight distribution was nonnormal, we used a nonparametric approach. In addition, to verify the agreement between the actual weight and the estimated values from each method, Bland– Altman analysis was conducted. Statistical analyses were performed using SPSS. Furthermore, to evaluate each method, we calculated the absolute errors between the estimated weight and the actual weight for each technique.
Results
In this study, we explored three different weight estimation methods: one based on the total pixel values obtained from CT scout images of the head, one that employed deep learning with the same CT scout images, and a third using the arithmetic mean of the estimations from the first two methods. Scatterplots comparing the estimated weights to the actual weights for each method are presented in Fig. 2. Our primary focus was the weight estimation derived from the arithmetic mean of the first two methods. In line with this, the scatterplots in Fig. 2 are arranged in the following order: estimated weight using the arithmetic mean, estimated weight using the total pixel values, and estimated weight using deep learning. The regression equation for weight estimation using the total pixel values from head CT scout images revealed a slope of 4.80×10⁻³ and an intercept of – 45.3.
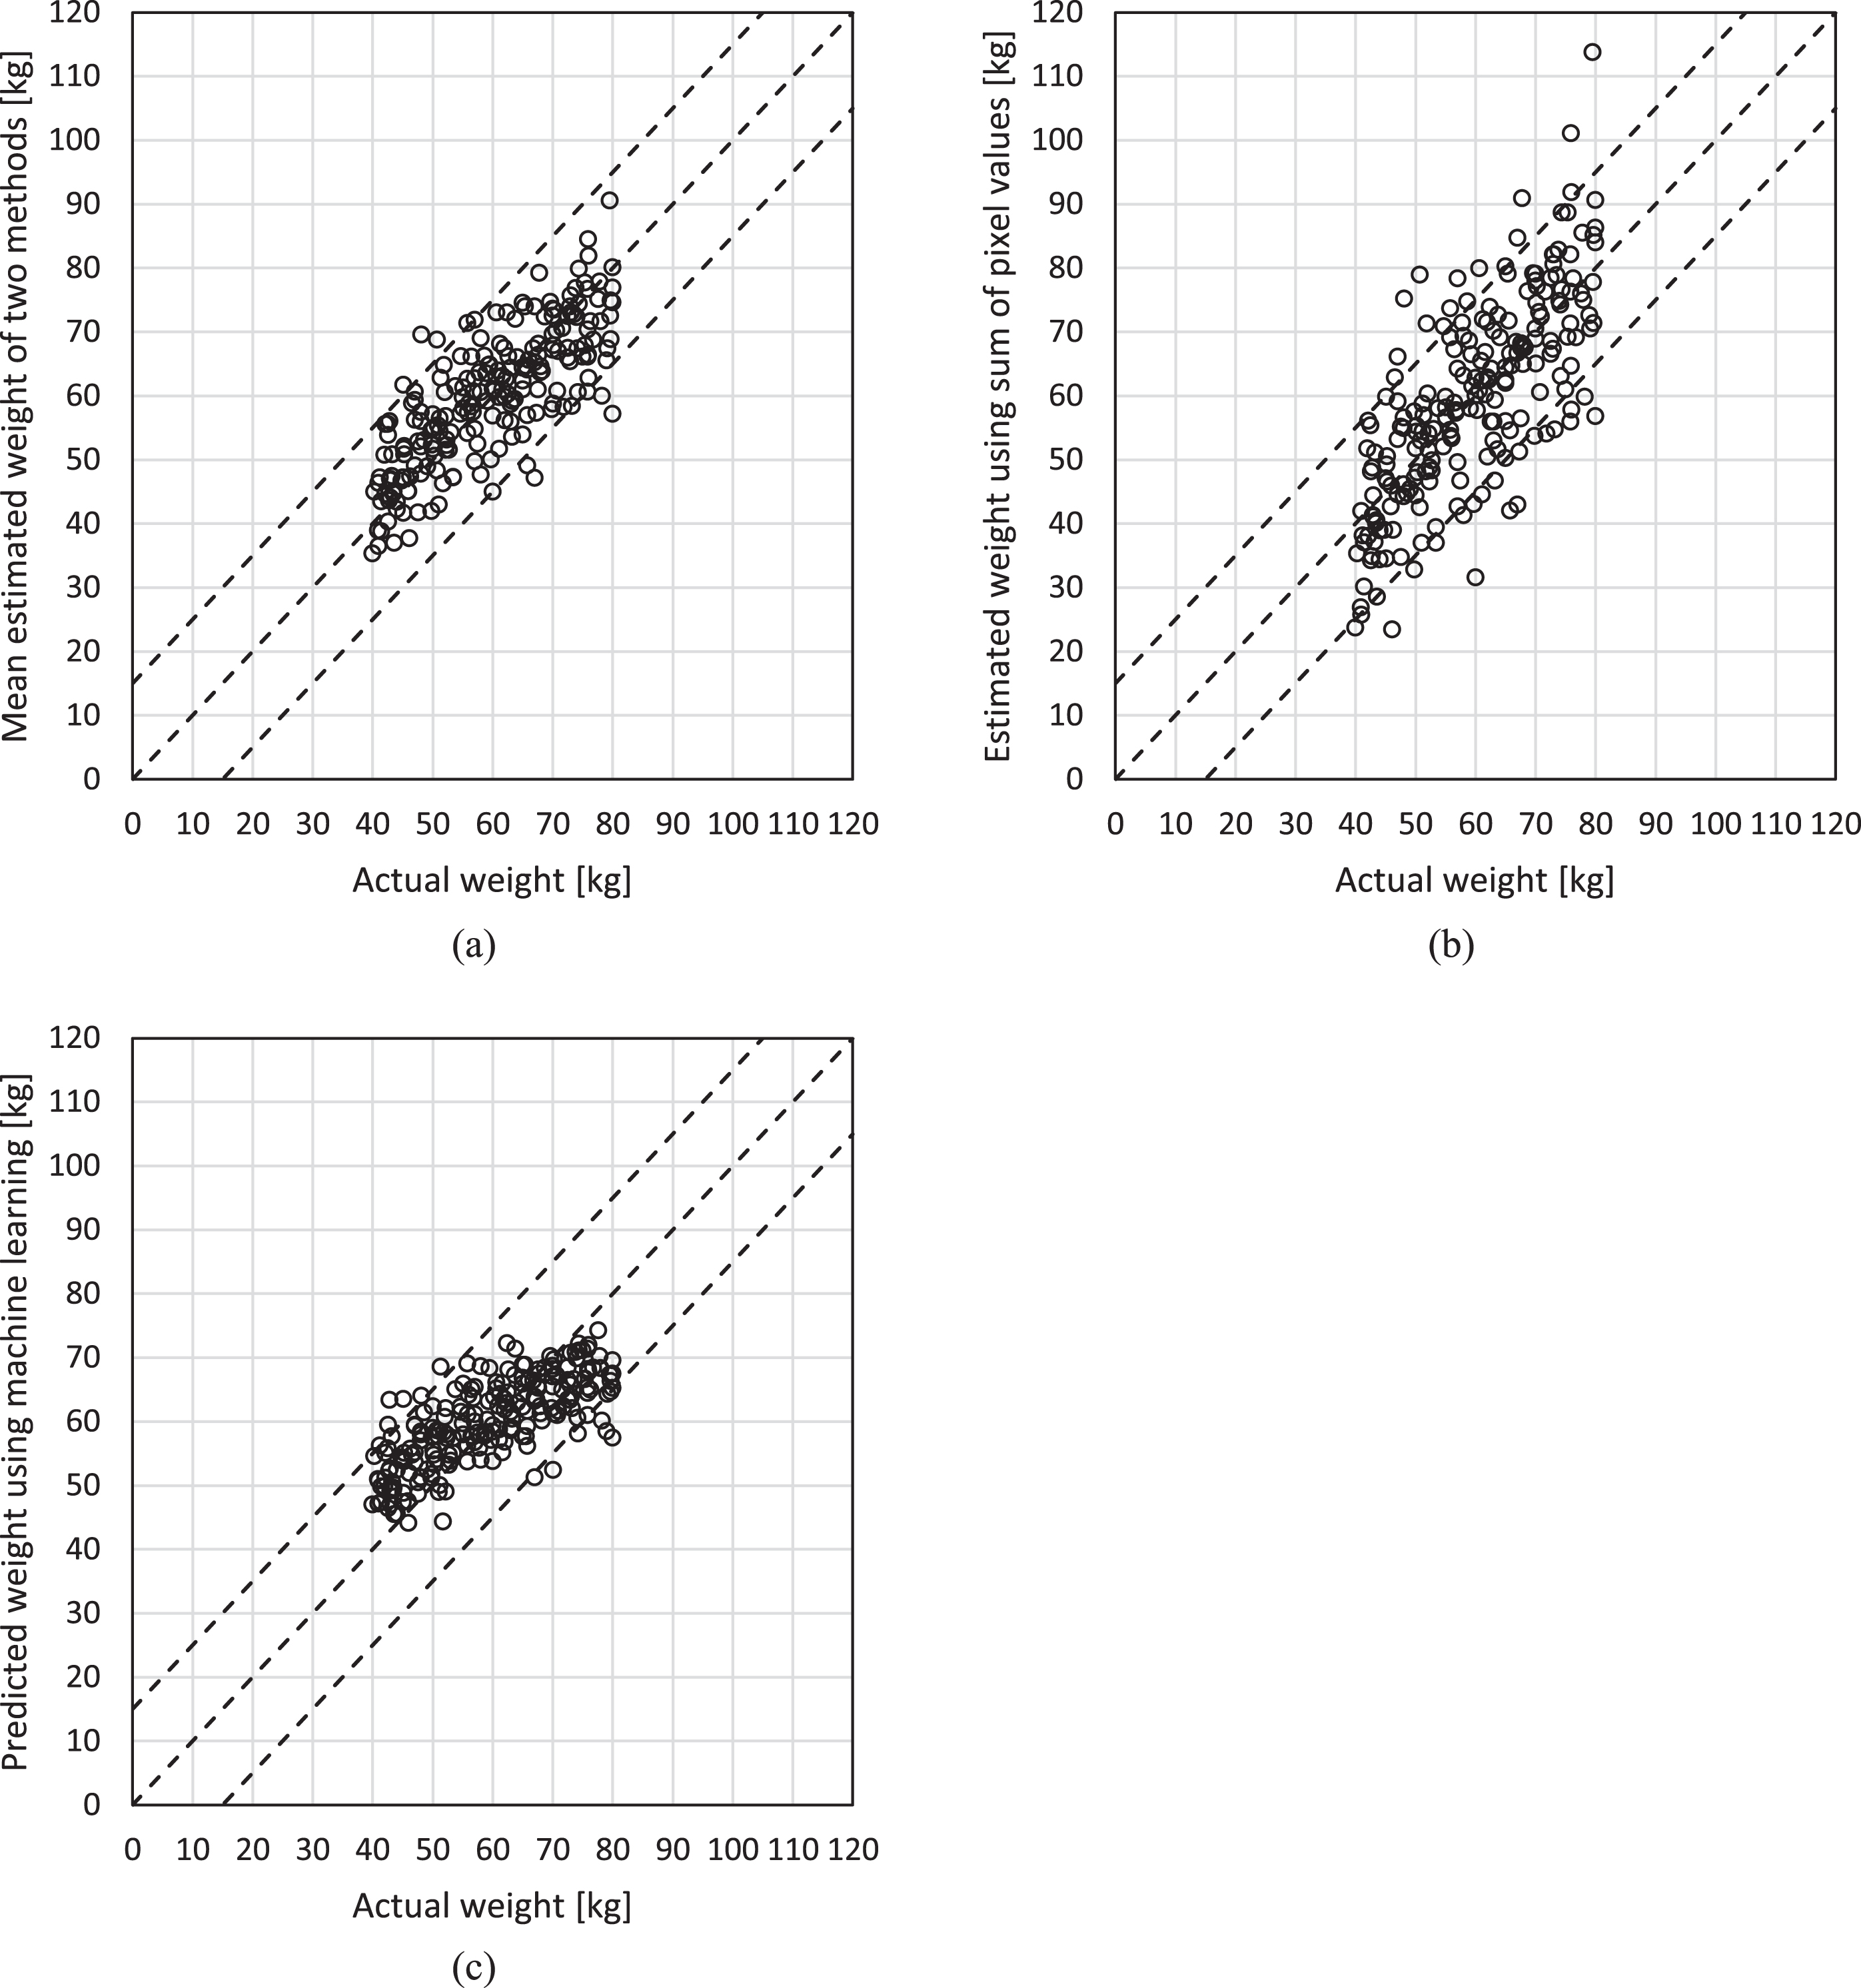
Scatterplot of actual weight and estimated weight: (a) mean results from both methods, (b) method using the sum of pixel values, and (c) method using deep learning. In each scatterplot, the white circles represent individual data points for a total of 216 images. The dashed line in the center indicates the ideal weight, and the upper and lower dashed lines represent the ideal weight ±15 kg, respectively.
Analyses with Spearman’s rank correlation coefficient found strong correlations between the estimated and actual weights for all estimation methods. Specifically, the average of the first two methods yielded a coefficient of ρ= 0.78 (p < 0.001), the method using total pixel values produced a coefficient of ρ= 0.74 (p < 0.001), and the method using deep learning also resulted in a coefficient of ρ= 0.74 (p < 0.001). The Bland-Altman plots in Fig. 3 illustrate the agreement between each estimation method and actual weight. A summary is provided in Table 1.
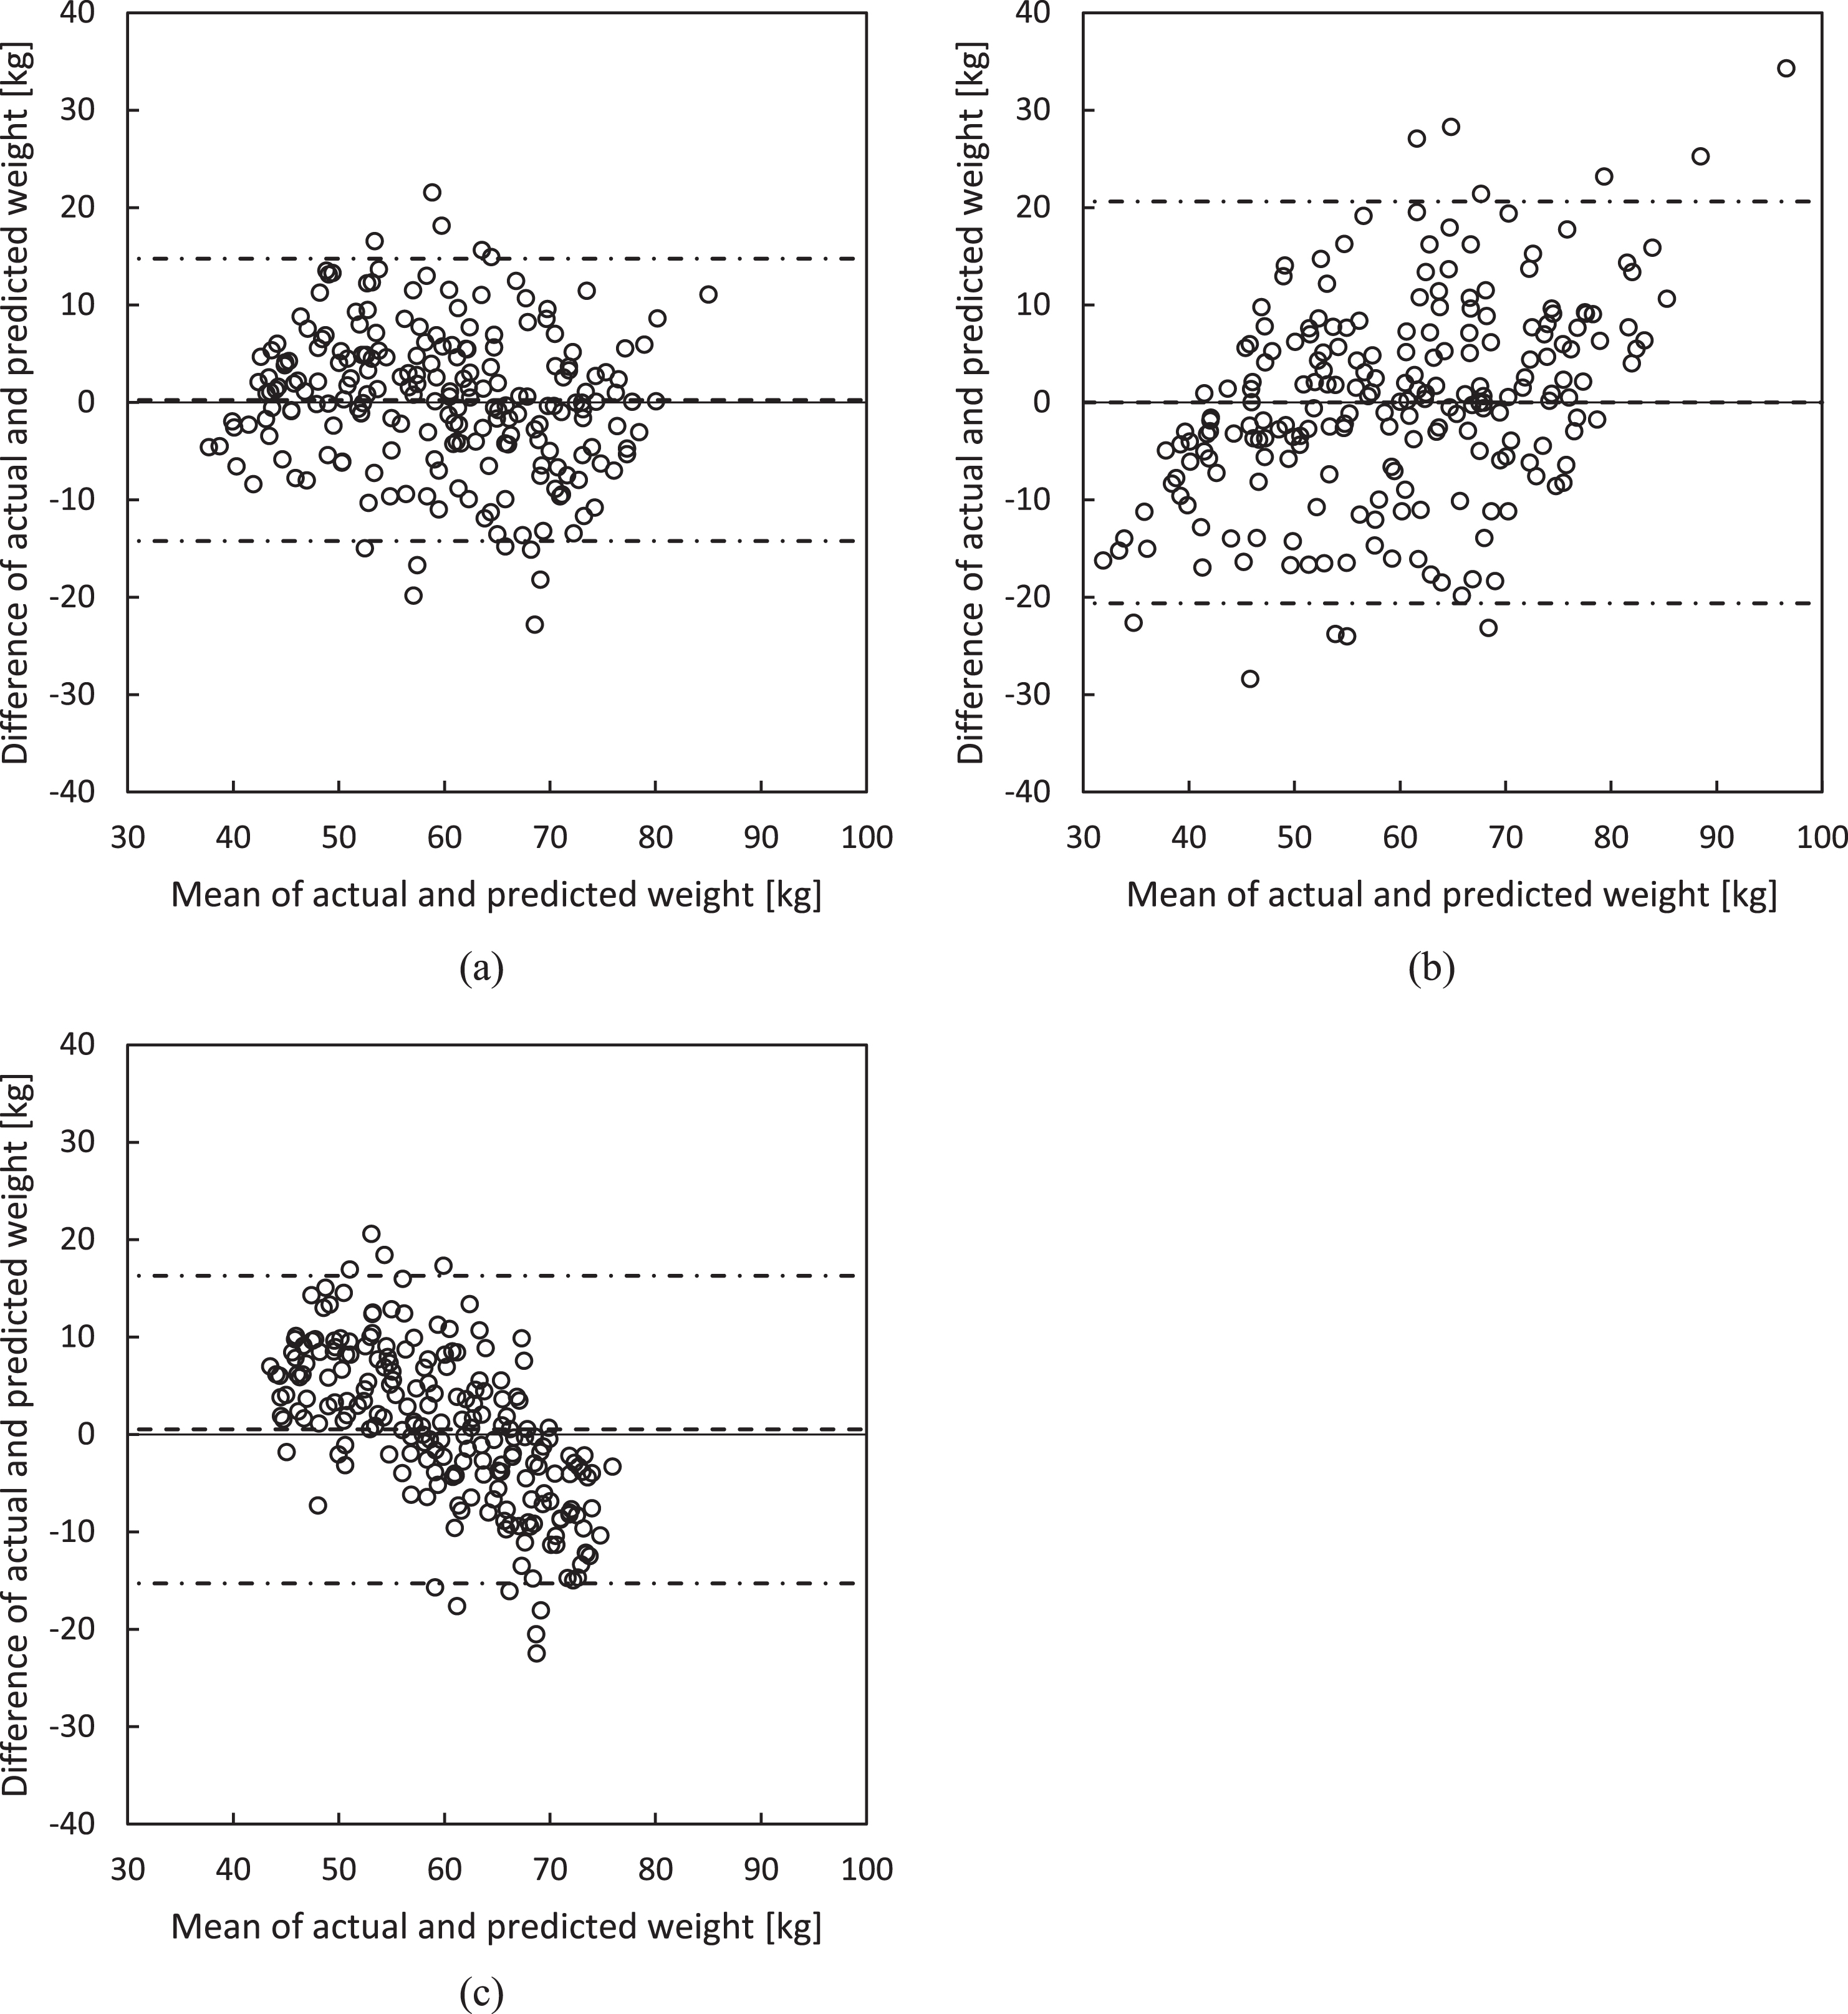
Bland– Altman plots comparing actual weight measurements to estimated values obtained from (a) mean results from both methods (average difference: 0.25 kg; 95% CI: ±14.7 kg), (b) sum of pixel values (average difference: 0.00 kg; 95% CI: ±20.6 kg), and (c) deep learning (average difference: 0.50 kg; 95% CI: ±16.3 kg). Differences are calculated as estimated values minus actual values, with the solid lines representing mean differences and the dashed lines indicating 95% confidence intervals.
Summary of Bland– Altman statistical analysis based on actual body weight for evaluating significant differences and proportional biases among body weight estimation methods
Figure 4 presents heat maps of the regions of interest using the deep-learning model. Table 2 shows the actual and estimated weights obtained using each method. These correspond to the image data in Fig. 4.
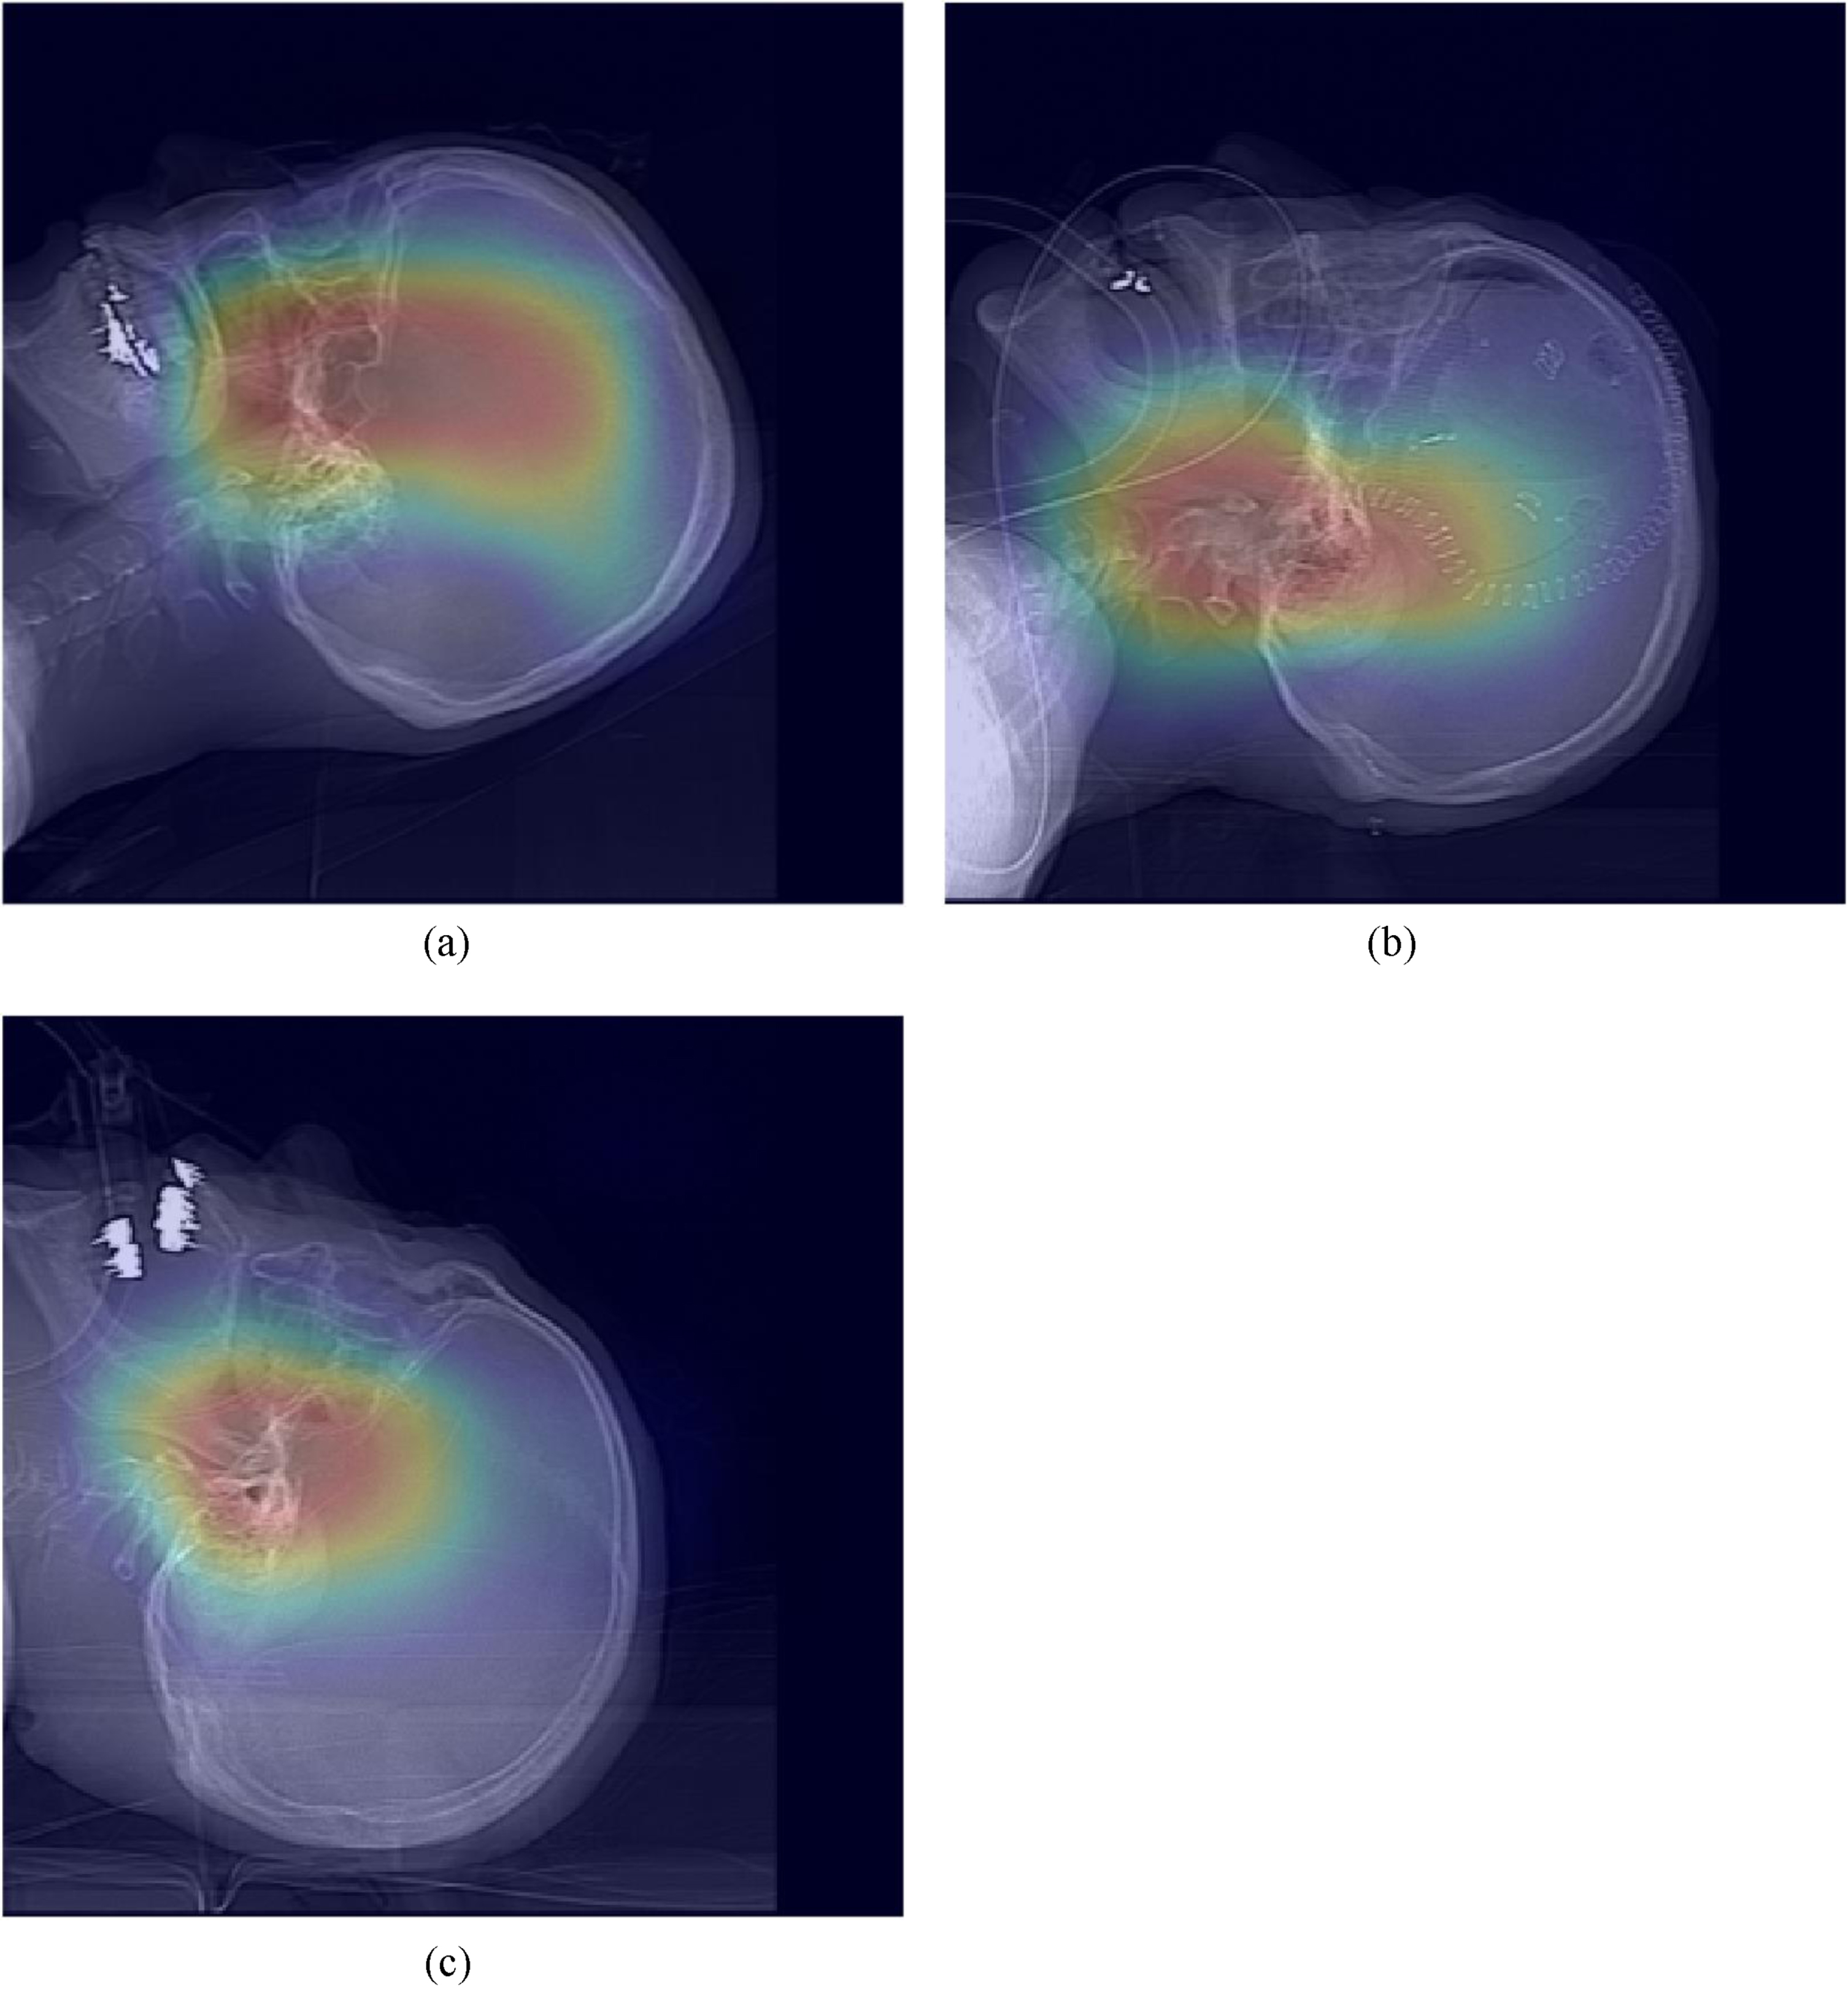
Exemplary heat maps. In most heat maps, the primary regions of interest include the central areas of the human body, such as the upper pharynx and the sella turcica. No specific focus was observed in areas with significant individual variations, such as shoulders, teeth, or medical equipment.
Exemplary estimation results: The alphabets for the sets correspond with those in Fig. 4. A represents a standard case, B includes the patient’s shoulder in the image, and C features an examination table within the image. While the sum of pixel values method estimates higher weights for cases B and C, the deep learning approach estimates lower weights
Table 3 provides comprehensive data on the absolute errors between each method and the actual weight. These errors are presented with ±5, 10, and 20 kg as the benchmarks. The number of datasets that fell within and outside these benchmarks is also indicated.
Comparison between actual weight measurements and the average estimated weight measurements using the sum of pixel values, deep learning. The table displays the number and proportion of cases within ±5, 10, 15, and 20 kg ranges for each method of estimation
The weight estimation method developed in this study showed moderate accuracy, with a 95% confidence interval of ±14.7 kg. Figure 2 displays the scatterplot between the estimated weight and actual weight for each method, whereas Fig. 3 presents the Bland– Altman plots for each estimation method and the actual weight. In addition, Table 1 provides a summary of the Bland– Altman plots. Accurate weight estimation is particularly important in emergency medicine, and previous studies have reported the accuracy of weight estimation by medical staff in this field [8, 9]. Menon and Kelly [8] investigated the estimation accuracy by medical staff, reporting that the mean error in weight estimations was 11% for physicians and 7.7% for nurses. In addition, the physicians’ estimations indicated that 33% were within 5% of the actual weight, 78% were within 10%, and the 95% confidence interval in the modified Bland– Altman plot ranged from – 44.5 to +55 kg, suggesting that the accuracy of the physician’s estimation is insufficient. In comparison, the 95% confidence interval in this study was ±14.7 kg, indicating that our method may offer a more accurate weight estimation than physician estimations. Furthermore, Anglemyer et al. [9] reported that the accuracy of visual estimation by physicians is insufficient, with 14.7% of primary care physicians potentially overestimating weight by more than 20%. In the method developed in this study, the number of cases in which the weight was overestimated or underestimated by more than 15 kg was about 5%, suggesting a lower likelihood of overestimation or underestimation. Therefore, our weight estimation method may potentially be a more useful tool than estimations by physicians in emergency examinations for patients with acute conditions such as stroke, where obtaining precise weight measurements is difficult.
The weight estimation method developed in this study uses head CT scout images, potentially contributing to the rapid implementation of head contrast examinations in emergency medicine and reducing the burden on patients and medical staff. In a technique reported by Robert et al. [10] as a weight estimation method for performing head contrast CT examinations in emergency medicine, the length of specific body parts of the patient is used. However, the use of this method for clinical applications faces challenges, such as the need to measure abdominal circumference and thigh circumference as specific body parts and its moderate accuracy. The method we developed in this study uses head CT scout images, which eliminates the need for additional measurements on patients. The summation of total pixel values for head CT scout images can be performed automatically using a program, and we anticipate that the length of the patient’s FH direction can be measured with simple image processing. Furthermore, if the head CT scout images for each device are pretrained, the estimation using deep learning can be performed in a short time. Therefore, the only process required to be performed by medical staff for weight estimation is the acquisition of head CT scout images, which can reduce the burden on patients and medical staff.
When using only the total pixel values of the head CT scout images to estimate weight, the 95% confidence interval was as low as ±20.6 kg, and some images overestimated the weight by more than 25 kg, indicating a need for improvement. The total pixel values in head CT scout images can be considered an indicator of the mass of the substances contained in the images. The head CT scout images include the patient’s head from a lateral view, fixation devices, the CT scanner bed, and metallic patient devices. The lateral image of the patient’s head can be used as information related to the patient’s weight. However, because the patient’s weight is expected to depend more on the trunk than the head, estimations using the lateral image of the patient’s head are presumed to have significant variability. In addition, factors such as fixation devices, CT scanner beds, and metallic patient devices can also contribute to this variability. Furthermore, the range of the patient’s FH direction within the image is believed to be a particularly significant factor causing variability. For this reason, to reduce the influence of the patient’s FH direction on weight estimation in this study, we divided the total pixel values of the head CT scout images by the length of the patient’s FH direction contained in the image. However, the 95% confidence interval of the weight estimation using the total pixel values from head CT scout images was low, indicating a need for improvement in reducing other sources of variability. On the other hand, the average measurement error based on the actual values in the Bland– Altman plot was very small, and the proportional error was considered to be moderate. Therefore, the total pixel values of head CT scout images can be regarded as an essential indicator for estimating a patient’s weight.
For weight estimation using deep learning with head CT scout images, the 95% confidence interval was 16.3 kg, indicating moderate accuracy. However, the proportional error was – 0.60, indicating a need for improvement. When examining the areas of interest in deep learning, as shown in the heat map of Fig. 4, it becomes evident that the regions primarily focused on are located in the central parts of the human body, such as the upper pharynx and the sella turcica, with less emphasis placed on fixation devices, CT scanner beds, and metallic patient devices. This can also be confirmed from the details shown in Table 2. Therefore, we believe that the influence of nonpatient information on the estimation results was small, and the weight estimation using deep learning had less variability than the estimation using only total pixel values. When estimating using only total pixel values, setting areas of interest to exclude the influence of nonpatient information, such as fixation devices, CT scanner beds, and metallic patient devices, is complicated. On the other hand, although weight estimation using deep learning has the advantage of focusing on the human body and reducing variability, it still leaves challenges regarding proportional errors. In previous studies that estimated weight from trunk CT scout images [14] or chest X-ray images [18] using deep learning, models using VGG16 were constructed. In addition, there are various reports regarding deep learning models [19, 20], and changing the deep learning model could potentially improve the accuracy of weight estimation. In this study, instead of examining the optimal model for deep learning using head CT scout images, we incorporated a more straightforward indicator of total pixel values from head CT scout images. As a result, the proportional error decreased to – 0.10, and the 95% confidence interval improved slightly to 14.7 kg.
In this study, the accuracy of weight estimation using head CT scout images was lower than in previous studies [14] estimating weight using trunk CT scout images. Ichikawa et al. [14] predicted weight using chest CT scout images and abdominal CT scout images for each data set. The mean absolute error was reported as 2.75 kg for weight estimation using chest CT scout images and 4.77 kg for weight estimation using abdominal CT scout images. These authors also reported that the percentage of cases within ±5 kg compared with the actual weight was 82.3% for chest CT scout images and 56.7% for abdominal CT scout images, whereas the percentage of cases within ±10 kg was 98.4% for chest CT scout images and 91.3% for abdominal CT scout images. In this study, Table 3 shows that weight estimation using head CT scout images resulted in 54% of cases within ±5 kg and 95% of cases within ±15 kg. Although a simple comparison cannot be made due to differences in the number of training sets and conditions in all regions, the highest accuracy was shown with weight estimation using chest CT scout images. The higher accuracy of weight estimation using trunk CT scout images compared with head CT scout images is consistent with the general belief that weight depends more on the trunk image. However, the accuracy of weight estimation using abdominal CT scout images was only slightly better than that of the present study using head CT scout images, with a small difference observed.
We obtained the head CT scout images used in this study from the same facility, equipment, and imaging conditions, which might limit the applicability to other devices and imaging conditions. In addition, the data set used for the analysis consisted of only 216 sets, and a detailed examination of factors such as sex, age, diseases, internal devices, and fixation methods was not conducted. Moreover, this study focused on patients with a weight ranging from 40 to 80 kg and a height ranging from 140 to 200 cm.
Conclusion
In this study, we developed a method to estimate patient weight by combining the total pixel value of head CT scout images and deep learning techniques. The proposed estimation method, which takes the average of these two techniques, demonstrated a 95% confidence interval in the Bland– Altman plot of ±14.7 kg, with 99% of the tests falling within the ±20 kg range. As a result, the method we presented may potentially serve as a valuable support tool for medical staff, such as doctors and nurses, in estimating weight during emergency examinations for patients with acute conditions such as stroke, when obtaining accurate weight measurements is not easily feasible.