
Abstract
BACKGROUNDS:
X-ray phase contrast imaging (XPCI) can separate the attenuation, refraction, and scattering signals of the object. The application of image fusion enables the concentration of distinctive information into a single image. Some methods have been applied in XPCI field, but wavelet-based decomposition approaches often result in loss of original data.
OBJECTIVE:
To explore the application value of a novel image fusion method for XPCI system and computed tomography (CT) system.
METHODS:
The means of fast adaptive bidimensional empirical mode decomposition (FABEMD) is considered for image decomposition to avoid unnecessary information loss. A parameter δ is proposed to guide the fusion of bidimensional intrinsic mode functions which contain high-frequency information, using a pulse coupled neural network with morphological gradients (MGPCNN). The residual images are fused by the energy attribute fusion strategy. Image preprocessing and enhancement are performed on the result to ensure its quality. The effectiveness of other image fusion methods has been compared, such as discrete wavelet transforms and anisotropic diffusion fusion.
RESULTS:
The δ-guided FABEMD-MGPCNN method achieved either the first or second position in objective evaluation metrics with biological samples, as compared to other image fusion methods. Moreover, comparisons are made with other fusion methods used for XPCI. Finally, the proposed method applied in CT show expected results to retain the feature information.
CONCLUSIONS:
The proposed δ-guided FABEMD-MGPCNN method shows potential feasibility and superiority over traditional and recent image fusion methods for X-ray differential phase contrast imaging and computed tomography systems.
Keywords
Introduction
Traditional absorption-based X-ray imaging technology has been extensively used in numerous fields in the past few decades such as industrial flaw detection and medical imaging. The generation of the Talbot grating interferometer based on the phase stepping method and the proposal of the Talbot-Lau theory made the X-ray source free from high coherence and long exposure time, which led to the rapid development of X-ray phase contrast imaging (XPCI) and X-ray dark field imaging (XDFI) [1–5]. In recent years, there have been some developments in the simulation and optimization of Moiré fringes in Talbot grating interferometers [6, 7]. According to the theory of Angular signal radiography, XPCI and XDFI reflect the attenuation, refraction and scattering signals of the object under detection, which can be expressed as attenuation contrast image (AC), differential phase contrast image (DPC), and dark field contrast image (DFC), respectively [8]. Compared with the traditional attenuated X-ray imaging technology which only provide absorption imaging, various characteristics of the object under measurement could be fully indicated due to the complementary detailed information provided by DPC and DFC images. During the recent years, the XPCI has been widely reported as a necessary tool in more fields on account of the advantages proposed above. For instance, in the medical field, XPCI is often introduced to diagnose breast cancer tissue specimens because of its prominent benefits of discriminating trend for cancerous areas with microcalcifications or milder symptoms [9–11]. In addition, differential phase and dark-field signals of the lungs could be used to identify a variety of types of lung diseases [12–14]. In the field of industrial detection, new examination possibility in fiber composite materials was offered since that DPC and DFC images are sensitivity to porosity or micro morphology [15–19].
For the reason that three contrast images represent different physical characteristics, it is not convenient to directly observe in practical applications. Image fusion technology always merges images of different features acquired by a same sample into a single enhanced image. The fusion result always has more detailed information and contains enough characteristics of the images before fusion, making visualization and analysis easier for diagnosis. Image fusion technology has been regularly used in fields which require complementary information to consist a single image, such as the fusion of infrared images and visible light images, the synthesis of multi-focus images, and the combination of images from CT, MRI, SPECT or PET [20–28].
In the Talbot-Lau grating interferometer, the simultaneous acquisition of signals of different contrasts is particularly convenient for image fusion, since the reconstructed AC, DPC, and DFC images are directly registered in space. Up to now, there has been already lots of means for merging AC and DPC images [29, 30]. Furthermore, Hass et al introduced the concept of centroid from computed graphics subject into the XPCI images fusion and proposed a linearly weighted fusion approach [31]. Zhentian et al proposed a fusion scheme based on principal component analysis (PCA) [32]. Stampanoni et al constructed an image fusion scheme based on a multi-resolution (MR) framework, whose core idea is to convert the AC, DPC, and DFC images into multiple frequency bands [33]. Scholkmann et al introduced a two-step fusion framework based on shift-invariant discrete wavelet transform [34]. Eduardo Coello et al used Fourier domain fusion algorithm, which defined a weighting function to select frequency bands [35]. Gusenbauer et al combined three contrast images after high-pass and low-pass filter with appropriate image masks to obtain fusion result [36, 37].
In the present work, an image fusion framework is constructed to decompose AC, DPC, and DFC images, which based on fast adaptive bidimensional empirical mode decomposition (FABEMD) method. Images will be decomposed into a corresponding set of bidimensional intrinsic mode functions (BIMFs) and the residual images. Subsequently, image preprocessing will be carried out on both the BIMFs and residual images. The BIMFs that contain high-frequency information will be subjected to adaptive Wiener filtering while the lowest-order BIMF component could be discarded optionally to mitigate the influence of noise in the source image. Residual images mainly reflect the distribution of low-frequency energy and can be preprocessed to reduce uneven light intensity distribution in the original image. During the image fusion process, the BIMFs components are fused by using a pulse-coupled neural network with multi-level morphological gradients (MGPCNN), while the residual images are fused using a maximum energy fusion strategy. A new parameter δ is proposed based on the physical meaning of the image obtained by XPCI, which definition is the standard deviation (SD) and average grad (AG) values of the low-order BIMFs signal of the AC and DPC images. The parameter δ reflects the amount of information of the image involved in the fusion and guide the MGPCNN fusion process. Finally, the fused image is acquired by inverse bidimensional empirical mode decomposition (IBEMD) after series of image enhancement means. In order to validate the practicability of this method, various of experimental samples were used to get the results of image fusion. The method proposed in this article is compared with traditional and recent image fusion methods, and further compared with some techniques previously applied for XPCI image fusion. Both subjective image quality judgment and objective image quality evaluation indicators of FABEMD-MGPCNN method show better results. A specialized discussion was also conducted on the limitations of this method. In addition, the proposed method is applied to medical computed tomography and also has an expected effect. This novel image fusion method proposed in this paper is named δ-guided FABEMD-MGPCNN method.
Methods
Principle of X-ray grating interferometer
In this study, AC, DPC, and DFC images of the sample under test were obtained using the phase stepping method with a Talbot-Lau grating interferometer. The instrument makes use of Talbot self-imaging effect and Lau superposition effect [38, 39]. With stepped phase acquisition of the sample and background separately, different structures within the object cause beam diffraction or scattering, resulting in changes in the intensity and shape of the moiré fringes recorded on the detector [40]. Moreover, the contrast changes of the moiré fringes reflect the X-ray absorption characteristics, while the deformation of the moiré fringes is caused by the refraction and small-angle scattering of X-rays passing through the object. According to the theory of Angular signal radiography, the attenuation, refraction and scattering signals of the object under detection can be expressed as attenuation contrast image (AC), differential phase contrast image (DPC), and dark field contrast image (DFC), respectively [8].
The structure of the Talbot-Lau interferometer is illustrated in Fig. 1. The laboratory’s large-focus X-ray tube light source is divided into several sub-light sources via the source grating G0, with each sub-light source capable of generating a Talbot self-imaging pattern behind the G1 grating. By designing specific geometric parameters, the self-imaging patterns of each sub-light source can be separated by one or several periods, as the sub-light sources are incoherent with one another. Additionally, the intensity can be superimposed at the G2 grating to form self-imaging fringes that meet the experimental requirements.
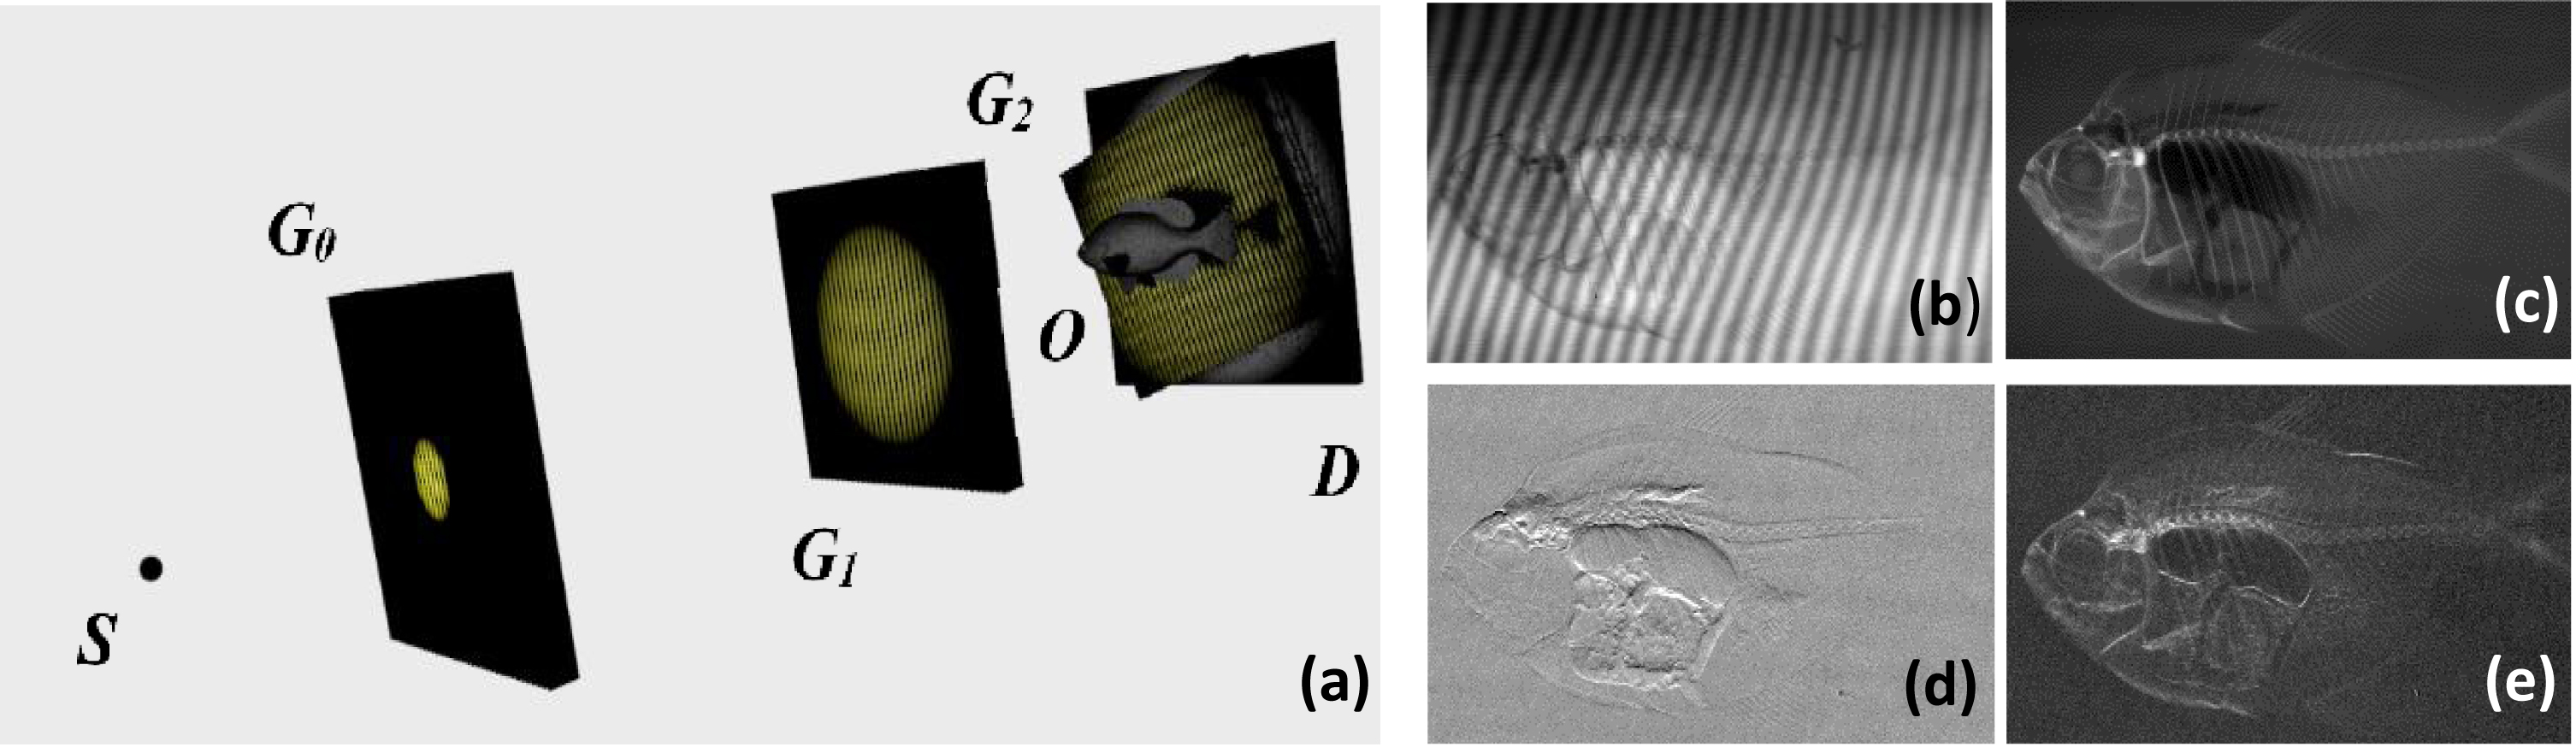
(a): The structure of the Talbot-Lau X-ray grating interferometer. S denotes the X-ray source, G0 is the source grating, G1 is the phase grating, and G2 is the analyzer grating. O represents the experimental sample to be imaged, while D is the detector. (b): One image with a moiré fringe pattern captured by the detector. (c–e): AC, DPC, DFC images calculated by the moiré fringe images obtained through a five-step phase stepping process.
The formula of the intensity distribution of the moiré fringe patterns for both the sample and background can be expressed as follows:
Where,
The absorption contrast image, dark-field contrast image, and differential phase contrast image are represented as follows:
Where, Abs (x, y) represents AC image, Dfc (x, y) represents the DFC image, Dpc (x, y) represents the DPC image, φ s and φ r represent the image phase of sample and background, p2 represents the period of the analysis grating, d represents the distance between the phase grating and the analysis grating, arg represents the angle of a complex number and rem represents the modulus of a complex number.
The grating interferometer used to capture the experimental images in the study comprises the following devices: (i) a rotating-anode molybdenum x-ray tube source with a focal spot size of 100μm (Canon, E7290AX) which operated at 39 kV with a mean energy of 17.45 keV, (ii) a CMOS flat-panel detector (Shad-o-Box 6K HS, Teledyne DALSA) with a native element dimension of 49.5×49.5μm2, and (iii) three gratings were fabricated by MicroWorks GmbH, Karlsruhe, Germany. The source grating G0, π-phase grating G1 and analyser grating G2 have a period of 6μm with a duty cycle of 0.5, and their total active area is a circular area with a diameter of 70 mm. Moreover, the grating G0 is coated with a 96um±8um gold layer on a silicon substrate and the grating G2 is coated with an 86um±6um gold layer. For more specific information on the equipment used, please refer to the following article [41].
In experimental setup, the Talbot-Lau interferometry is established in a symmetric geometry as Fig. 1. The source grating G0 is located near the beryllium window of the X-ray source. The distance between G0 and G1 is equal to the distance between G1 and G2, which is the third-order Talbot distance (i.e., 38.1 cm). The G2 grating is slightly tilted to generate a moiré pattern with a visibility of 20% along the vertical image direction, and the detector is situated close to the G2 grating. The sample and background are imaged separately to remove the effects of the system’s inherent intensity distribution and noise. For phase stepping method, the complete data is acquired by stepping the G2 grating with five steps, with one second exposure time for each step. The step distance perpendicular to the grating direction is 1.2μm. By processing the acquired moiré fringe images, the AC, DPC, and DFC images of the sample can be obtained.
The image fusion framework proposed in this article is composed of three main parts, as depicted in Fig. 2. (i) Fast adaptive bidimensional empirical mode decomposition is performed for each modal image (AC, DPC, and DFC) of the sample, resulting in BIMFs and a residual image, respectively. A wiener filter is applied to the low-order BIMF component for noise reduction, and the residual image containing vignetting components is corrected for the influence of light distribution. (ii) A two-step fusion method is employed, where the AC image and the DPC image are merged, followed by the fusion of the new image with the DFC image. Specifically, each BIMF of different order is fused by the PCNN with morphological gradients, while the energy attribute (EA) fusion strategy is utilized in residual image fusion. Before the high-frequency information fusion of BIMF components, the SD and PSNR of its low-order components are calculated to obtain parameter δ that reflects the richness of detail information and guides MGPCNN fusion. (iii) Once the fused image’s BIMFs and residual image are obtained, each BIMF is subjected to image enhancement, while the residual image is processed via contrast enhancement and histogram equalization. During the inverse bidimensional empirical mode decomposition process to restore the fused image, the BIMFs and residual image are appropriately linearly weighted to sharpen the image
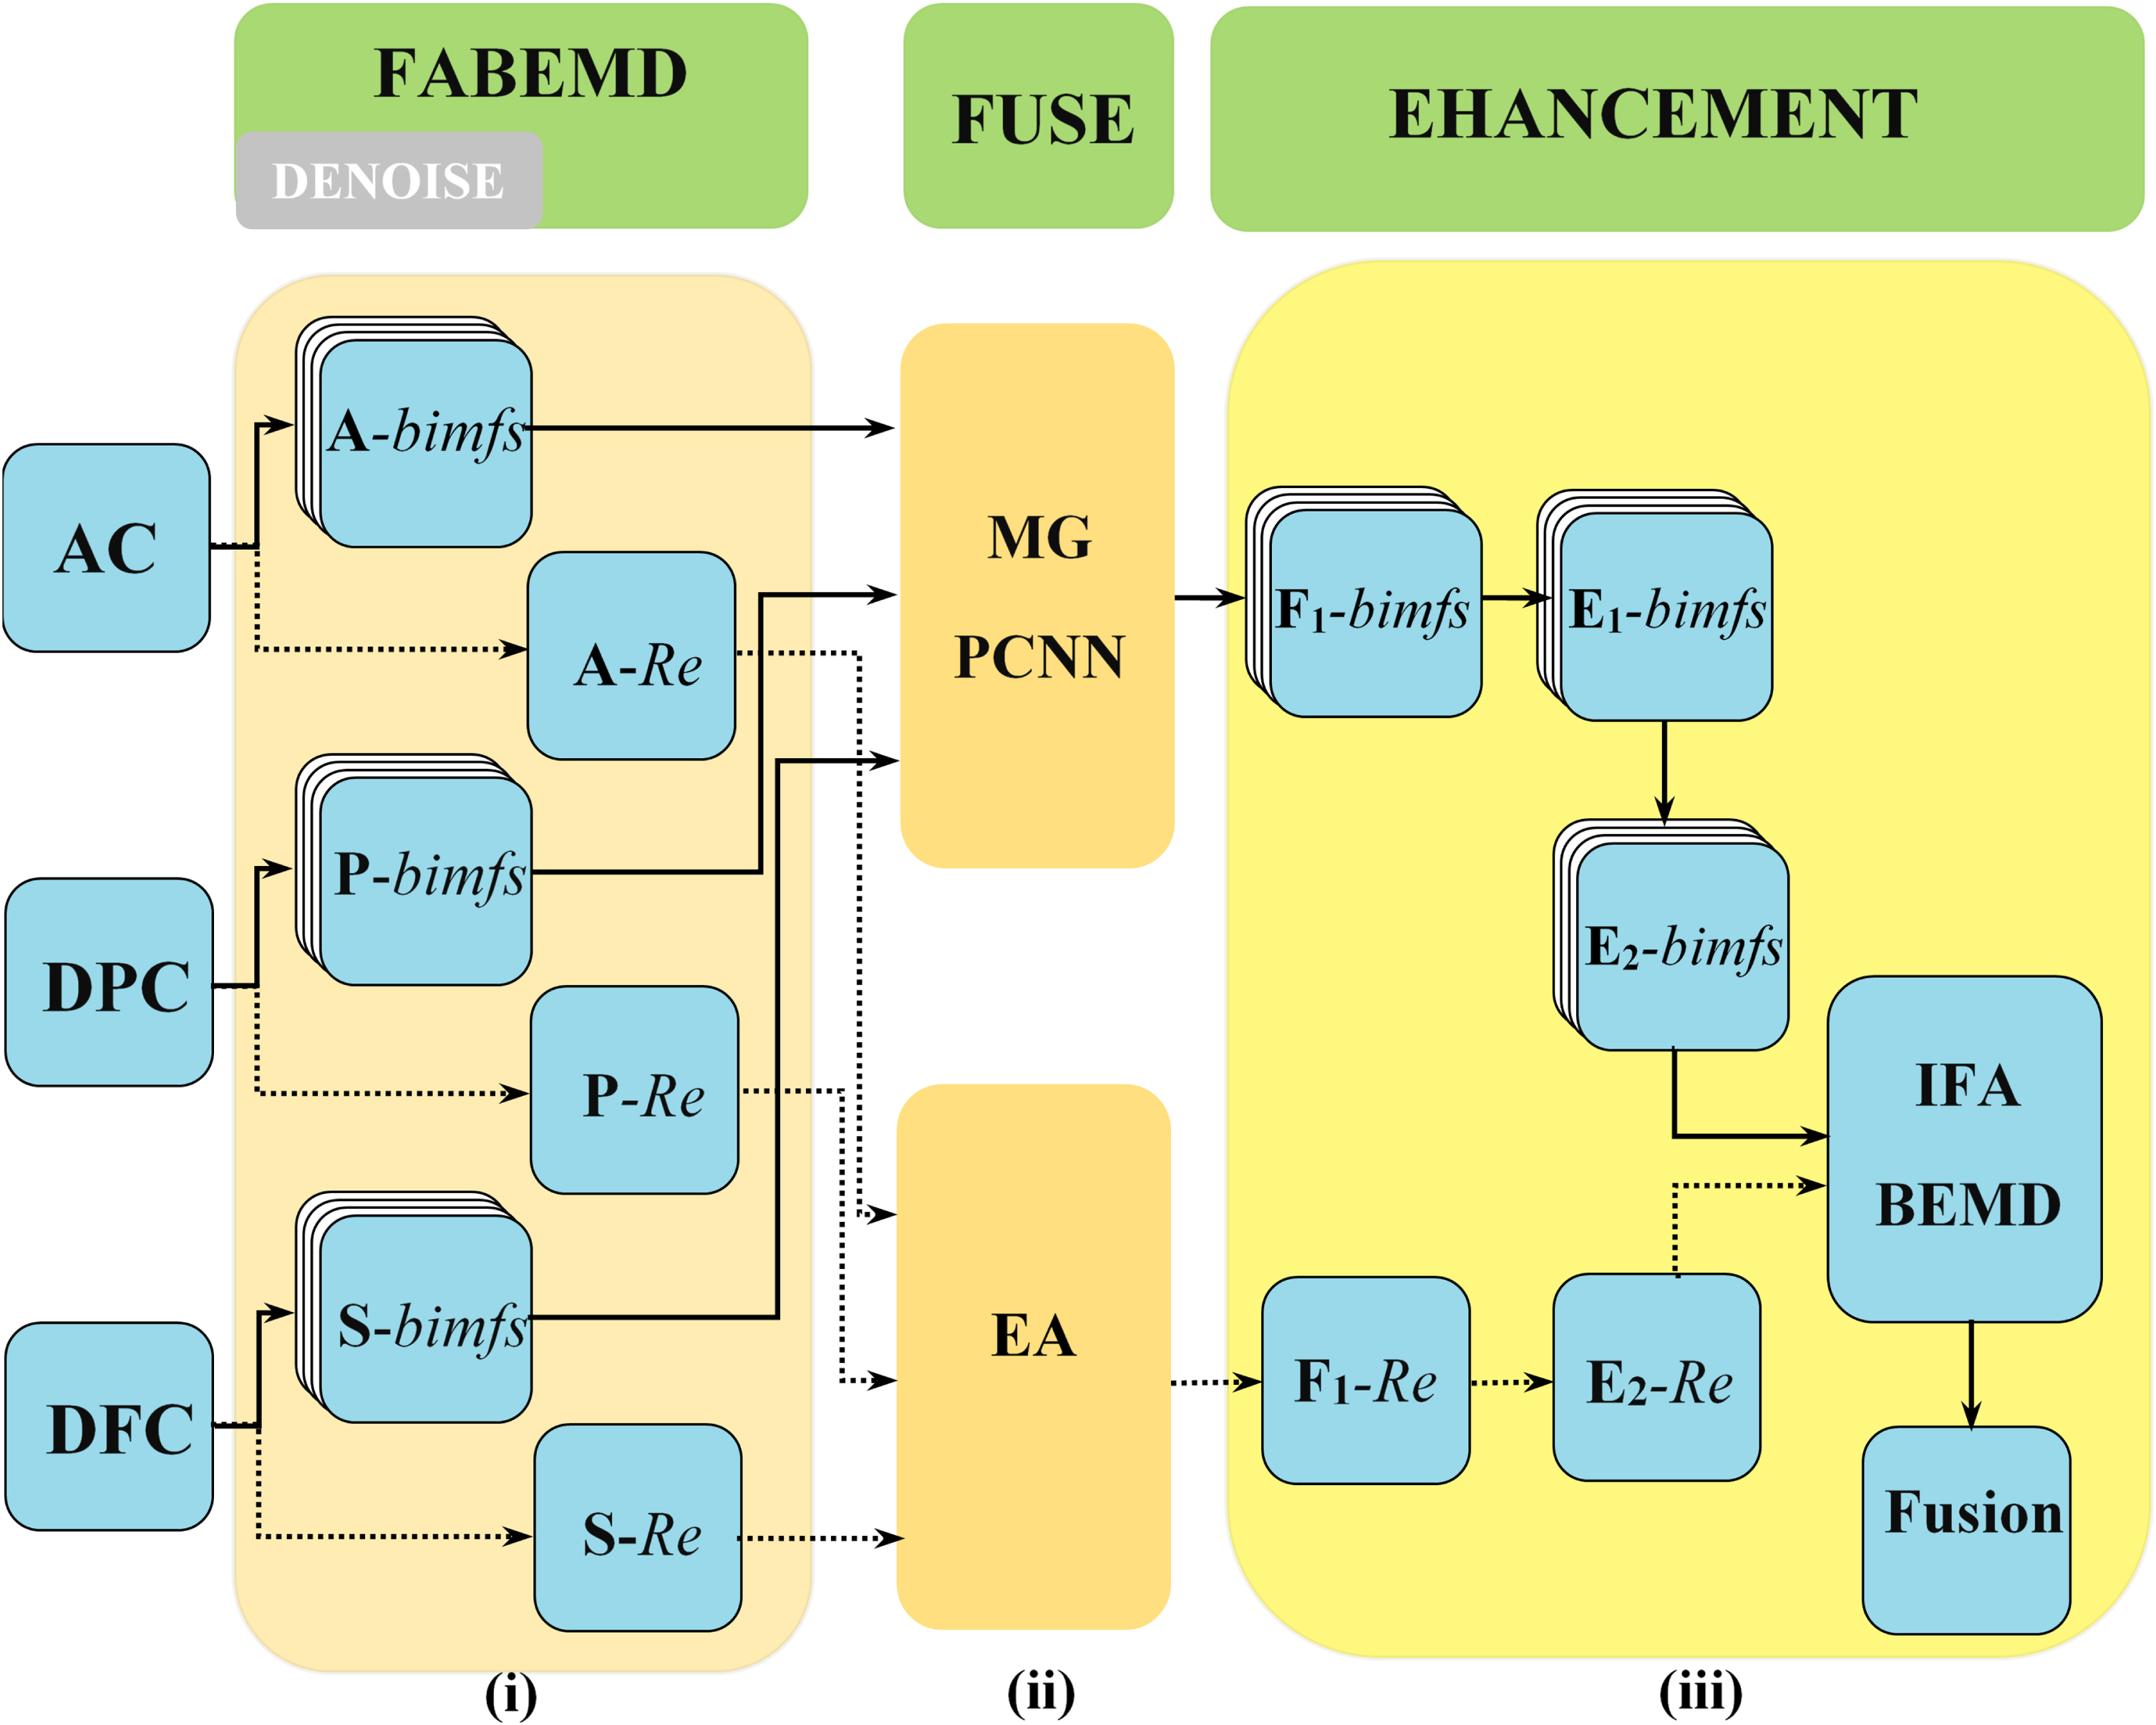
The framework proposed in this article for X-ray multimodal image fusion consists of three main parts: decomposition (i), fusion (ii), and image enhancement (iii).
Bidimensional empirical mode decomposition (BEMD) is a signal processing method developed by Huang, which is used to extract local characteristics and time-frequency distribution of data, enabling the analysis of nonlinear and non-stationary data [42–45]. In recent years, new algorithms have been proposed to improve the decomposition speed of each intrinsic mode function (IMF) and the decomposition stopping conditions [46–51].
The bidimensional empirical mode decomposition (BEMD) method extracts residual image and IMFs in an empirical, adaptive, and data-driven manner [52]. When applied correctly, the decomposition process preserves the original information and avoids the introduction of unnecessary artifacts. BEMD has also been successfully employed in image fusion applications [53, 54]. Bhuiyan et al developed a fast adaptive bidimensional empirical mode decomposition (FABEMD) method, which makes the decomposition of the original data have a faster speed, stronger adaptability, and a better quality of BIMFs.
For a given image I (x, y), FABEMD produces a representation of the sum of BIMFs D
i
(x, y) and residual images R
N
(x, y):
Let I denotes the original image, D denotes a BIMF, and R denotes the residue. The i-th component of the BIMFs in the decomposition process, denoted as D
i
, is obtained from its source image R
i
. R
i
is a residue image calculated as R
i
= Ri-1 - Di-1, where R1 = I. The BIMFs are acquired through the following decomposition steps: Set i = 1. Take the original image I and set R
i
= I. Set j = 1. Set D
T
j
= R
i
. Obtain the local maxima map (LMMAX) and the local minima map (LMMIN) of D
T
j
denoted as P
j
and Q
j
, respectively, using the sliding window method with a 3×3 size. Apply the MAX filter to P
j
and the MIN filter to Q
j
to create an upper envelope (UE
j
) surface and a lower envelope (LE
j
) surface. Smooth UE
j
and LE
j
using an averaging filter. Find the mean average envelope (ME) as ME
j
= (UE
j
+ LE
j
)/2. Calculate D
T
j+1
as D
T
j+1
= D
T
j
- ME
j
. Check whether D
T
j+1
satisfies the loop stop condition.
if D
T
j+1
meets the criteria given in step (viii), then take D
i
= D
T
j+1
. Set i = i + 1 first and then calculate R
i
= Ri-1 - Di-1. Go to step (ix). If D
T
j+1
does not meet the stopping criteria, then set j = j + 1, go to step (iii) and continue up to step (viii) as before until the criteria are fulfilled [55].
By adjusting relevant parameters and stopping conditions, different image information can be acquired in BIIMFs. It’s practicable to note that the first-level BIMF reflects most of the noise and contains less detailed image information, while the residual image reflects the light intensity distribution information in the original image. Thus, the quality of the raw images can be improved by such methods. Each first-level BIMF can be either discarded, or alternatively applied by an adaptive Wiener filter to increase the signal-to-noise ratio (SNR). The methods aim to remove the noise as much as possible while preserve edges and high-frequency information in the images. The wiener filter can be expressed as follows,
The parameter M is the total number of rows, and N is the total number of columns in the image.
When the sample is irradiated with an X-ray tube under laboratory conditions, the phenomenon of uneven light intensity distribution often occurs in the resulting image because the light spot can be approximately regarded as a Gaussian distribution. When calculating the AC, DPC, and DFC images, the method of capturing the background significantly reduces the impact of light intensity distribution and inherent noise in the system. During the image capture process, it is unavoidable that the light source exhibits some degree of drift, which can still introduce certain effects on the light intensity distribution. Additionally, random noise may be present in both the sample and background images. In order to further minimize the influence of uneven light intensity distribution when restoring the image, the residual image, which contains few high-frequency information can be discarded.
Figure 3 illustrates the results of using FABEMD to correct image noise and uneven light distribution in a simulation. The image used in this simulation is part of the ‘concordorthophoto.png’ from the MATLAB library.
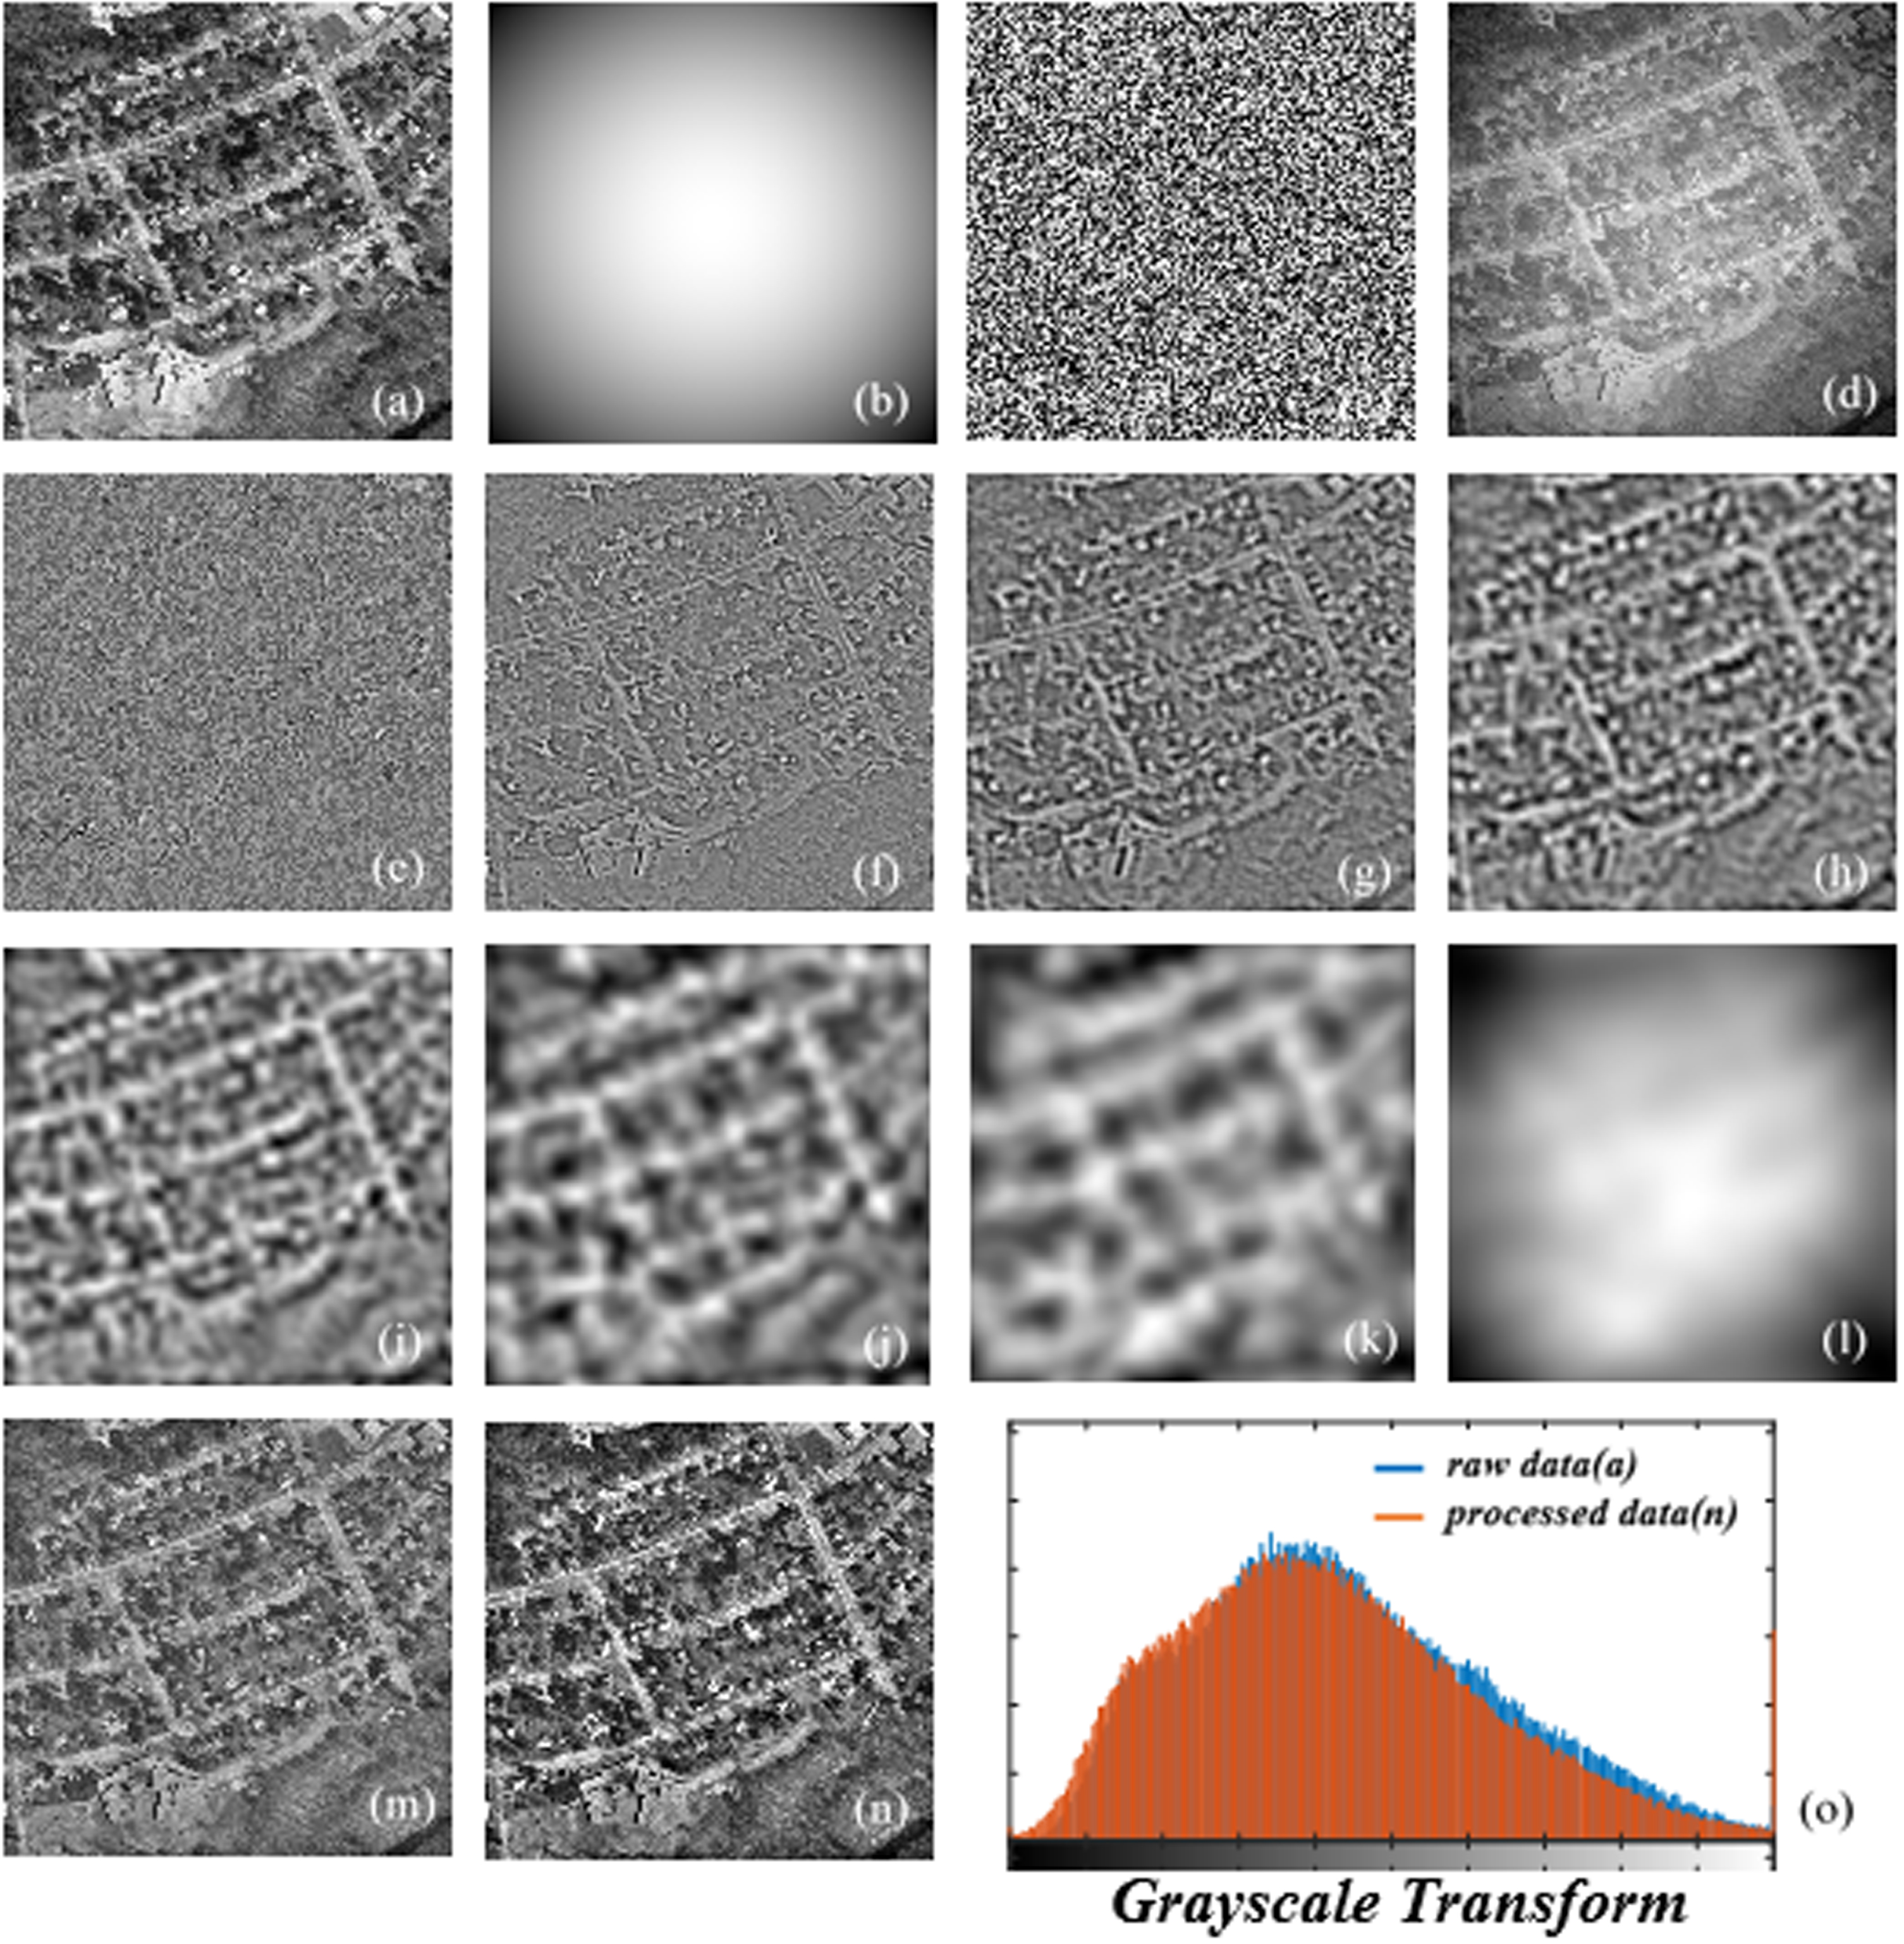
The process and results of regulating the images contaminated by noise and vignetting with FABEMD. (a) the original image, (b) the distribution of light, (c) the noisy image, (d) the polluted image by (b) and (c), (e)-(l) the BIMFs and residual component of (d), (m) the improved image, (n) the image optimized by histogram equalization, (o) the histogram distribution of the raw data (a) and the processed data (n).
Figure 3a shows the original image, while Fig. 3b–3d illustrate the distribution of light intensity, noise, and polluted image, respectively. In addition, Fig. 3e–3l show the BIMFs and residual image of Fig. 3d, with seven-level decomposition used for FABEMD. Figure 3m displays the reconstructed image obtained after discarding the residual image and filtering the first-level BIMF, while Fig. 3n shows the result after gamma transformation for the reconstructed image. Figure 3o represents the comparison of the grayscale distribution between Fig. 3n and the original image.
By utilizing the FABEMD method, it is possible to effectively reduce the influence of noise and uneven illumination on the image. After removing the residual component, techniques such as histogram equalization can be employed to enhance the image contrast.
After decomposing the AC, DPC, and DFC images using FABEMD, the BIMFs of AC and DPC are first fused by PCNN in gradient domain. Then, the EA fusion strategy is utilized in their residual images’ fusion. The same operation is repeated for the fusion of BIMFs and residual images from DFC and the results obtained in the previous step.
Principle for BIMFs fusion
BIMFs mainly contain the edge and detail information of an image. Multi-level morphological gradient (MLMG) is a valid method for conveniently and effectively extracting gradient information from an image. The specific details are expressed as follows [56].
(i) the multi-level structuring element is defined as
(ii) the gradient feature G
t
can be represented by the operators shows in step (i) from the image I.
(iii) MLMG can be acquired by weighted sum.
PCNN offers several advantages, including: (i) No complex training is needed for PCNN [57–59]. (ii) the spatial feature information of the image is well preserved after iterations due to the high level of connectivity between each neuron and the spatial information. The PCNN model typically comprises three components: the receptive field, the modulation field, and the pulse generator.
The traditional PCNN structure is shown in Fig. 4, while the mathematical structure of PCNN is described by Equation (14) through Equation (21).

Traditional dual-channel PCNN structure model.
As shown in Fig. 4,
In this article, a new parameter δ is proposed to aid in the calculation of the MGPCNN network. The parameter is introduced to calculate physical significance of AC, DPC and DFC images. The parameter δ is defined to guide the iterative calculation of the pulse coupling neural network, and it represents the brightness and detail information of the absorption image (AC), the edge features and gradient information of the phase image (DPC) and dark field image (DFC).
After the calculation is completed, the δ is substituted into the Y in in PCNN.
The residual images typically contain information about areas with less severe changes and relatively flat gray levels. To effectively use this information, the energy attribute (EA) fusion strategy is employed for each residual image. In the residual image, the low-frequency component contains the primary contour information of the signal, which is equivalent to an approximation of the original signal at a certain scale. The EA fusion strategy is especially suitable for features with slow changes of low frequency. It combines the mean and median values of the image to obtain the relative feature distribution of each point in the image. These distributions are then used as weights in linear weighted fusion. This EA fusion strategy is divided into three steps:
(i) The characteristic attributes of the residual images are computed as
(ii) Then, the characteristic attributes are further computed using the following equation:
(iii) Finally, the fused residual image is obtained by taking a weighted mean as follows:
Before performing inverse bidimensional empirical mode decomposition (IBEMD) on the BIMFs and residual image obtained through the previous steps, several operations will be carried out to enhance the quality of the fused image.
To improve the sharpness and increase the detail in the fusion results, a local standard deviation-based method is used on the BIMFS owning to the high-frequency information. Each BIMF component will be divided into contextual regions of size (2m+1) * (2m+1). The pixels in the BIMFs are then enhanced directly by the standard deviation of the context region, which is given by
To further sharpen the boundary in the fused image, the Unsharp Masking model described as below is utilized. The model is described as follows:
The residual image mainly contains the background and brightness information of the original image, whose contrast can be enhanced by using histogram modification based function (HMF) and gamma transform. The probability density function (PDF) and the cumulative distribution function (CDF) of the residue can be initially computed as
When reconstructing the fused image using IBEMD, a weighted parameter approach is employed to increase the proportion of high-frequency components, which further enhances the clarity of the image.
Except for intuitive visual differences, numerous indicators are used to measure the detail information and the quality of the fusion image in the related papers regarding image fusion [60–62]. Furthermore, to validate the difference of image fusion techniques for X-ray phase contrast imaging, average grad (AG), standard deviation (SD), and peak signal to noise ratio (PSNR) are considered. SD usually represents the intensity changes before and after image fusion and reflects the amount of information contained in the image, which is defined as [63, 64]
AG mainly reflects the small and local information, reflecting the clarity of the image. Meanwhile, AG can be utilized to evaluate the contrast and the resolution of fusion image [65]. Its mathematical expressions are as follows,
PSNR is used to evaluate the spatial reconstruction quality of each band [66, 67]. Higher value of PSNR expresses the better quality of the fusion image.
It could be shown as,
In order to assess the feasibility and effectiveness of δ-guided FABEMD-MGPCNN, this paper provides a comparison of three biological samples (black skirt tetra, tiger barb and Xiphophorus maculatus) with other image fusion methods. The samples were imaged using an X-ray Talbot-Lau grating interferometer system under laboratory condition to obtain their AC, DPC and DFC images. Both subjective and objective evaluations of image quality are demonstrated to compare the results gained by the δ-guided FABEMD-MGPCNN fusion method proposed in this paper with eight traditional or recently introduced image fusion methods. During the FABEMD process, the source image was decomposed into BIMF components 7 times after extensive testing. This separation of information from BIMFs prevents modal aliasing and the influence of ripples, ultimately improving the efficiency of the fusion process. The initial values for the parameters in the morphological gradients PCNN are set as follows, αL = 0.025, αT = 2.5, L0 = 7, β = 2.8, θ0 = 1, V θ = 15, iteration count in MG is 50 and iteration count in PCNN is 150. The specific parameters should be adjusted based on the image quality obtained during the fusion process and the desired retention of detailed features.
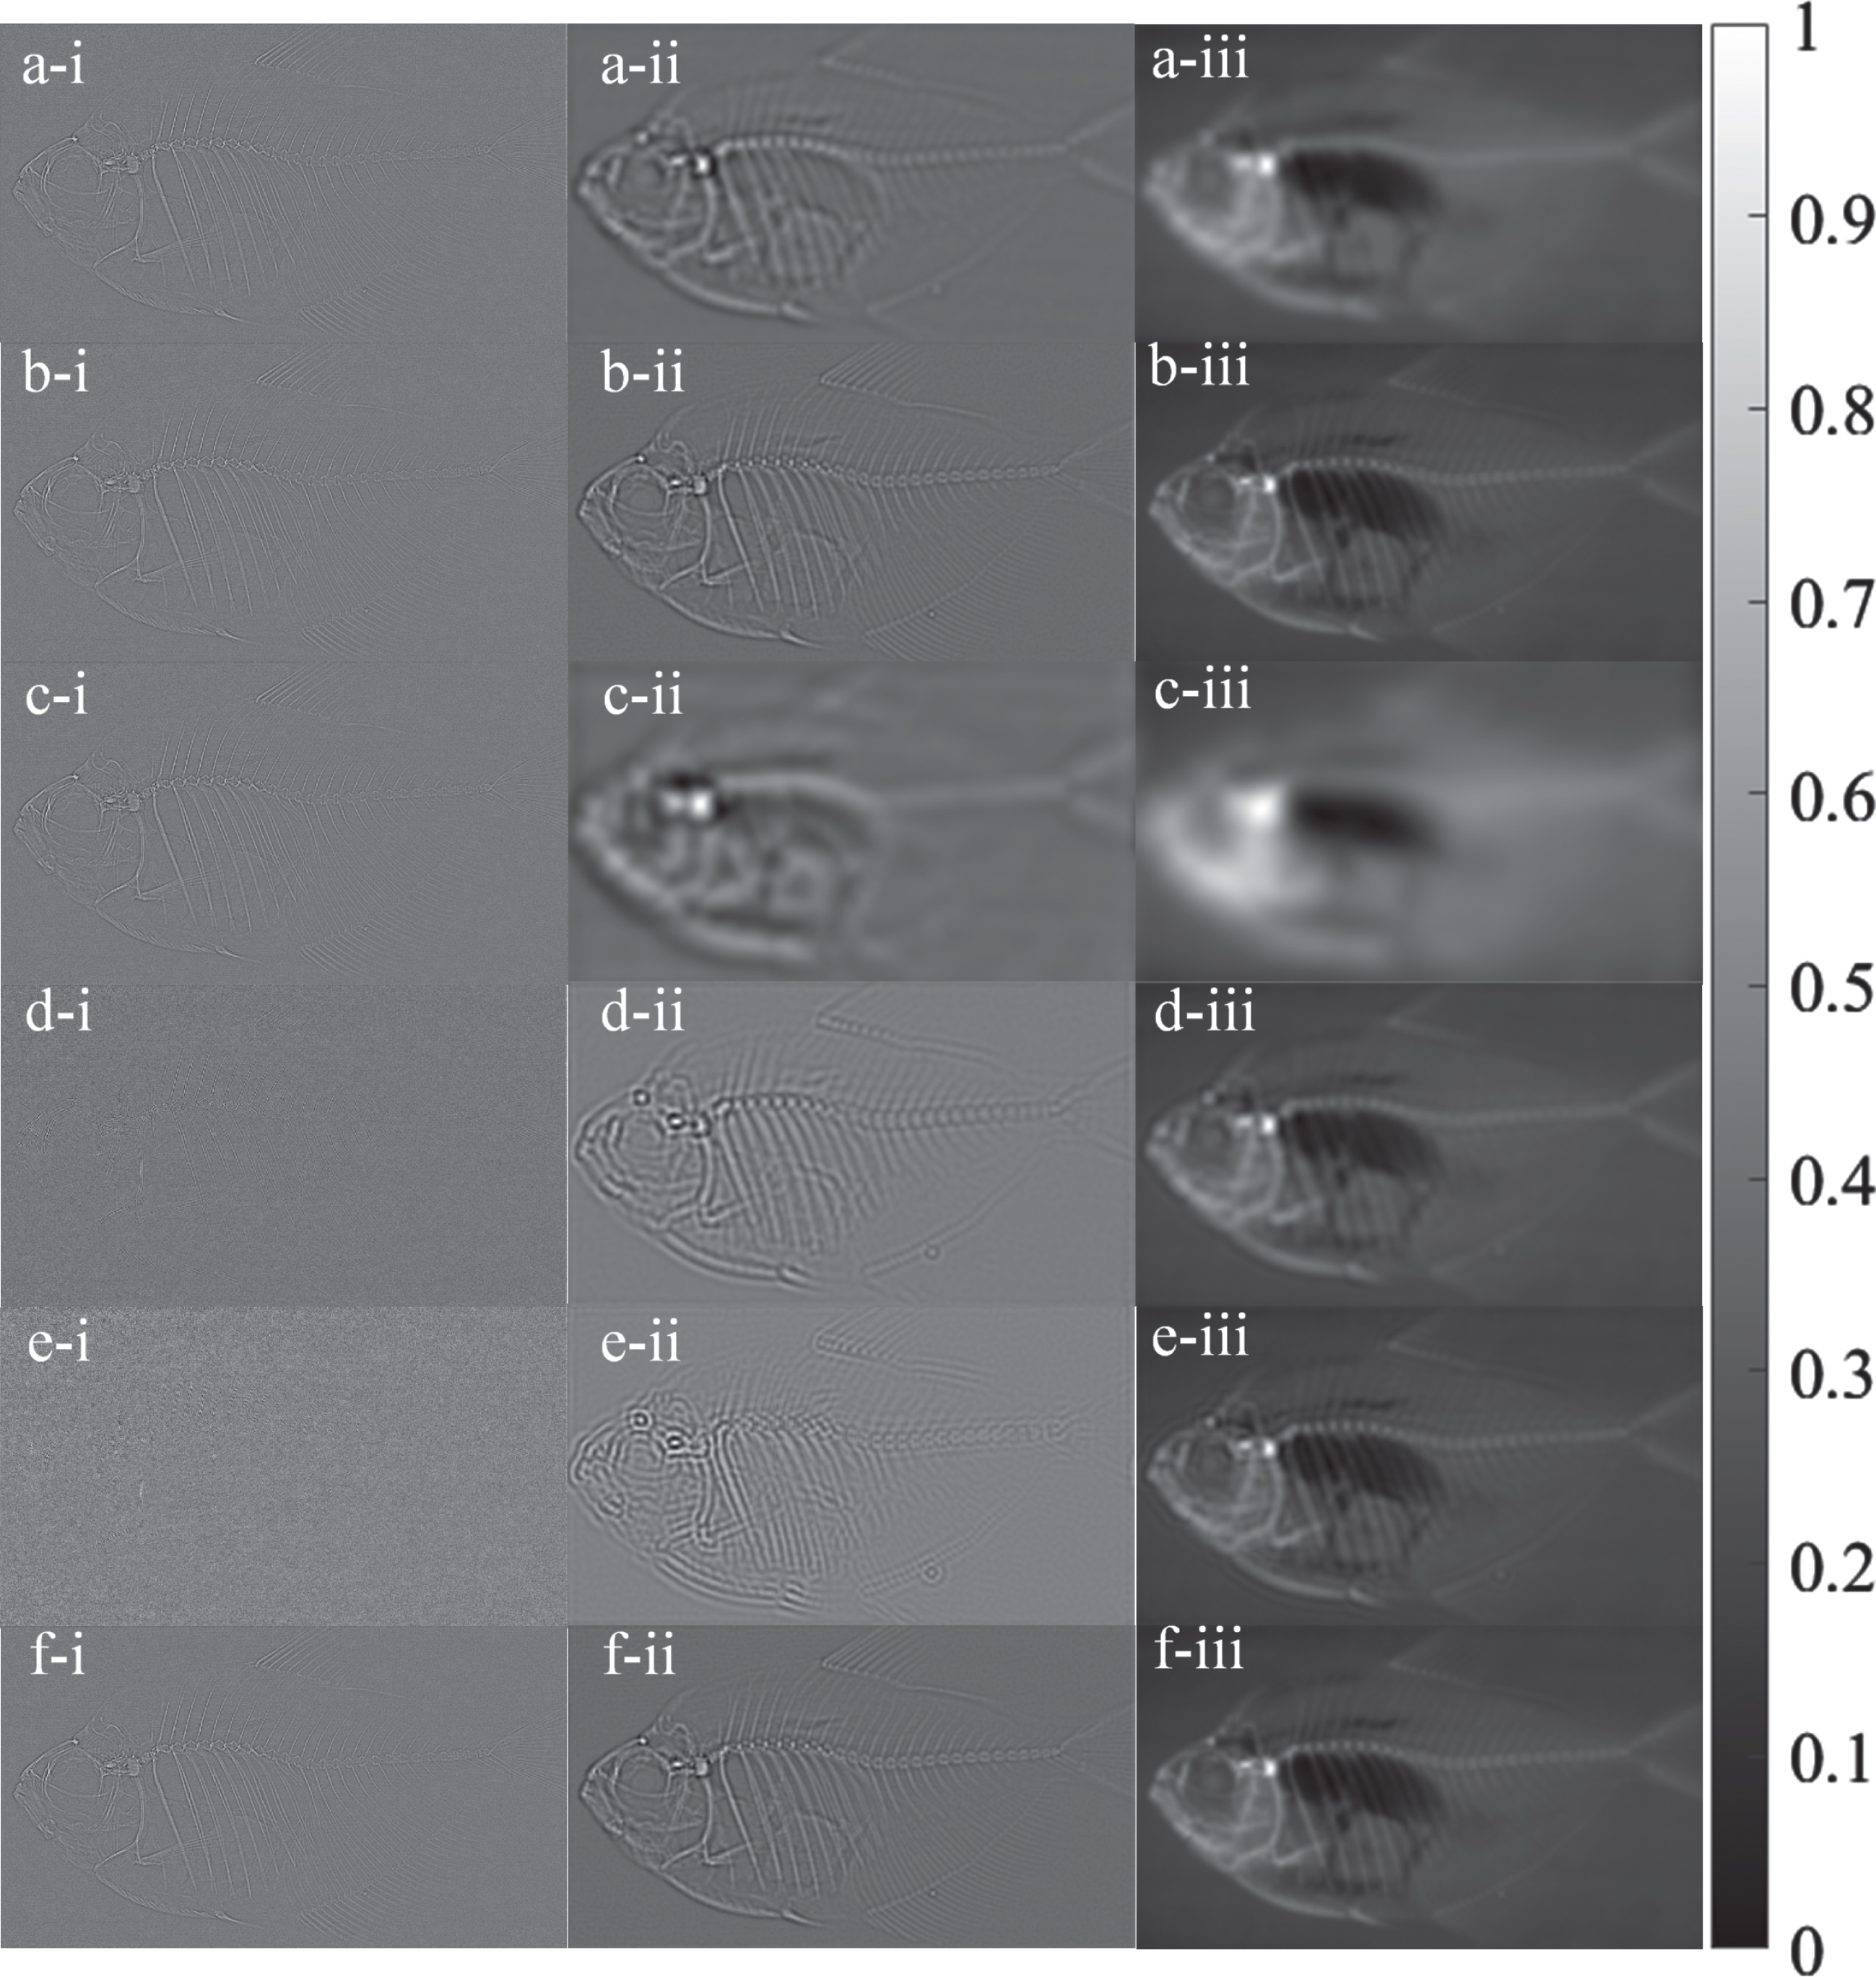
The fusion methods used to compare are anisotropic diffusion fusion (ADF), cross bilateral filter fusion (CBF), two-scale image fusion (TIF), stationary wavelet transform fusion (SWT), fourth-order partial differential equation fusion (FPDE), gradient transfer fusion (GTF), multi-scale guided image and video fusion (MGFF) and visual saliency map and weighted least fusion (VSMWLS). The core difference between the above methods are highlighted in Fig. 5.

The fused results of three samples obtained from various methods. The core difference between the above methods are highlighted. The scale of images is [0 1].
Fish 1, Fish 2, and Fish 3 in Fig. 5. correspond to black skirt tetra, tiger barb, and Xiphophorus maculatus, respectively. The key differences between the fusion results lie in their ability to incorporate the characteristics of the level between the fish bubbles and the bones (Fish1), the structure around the fish eye (Fish2), and the structure around the preliminaries (Fish3). This paper utilizes a combination of objective evaluation metrics and subjective judgment to assess the quality of image fusion results. Several quality evaluation factors were used, namely SD, AG, PSNR and operation time. SD represents the total amount of information while AG reflects the details of the image. PSNR reflects the degree of preservation of image features before and after fusion. The specific calculation results are presented in Table 1. The data highlighted in yellow show higher values, but according to subjective judgment, the corresponding images have significant errors. Therefore, these data should be excluded from the evaluation scope. The red and blue data represent the first and second highest value among the same class. This is consistent with the results of subjective judgment, indicating that the MGFF method, VSMWLS method, and δ-guided FABEMD-MGPCNN method produced better image fusion results. Their fusion images can clearly depict various details present in the original X-ray images while maintaining better contrast and signal-to-noise ratio.
Objective evaluation index of different methods
* From - - to ++ in time term means that the time taken by each algorithm is from short to long.
The calculation results demonstrate the strengths of the MGFF method, VSMWLS method and the δ-guided FABEMD-MGPCNN method proposed in this article. In order to further reflect the advantages of the δ-guided FABEMD-MGPCNN method in the fusion process of AC, DPC, and DFC images obtained by XPCI technology, the three methods are implemented on bee and steleophaga plancyi samples.
Figures 6 and 7 display the AC, DPC and DFC images of the bee and steleophaga plancyi samples obtained through XPCI, along with the results of three fusion methods used. In the marked areas of the bee sample, the FABEMD-MGPCNN method produces a result with better contrast and clarity. The PSNR values for the three methods in Fig. 6 are 14.0432 (MGFF, Fig. 6(d)), 14.4235 (VSMWLS, Fig. 6(e)) and 15.0046 (δ-guided FABEMD-MGPCNN, Fig. 6(f)). More detail information can be seen on the legs of the bee sample, such as fluff. In the back and tail area of the bee sample, the MGFF method mainly reflects the brightness value of the AC image, while the detail information and clarity of the VSMWLS method’s result are not as clear as the method proposed in this article.
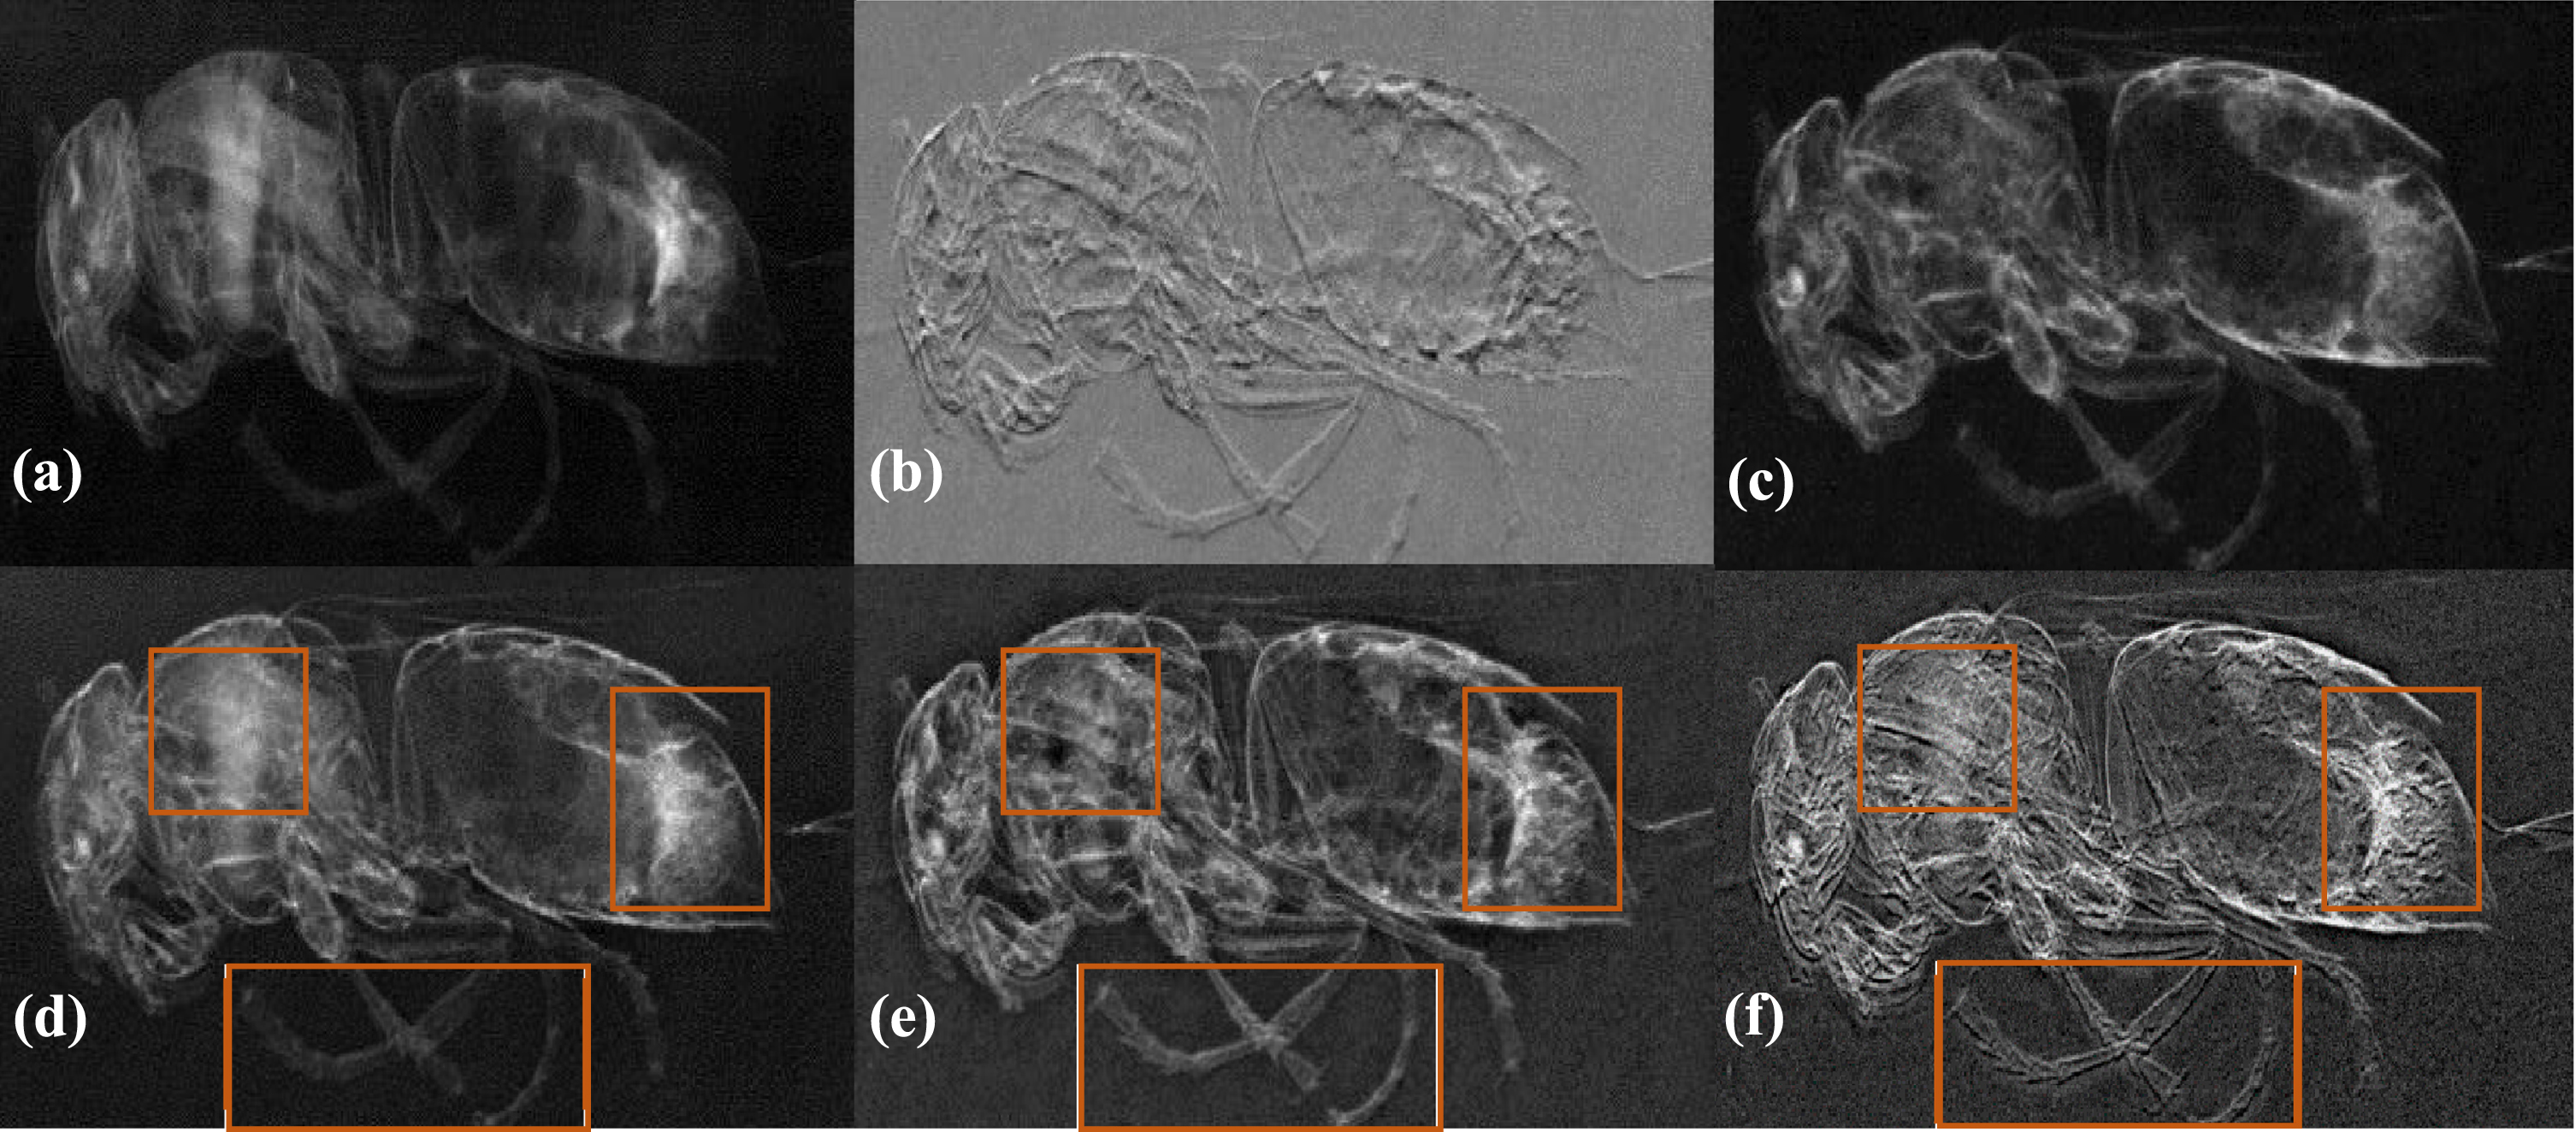
(a) AC image, (b) DPC image, (c) DFC image, (d) MGFF method, (e)VSMWLS method, (f) δ-guided FABEMD-MGPCNN method. The scale of image is [0 1].
(a) AC image, (b) DPC image, (c) DFC image, (d) MGFF method, (e)VSMWLS method, (f) δ-guided FABEMD-MGPCNN method. The scale of image is [0 1].
In the marked area of the steleophaga plancyi sample, the fusion result obtained by FABEMD-MGPCNN exhibits a better signal-to-noise ratio, more detailed information, high contrast and better structural characteristics. The PSNR values for the three methods in Fig. 7 are 12.4913 (MGFF, Fig. 7(d)), 13.0682 (VSMWLS, Fig. 7(e)) and 14.1062 (δ-guided FABEMD-MGPCNN, Fig. 7(f)). In the head and tail area of the sample, the regional characteristics signal of the results acquired by the MGFF method and the VSMWLS method is weak, and the local gradient is not obvious, making it difficult to observe these structures easily.
To further test the applicability of the algorithm proposed in X-ray phase contrast imaging, three contrast images of the bee sample were fused by using three methods cited in previous article. These methods include the linear weighted fusion method proposed by Hass [30], the fusion method based on the shift invariant wavelet discrete transform (SIDWT) framework proposed by Scholkmann [34], and the image fusion method in the Fourier domain proposed by Coello [35].
As shown in Fig. 8, the image fusion result obtained by the δ-guided FABEMD-MGPCNN method preserves more detailed features from differential phase contrast and dark field contrast. The enlarged area of the image with an arrow marking reveals that the proposed method provides clearer texture information and more detailed features.
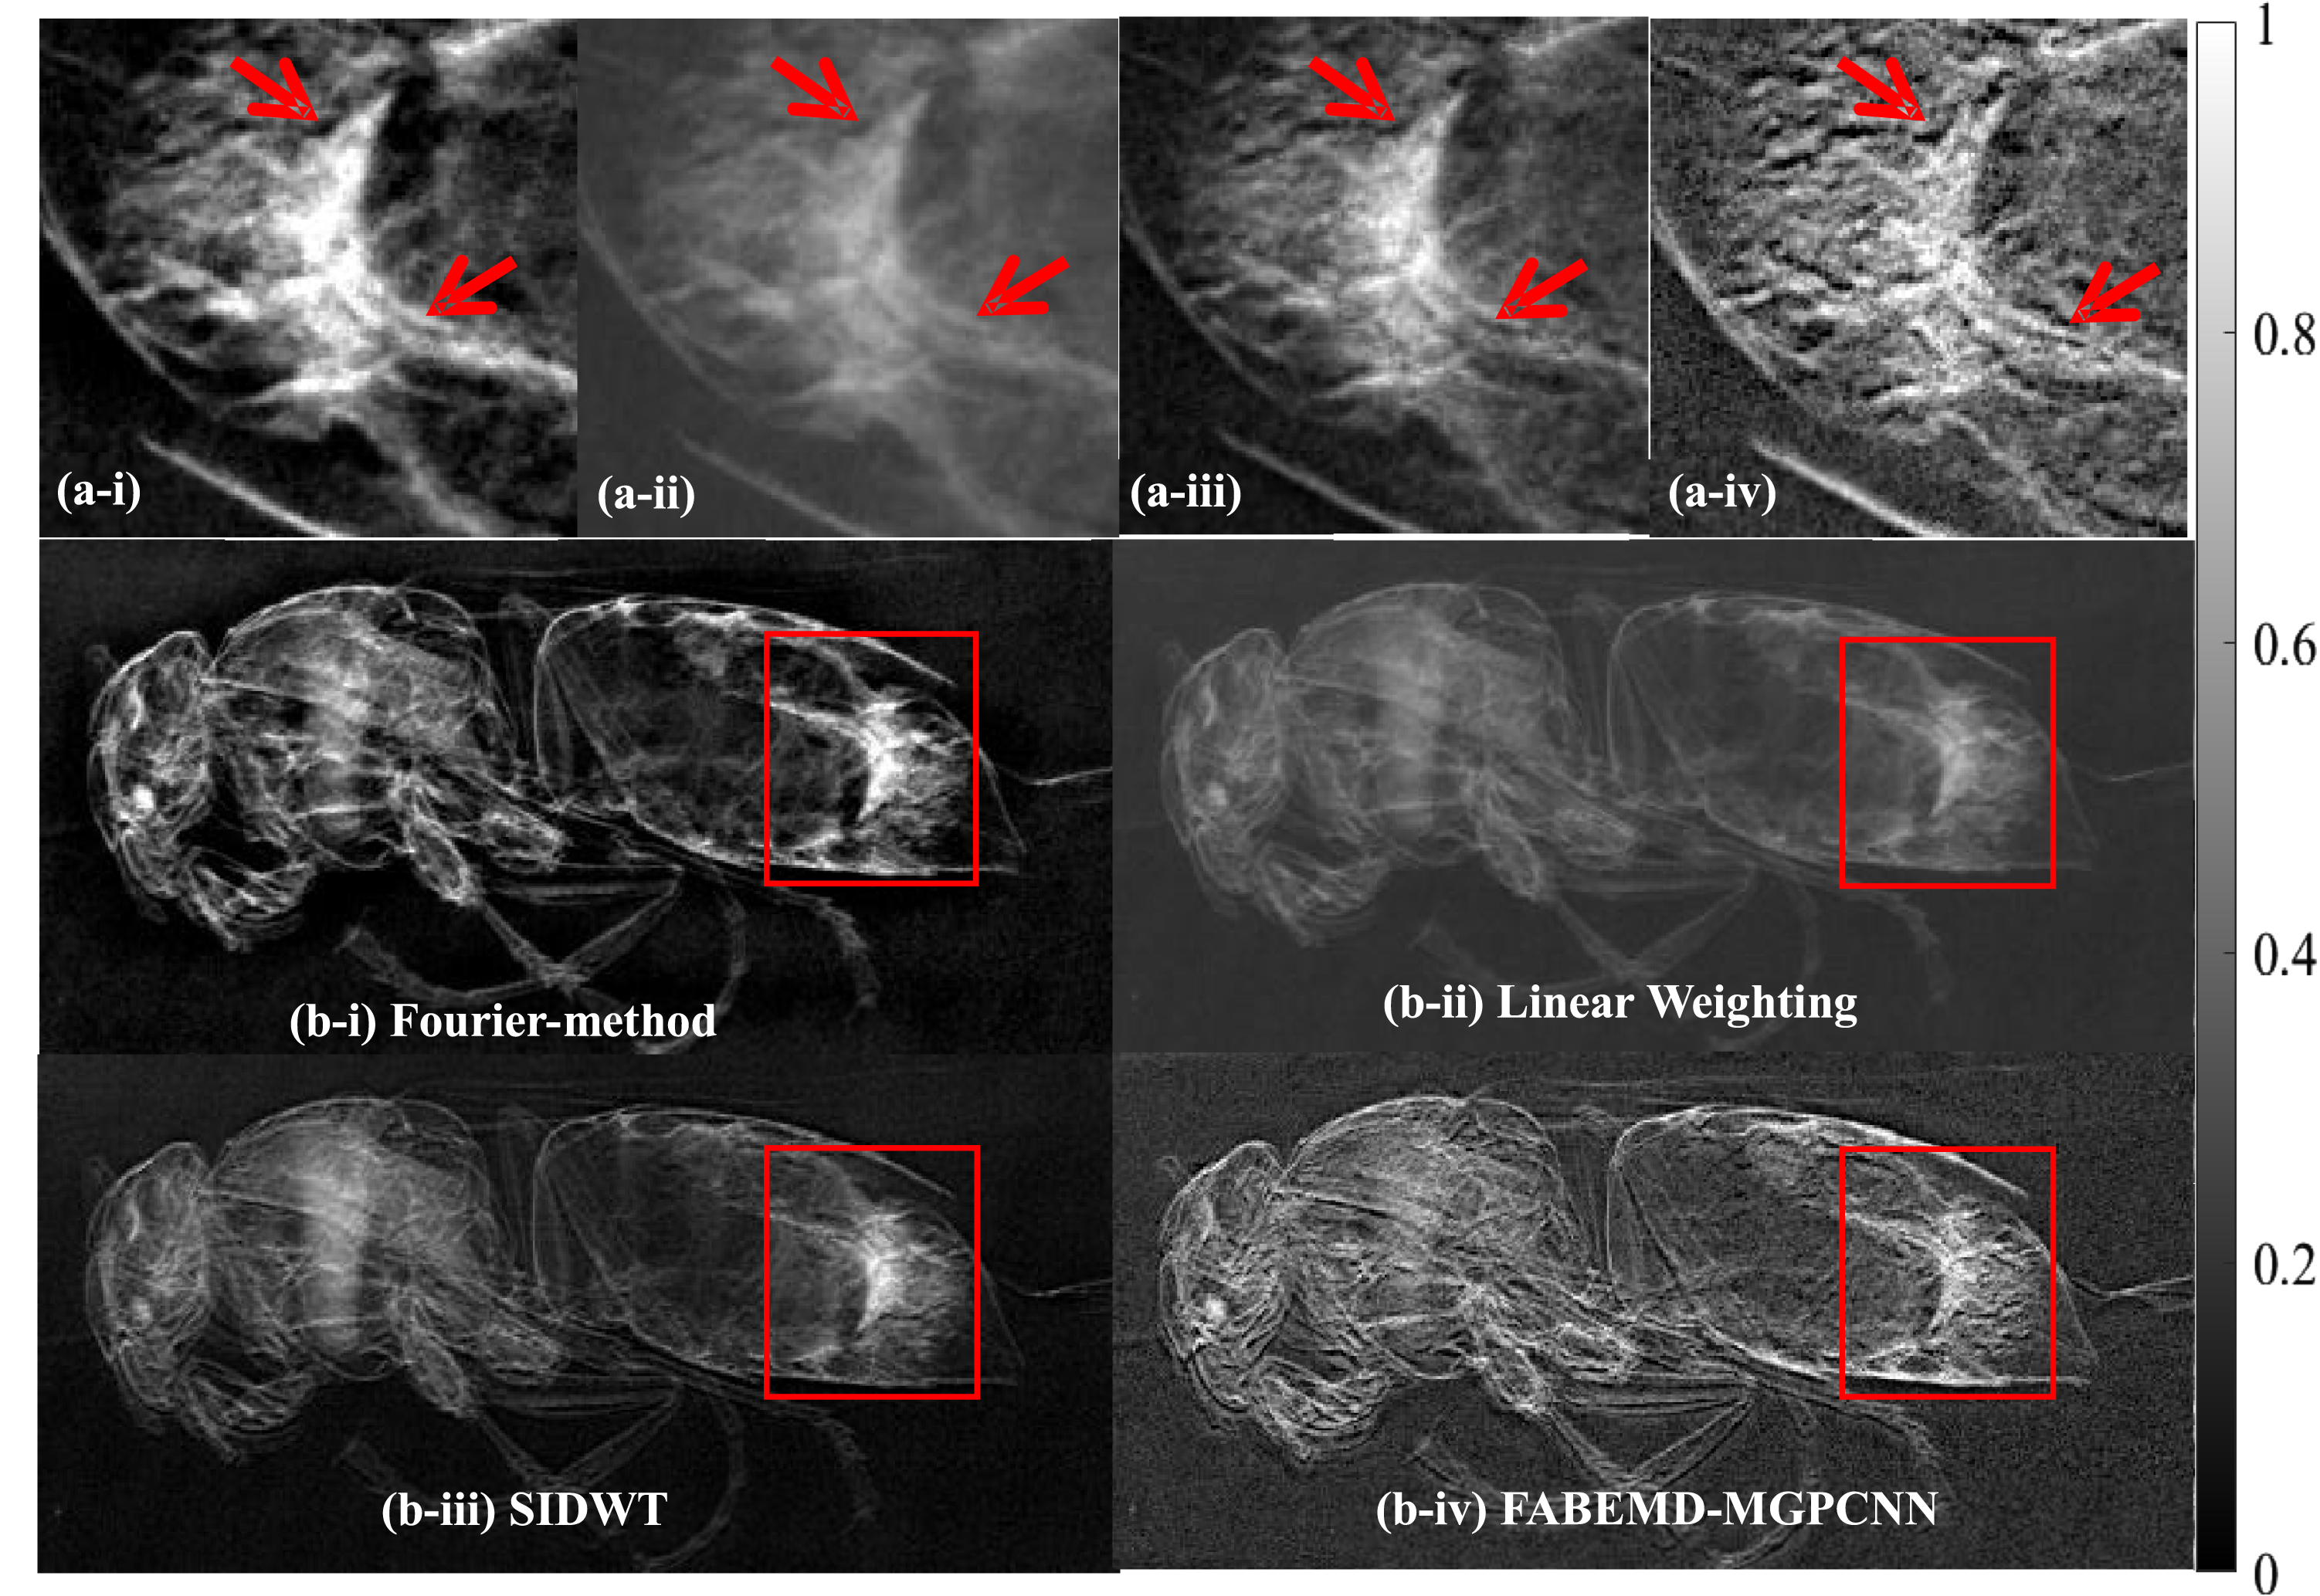
The results obtained by four fusion methods used in XPCI, while main difference has been marked in the figure. The enlarged areas in the right image are Fourier-method, Linear weighting, SIDWT and FABEMD-MGPCNN from top to bottom.
In summary, various image fusion methods were compared with the method proposed in this article using three fish samples. The fusion results obtained by different methods were evaluated using subjective and objective evaluation indicators. Among them, the MGFF method, the VSMWLS method and the δ-guided FABEMD-MGPCNN method achieved better results. Further experiments were conducted using bee and steleophaga plancyi samples, which demonstrated that the image fusion results obtained by the FABEMD-MGPCNN method have richer detail information and structural characteristics, while also exhibiting better contrast and signal-to-noise ratio.
In Section 3, the δ-guided FABEMD-MGPCNN method was found to be effective on the fusion of AC, DPC, and DFC images in 2D imaging XPCI technology. Compared to recent image fusion methods applied in the XPCI field, the proposed method in this paper has also demonstrated advantages in terms of metrics and visual quality. Furthermore, the image fusion method proposed in this paper also yields good results for x-ray 3D reconstruction. Currently, traditional X-ray absorption imaging has been applied in computed tomography (CT) in clinical medicine. However, CT imaging based on phase contrast and dark field contrast has not yet been widely employed. Although the application of XPCI technology in CT can be realized under laboratory conditions, it has not fully entered clinical surgery. To explore the potential application of this method, fish samples were utilized to perform the preliminary attempts of X-ray absorption, phase and dark field CT, and a three-dimensional view of the reconstruction results was obtained, as shown in Fig. 9. Unlike the application of this method in differential phase contrast images discussed earlier, the phase contrast in the 3D reconstruction results obtained by CT is the integral phase. The results demonstrate that the proposed method is also applicable for integrating phase contrast and can achieve good fusion images in XPCI-CT. The different contrast images reflect various characteristics of fish sample marked in the figure. For example, AC images reflect the smooth tissue and the bones of the fish. PC images reflect the teeth and muscle information with high contrast, while DFC images reflect the edge feature information inside the fish. The δ-guided FABEMD-MGPCNN method is used to characterize the feature fusion of the CT reconstruction results. Figure 10 presents that the fusion images involve the characteristic information of the original images such as teeth, bones and muscles as marked in the chart. The expected fusion of CT images highlights the potential application prospects of XPCI technology and the δ-guided FABEMD-MGPCNN image fusion approach in the field of medicine. These methods can aid doctors in acquiring additional pathological characteristics of patients while focusing on these features in a fusion image, thus providing convenience and possibilities for auxiliary diagnosis.
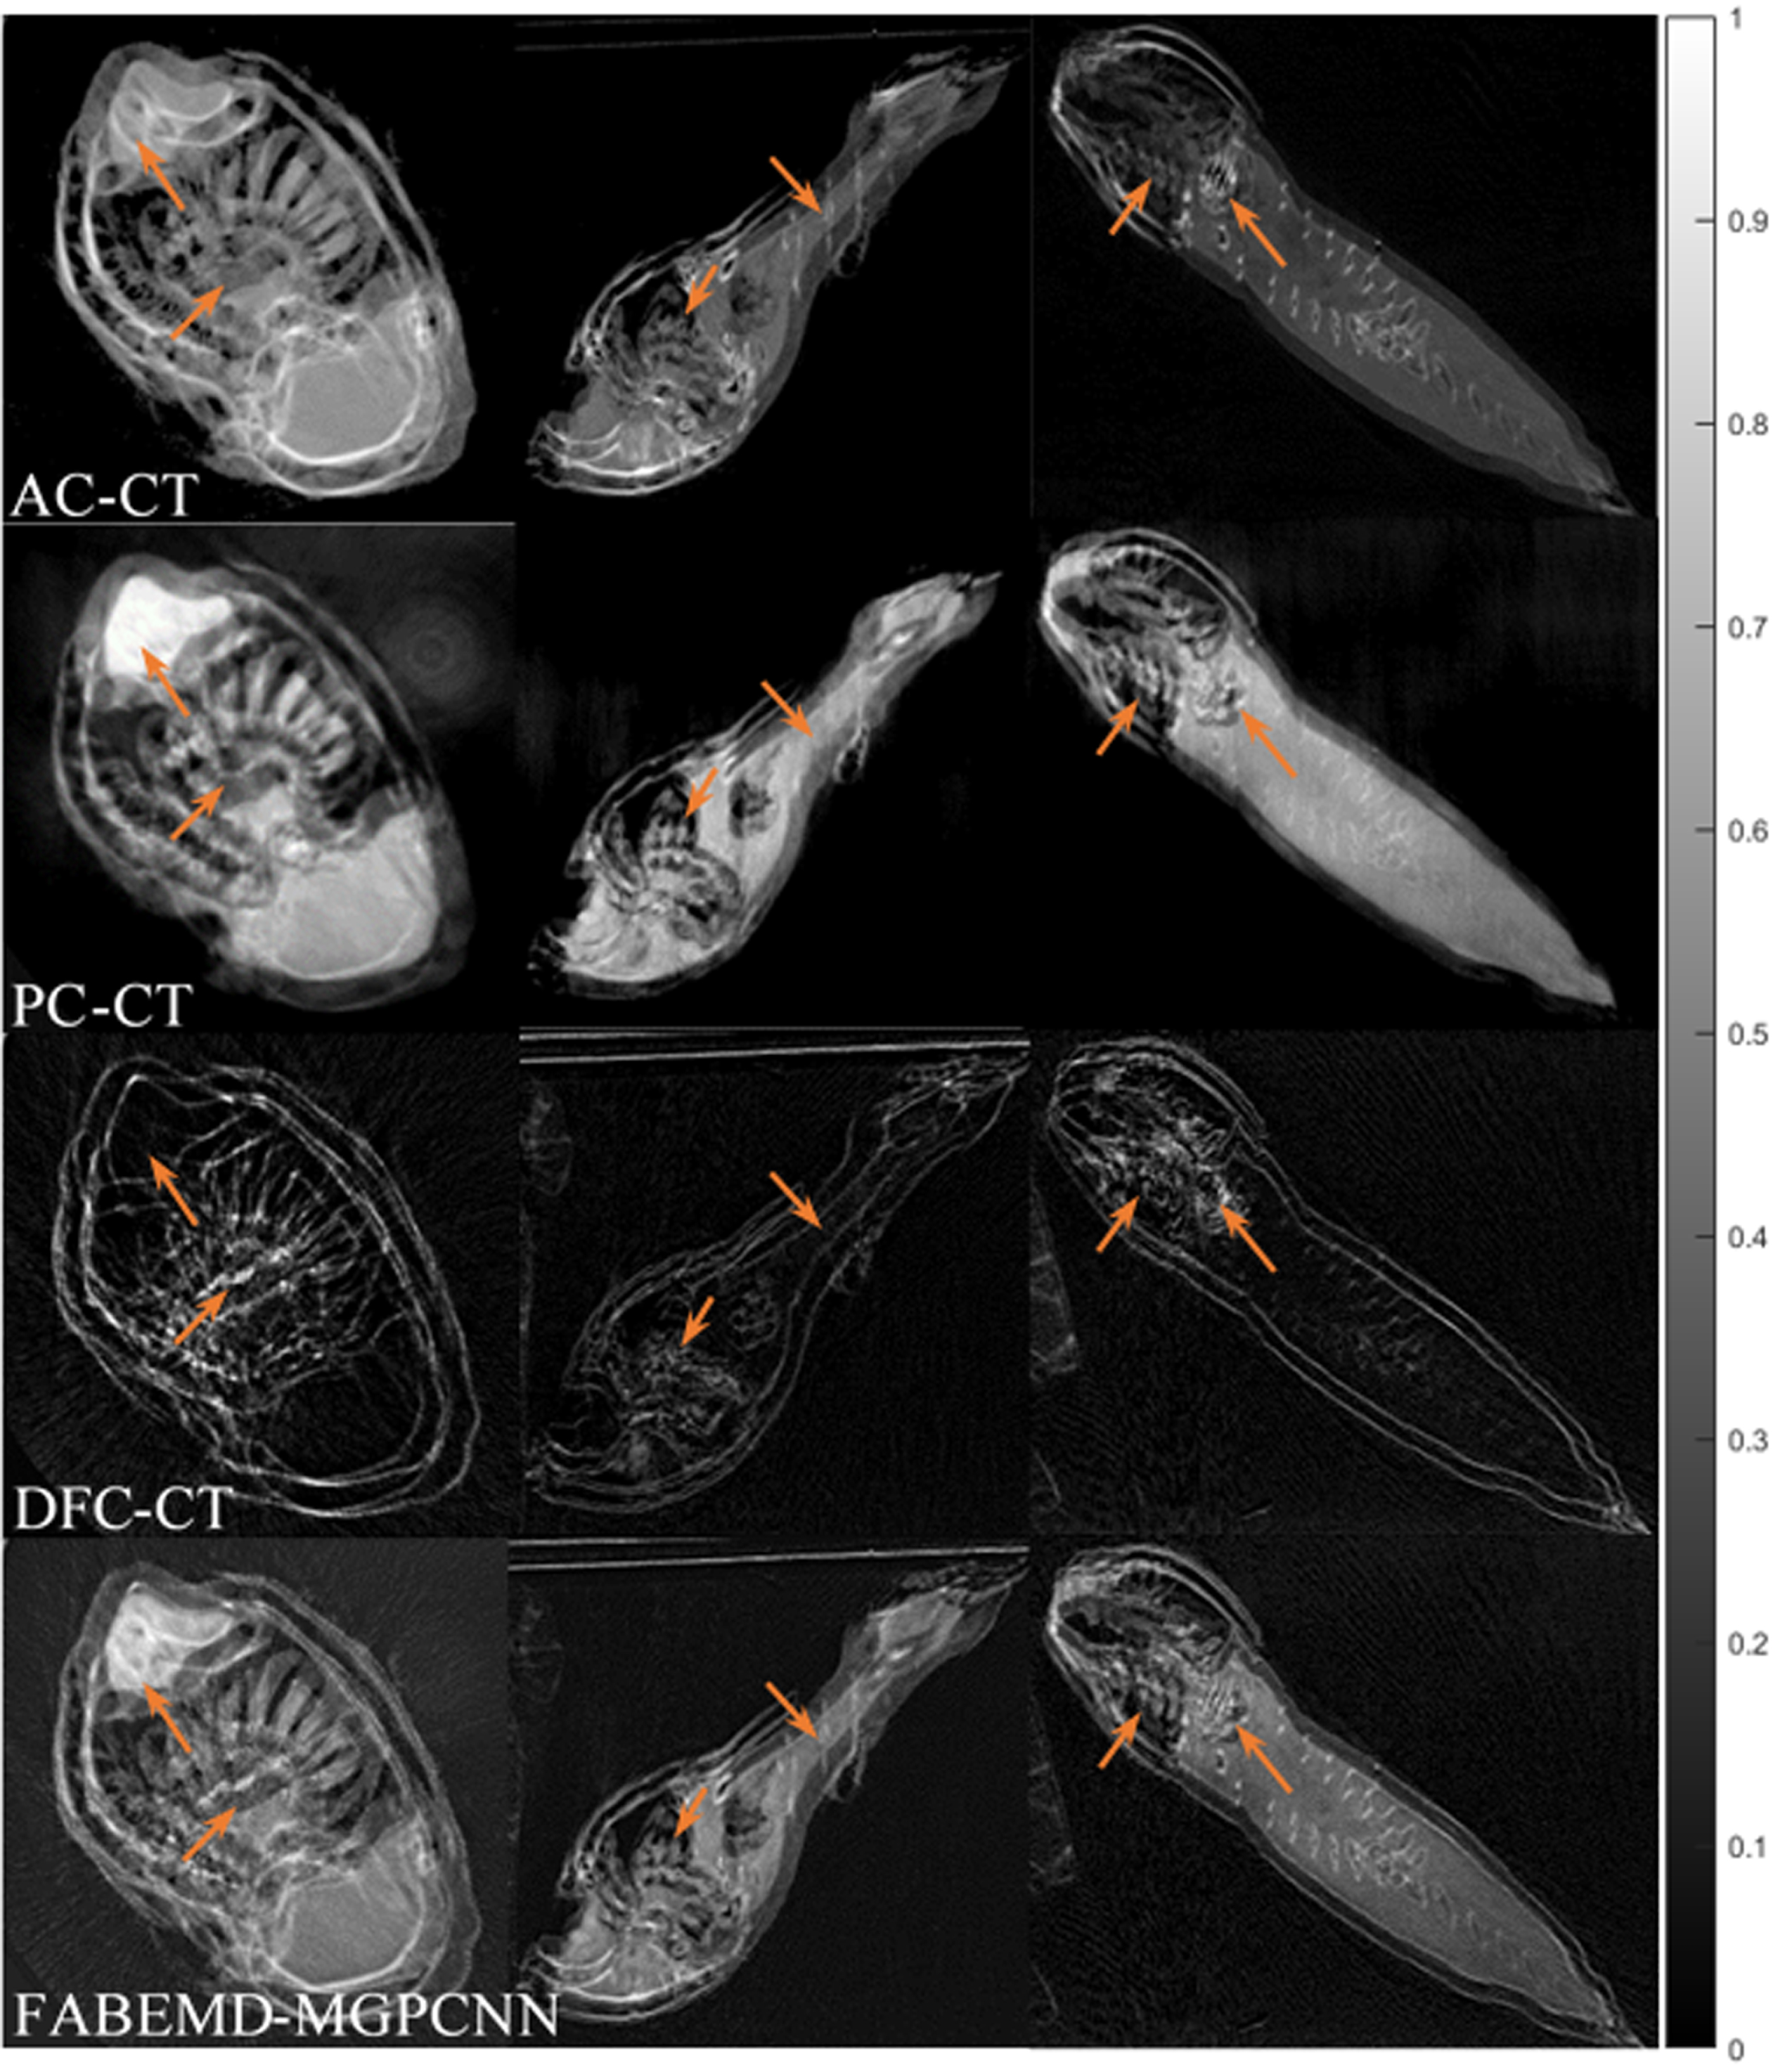
The three-dimensional view of AC-CT, PC-CT, DFC-CT reconstructions and FABEMD-MGPCNN fusion results of fish sample, while main characteristics have been marked in the figure.
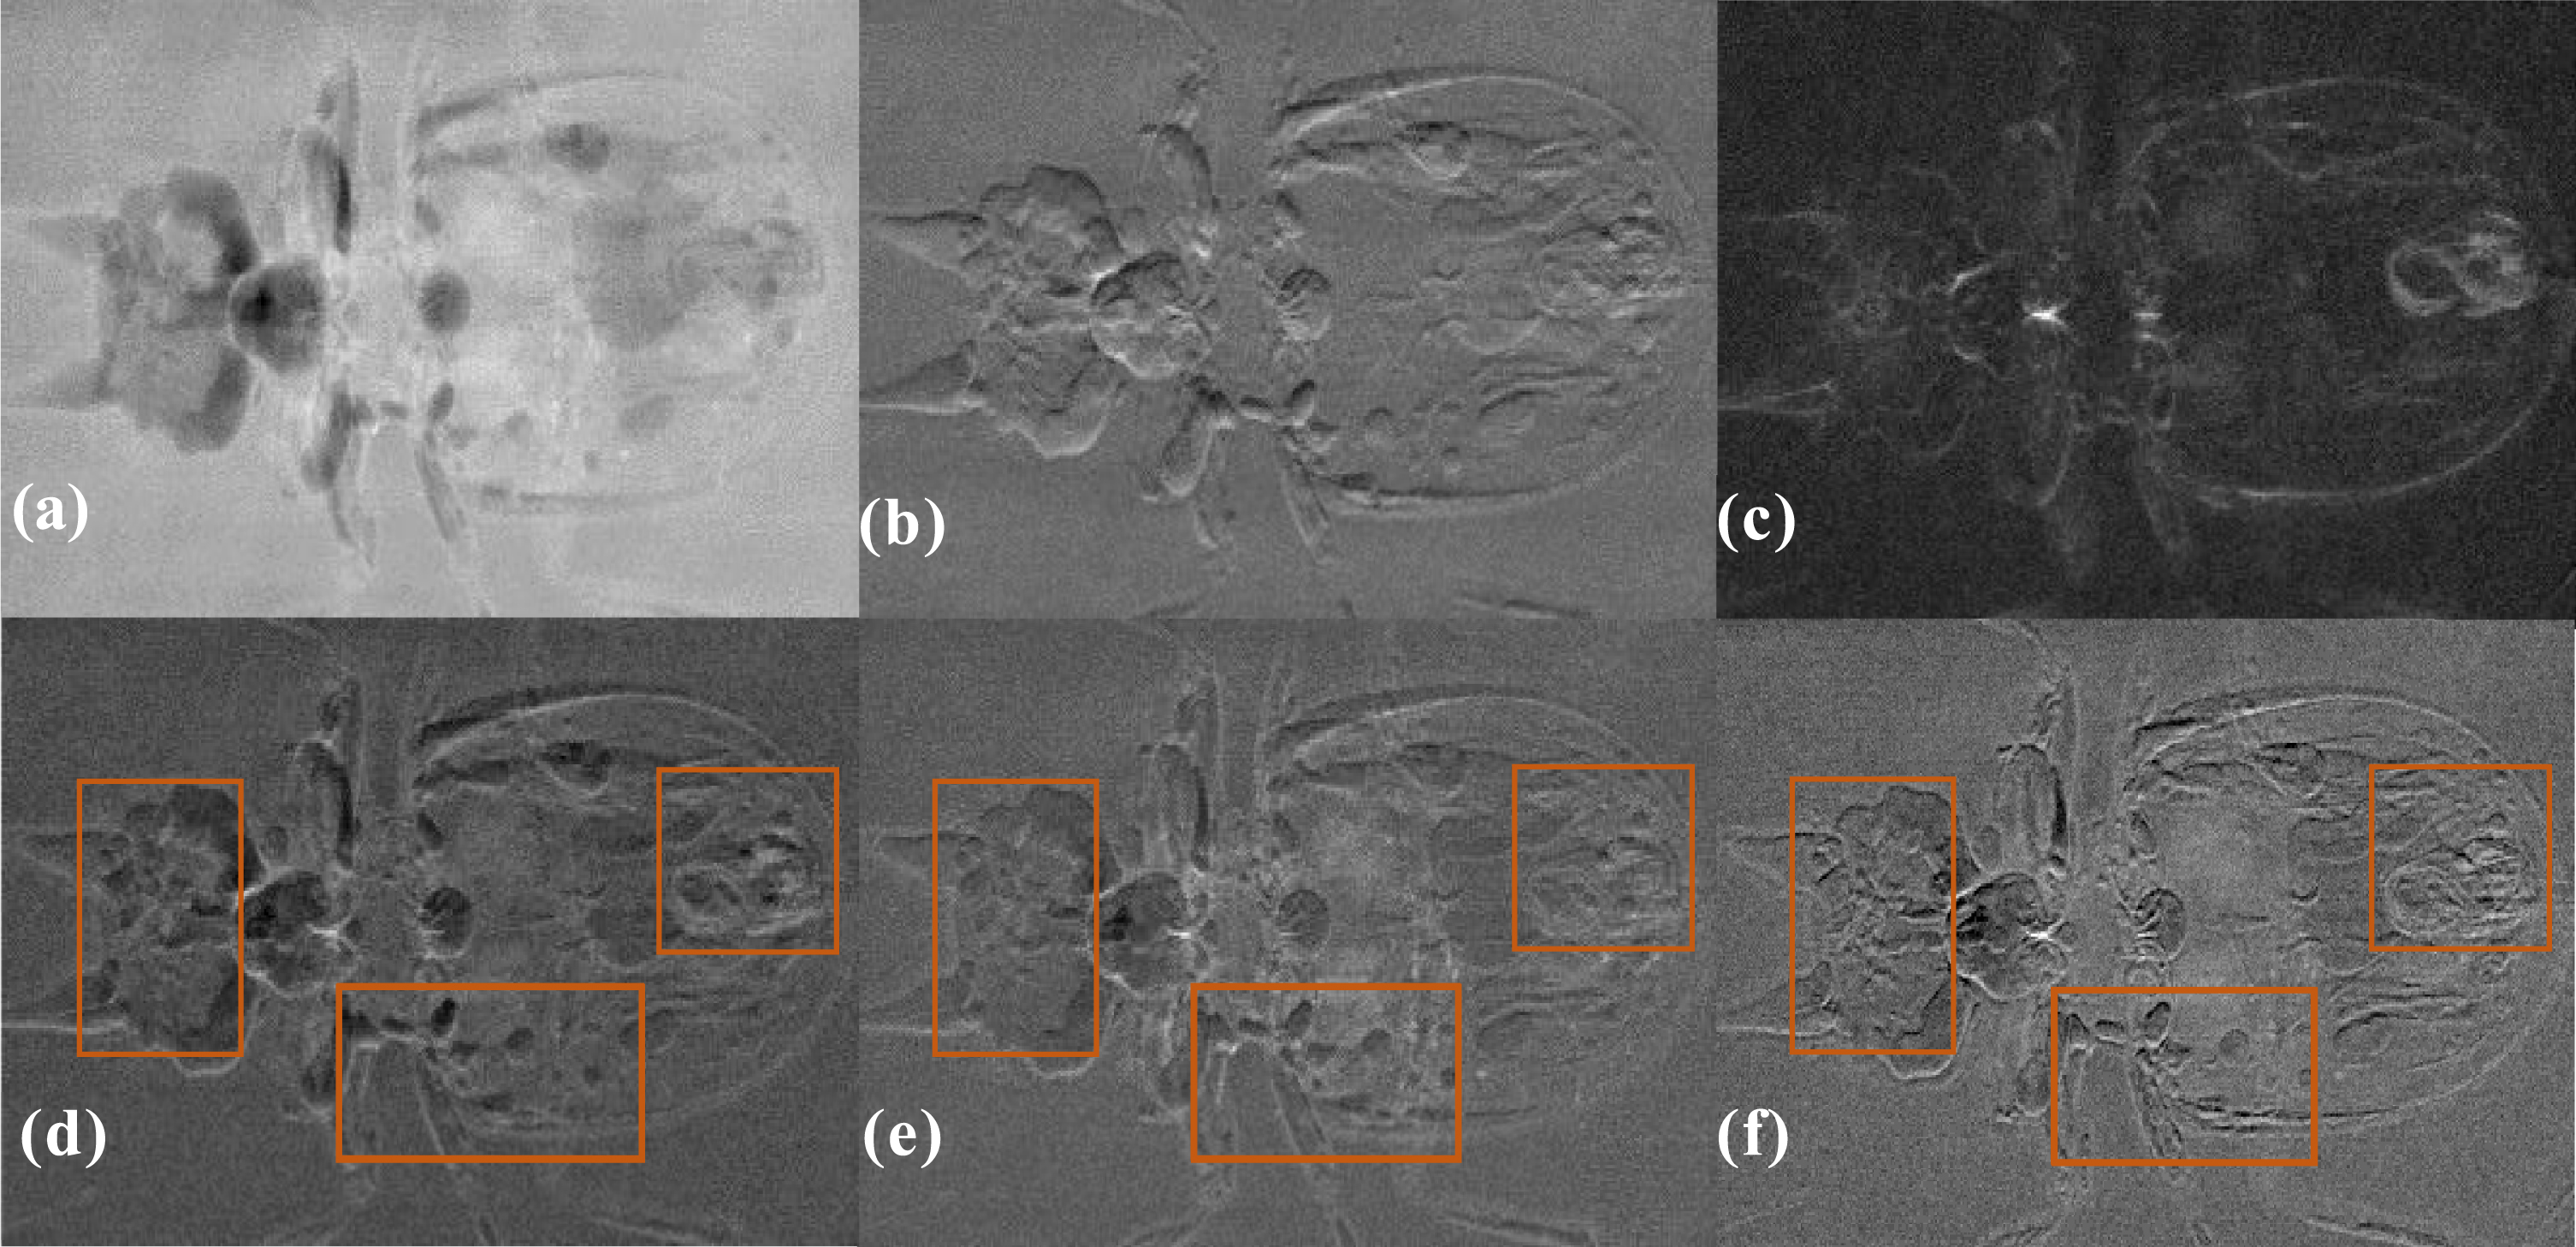
The impact of changing the number of decomposition layers, the number of iterations in each layer, and the selection of window size on FABEMD method. (i) 1st layer BIMF, (ii) final layer BIMF, (iii) residual image. (a) layers = 5, iterations = 3, type = low size, (b) layers = 3, iterations = 3, type = low size, (c) layers = 7, iterations = 3, type = low size, (d) layers = 5, iterations = 1, type = low size, (e) layers = 5, iterations = 10, type = low size, (f) layers = 5, iterations = 3, type = high size.
Nevertheless, there are some limitations when the δ-guided FABEMD-MGPCNN method used in practical application. For different fusion targets, it is necessary to choose the number of decomposition layers and corresponding iteration times during the mode decomposition process. Figure 10 shows the impact of selecting different parameters on the image decomposition process. In Fig. 10(i–iii) represent the first layer of BIMFs, the last layer of BIMFs, and the residual image. The difference between (a) and (c) lies in the number of decomposition layers, which are 5, 3, and 7 layers, respectively. A higher number of decomposition layers results in closer spatial frequency components of different images in the fusion process. Meanwhile, when there is uneven illumination in the original image, increasing the number of decomposition layers can separate the low-frequency illumination distribution into residual image. However, increasing the number of decomposition layers also greatly raises the computational time. The number of iterations for each layer of (a), (d), and (e) is 3, 1, and 10, with the remaining indicators consistent. In the process of BEMD method, the objective function should be set in the decomposition of each layer in principle. However, the time required is too long in the actual operation process and the number of iterations for each layer is directly set. When the number of iterations is set too high, the decomposed image will produce ripples shown in (e). The window size of the upper and lower pole planes used for reconstructing the image in (a) is the minimum, while (f) is the maximum. Choosing the maximum value as the window size will retain more detailed information in the residual image, which is not suitable for the process of image fusion.
This paper proposes a novel image fusion method based on FABEMD to address the requirements of X-ray phase contrast imaging. FABEMD, a data-driven function, is used to extract image features from decomposed BIMFs components. Furthermore, it effectively reduces noise, mitigates the impact of uneven illumination, and enhances image detail quality. The AC, DPC and DFC images are decomposed using FABEMD and image features are extracted from BIMFs and residual components. High-frequency and low-frequency information are fused using the MGPCNN method and the EA strategy, respectively. Comparative evaluations against other fusion methods demonstrate that the proposed approach captures more image features and preserves finer details during the fusion process. In conclusion, the δ-guided FABEMD-MGPCNN exhibits significant improvements over traditional fusion methods in both subjective and objective evaluation criteria. However, there are still areas where further enhancements are needed, such as manually controlling the number of decompositions for different images to achieve optimal quality and requiring a longer period of time in decomposition process.
Funding
This work was funded by the National Natural Science Foundation of China (62205287, 62125504, 61827825 and 61735017), Major Program of the Natural Science Foundation of Zhejiang Province (LD21F050002); Key Research and Development Program of Zhejiang Province (2020C01116), Zhejiang Lab (2020MC0AE01), Zhejiang Provincial Ten Thousand Plan for Young Top Talents (2020R52001).