
Abstract
In the X-ray single-grating imaging system, the acquisition of frequency information is the key step of phase-contrast and scattering information recovery. In the process of information extraction, it is easy to lead to the degradation of imaging quality due to the Moire Artifact, thus limiting the development and application of X-ray single-grating imaging system. In order to address the above problems, in this article, based on the theoretical analysis of the generation principle of Moire Artifact in imaging system, the advantages and disadvantages of grating rotation method are analyzed, and a method of suppressing Moire artifacts by adjusting grating projection frequency is proposed. The experimental results show that the method proposed here can suppress the Moire noise in the background noise, resulting in a reduction of more than 50% in the standard deviation of the background noise. High quality phase-contrast and scattering images are obtained experimentally, which is of great value to the development of X-ray single-grating imaging technology.
Introduction
The absorption image, phase-contrast image, and scattering image of the object can be simultaneously obtained through the grating-based X-ray interferometer [1, 2], which has broad applications in basic physics, chemistry, material science, medical diagnosis and nondestructive detection imaging [3, 4]. In 2006, Talbot-Lau interferometer was proposed by Pfeiffer et al. [5, 6], the phase-contrast information and absorption information have been obtained with a large focal spot X-ray source. Since then, grating-based X-ray imaging technology has gradually become a research hotspot in the field of X-ray phase-contrast imaging. Although the new method proposed by Pfeiffer et al. has shown broad application prospects, it is difficult to be popularized due to the difficulty in producing X-ray grating and the complexity of imaging systems. Meanwhile, the grating-based X-ray interferometer usually uses phase stepping to extract the phase and scattering information of the object [7, 8], which requires the object to undergo long-term irradiation during imaging, and the high radiation dose is unacceptable in the clinical application.
In 2009, Han Wen et al. successfully extracted the phase and scattering information of the object by using the Fourier transform method through a single-grating system [9]. Compared with the traditional Talbot-Lau interferometer imaging method, the structure of the imaging system is simple, and the X-ray radiation dose is greatly reduced (only a single exposure is required), showing a huge advantage. However, due to the phase-contrast and dark-field information extracted by Fourier transform, part of high-frequency information will be lost, which will lead to the decrease of resolution, and the introduction of Moire artifact will cause the decrease of image signal-to-noise ratio [10, 11]. Optimizing the extraction of phase-contrast and dark-field information will reduce the influence of Moire artifacts and improve the signal-to-noise ratio. This is the goal of conducting research with the single-grating X-ray imaging system. In 2018, Lee HW et al. used the rotating grating method to effectively suppress the Moire artifacts [12], and achieved good results in the experiment. Unfortunately, they did not explain it in theory.
In this article, through studying the formation mechanism of Moire artifacts in a single-grating imaging system, the characteristics of the Moire fringe formation are theoretically deduced, the variation of the Moire artifacts with the system parameters is given, and the method of suppressing the Moire artifact is proposed. This approach can reduce the artifacts in phase-contrast and dark-field images, and improve the accuracy of signal recovery. This research is important for the development of single-grating X-ray imaging technology.
Single-grating X-ray imaging systems
A single-grating X-ray imaging system consists of an X-ray source, an absorption grating and a detector, as shown in Fig. 1. The object is located between the grating and the source, and the X-rays emitted from the X-ray source are radiated to the object. The distance from the X-ray source to the object is DSO, the distance from the object to the grating is DOG, and the distance from the grating to the detector is DGD.
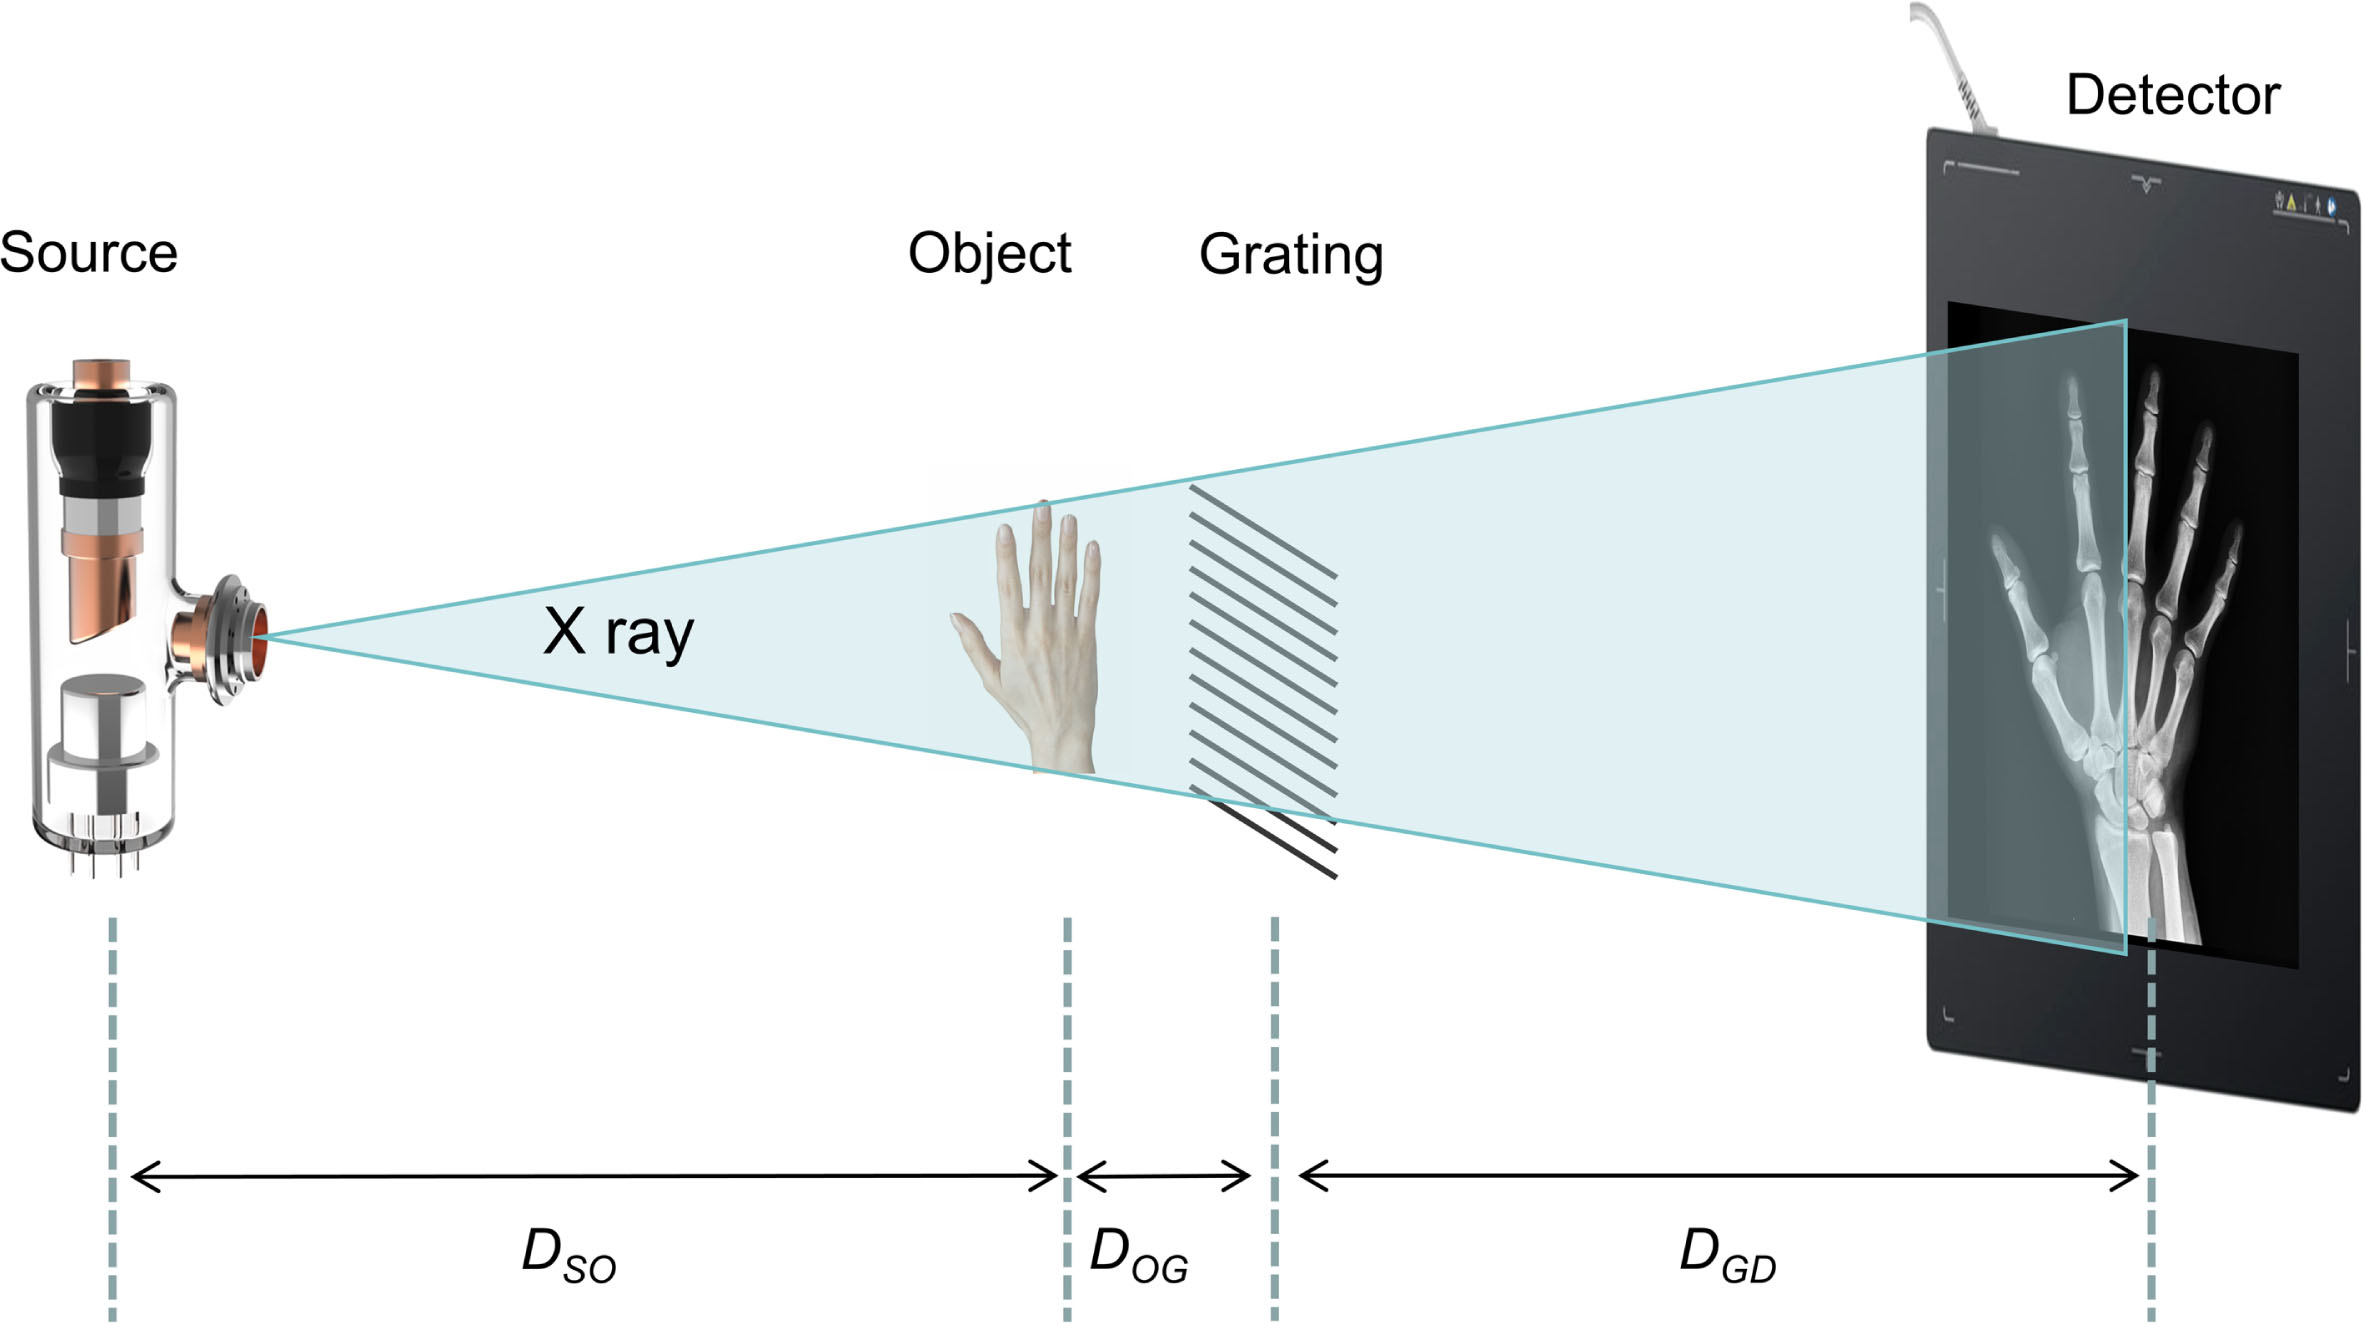
Schematic of single-grating X-ray imaging system.
Due to the difference in the refractive index of the object, the wave front of the X-rays passing through the object will deform, and the transmitted X-rays carry information about the internal structure of the object. In the X-ray single-grating imaging system, the absorption, scattering and phase-contrast information of the sample can be obtained simultaneously by Fourier transform. The grating in the X-ray grating imaging system acts as a spatial frequency modulator, so the phase information and scattering information of the sample can be extracted in the frequency domain by Fourier transform, and then the phase-contrast image and scattering image of the object can be recovered [13].
The information extraction process is as follows: firstly, the background image Ig without object is collected, and then the image Iog after adding object is collected. Secondly, Fourier transform is performed on the two original images to obtain the background spectrum and the spectrum with objects respectively. Then, the band-pass filter is used to extract the zero order and positive first order spectrum regions of the two spectrograms. Finally, the inverse Fourier transform is performed on the extracted spectrum to obtain the zero-order spectrum image
Where I0,og and I1,og represent the inverse Fourier transform (IFT) of the zero-order spectrum and the positive first-order spectrum of the object image Iog, respectively. I0,g and I1,g represent the inverse Fourier transform (IFT) of the zero-order spectrum and the positive first-order spectrum of the background image Ig, respectively. The extraction of phase and scattering information is represented by the following:
The phase image and the scattering image can be obtained by taking the angle ∠I∇ and the amplitude |I∇| respectively. The specific phase recovery process is shown in Fig. 2, in which
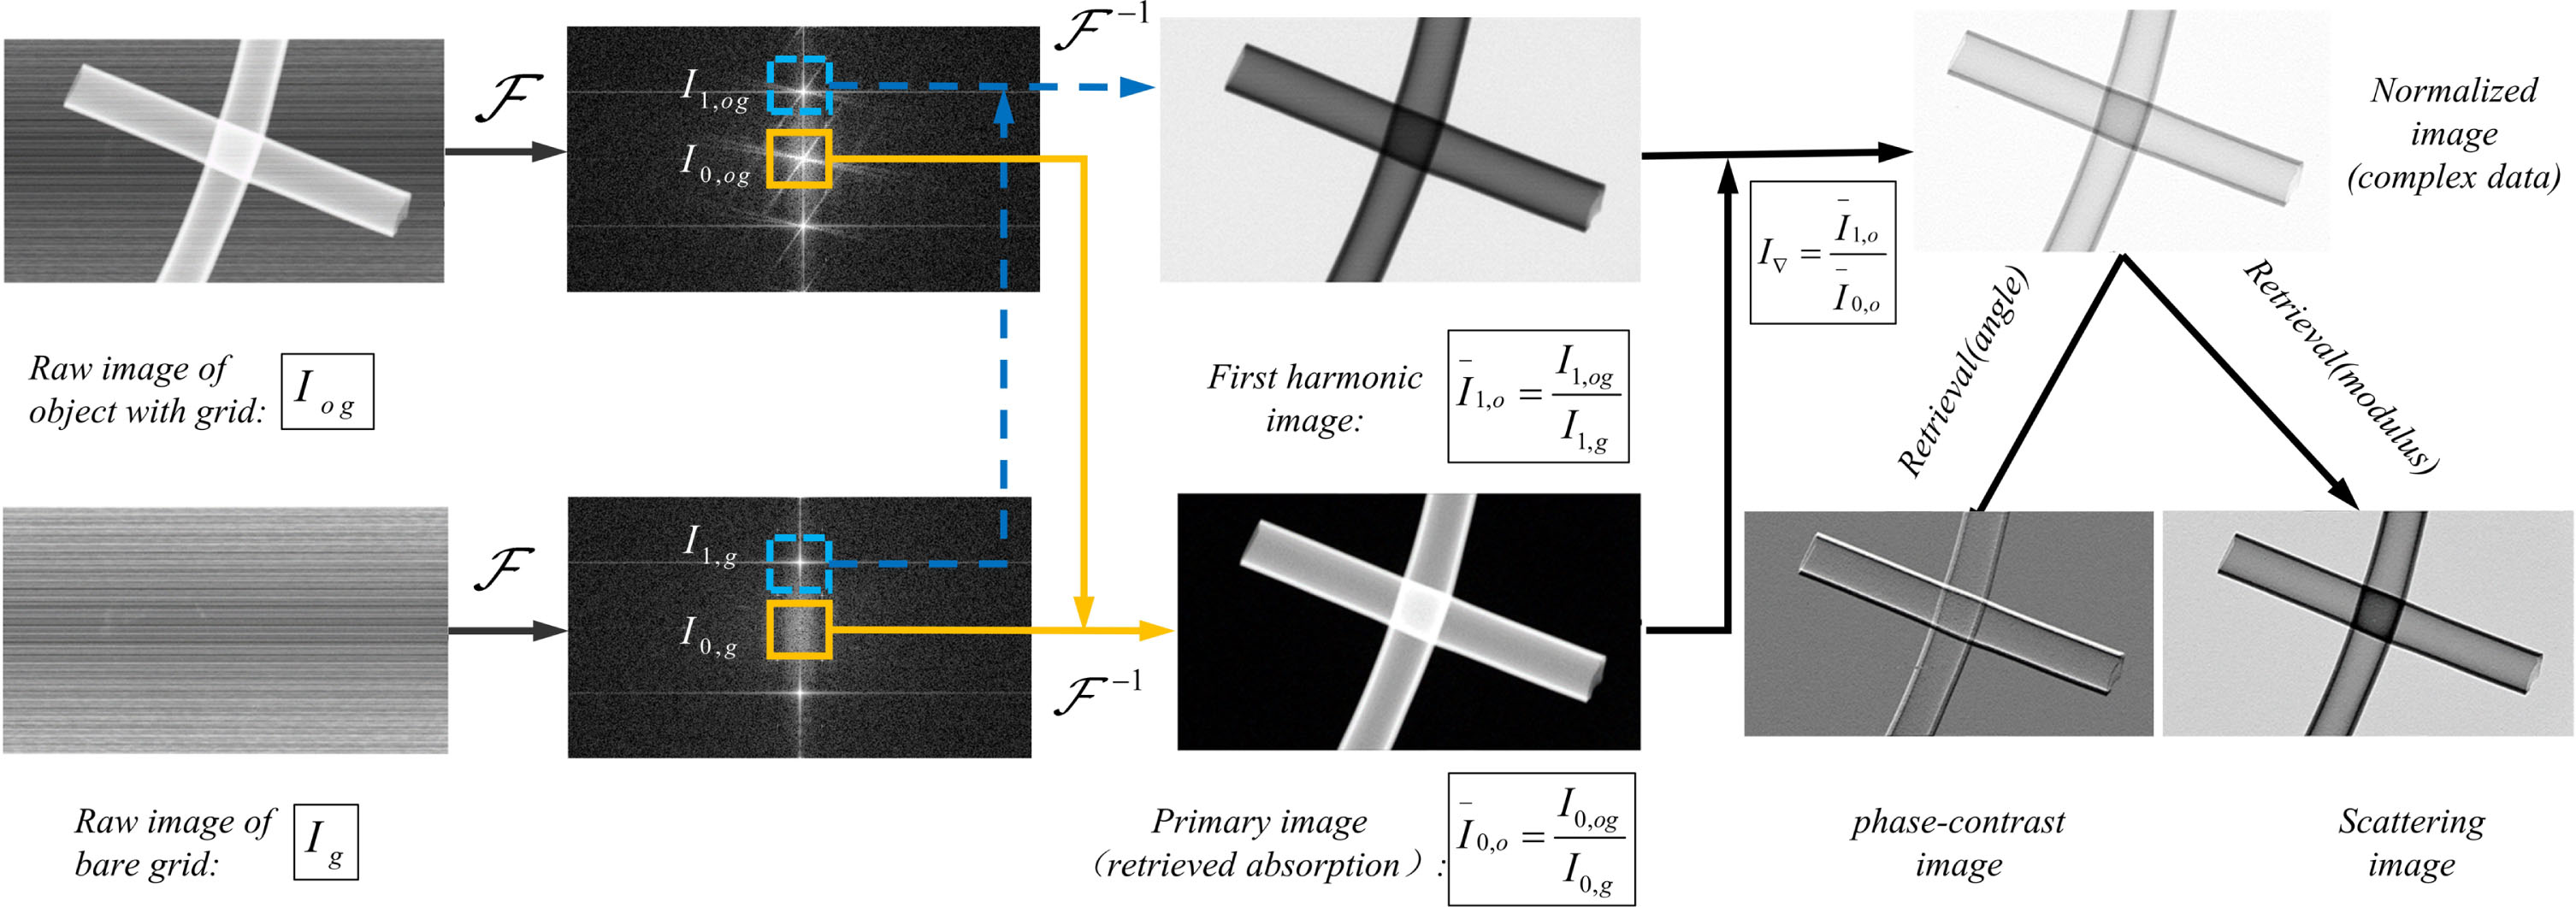
Flow chart of phase-contrast and scattering information extraction.
In the above-mentioned single-grating imaging method, the phase information and dark field information of the object need to be obtained from the frequency domain. Therefore, accurate and effective separation and extraction of the spectrum at all orders is essential. In practice, the extraction of high frequency part often carries the spectrum information of Moire artifacts, which makes the phase image of the final recovery appear serious Moire fringe, which reduces the imaging quality of the image. H.W. Lee et al. effectively separated the Moire fringes artifacts in the image by rotating the grating, thereby improving the image quality [14]. However, it did not give a theoretical proof of its suppression of the Moire artifact. Based on the principle of Moire artifact, the change law of Moire artifact is analyzed in this article. Combined with the structural characteristics of the single-grating imaging system, the feasibility and advantages and disadvantages of the rotating grating scheme are analyzed theoretically. On this basis, a method to suppress the artifacts noise is proposed, and a high quality phase-contrast image is obtained through experimental research.
Moire artifact is a common interference noise in digital imaging technology. For digital X-ray imaging technology, the diffraction phenomenon is not obvious due to the short wavelength of X-ray, so the formation of Moire artifact can be explained by shading principle [15, 16]: The grating projection pattern and detector pixels have a periodic structure, when the projection pattern is sampled by the detector, due to the mutual occlusion of the opaque parts, the collected pattern will appear as light and dark stripes, which itself is the Moire artifact [17]. As shown in Fig. 3 (a), where a and p represent the pixel period of the detector and the grating projection respectively, θ is the angle between the grating and the detector, and α and dm are the inclination angle and period of the Moire fringe, respectively.
The calculation can be divided into the following two cases:
ding172 When the detector period is less than the grating projection period, that is a < p.

Formation of Moire fringe. (a) a < p; (b) a≥p.
According to the geometric relationship between the Moire fringe and the grating, the inclination angle α and cycle dm of Moire fringe can be obtained as follows:
Where n is an integer that satisfies the following formula:
Therefore, the relationship between the frequencies of each part is:
Where u m , u s and u g are the frequency of the Moire fringes, the sampling frequency of the detector, and the frequency of the grating projection, respectively.
ding173 When the detector period is greater than or equal to the projection period of the grating, that is a ⩾ p, the expressions of inclination, periodicity and frequency of Moire fringe are as follows:
Where l is an integer that satisfies the following formula:
According to formula (3) and (6), the change curves of Moire fringe inclination angle α with the angle θ can be obtained, as shown in Fig. 4, where the detector period is 75μm, and the projection period of grating is 260μm, 240μm and 230μm respectively. It can be seen from the graph that the inclination of the Moire fringe will change with the angle of the grating, which is not smooth. It will have a jump at a certain position, and then decrease with the increase of the absolute value of the angle, and then jump. When the absolute angle of grating angle is small, the inclination angle of Moire fringe is much larger than that of the grating itself due to the change of raster angle, and then the inclination angle of Moire fringe will reach its peak value. Within this range, Moire fringe will not only have periodic amplification, but also angle magnification.
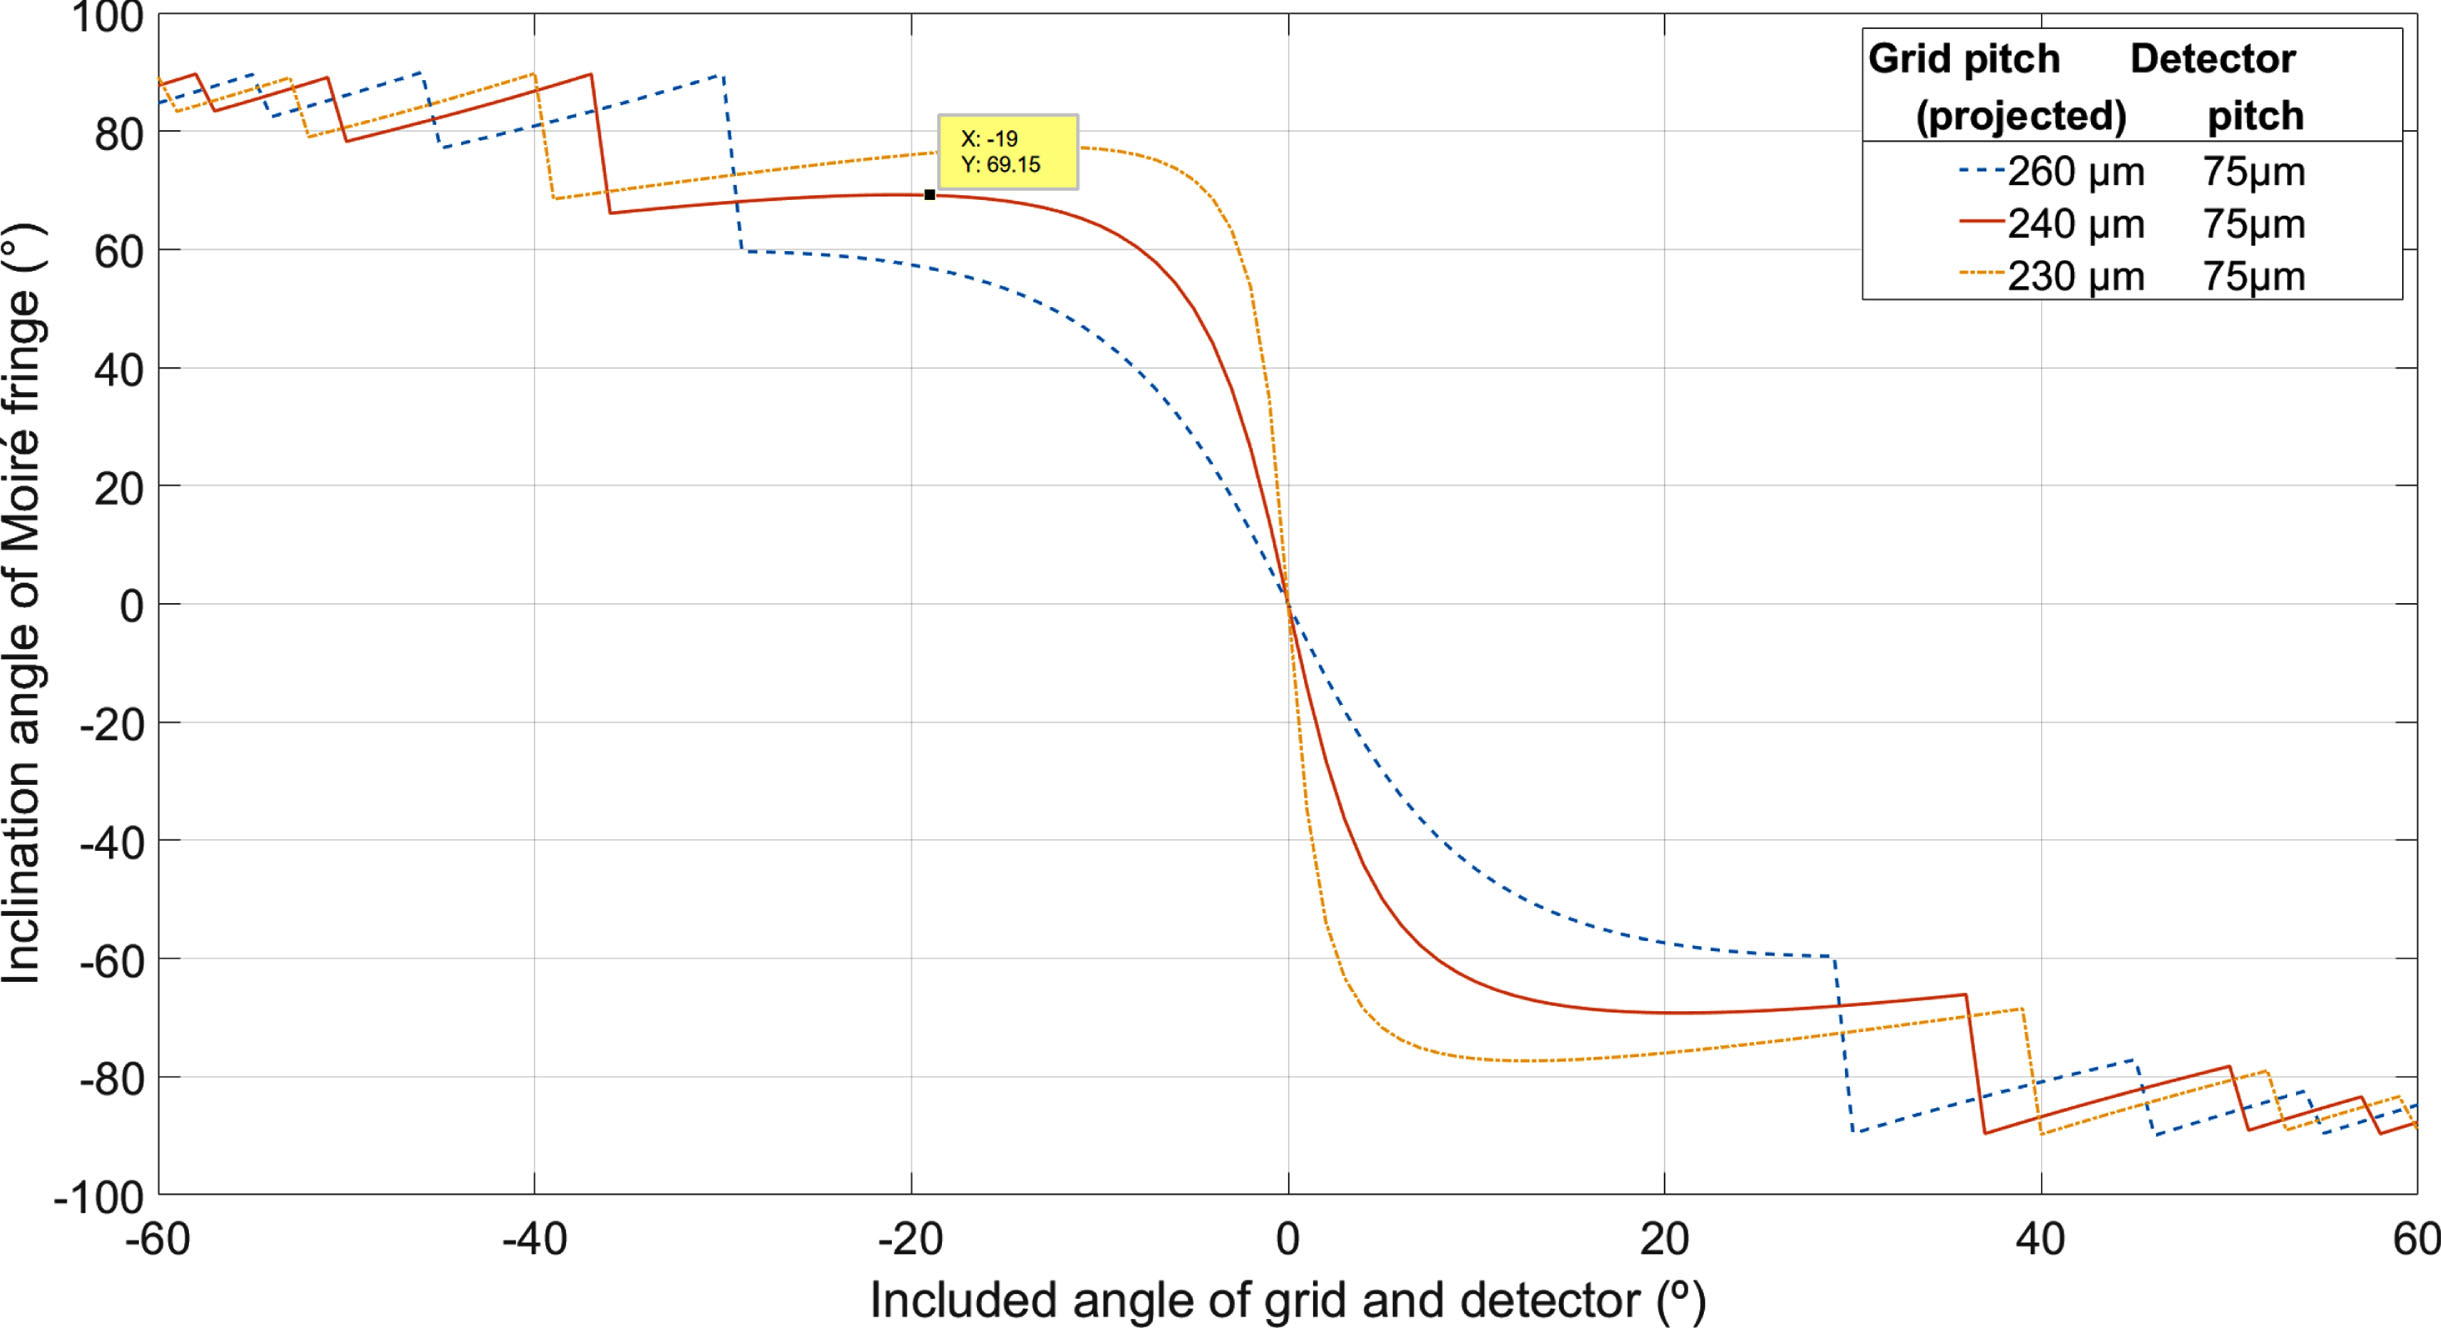
Inclination angle of Moire fringe versus included angle of grating.
In polar coordinates, according to the rotation invariance of the two-dimensional Fourier transform, the image in the spatial domain is rotated by a certain angle θ0, and the spectrum image in the corresponding Fourier transform spectrum is rotated at the same angle θ0. Since the inclination of the Moire artifact increases with the grating angle, and the two directions are not consistent, the artifact spectrum will gradually separate from the object spectrum as the grating angle increases. Therefore, we can separate the target spectrum from the Moire artifact spectrum by rotating the absorption grating, so as to reduce the image noise and improve the image quality. For example, in the marked point position (X: –19, Y: 69.15) in Fig. 4, the inclination angle of the Moire fringe reaches a stage peak. If the artifact spectrum in the frequency domain is removed at this time, the removal effect of Moire artifacts is better.
Consider that when the angle θ between the grating projection and the detector grating is equal to 0°, then the Moire fringe direction is either parallel or perpendicular to the grating direction, and the period of the Moire fringe dm⟶∞. Therefore, we consider whether this feature can be used to eliminate the effect of Moire fringe.
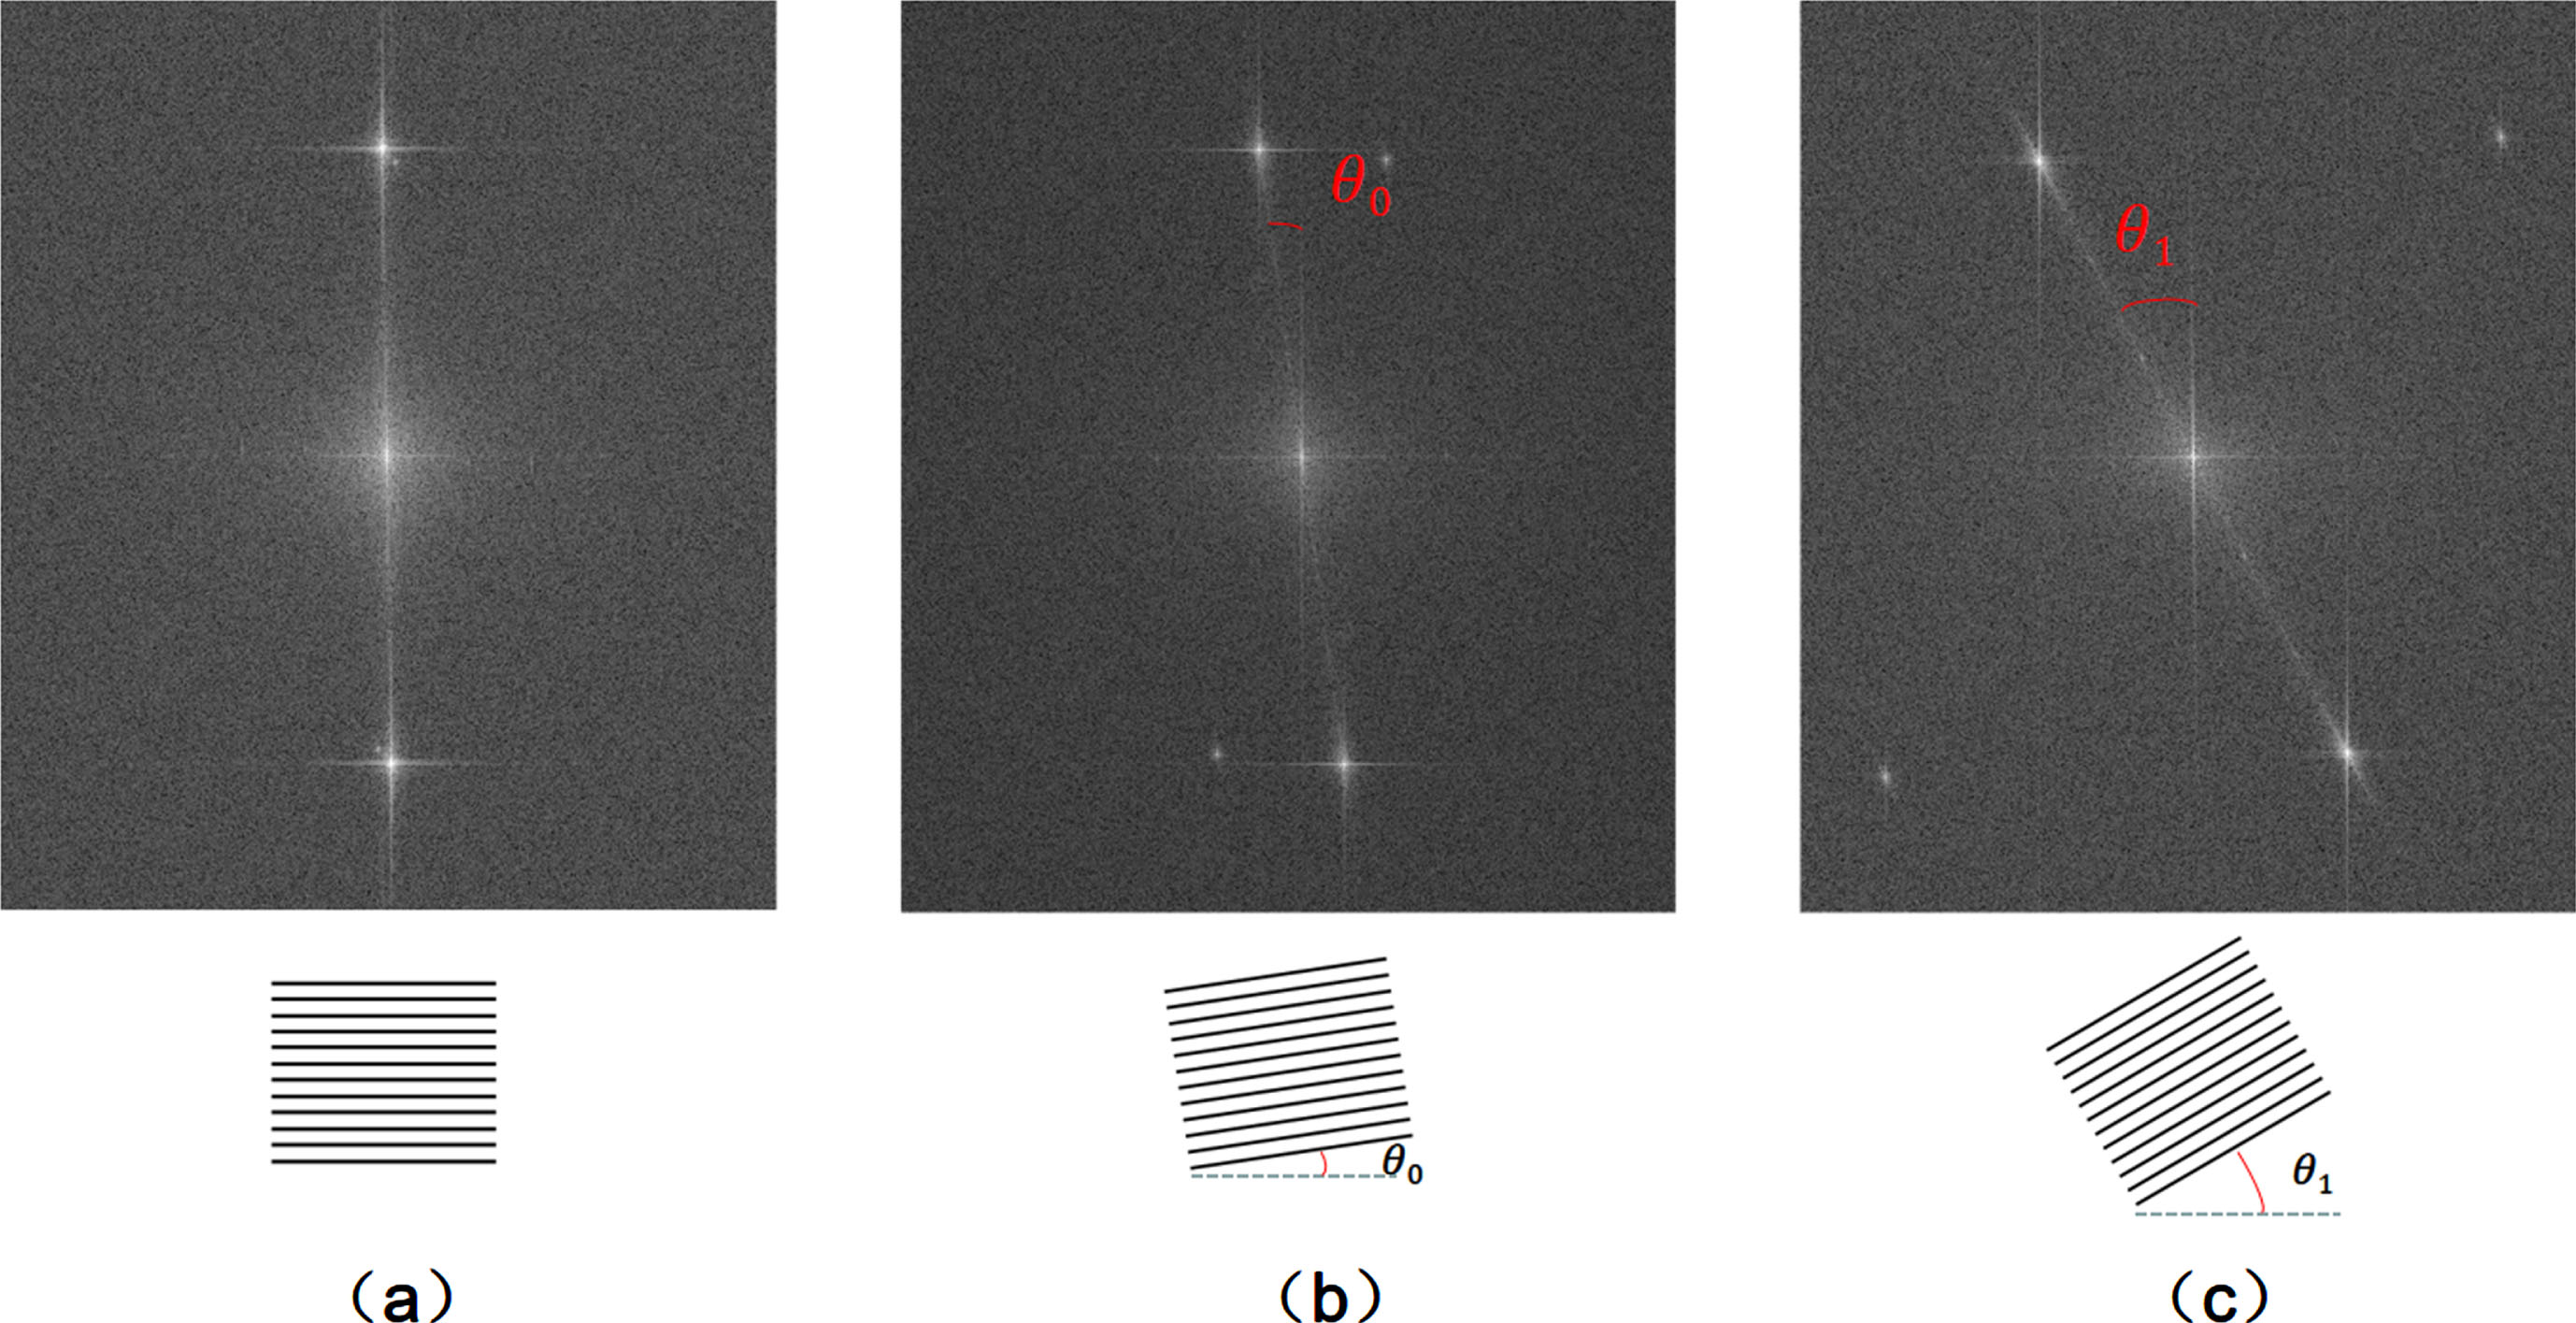
The corresponding relationship between the spectrum of grating images and the rotation angle of grating.
Figure 6 shows the relationship between the Moire fringe frequency um and the grating projection frequency ug obtained from formulas (6) and (9). The detector pixel size are 50μm, 75μm, 100μm and 150μm, respectively, and the graph shows the frequency variation in different cases where the angles are 0°, 2°, 4°, 6° and 8°. The graph shows that the frequency of Moire fringe in the image decreases with the decrease of the included angle. When the sampling frequency of the detector is an integer multiple of the grating projection frequency, or the grating projection period is an integer multiple of the pixels of the detector, the minimum value of the Moire frequency is obtained. When the sampling frequency of the detector is around the integer plus one half of the grating projection frequency, the maximum value of the Moire fringe frequency is obtained. In particular, when the angle is 0°, the frequency of the Moire fringe is 0, that is, the period of the Moire fringe becomes infinite. Therefore, theoretically, the grating frequency can be changed by adjusting the grating position and changing the grating projection frequency, so that Moire artifact can be suppressed or eliminated and the imaging quality can be improved.
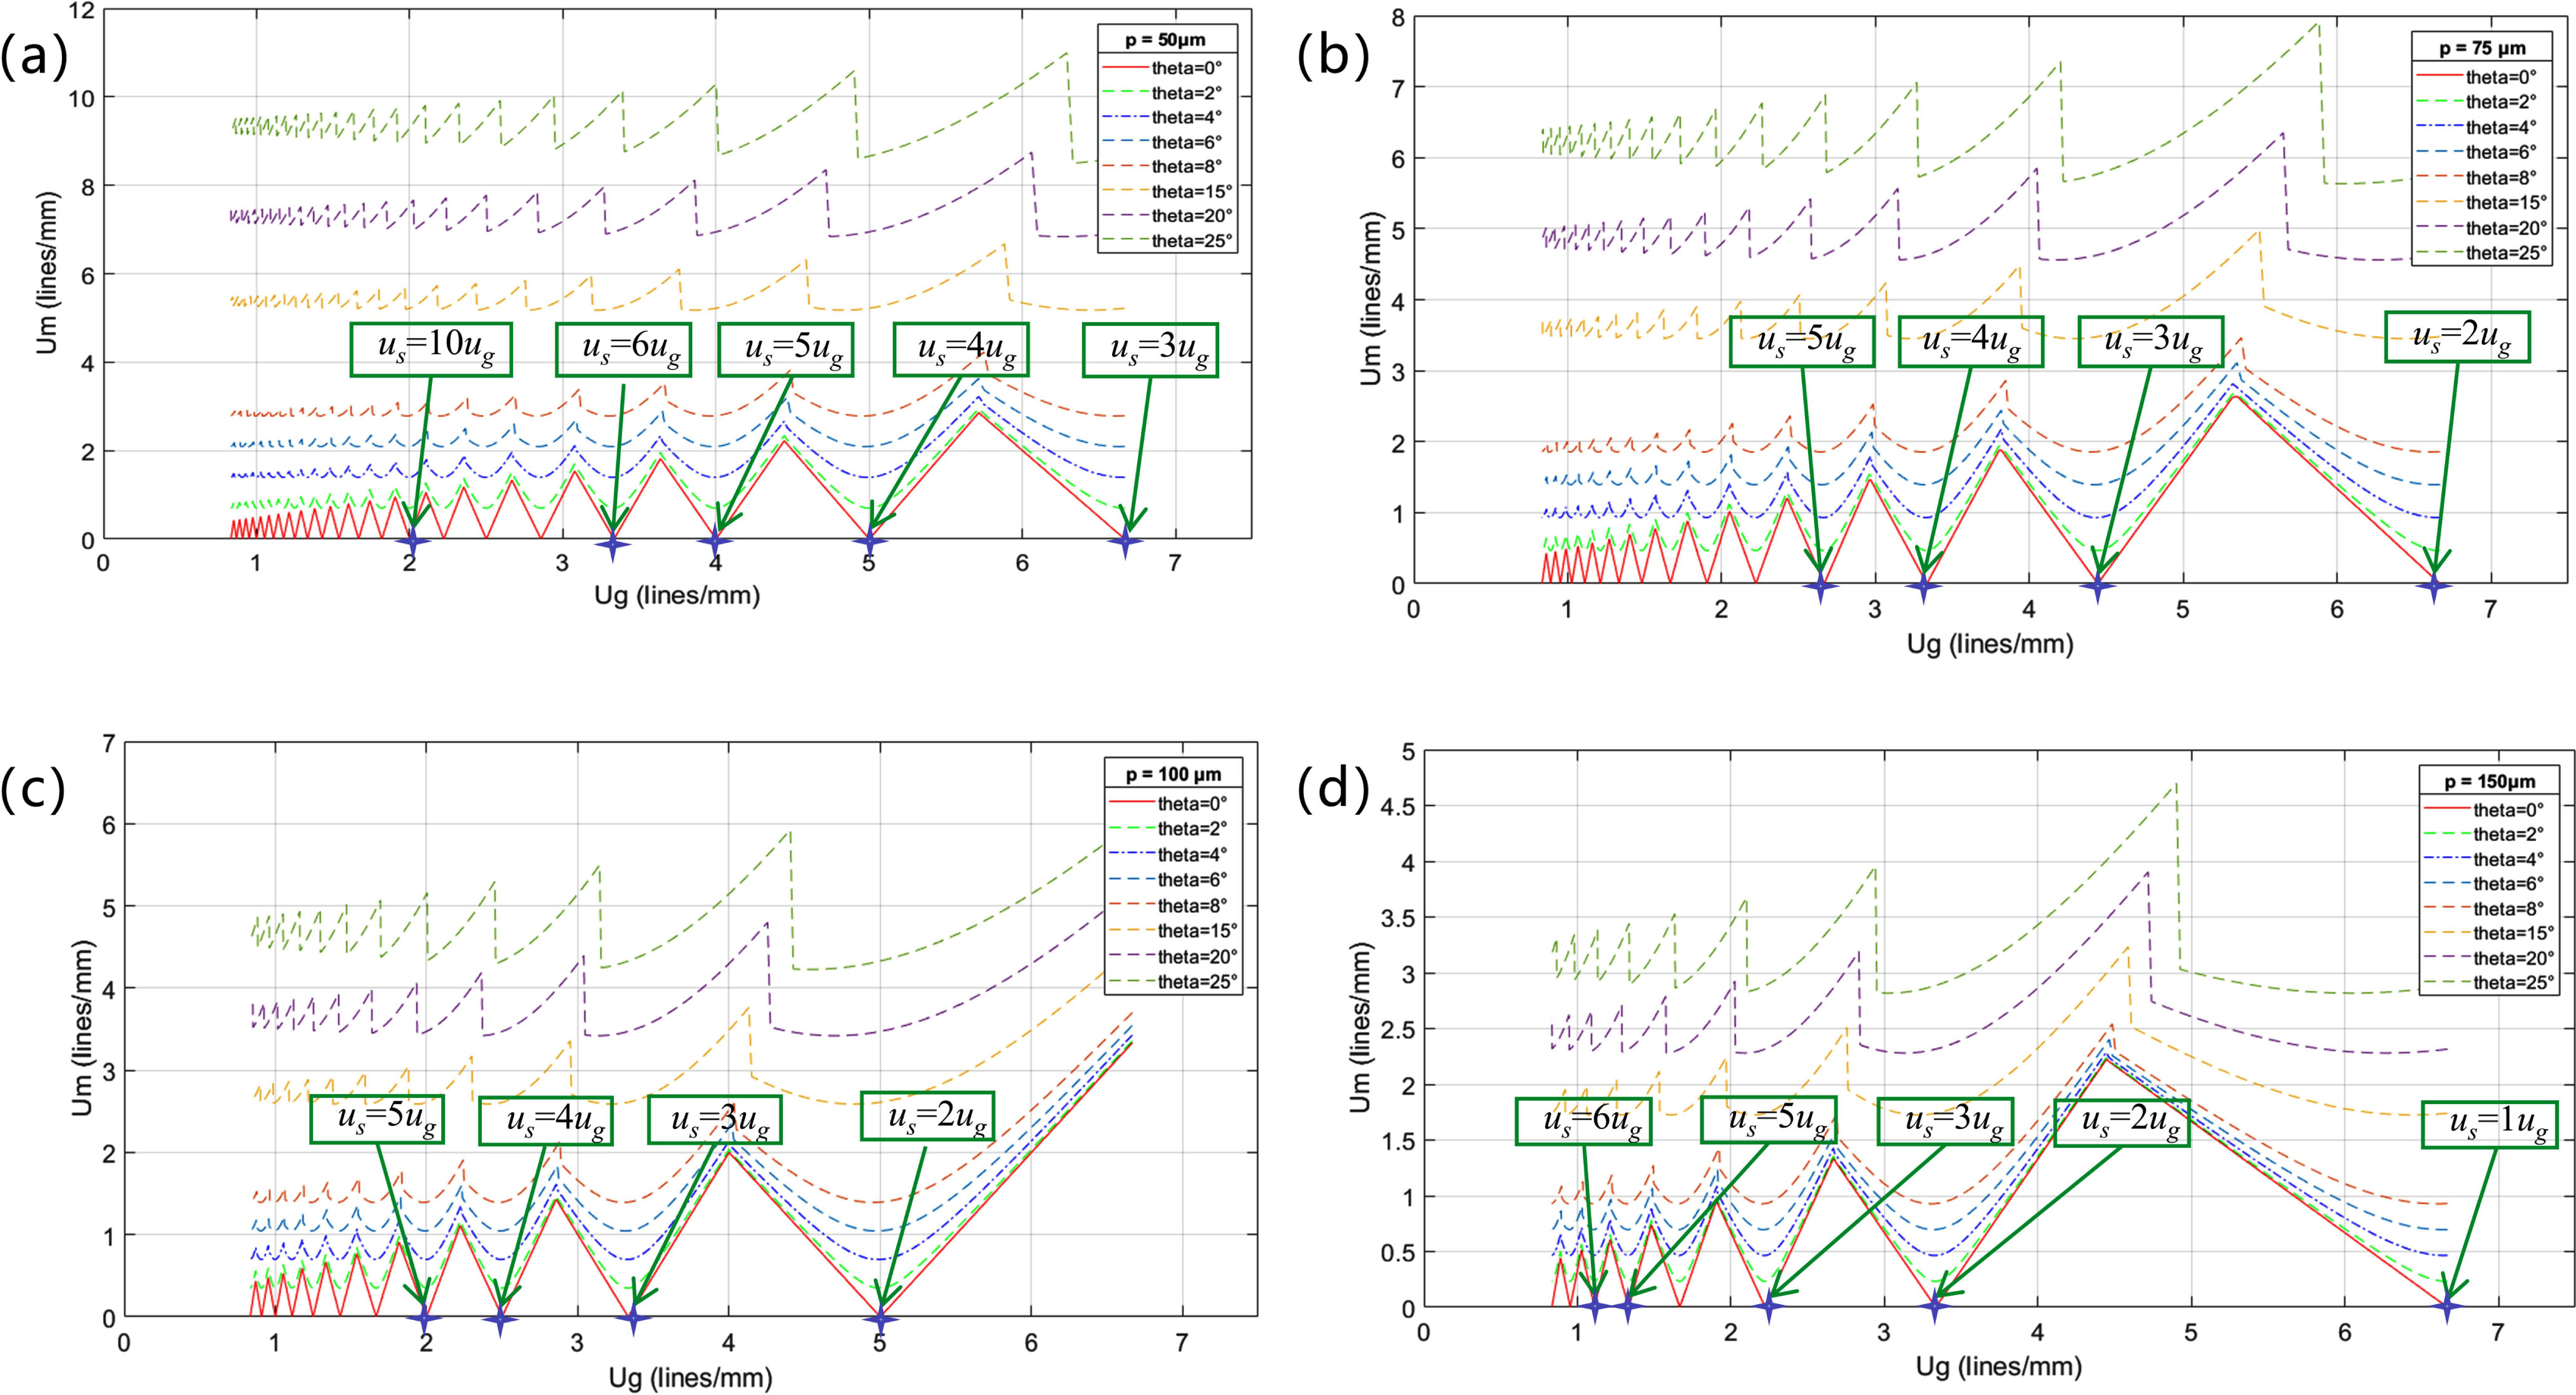
Frequency of Moire fringe changes (Um) with frequency of projected grating(Ug) under different grating angle. (a) Detector pixel size is 50μm; (b) Detector pixel size is 75μm; (c) Detector pixel size is 100μm; (d) Detector pixel size is 150μm.
In order to verify the effectiveness of the above-mentioned method of adjusting the grating projection frequency to improve the image quality, samples such as Polyurethane Tubing (PU Tubing) and chicken wings were used for experimental testing. The radiation source used in the experiment is a Micro-focus X-ray source (L9421-02, Hamamatsu, Japan) with focal spot size of 5μm, and the image detector is a CMOS flat-panel detector (Dexela 1512NDT, Varex imaging, American) with pixel size of 75μm.
The spectrum and phase-contrast images of polyethylene rods obtained by the rotating grating method are shown in Fig. 7. The imaging system has a length of 2 meters, and the grating is a filter grating (Wonsolution company, South Korea) with a period of 118μm and a focal length of 100 cm. The grating is located in the middle of the system, and the polyethylene rod sample is 5 cm in front of the grating. The tube voltage and current are 40 kV and 80μA, respectively, and the exposure time is 10 seconds. Figure 7 (a) and 7 (b) show the spectrum and phase contrast images of the sample before rotating the grating, while Fig. 7 (c) and 7 (d) show the spectrum and phase contrast images of the sample after rotating the grating counterclockwise, respectively. From Fig. 4, it can be seen that when the grating is rotated by 19 degrees, the spectrum of Moire artifacts and the target spectrum are significantly separated, so that the target spectrum are extracted without carrying the artifact spectrum, thus significantly improving the imaging quality of the phase-contrast image. Figure 7(d) shows the results obtained after rotating the grating, and the removal of Moire artifacts is obvious compared to 7(b). However, this method has the limitation that when the spatial frequency of the object is more complex (for example, it contains spatial frequencies in multiple directions), the target spectrum exists in multiple directions in the frequency domain image. Thus when rotating the grating, although the artifact spectrum can be separated from its own target spectrum, but it is easy to form crosstalk with the target spectrum in other directions, then it becomes more difficult to remove the noise spectrum. Therefore, This method of removing artifact has certain limitations.
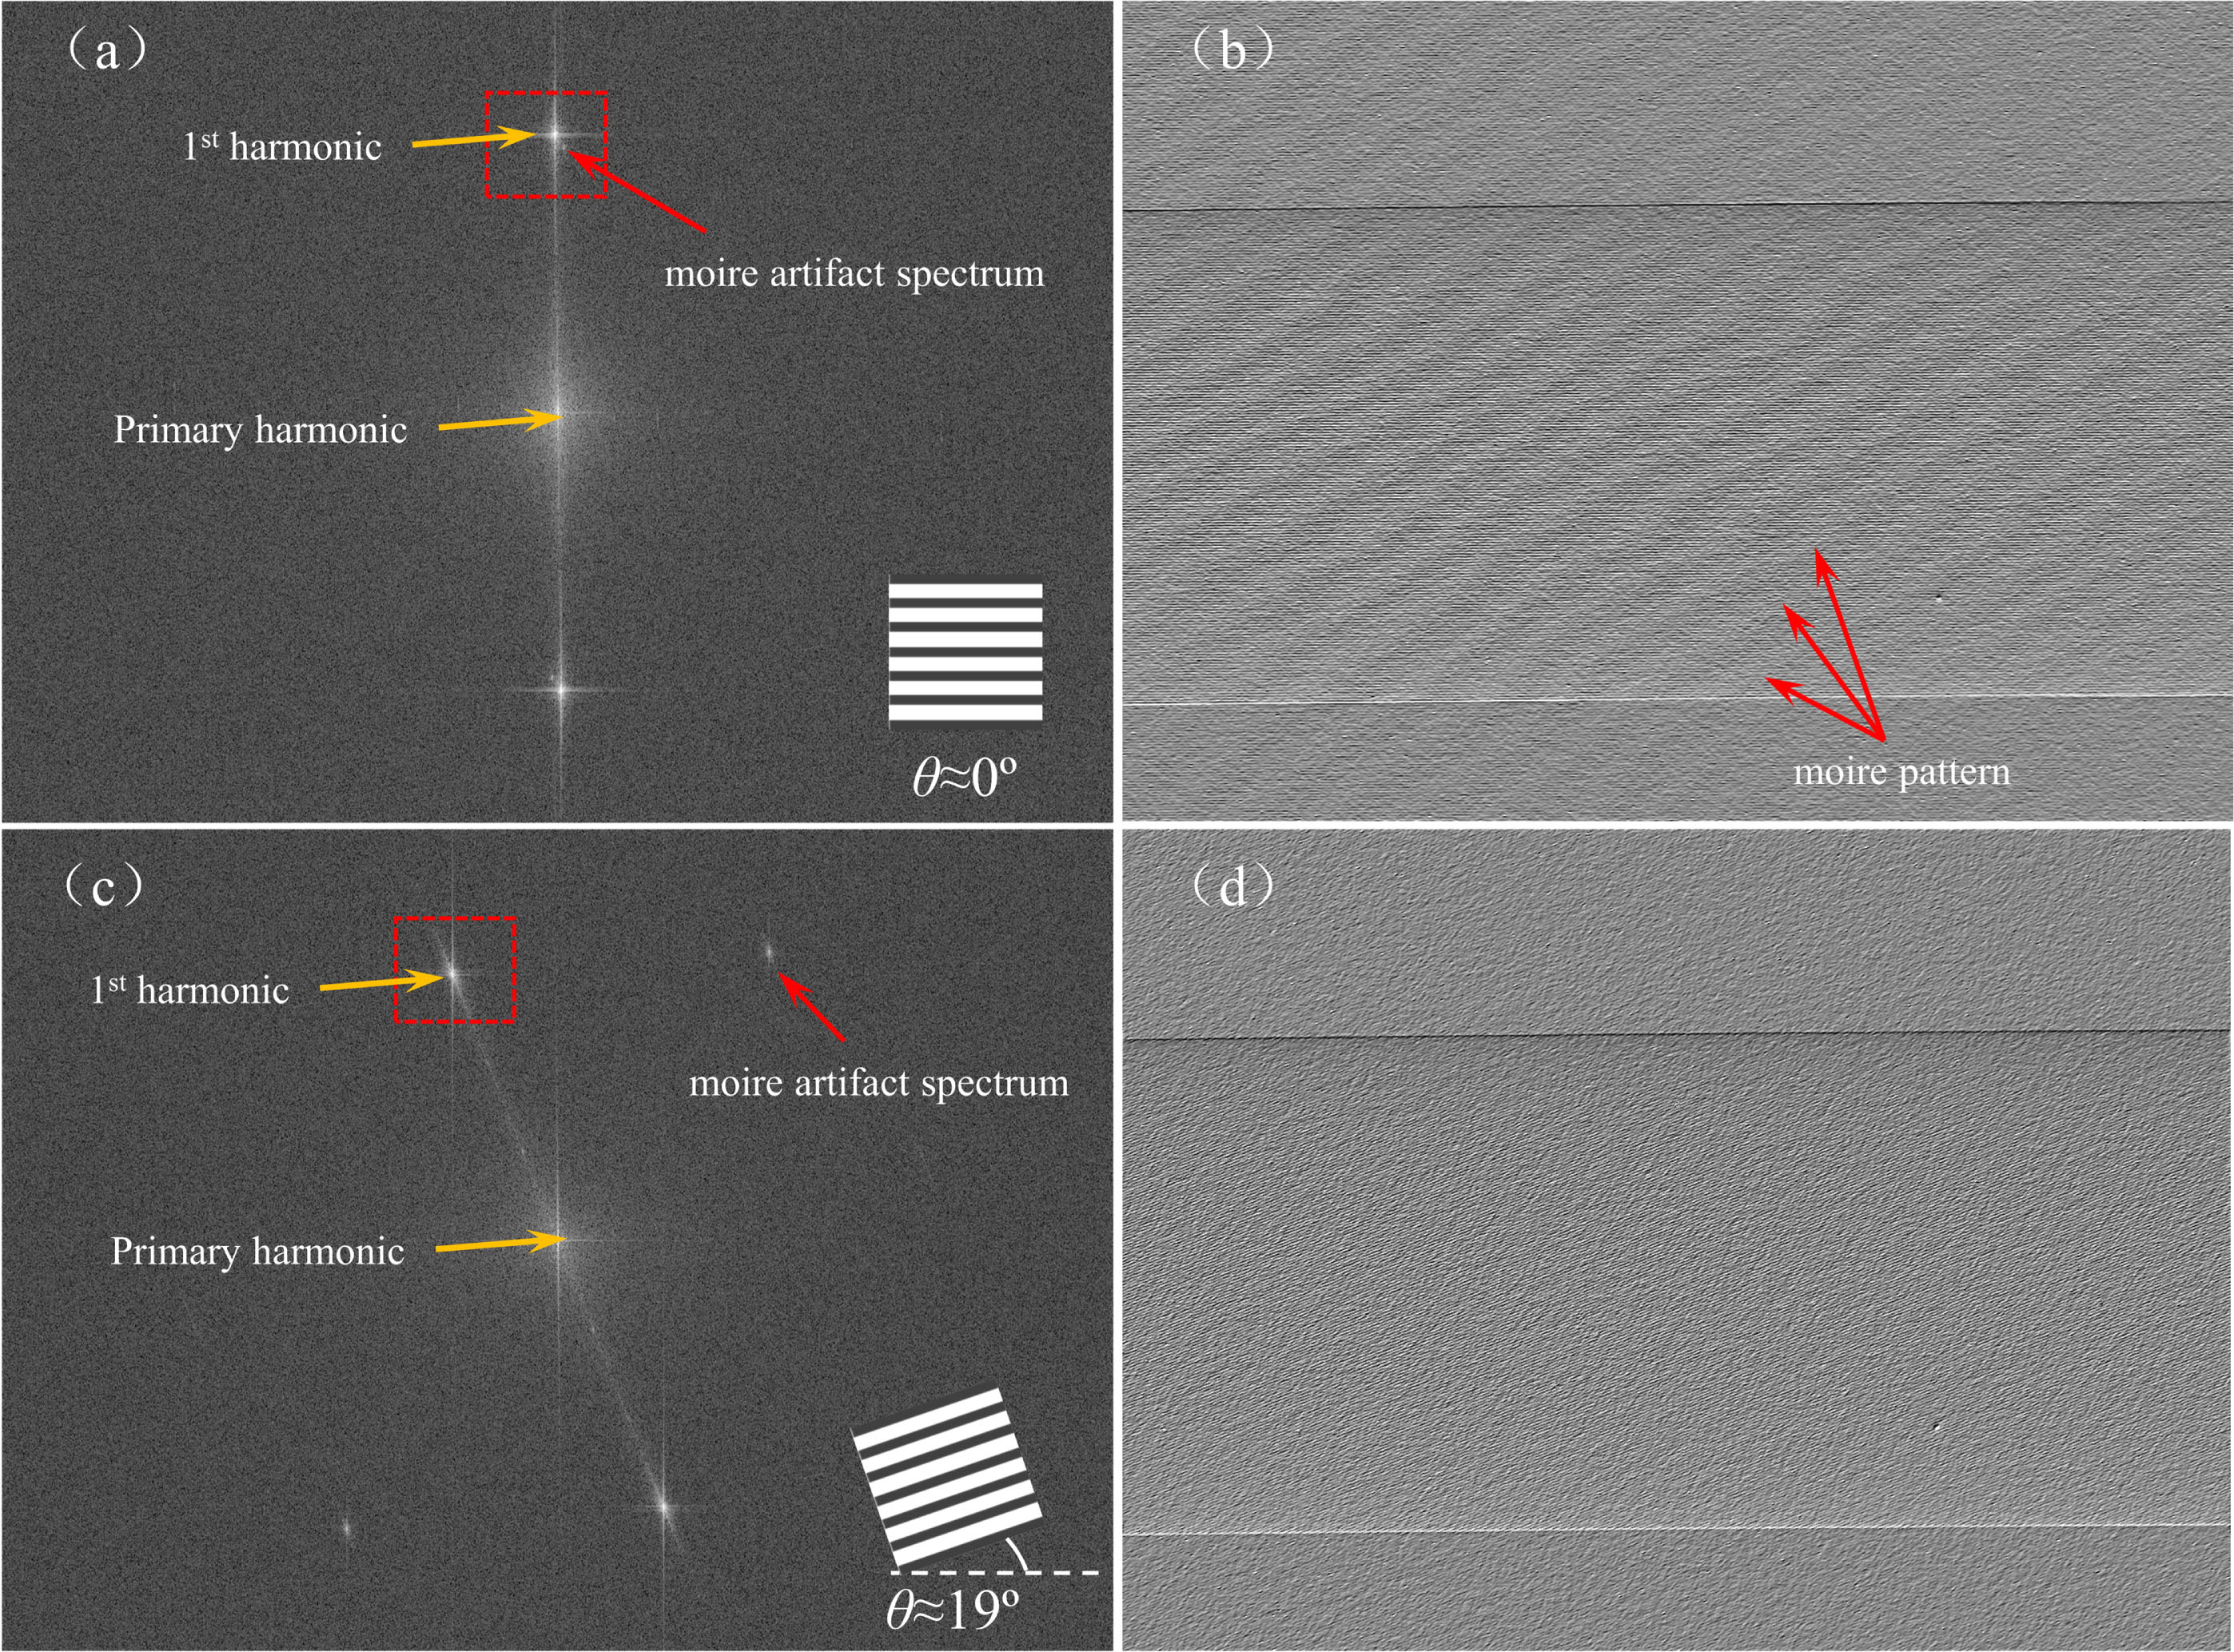
Imaging results of a rotating grating experiment. (a) Spectrum before rotating the grating; (b) Phase-contrast image before rotating the grating; (c) spectrum after rotating the grating; (d) Phase-contrast image after rotating the grating.
Figure 8 shows the image of PU tube obtained from the grating projection frequency adjustment experiment. In the experiment, the grating period was 96μm, the angle between the grating line and the detector pixel direction was 0°, and the system length was 80 cm. The sample was placed 14 cm in front of the detector. The tube voltage and tube current are 40 kV and 100μA, respectively, with an exposure time of 4 seconds. The steps to adjust the projection frequency are as follows: keeping the total length of the system unchanged, that is, keeping the position of the light source and detector unchanged, moving the position of the grating so that the period of its projection at the detector position changes, which means that the spatial frequency of the grating projection changes.The grating position is changed by the displacement stage to adjust its projection frequency to 3.80 lines/mm, 3.33 lines/mm and 2.67 lines/mm(See Fig. 6(c)), due to the detector has a pixel size of 75 microns, which means the projection period is 3.5, 4 and 5 times of the detector pixel period, respectively. As can be seen from Fig. 8, when the sampling frequency u s of the detector is 3.5 times the grating projection frequency u g , the sample image contains clear artifacts, and when the grating position is adjusted so that the detector sampling frequency u s is an integer multiple of the frequency of the grating projection u g , the recovered phase-contrast image has no obvious moire artifact noise, and the imaging quality is better, as shown in Fig. 8(b), 8(c). The acquisition of Fig. 8 (a) did not use the method of adjusting frequency, while Fig. 8 (b) and 8 (c) used the method of adjusting grating frequency. Figure 8 (d) shows the noise comparison of the background area (within the yellow box) in the three images. The noise fluctuation in Fig. 8 (a) is larger than that in Fig. 8 (b) and 8 (c), and the standard deviation of the noise signal is 0.036, 0.015, and 0.014, respectively. The experimental results show that the method proposed here can suppress the Moire noise in the background noise, resulting in a reduction of more than 50% in the standard deviation of the background noise. Figure 8 (d) shows the comparison of signal noise on three cross-sections (on the green line) in Fig. 8 (a), 8 (b), and 8 (c).

Phase-contrast images of PU tubes with different grating projection frequencies. (a) 3.80 lines/mm (u s = 3.5 u g );(b) 3.33 lines/mm (u s = 4 u g );(c) 2.67 lines/mm (u s = 5 u g ); (d) Noise comparison in the background area (within the yellow box); (e) Comparison of signal and noise on a vertical cross-section (on the green line).
For complex biological samples, such as chicken wings, we performed imaging experiments using the methods presented in this article. The phase-contrast images and dark field images of the chicken wing bone joint positions obtained from the grating projection frequency experiments are shown in Fig. 9(c) and 9(d), and the 3-dimensional and 2-dimensional images of the beryllium spectrum images are shown in Fig. 9(a) and 9(b), respectively. There are no Moire artifacts in Fig. 9(c) and 9(d), and the fine structure inside the bones in the images can be clearly distinguished, which results in better imaging.
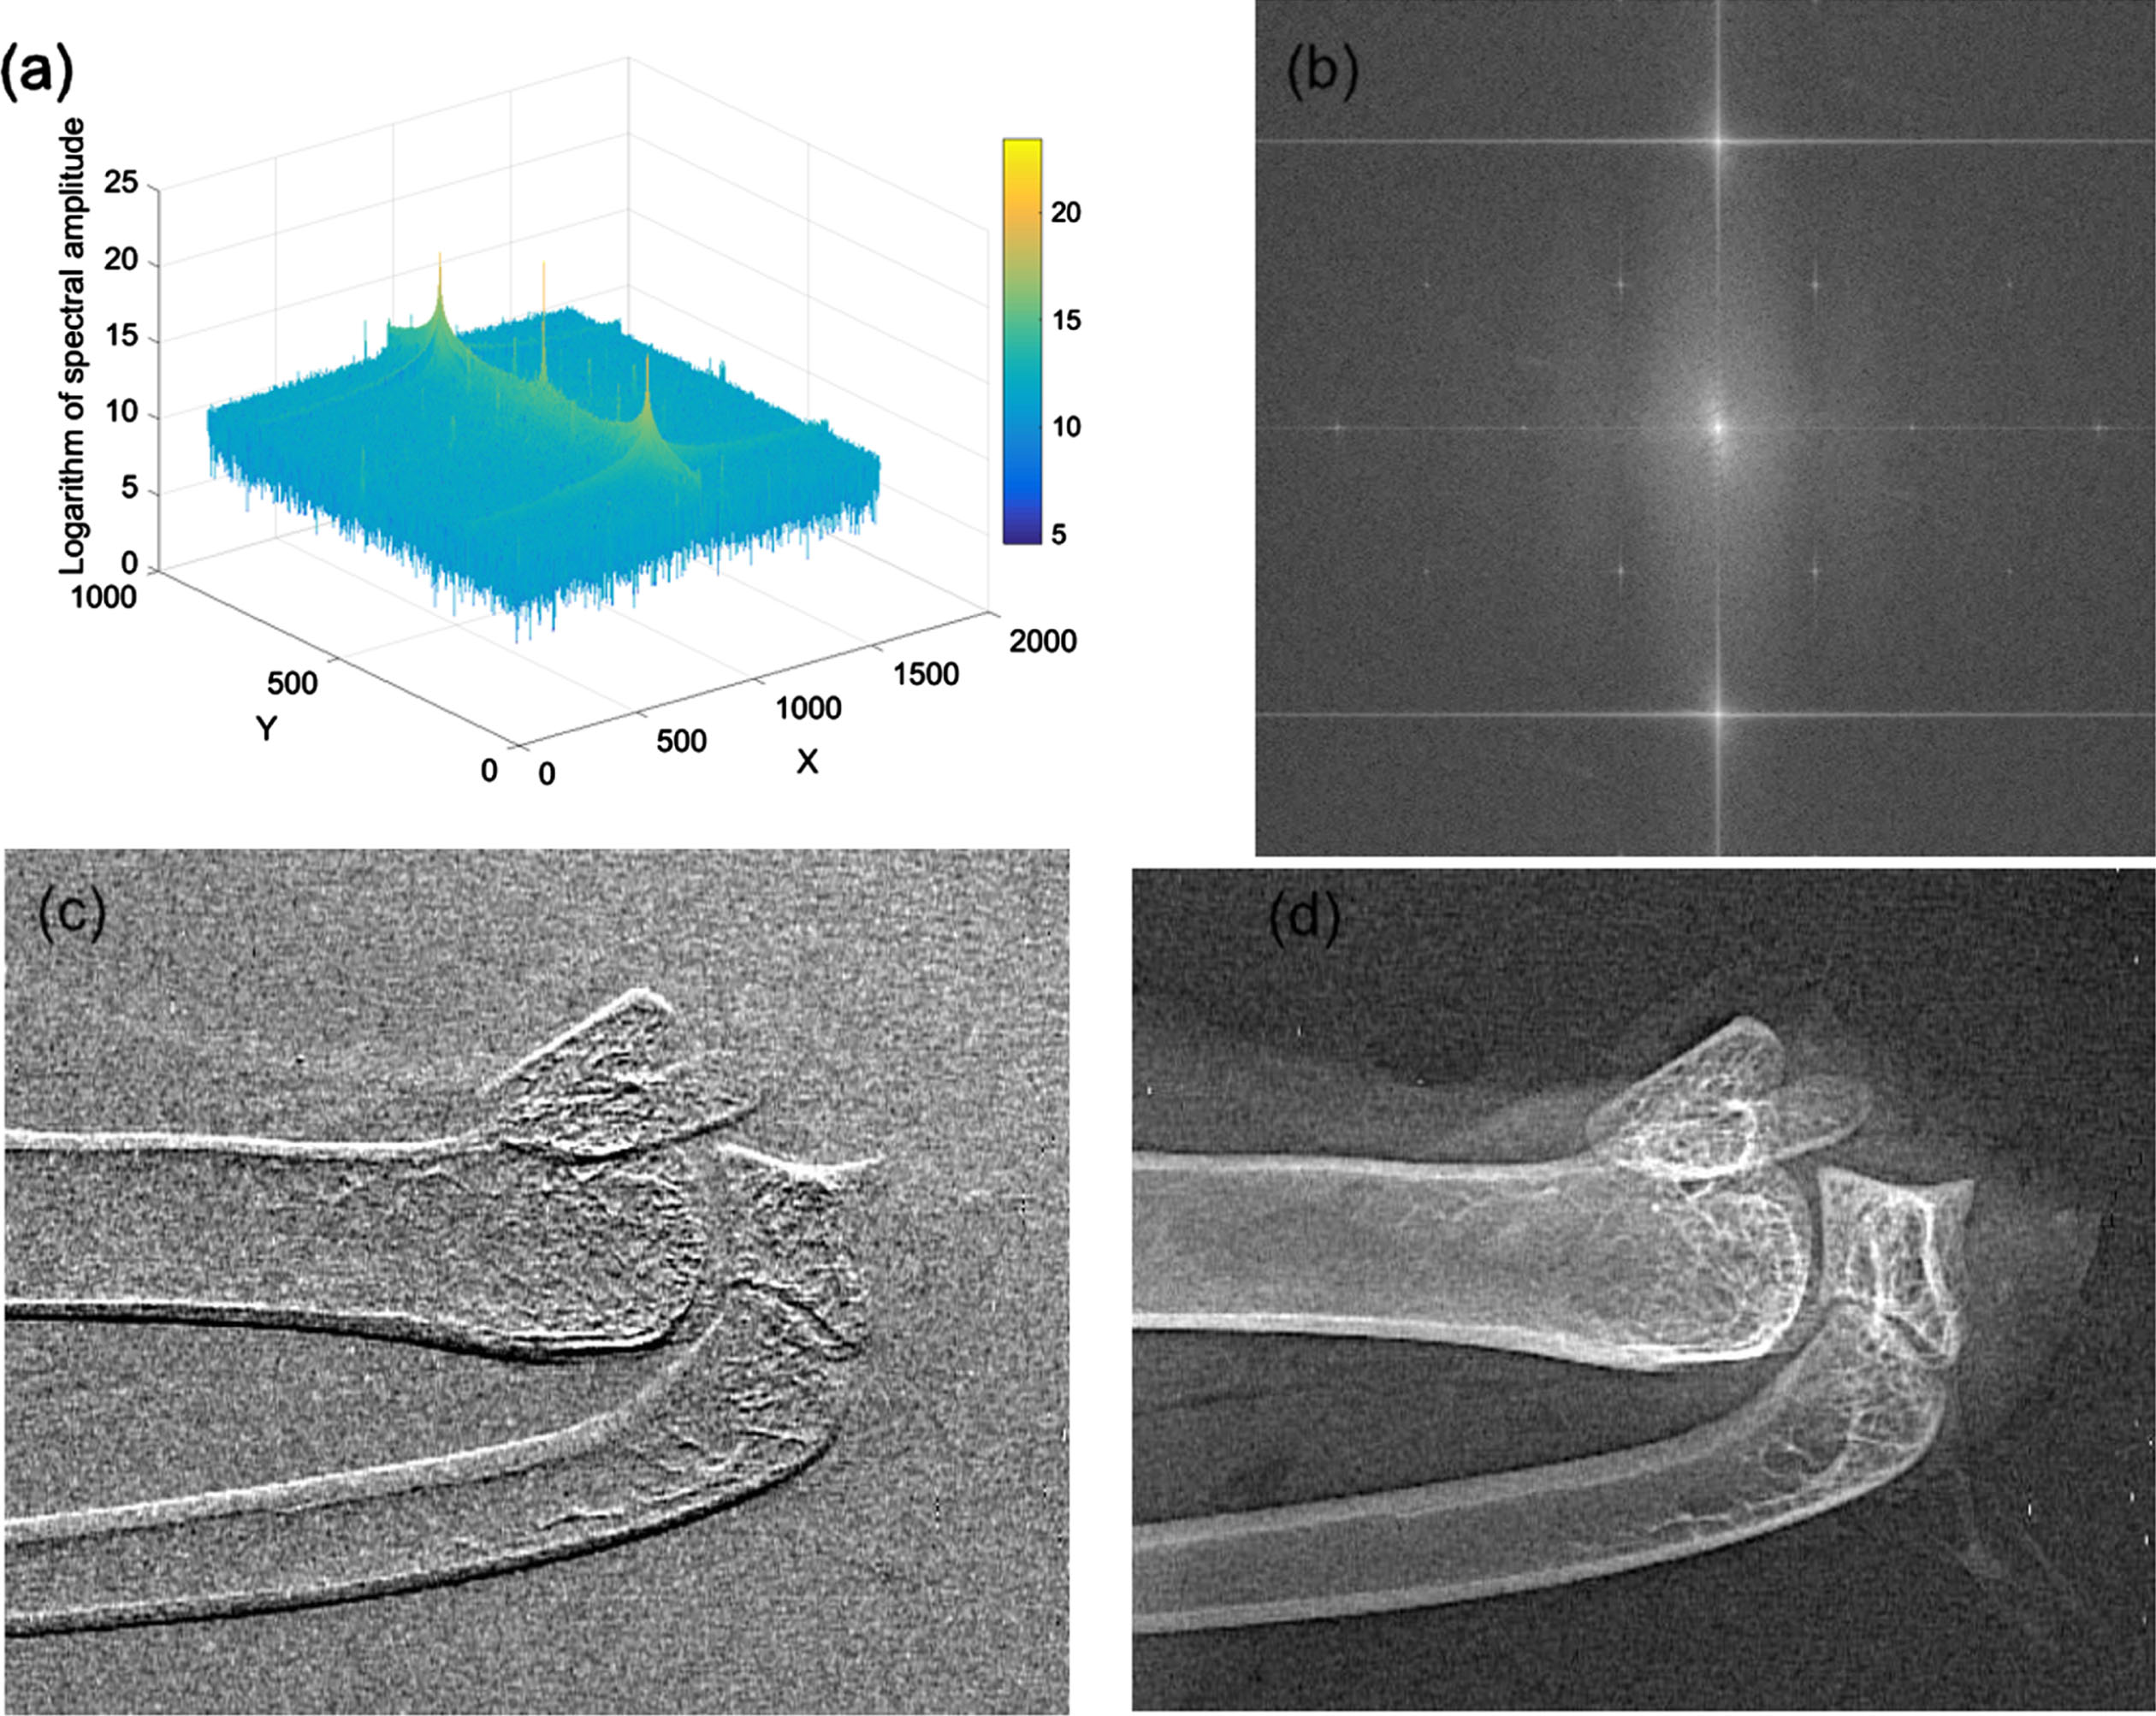
experimental results of chicken wings obtained by adjusting grating projection frequency method. (a) 3D Spectrum, (b) 2D Spectrum (c) phase-contrast image and (d) dark field image.
Figure 10 shows the contrast image quality of chicken wings. Figure 10 (a) and 10 (b) are obtained without and with methods for adjusting the grating frequency, respectively. Figure 10 (c) shows the noise comparison of the background area (within the yellow box) in two images. The noise fluctuation in Fig. 10 (a) is larger than that in Fig. 10 (b), and the standard deviation of the noise signal is 0.023 and 0.013, respectively. Figure 10 (d) shows the comparison of signal noise on two cross-sections (on the green line) in Fig. 10 (a) and 10 (b)).

experimental results of chicken wings obtained by adjusting grating projection frequency method. (a) witheout the adjusting grating projection frequency method, (b) with the adjusting grating projection frequency method (c)Noise comparison in the background area (within the yellow box) (d) Comparison of signal and noise on a vertical cross-section (on the green line).
The experimental results in Figs. 8 and 9 show that the proposed approach of adjusting the grating projection frequency can remove Moire artifacts, especially when the angle between the grating and the detector is 0 and the projection frequency is an integer multiple of the detector pixel period, the artifact removal effect is the best. Compared to the rotating grating method, this approach does not require a special spectrum filtering step. For complex objects, Moire artifacts can also be removed from phase-contrast image by this approach, which is more universally applicable and effective.
In this article, a theoretical analysis of the mechanism of Moire artifacts in single-grating imaging is provided. By rotating the grating, the target spectrum and artifact spectrum can be separated, making it easier to remove artifacts. However, for complex structural samples with multiple directional information, this method still has certain limitations. This article proposes a method of suppressing X-ray Moire artifacts by adjusting the grating projection frequency. Both theoretical analysis and experimental results demonstrate the feasibility of this method. Compared to the method of rotating the grating, it is simple and effective. By adjusting the grating position parameters appropriately, image artifacts can be suppressed, thereby optimizing imaging quality. Meanwhile, unlike conventional spatial and frequency domain filtering techniques, this method can maintain the more sample phase information, reduce image noise, and improve signal-to-noise ratio. This method can promote the application of single-grating X-ray phase contrast imaging technology, such as medical treatment, biology, material science, etc., and has important value.
Funding
This work was supported by the following Fundings: National Key R&D Programmes of China (No. 2022YFA1604002), National Natural Science Foundation of China (Grant No. 12075156), Guangdong Basic and Applied Basic Research Foundation (Grant No. 2021A1515010048).
Declarations
Conflict of interest
The authors declare no conficts of interest.