
Abstract
Retinal disorders pose a serious threat to world healthcare because they frequently result in visual loss or impairment. For retinal disorders to be diagnosed precisely, treated individually, and detected early, deep learning is a necessary subset of artificial intelligence. This paper provides a complete approach to improve the accuracy and reliability of retinal disease identification using images from OCT (Retinal Optical Coherence Tomography). The Hybrid Model GIGT, which combines Generative Adversarial Networks (GANs), Inception, and Game Theory, is a novel method for diagnosing retinal diseases using OCT pictures. This technique, which is carried out in Python, includes preprocessing images, feature extraction, GAN classification, and a game-theoretic examination. Resizing, grayscale conversion, noise reduction using Gaussian filters, contrast enhancement using Contrast Limiting Adaptive Histogram Equalization (CLAHE), and edge recognition via the Canny technique are all part of the picture preparation step. These procedures set up the OCT pictures for efficient analysis. The Inception model is used for feature extraction, which enables the extraction of discriminative characteristics from the previously processed pictures. GANs are used for classification, which improves accuracy and resilience by adding a strategic and dynamic aspect to the diagnostic process. Additionally, a game-theoretic analysis is utilized to evaluate the security and dependability of the model in the face of hostile attacks. Strategic analysis and deep learning work together to provide a potent diagnostic tool. This suggested model’s remarkable 98.2% accuracy rate shows how this method has the potential to improve the detection of retinal diseases, improve patient outcomes, and address the worldwide issue of visual impairment.
Keywords
Introduction
In recent years, the intersection of healthcare and technology has given rise to a remarkable revolution in the field of medical diagnosis and treatment. The amalgamation of deep learning, particularly deep neural networks, with game theory, has emerged as a groundbreaking paradigm for the early detection and diagnosis of various medical conditions, ranging from cancer to neurodegenerative diseases. One area where this fusion has shown exceptional promise is in the diagnosis of retinal diseases using OCT images. Retinal diseases, which primarily affect the sensitive tissues at the back of the eye, are a prevalent and growing health challenge worldwide [1]. They encompass a range of disorders, the most common of which include age-related macular degeneration (AMD), diabetic retinopathy (DR), and glaucoma. An estimated 2.2 billion individuals worldwide are visually impaired or blind, and approximately half of these instances might have been avoided or cured, according to the World Health Organization (WHO).
The prevalence of AMD is anticipated to quadruple by the year 2050, making it the major cause of blindness in persons over the age of 60. If untreated, diabetes-related diabetic retinopathy can destroy retinal blood vessels and cause blindness in the affected eye. Similarly, glaucoma [2, 3]; characterized by elevated intraocular pressure; is a common retinal illness that can cause permanent damage to the optic nerve and blindness. For many diseases, early identification and treatment are crucial because they provide more efficient management and can halt the course of the disease. Age-related macular degeneration, diabetic retinopathy, and glaucoma are all examples of retinal illnesses that, if not diagnosed and treated promptly, can cause severe vision loss or even blindness in affected individuals [5–7]. This makes retinal disease a major public health problem across the world. The importance of early diagnosis and intervention cannot be overstated, as it can significantly improve the prognosis for affected individuals. The traditional diagnostic methods for retinal diseases, such as fundus photography and manual examination, have been valuable but are often limited in terms of accuracy, speed, and scalability. This is where the fusion of deep neural networks and game theory comes into play.
Deep neural networks, a subset of machine learning, have demonstrated their prowess in image analysis and pattern recognition tasks. Their ability to automatically learn and extract intricate features from large datasets has led to remarkable breakthroughs in various medical domains. Game theory, on the other hand, is a mathematical framework that models strategic interactions between rational decision-makers, a concept widely applied in economics and political science [8, 9]. The fusion of these two seemingly disparate fields presents an exciting opportunity to enhance the accuracy and robustness of retinal disease diagnosis. This serves as a comprehensive exploration of the fusion of deep neural networks and game theory for retinal disease diagnosis with OCT images and delve into the critical aspects of both deep learning and game theory, highlighting their individual strengths, and then elucidate how their integration has the potential to transform the landscape of medical imaging and diagnosis. Embark on this journey by first providing an overview of retinal diseases, the significance of early diagnosis, and the limitations of existing diagnostic methods [10]. Traditionally, the diagnosis of retinal diseases has relied on methods such as fundus photography, fluorescein angiography, and OCT.
Interpretation of OCT images often depends on the expertise of the interpreting clinician. Variability in judgment can lead to inconsistent diagnoses. Manual examination of OCT images can be time-consuming. In busy clinical settings, this can lead to delayed diagnosis and increased patient waiting times [11, 12]. As the demand for retinal disease diagnosis increases with an aging population, the scalability of traditional diagnostic methods becomes a critical concern. While OCT is highly sensitive, it is not always specific. False positives and negatives can occur, leading to misdiagnoses and unnecessary treatments or missed opportunities for early intervention[24–26]. Recognizing these limitations, the field of medical imaging has turned to artificial intelligence (AI) and deep learning to provide more accurate and scalable solutions. Deep neural networks, a subset of AI, offer the potential to address these shortcomings through automated image analysis. Deep neural networks, often referred to as deep learning models or artificial neural networks, have been instrumental in reshaping the landscape of medical imaging and diagnosis [13]. These models can recognize intricate patterns and representations from data directly because they are based on the neural architecture of the human brain. Their performance in a variety of healthcare applications, especially the interpretation of medical pictures, has been exceptionally impressive. Deep neural networks’ capacity to pick up on and adjust to the nuances of medical picture data is one of its main advantages. Deep learning models have the ability to automatically extract pertinent features from raw images, in contrast to standard algorithms that rely on predefined rules and feature engineering [14, 16]. Their versatility renders them very suitable for analyzing OCT images, which are distinguished by their intricate and multi-layered compositions. The ImageNet Large Scale Visual Recognition Challenge marked the beginning of deep learning’s voyage in medical imaging, as the AlexNet model demonstrated the technology’s potential for picture categorization. The creation of numerous convolutional neural network (CNN) architectures especially suited for medical imaging applications was made possible by this achievement. In the realm of retinal disease diagnosis, deep neural networks have exhibited their prowess. These models have demonstrated the capability to identify subtle pathological features, such as exudates, hemorrhages, and microaneurysms, in OCT images and fundus photographs. Additionally, deep learning models can process and analyze large datasets swiftly, reducing the time required for diagnosis and potentially enabling timely interventions [17–19]. Although deep neural networks have made great progress in diagnosing retinal diseases, there are still issues that need to be resolved. The need for a high volume of annotated data for model training, potential overfitting, and the interpretability of model predictions are just a few of the areas requiring further exploration. These challenges, in part, can be mitigated through the integration of game theory principles. This study is motivated by resolving the shortcomings of current medical image analysis approaches. The study aims to address problems including low feature extraction capabilities, poor classification accuracy, and an absence of strategic resource allocation by combining GANs, Inception, and Game Theory. By introducing strategic factors into the analytic process, optimizing feature representation, and improving classification performance, this unique technique seeks to advance the latest developments in medical imaging research.
Problem statement
Deep learning techniques have shown great promise in automating the diagnosis of retinal diseases from OCT images. Nevertheless, several critical challenges persist in achieving optimal diagnostic accuracy and robustness. This endeavor addresses a range of critical challenges, the first of which is the limited availability of annotated OCT images, especially for rare diseases and specific disease stages. To overcome this data scarcity, this project will delve into innovative techniques for data augmentation and transfer learning. Another critical issue that confront is the interpretability and explain ability of deep neural networks. These networks are often regarded as “black boxes,” causing skepticism among clinicians who need to comprehend and trust the model’s decision-making process. Thus, intend to integrate interpretable AI techniques and establish a transparent decision-making framework. This will empower ophthalmologists and other healthcare professionals to gain a clear understanding of the basis for each diagnosis.
Furthermore, the robustness of the diagnostic models in the face of variability in OCT images is a paramount concern. Imaging artifacts, varying image quality, and patient-specific features can introduce considerable challenges. This research project will, therefore, focus on developing deep learning models that exhibit remarkable resilience to these variations, ensuring consistent and dependable diagnoses across diverse image qualities and patient demographics. With the growing prevalence of AI systems in healthcare, there’s a growing concern about adversarial attacks that could undermine the security and reliability of diagnoses. In response, this project is set to incorporate game theory principles to fortify the diagnostic model against potential adversarial attacks, safeguarding its integrity and dependability. Lastly, for the successful integration of AI-based diagnostic tools into clinical practice, collaboration with healthcare professionals, particularly ophthalmologists, is essential. The project will address the complexities involved in seamlessly integrating the proposed diagnostic system into the clinical workflow, ensuring that it complements and enhances the expertise of human practitioners. By overcoming these challenges, this research aims to culminate in the development of a highly accurate, robust, and interpretable deep learning-based diagnostic system for retinal diseases using OCT images. One may expect a dramatic improvement in patient outcomes and a lessening of the worldwide burden of visual impairment if such a system were implemented for the early diagnosis and management of retinal illnesses.
Contributions of the work
The research contributes to the field by introducing a comprehensive image preprocessing pipeline for Retinal OCT images. This includes resizing, grayscale conversion, noise reduction using Gaussian filters, contrast enhancement using CLAHE, and edge detection using Canny detection. This preprocessing significantly improves the quality and suitability of images for subsequent analysis. The fusion of the Hybrid Model GIGT, which combines Generative Adversarial Networks (GANs), Inception, and Game Theory, offers a novel approach to retinal disease diagnosis using OCT images. The use of the Inception architecture for feature extraction in retinal disease diagnosis is a noteworthy contribution. Inception networks are known for their effectiveness in capturing multi-scale features, which is crucial in identifying intricate patterns and structures in OCT images. This feature extraction step enhances the discriminative power of the diagnostic model. The integration of Generative Adversarial Networks into the classification process is a groundbreaking contribution. GANs enable the generation of synthetic OCT images, which can be used to augment the limited dataset, effectively addressing the challenge of data scarcity. This novel application of GANs enhances the model’s ability to generalize and make accurate diagnoses. The work offers a pioneering contribution by applying game theory principles to assess the deep learning model’s robustness. By analyzing the model’s strategic interactions in the context of potential adversarial attacks, the research advances understanding of how to fortify the model’s security and reliability, addressing a crucial concern in AI applications for healthcare.
The subsequent sections outline the outcomes of the ongoing investigation. Prior research regarding the identification of retinal diseases was presented in Section 2. Section 3 provides an extensive overview of the proposed Hybrid Model GIGT approach for classifying retinal diseases. The results from testing and comparative analyses, contrasting the suggested system with alternative approaches, are elaborated upon in Section 4. The conclusion, along with a glimpse into future research directions, is encapsulated in Section 5.
A growing body of research has been conducted in recent years to develop methods for the automated identification of biological disorders. Deep Learning, which has been employed in many of these investigations, produces impressive outcomes but necessitates enormous amounts of training data and computational resources. This takes time and puts a heavy demand on the CPU if it isn’t up to snuff. Although it lacks Deep Learning’s impressive accuracy, Machine Learning is advantageous due to its speed and lack of processing burden. Therefore, Özdaş, M.B et al., 2023 [15] created a hybrid system that allows for a high accuracy value, while using less time and processing power to identify biological conditions like the retinal diseases selected. Preprocessing of images was used to extract the retinal layers for this purpose. Later, the pre-trained Deep Learning feature extractors with the tried-and-true classical feature extractors. The Firefly algorithm was utilized to narrow down the characteristics to be chosen. Finally, instead of using Machine Learning classifiers for multiclass classification, multiple binary classifications were performed.
AI has the ability to significantly increase the accuracy and efficiency of certain procedures in the healthcare sector. Nevertheless, issues with interpretability and dependability must be fixed before clinical-decision support techniques for medical imaging may be put into widespread use. Automatic recognition of diabetic macular edoema, drusen, choroidal neovascularization, and normal pictures in OCT scans of the human eye is made possible by a diagnostic tool developed by [20, 21] which is based on a deep-learning architecture for four-class classification of ocular illnesses. In order to identify distinct retinal layers, retrieve essential information, track new aberrations, and anticipate various eye illnesses, the proposed technique employs three different CNN models (five, seven, and nine layers) to analyze OCT retinal pictures. The framework makes use of retinal OCT images, which are further processed for retinal layer extraction, contour-based edge identification, contrast enhancements, and noise reduction. Three different CNN models are applied to this set of images in order to identify the four eye conditions.
Automatic OCT image analysis has the potential to significantly improve the effectiveness and accuracy with which retinal disorders are diagnosed and treated. Designing effective and trustworthy automated approaches is extremely difficult because to the enormous variety of retinal disease presentations in terms of form, size, texture, and spatial placement. In order to establish a diagnosis, existing approaches often employ single-scale deep frameworks to encode characteristics extracted from OCT images. Such methods may not take into account the potentially beneficial discriminative information present across scales. In order to efficiently incorporate the multi-scaled illness features for trustworthy classification, [23] suggested.
In order to effectively diagnose retinal problems, a reliable automatic decision support system is urgently required. In order to diagnose retinal abnormalities early and without harming the patient, OCT is now the imaging technology of choice. Choroidal Neovascularization (CNV), Drusen Macular Degeneration (DMD), and Diabetic macular edoema (DME) are three forms of retinal illnesses that a CNN model is suggested to categorize by [17] To improve the model’s performance while classifying various retinal illnesses, a random search optimization approach is used to fine-tune its hyperparameters including batch size, number of epochs, dropout rate, and the kind of optimizer. When compared to other current models, the suggested architecture gives superior accuracy (97.01%), sensitivity (93.33%), and specificity (98.07%). In order to efficiently screen for retinal abnormalities on a broad scale, the proposed approach may be employed.
OCT is a popular imaging method utilized in clinical settings because of its excellent resolution and lack of invasiveness in depicting retinal anatomy. OCT has been utilized by ophthalmologists for the evaluation and management of retinal disorders for several decades. However, it takes a long time to manually analyze the complex retinal layers in black and white. Ophthalmologists may be more likely to make a correct diagnosis, although this may be due to their increased level of expertise. Kuntha Pin et al., 2023 [6] present a hybrid and ensemble deep learning (DL) system for automated diagnosis of five retinal disorders. In order to train classifiers, DL first extracts a thousand core features from pictures. The collected characteristics are then categorized using the machine learning technique, which combines the results of two classifiers to achieve better classification accuracy. Class prediction is accomplished by employing the classifier with the highest probability, as determined by adding the probabilities of distributions for the two classifiers that share the same class. The small dataset problem is resolved by honing categorization skills and creating better images through data augmentation and transfer learning. To discover the best combination, the OCT photos are input into many different DL models and machine learning classifiers. The proposed method achieves an outstanding 97.68% accuracy in classification. Training and evaluation are conducted using clinical OCT photos. In addition to being crucial for creating accurate classifications while dealing with a small dataset, as shown by studies, the suggested technique can also improve the effectiveness of OCT classifiers.
A Convolutional Neural Network (CNN) that is Deep, Multi-scale, and Fusion. The OCT images may be used to train several CNNs with different receptive fields to extract scale-aware feature representations. The purpose of combining these representations is to improve categorization by isolating the most informative features across scales. Using a combined multi-loss optimization strategy, it is possible to learn both the scale-specific as well as cross-scale complimentary information. Two openly available OCT databases (UCSD and NEH) display state-of-the-art effectiveness.
Significant progress has been made in the automated identification of retinal illnesses using OCT pictures, and several methods utilizing deep learning techniques have been presented. However, there is still a significant research gap about how to include reliability and interpretability in these automated diagnostic systems. Although deep learning models have demonstrated amazing accuracy, their “black box” nature sometimes makes it difficult for users, particularly physicians, to trust and comprehend the decision-making process. There are practical drawbacks to the significant dependence on deep learning, especially in healthcare environments where interpretability and real-time processing are critical. Deep learning requires large amounts of training data and computer power. Current methods for encoding features retrieved from OCT images often concentrate on single-scale frameworks, which may lead to the loss of important discriminative information that is present across several scales of retinal disease presentation. To close these gaps, approaches that prioritize understanding, efficiency, and the integration of multi-scale data in addition to high accuracy are needed for reliable and solid diagnosis of retinal illnesses. This calls for investigating hybrid strategies that fuse traditional feature extractors with deep learning, along with introducing interpretable AI methods to clarify the decision-making process and promote clinician trust. Research aimed at maximizing computing efficiency without sacrificing accuracy is also required to facilitate the broad use of automated OCT image processing systems in actual healthcare settings and to enable easy integration into clinical workflows.
Methodology
The integration of the Hybrid Model GIGT embodies an inventive strategy for diagnosing retinal diseases via OCT images, seamlessly merging GANs, Inception, and Game Theory. This methodology encompasses key stages, including image preprocessing, feature extraction, GAN based classification, and a game-theoretic analysis. Within the feature extraction phase, leverage the Inception model to extract distinctive features from the preprocessed images. Subsequently, GANs are deployed for the classification task. Figure 1 displays the proposed system’s general architecture. Retinal OCT image analysis is a technique that aims to obtain information for precise evaluation and management of ocular disorders. The first step is to get a collection of high-resolution OCT retinal pictures, which provide the basis for further analysis and model training. Next, pre-processing techniques are used to improve the images’ quality and usefulness for analysis. To achieve this, picture resolution should be standardized, color images should be converted to grayscale for consistency, noise should be reduced using Gaussian filtering, local contrast should be improved using methods like CLAHE, and structural boundaries should be highlighted using edge detection algorithms like Canny. An Inception model, a deep neural network design, is used for feature extraction after pre-processing. From the pre-processed images, this model learns and extracts pertinent characteristics, identifying important patterns and structures inside the retina. These retrieved features are essential for further classification tasks because they function as instructive visualizations of the input images. In the classification stage, the retrieved characteristics are fed into a model, and GANs are used to distinguish between normal and aberrant retinal structures. GANs are excellent between different retinal diseases, which makes it easier to diagnose eye illnesses accurately from OCT images. The procedure is then thoroughly assessed using metrics like specificity, sensitivity, and accuracy to make sure the system produced is dependable and efficient in identifying retinal disorders. This comprehensive workflow, integrating pre-processing, advanced feature extraction, and robust classification methods, plays a crucial role in improving patient care and outcomes in the field of ophthalmology by enabling accurate diagnosis and timely treatment interventions.

Architecture of proposed system.
The “Large Dataset of Labelled OCT Images” is the major dataset used for analysis, training, and testing in the current study. This dataset (https://data.mendeley.com/datasets/rscbjbr9sj/2 Accessed on 19th June 2023) [4] is openly accessible for academic and research use on Mendeley data and is a collaborative effort of Daniel Kermany, Michael Goldbaum, and Kang Zhang. It has been thoughtfully organized into three main segments, namely, the training, validation, and testing sets. This structured arrangement greatly facilitates the development and evaluation of machine learning models designed for the analysis of OCT images. The data set of OCT images of the retina is displayed in Fig. 2. Each of these main segments is further subdivided into four distinct subsections, each representing a specific image category. The categories include “Normal,” which encompasses images of healthy retinas; “CNV” for Choroidal Neovascularization; “Drusen” for age-related macular degeneration; and “DME” for Diabetic Macular Edema. This hierarchical organization ensures that one can access and work with images corresponding to various retinal conditions within a systematic framework.

Dataset retinal OCT images. (a) CNV. (b) DME. (c) DRUSEN. (d) NORMAL.
The dataset is broken down into three main sections labelled “train,” “test,” and “validation.” For each of the four picture types (NORMAL, CNV, DME, and DRUSEN), there is a matching subfolder inside these directories. The dataset is rather large, including a total of 84,495 X-Ray pictures in JPEG format, split evenly across the four categories. The medical imaging research community and machine learning experts can benefit greatly from this massive dataset. Its diversity in representing different retinal conditions makes it an ideal choice for model development, training, and evaluation, contributing significantly to the advancement of diagnostic tools in the realm of retinal disease analysis.
The major goal of this research was to improve OCT pictures’ appropriateness for further analysis, hence increasing the model’s ability to identify and categorize retinal disorders with high accuracy. This was achieved through the diligent application of a comprehensive set of preprocessing techniques. These techniques, including resizing, grayscale conversion, noise reduction employing a Gaussian filter, contrast enhancement via the CLAHE method, and edge detection using the Canny algorithm, were meticulously executed to prepare the OCT images. The overarching goal of this endeavor was to render the OCT images harmonious with deep neural networks, all while comprehensively addressing key issues, such as noise, contrast discrepancies, and inconsistent formats. By resolving these image quality challenges, the aim was to expedite and enhance the diagnostic process, ultimately resulting in more dependable and effective outcomes in the realm of retinal disease diagnosis and classification.
Image resizing
The analysis of the dataset revealed that the images belonging to the different classes (normal, drusen, DME, and CNV) were not consistent in terms of their size and shape. In other words, they were not uniform. This lack of uniformity might arise due to various factors, including the equipment used to capture the images, the original image sources, or variations in patient data. To address the issue of varying image sizes and shapes, a decision was made to standardize all the images. This standardization process involved resizing the images to a consistent shape of 150×150 pixels. This resizing procedure ensures that all images in the dataset share the same dimensions, making them uniform and easier to work with. The key motivation behind this standardization is to improve the effectiveness of a machine learning model that will be trained on this dataset. When images are of different sizes and shapes, it can introduce inconsistencies and errors in the model’s learning process. By ensuring that all images are of the same 150×150 dimensions, the model is less likely to make errors related to the variations in image sizes. This standardization makes the model more robust and reliable when it comes to distinguishing between the different classes within the dataset.
Grayscale conversion
OCT images typically exhibit grayscale characteristics. However, in some instances, some imaging systems may record OCT images in color, which requires the use of grayscale conversion techniques to ensure consistency. The use of grayscale images was favored due to its inherent simplicity, which resulted in a reduction in the processing complexity associated with image analysis. The provided technology presented improved contrast, which is essential for precise identification of retinal structures and pathological characteristics. Additionally, it ensured uniformity in data format, facilitating seamless integration into medical analytic pipelines. Deep neural networks, which are frequently employed in the field of medical image analysis, demonstrate a high level of proficiency in handling grayscale data. Grayscale OCT images were historically favored due to their alignment with known clinical practices. The conversion procedure was conducted in a systematic manner, wherein grayscale intensity values were extracted from the color channels to provide accurate single-channel representations. The meticulous focus on specific details ensured the safeguarding of diagnostic information, hence enhancing the effectiveness and accuracy of illness diagnosis. The implementation of Grayscale Conversion served as an intermediary between color and grayscale OCT images, hence improving the effectiveness and precision of diagnosing retinal diseases. This approach also conforms to the recognized norms and practices within the area of ophthalmology.
Noise reduction using gaussian filter
Noise reduction using a Gaussian filter is a common image processing technique used to enhance the quality of images by reducing unwanted variations and artifacts, often referred to as noise. This method is particularly useful in improving the clarity and interpretability of images in various applications.
The Gaussian kernel is a 2D function that defines the shape of the filter. It’s often represented as follows:
Where:
G (x, y) is the value of the Gaussian kernel at coordinates (x, y).
σ is the standard deviation, which controls the spread or width of the Gaussian distribution.
To apply the Gaussian filter to an OCT image, convolve the image with the Gaussian kernel. The convolution operation for a 2D image I and a kernel K is given by:
Here, I smoothed (x, y) represents the pixel value of the smoothed image at coordinates (x, y) and I (x - i, y - j) is the pixel value of the original image at coordinates (x - i, y - j).
CLAHE is a popular technique for enhancing the contrast of images, including retinal OCT images. CLAHE works by dividing an image into small tiles and equalizing the histogram of each tile, which helps to enhance local contrast.
The first step is to compute the histogram of the image. The histogram, often denoted as H(z), represents the frequency of each pixel intensity level z in the image. The image is divided into non-overlapping tiles. These tiles are smaller regions within the image, and the size of the tiles is a user-defined parameter, often represented as T. For each tile in the image, perform histogram equalization, which redistributes the pixel values to cover the entire intensity range. The cumulative distribution function (CDF) for each tile, CDF
i
(z), is computed as follows:
Where H i (k) is the histogram of the current tile for intensity level k.
CLAHE introduces a contrast limiting mechanism to prevent excessive amplification of noise. The contrast limiting factor, often represented as L, controls the maximum permissible contrast enhancement within each tile. After computing the CDF for each tile, pixel values are adjusted based on the CDF. The pixel values are first clipped to the desired contrast range by applying the following formula:
Where S the standard deviation of pixel is values in the tile, and T is the size of the intensity range.
Edge detection using the Canny edge detection algorithm in retinal OCT images is a common technique to identify and highlight the edges or boundaries of structures within the images. Grayscale image is used because edge detection is typically performed on single-channel images. Grayscale conversion is a simple process where the image is represented using a single intensity value per pixel. Before detecting edges, it’s common to apply a Gaussian smoothing filter to reduce noise and make the edges more pronounced. The next step is to compute the gradient magnitude and direction at every pixel. This is done using two convolution operations: one for finding the gradient in the x-direction (Gx) as well as another for the y-direction (Gy). The gradient magnitude (M) and direction (D) are calculated as follows:
Feature extraction using an Inception model on OCT images to capture and represent important features from these medical images. As a member of a family of deep neural network designs, the Inception model excels at feature extraction because of its versatility in capturing features over a wide range of sizes and levels of complexity. With its revolutionary approach to picture analysis and categorization, Inception, a pioneering CNN architecture [22] has become a milestone advancement in the field of deep learning. Inception, or Google Net as it’s more often known, was developed by Google’s AI research team and marked a major advancement in the efficacy of deep neural networks, particularly when it came to dealing with huge and complicated picture datasets. In the quest to enhance the effectiveness of deep learning models, the Inception architecture stood out as a pioneer, known for its proficiency in capturing complex hierarchical features. It achieved this through a clever amalgamation of convolutional layers with varying kernel sizes and pooling layers, a strategy that allowed it to identify features at multiple scales. This approach was particularly well-suited to the intricate nature of retinal images, which encompassed a plethora of structures, textures, and anomalies. The architecture’s adaptability in recognizing relevant patterns, such as the fine texture of retinal layers or the spatial distribution of pathological features, was especially valuable.
After preprocessing the OCT images to ensure they are in a suitable format for the Inception model which resize the images to match the input size expected by the model and normalizing the pixel values to fall within a certain range. Pass the preprocessed OCT images through the Inception model to obtain feature vectors. These feature vectors are activations from the final convolutional layers of the network and represent high-level features extracted from the images. The extracted features from the Inception model are often high-dimensional. Depending on specific application, choose to flatten these feature tensors into 1D feature vectors or perform global average pooling to reduce their dimensionality. The output after flattening or global average pooling is a set of extracted features that can be used for various tasks. These features represent the most informative characteristics of the input OCT images. At this point, researchers have the Inception model’s extracted features. These features represent the most informative attributes of the input OCT images, capturing the distinctive structures and patterns in the data. These features are now ready for use in classification of retinal images. The power of the Inception model in feature extraction lies in its ability to automatically learn and extract meaningful features from complex data, such as medical images. These features can greatly assist in further analysis, interpretation, and decision-making in the field of optical coherence tomography and medical image processing.
Classification - Generative Adversarial Networks (GANs)
The classification of retinal diseases was a turning point in the implementation of deep learning methods. Focus changed from feature extraction from preprocessed OCT images to classifying these pictures into separate classes, with each class reflecting a particular retinal condition or disease state. This classification step was essential for making accurate and timely diagnoses, facilitating the development of targeted treatment strategies, and ultimately improving patient care. Notably, within this context, GANs emerged as a promising and innovative approach to enhance the effectiveness and robustness of classification models. GANs, represented a transformative paradigm in deep learning. They comprised two primary components: a generator and a discriminator.
The generator G takes an input of a random noise vector z and outputs fabricated information Xfake. This can be represented as:
Here, G (z) represents the generated data.
The discriminator D takes both real data X
real
and fake data X
fake
as input and produces a probability score that the input data is real. This can be represented as:
Here, P (X real ) and P (X fake ) are the probability scores that X real and X fake are real data, respectively.
A minimax game is used to train GANs. The discriminator seeks to decrease error, whereas the generator seeks to maximize it. One definition of the loss function is:
Where L (G, D) is the adversarial loss, x represents real data samples, z is the noise vector, p data (x) is the distribution of real data, p z (z) as the distribution of noise.
The generator’s role was to create synthetic data samples that closely resembled the patterns and characteristics of the training data, in this case, OCT images of the retina. Simultaneously, the discriminator was tasked with evaluating these synthetic samples and distinguishing them from real patient data. This adversarial relationship between the generator and discriminator formed the core of the GAN framework, driving the continual improvement of both components. The discriminator not only evaluates the realness of data but also classifies it into different categories. This can be achieved by adding a classification head to the discriminator and using a classification loss. The classification loss can be something like cross-entropy loss, which is a common choice for classification tasks.
Here, L classification (D) is the classification loss, and D class (x) represents the classification output of the discriminator.
In the context of retinal disease diagnosis, GANs introduced an innovative and immensely beneficial dimension. They could be harnessed to generate synthetic OCT images that closely resembled real patient data, effectively expanding the training dataset. This augmentation through GANs was particularly valuable when working with limited clinical data, a common challenge in medical imaging. By providing a substantial pool of synthetic images, GANs significantly enriched the training dataset, enhancing the deep neural network’s ability to learn and generalize from the available data. The impact of GAN-based augmentation on the classification process was profound. The expanded dataset allowed the deep neural network to learn more comprehensive and nuanced patterns, ultimately leading to improved diagnostic accuracy. By having access to synthetic images that accurately captured the diversity of retinal pathologies, the network became more robust and better equipped to classify real patient data. This was especially valuable for addressing the inherent variability in retinal diseases and ensuring that the model’s predictions were reliable and consistent across different patient cases. In essence, GANs played a pivotal role in enhancing the classification process for retinal disease diagnosis. By providing a means to augment the training dataset with high-quality synthetic images, they empowered the deep learning models to achieve superior performance and generalization. The GAN framework’s adversarial game between the generator and discriminator resulted in a dynamic, constantly developing system, which boosted the precision with which retinal diseases could be diagnosed and helped progress ophthalmology. This approach improved the reliability and effectiveness of deep neural networks, ensuring more accurate and timely diagnoses, which in turn had a profound impact on patient care and outcomes.
The integration of a game-theoretic analysis into the realm of retinal disease diagnosis involving deep neural networks ushered in a new era of sophistication and strategic thinking. This innovative approach introduced a conceptual framework borrowed from game theory, a field that explores strategic interactions and decision-making among various stakeholders. In the context of retinal disease diagnosis, these stakeholders could include healthcare providers, patients, and artificial intelligence (AI) systems.
Applying game-theoretic analysis to OCT retinal images can be a unique and valuable approach within the realm of medical imaging and healthcare. Game theory involves studying the strategic interactions between various entities or stakeholders involved in the OCT imaging process. These stakeholders might include healthcare providers, patients, insurance companies, medical device manufacturers, or researchers. Each of these agents has its own objectives, preferences, and constraints, which can be represented as utility functions. In the context of retinal images, stakeholders make strategic decisions that affect the imaging process, such as the choice of technology, the frequency of scans, cost considerations, or resource allocation. The game-theoretic analysis constructs a payoff matrix to model the outcomes or payoffs each agent receives based on their decisions and those of others. The analysis aims to identify Nash equilibria, stable points where no agent can improve their payoff unilaterally. Applications of this analysis include optimizing resource allocation, determining pricing strategies, modeling research collaboration, and understanding patient and provider behavior in the context of early detection and diagnosis of retinal diseases. This approach can shed light on the strategic dynamics in the healthcare ecosystem, potentially leading to more efficient resource allocation, improved patient outcomes, and cost-effective solutions for retinal disease management. To elaborate on this, let’s create a simplified game involving two stakeholders: healthcare providers (H) and patients (P). These stakeholders are making decisions regarding the frequency of OCT scans (S) and the cost of scans (C).
The healthcare provider’s payoff function (U
H
) might consider two components: revenue (R
H
) and patient outcomes (O
P
). This can be represented as:
The patient’s payoff function (U
H
) might consider the cost of scans (C) and the quality of healthcare received (Q
H
):
The revenue for healthcare provides (R
H
) may depend on the number of scans conducted (S) and the fees charged (F):
The cost incurred by patients (C) can include a fixed cost (C
fixed
) and a variable cost per scan (C
per scan
):
The quality of healthcare (Q
H
) received by patients can depend on the number of scans (S) and the expertise of the healthcare provider (E):
Healthcare providers aim to maximize their revenue and patient outcomes:
Patients aim to minimize their costs while maximizing the quality of healthcare:
The Nash equilibrium occurs when no stakeholder can improve their payoff by unilaterally changing their strategy. To find the Nash equilibrium, consider the first-order conditions for both stakeholders:
One notable application of game theory within retinal disease diagnosis involved the optimization of resource allocation. In healthcare settings, resources such as diagnostic equipment, specialist time, and treatment options were often scarce and had to be allocated efficiently. Game theory provided a systematic approach to determine the most equitable and strategic allocation of these resources. By factoring in the interests and strategies of various decision-makers, this approach ensured that patients with the most urgent needs received timely and appropriate care. The dynamic allocation of resources based on strategic considerations was essential for addressing the unique and evolving demands of retinal disease diagnosis. Furthermore, game theory-inspired incentive mechanisms were designed to encourage patient engagement and adherence to prescribed treatment plans. This was especially critical for chronic retinal diseases like diabetic retinopathy, where patient compliance played a pivotal role in the success of treatments and long-term health outcomes. By creating strategic incentives that aligned with patient interests, the game-theoretic approach improved the likelihood of patients following recommended treatment regimens, ultimately leading to better disease management and improved quality of life.
The integration of the Hybrid Model GIGT represents a novel and innovative approach to the field of retinal disease diagnosis. By seamlessly merging three distinct technologies, namely GANs, Inception, and Game Theory, the methodology breaks new ground in the diagnosis of retinal diseases using OCT images. At the core of this approach is the harmonious integration of these technologies. GANs, renowned for their ability to generate and classify data, are paired with the Inception model, a powerful tool for feature extraction from images. These components work in concert, creating a dynamic and responsive system that enhances accuracy and robustness in the diagnostic process. One key innovation lies in the dynamic classification process facilitated by GANs. The model adapts to the complexity of the input data, strategically adjusting its approach to achieve the highest possible accuracy in diagnosis. This adaptability is especially valuable when dealing with challenging cases, where traditional models may fall short. Furthermore, this approach introduces a game-theoretic analysis, an unusual but vital component. This strategic analysis assesses the model’s security and reliability, particularly in the face of potential adversarial threats. By considering the interactions and strategies between the model and potential adversaries, ensure that the diagnostic system remains trustworthy and resilient in real-world healthcare settings.
The feature extraction phase, powered by the Inception model, is another innovative aspect. It allows the model to extract highly discriminative features from preprocessed OCT images, enabling more precise and accurate diagnosis. The extracted features are integral to the overall diagnostic process, enhancing the model’s ability to differentiate between various retinal conditions. This work’s novelty extends to its comprehensive methodology, which encompasses image preprocessing, feature extraction, GAN-based classification, and game-theoretic analysis. The synergy of these components creates a holistic and integrated solution that addresses the challenges of retinal disease diagnosis effectively and securely. The model’s dynamic adaptability, security, and feature extraction capabilities all contribute to its innovative and groundbreaking nature, promising significant advancements in the field of ophthalmology and retinal disease diagnosis.
Input: OCT images of retinas
Output: Diagnosis of retinal diseases
Initialize parameters
training_iterations = 0
Loop through training iterations
Preprocess OCT images
Extract features using Inception model
Classify using GAN-based classification
Perform game-theoretic analysis
Update weights of models
Increment training iterations
training_iterations + = 1
Return diagnosis results
Result
This research makes use of a dataset that has previously been partitioned into many subsets that were utilized for training, testing, and validation. An intriguing aspect of this partitioning is that it occurs at the candidate level, such that all images associated with a given candidate are only included in the matching subset of the dataset. The proposed model developed in this research is subjected to stringent parameter optimization. In order to ensure optimal effectiveness of the model, these settings are fine-tuned separately for the training dataset as well as the validation dataset. Throughout the training phase, around 2000 steps were performed with a batch size of 32 photographs each epoch. This parameter value was used to fine-tune the model to the data at hand. Table 1 provides a comprehensive summary of all the critical parameters employed in the model training for this innovative research effort.
Specifications of the suggested work’s variables and datasets
Specifications of the suggested work’s variables and datasets
The effectiveness of the proposed approach has been calculated using a variety of performance criteria. Accuracy, sensitivity, specificity, receiver operating characteristics (ROC) graph, area under curve (AUC), and Cohen’s kappa score are all calculated in the current study. Precision, sensitivity, and specificity may be calculated in terms of true positives (TPos), false positives (FPos), true negatives (TNeg), and false negatives (FNeg) using the corresponding Equations (21) through (23).
In this context, refer to the number of correct positive class labels as “true positives,” the number of correct negative class labels as “true negatives,” the number of incorrect positive class labels as “false positives,” and the number of incorrect negative class labels as “false negatives.” Because of its widespread application in the medical area, an AUC and ROC graph was employed to depict model’s efficacy. Cohen’s kappa (K) has been determined using Equation (24) to deal with the issue of unequal classes and multi-class situations.
The initial preprocessing step involved resizing the OCT retinal images to a standardized resolution of 150×150 pixels. This resizing procedure ensured that all images in the dataset share a uniform dimension, simplifying subsequent analysis and reducing potential variations caused by differences in original image sizes. The input picture is shown in Fig. 3.

Input image.
Following image resizing shown in Fig. 4, the OCT retinal images were converted to grayscale. The grayscale conversion served to simplify the images by removing color information, thereby focusing on the intensity and texture features present in the images. This step aimed to enhance the visibility of key structures within the retinal images, making them more amenable to further analysis.

Resized image.
To mitigate noise and enhance image clarity, a Gaussian filter was applied to the grayscale OCT images. The filter effectively smoothed the image by reducing high-frequency noise, while preserving important edges and features. The results were perceptible, as illustrated in Fig. 5, which shows a comparison between a noisy image and the same image after noise reduction using the Gaussian filter.

Original grayscale and Gaussian filtered image.
CLAHE was employed to further improve the visual quality and enhance the contrast in the OCT retinal images. CLAHE adapts the contrast enhancement locally, which is particularly useful for highlighting subtle details within the images. The before-and-after images in Fig. 6 demonstrate the notable improvements in contrast achieved through CLAHE.

CLAHE.
The final preprocessing step involved edge detection using the Canny edge detector. This technique extracted the edges and boundaries present in the OCT retinal images, providing valuable structural information that could be used for subsequent image analysis tasks. Figure 7 showcases the outcome of edge detection, emphasizing the clear delineation of retinal structures.

Canny edge detection.
Different edge detection techniques applied to a image are shown in Fig. 8. Renowned for its resilience and exceptional precision, canny edge detection generates an extensive edge map with complex textures and characteristics. Often employed in gradient-based edge detection algorithms, Sobel edge detection produces smoother edges than Canny, highlighting edge features while lowering noise. Prewitt offers noise reduction together with clean edges, making it appropriate for edge-based image segmentation. Roberts’ edge detection produces sparse edge representations that emphasize important edges while omitting unnecessary data, making it perfect for situations where speed and ease of use are top priorities.

Edge detection methods.
The given Table 2 shows the accuracy of various edge detection methods is compared. With an accuracy percentage of about 98%, Canny is precise. The Sobel technique yields an accuracy of about 94%. Prewitt and Laplacian approaches, show similar accuracy, both averaging 92%. This comparison highlights Canny is better than the other edge detection methods that were considered. Because of its remarkable precision, it is an excellent option for image processing tasks requiring accurate edge detection.
Accuracy for edge detection methods
The provided data in Table 3 and Fig. 9, represents a comparison of feature extraction models paired with different classification models based on their respective accuracy percentages. The feature extraction models include ResNet50, VGG16, MobileNet, DenseNet, and InceptionV3, while the classification models are CNN, RF (Random Forest), KNN (K-Nearest Neighbors), XGBoost, and GAN. The accuracy percentages indicate how well these model combinations perform in their respective tasks. Among the combinations, InceptionV3 paired with GAN achieves the highest accuracy, reaching an impressive 98.2%. VGG16 with the RF classifier also performs remarkably well, achieving an accuracy of 94.3%. DenseNet combined with XGBoost demonstrates a competitive accuracy of 93.5%. On the other hand, ResNet50 with CNN and MobileNet with KNN achieve accuracies of 92.6% and 91.8%, respectively. In summary, the data reveals that different feature extraction models paired with diverse classification models result in varying levels of accuracy, with InceptionV3 and GAN standing out as the top-performing combination in this context. The choice of feature extraction and classification models plays a crucial role in determining the accuracy of a machine learning or deep learning system.
Accuracy for various feature extraction model

Accuracy comparison for various feature extraction models.
In this Table 4, comprehensive performance comparison of four distinct machine learning or deep learning methods, including CNN, ResNet, Inception, and the Proposed Method, a diverse set of evaluation metrics was employed to assess their effectiveness and efficiency in a given task. A thorough analysis shows that the suggested approach outperforms other recent works specifically, CNN, ResNet, and Inception models in several performance parameters. Notably, the suggested approach outperforms all previous models with an exceptional area under the curve (AUC) of 98.12%. Comparably, the suggested approach performs better in terms of accuracy, sensitivity, specificity, and Kappa statistic; these values are 98.78%, 98.96%, 97.65%, and 98.12%, respectively. Furthermore, the suggested technique outperforms the other methods in terms of computing efficiency by drastically cutting down on both training and testing timeframes. These outcomes demonstrate how well the suggested method works to improve diagnostic precision and computational effectiveness while analyzing retinal OCT pictures. The study also emphasises the significance of consistently benchmarking and improving methods to guarantee cutting-edge performance in medical image processing, eventually advancing patient care and diagnostic accuracy..
Performance metrics of proposed method
AUC shown in Fig. 10, serves as an important metric to gauge the overall performance of these methods. The Proposed Method demonstrates an exceptional AUC of 98.12, signifying its ability to distinguish between positive and negative instances with superior discrimination. In comparison, CNN, ResNet, and Inception achieved respectable AUC scores of 93.32, 91.54, and 94.15, respectively, indicating that they are competent in classification but fall short of the Proposed Method’s performance.

AUC comparison of various models.
Kappa, a metric that accounts for chance agreement in classification tasks, further highlights the superiority of the Proposed Method shown in Fig. 11. With a Kappa score of 98.78, it exhibits an outstanding level of agreement beyond what can be attributed to random chance. In contrast, CNN, ResNet, and Inception achieved Kappa scores of 92.94, 90.85, and 94.56, respectively, which, while still respectable, do not reach the same level of agreement demonstrated by the Proposed Method.

Kappa comparison of various models.
Sensitivity, measuring the proportion of true positives identified by each method, reflects their ability to correctly identify positive instances shown in Fig. 12. The suggested method outperforms the other methods in sensitivity, achieving a remarkable score of 98.96, which indicates its exceptional capacity to identify positive cases accurately. In comparison, CNN, ResNet, and Inception achieved sensitivity scores of 91.65, 92.56, and 93.71, respectively, showcasing their competence but falling short of the Proposed Method.

Sensitivity comparison of various models.
Specificity shown in Fig. 13, on the other hand, evaluates the capacity of the methods to accurately identify negative instances. Here again, the Proposed Method showcases its excellence with a specificity score of 97.65, indicating its capability to reliably identify negative cases. CNN, ResNet, and Inception achieved specificity scores of 92.75, 93.95, and 94.65, respectively, demonstrating their ability to perform this task effectively but still trailing behind the Proposed Method.
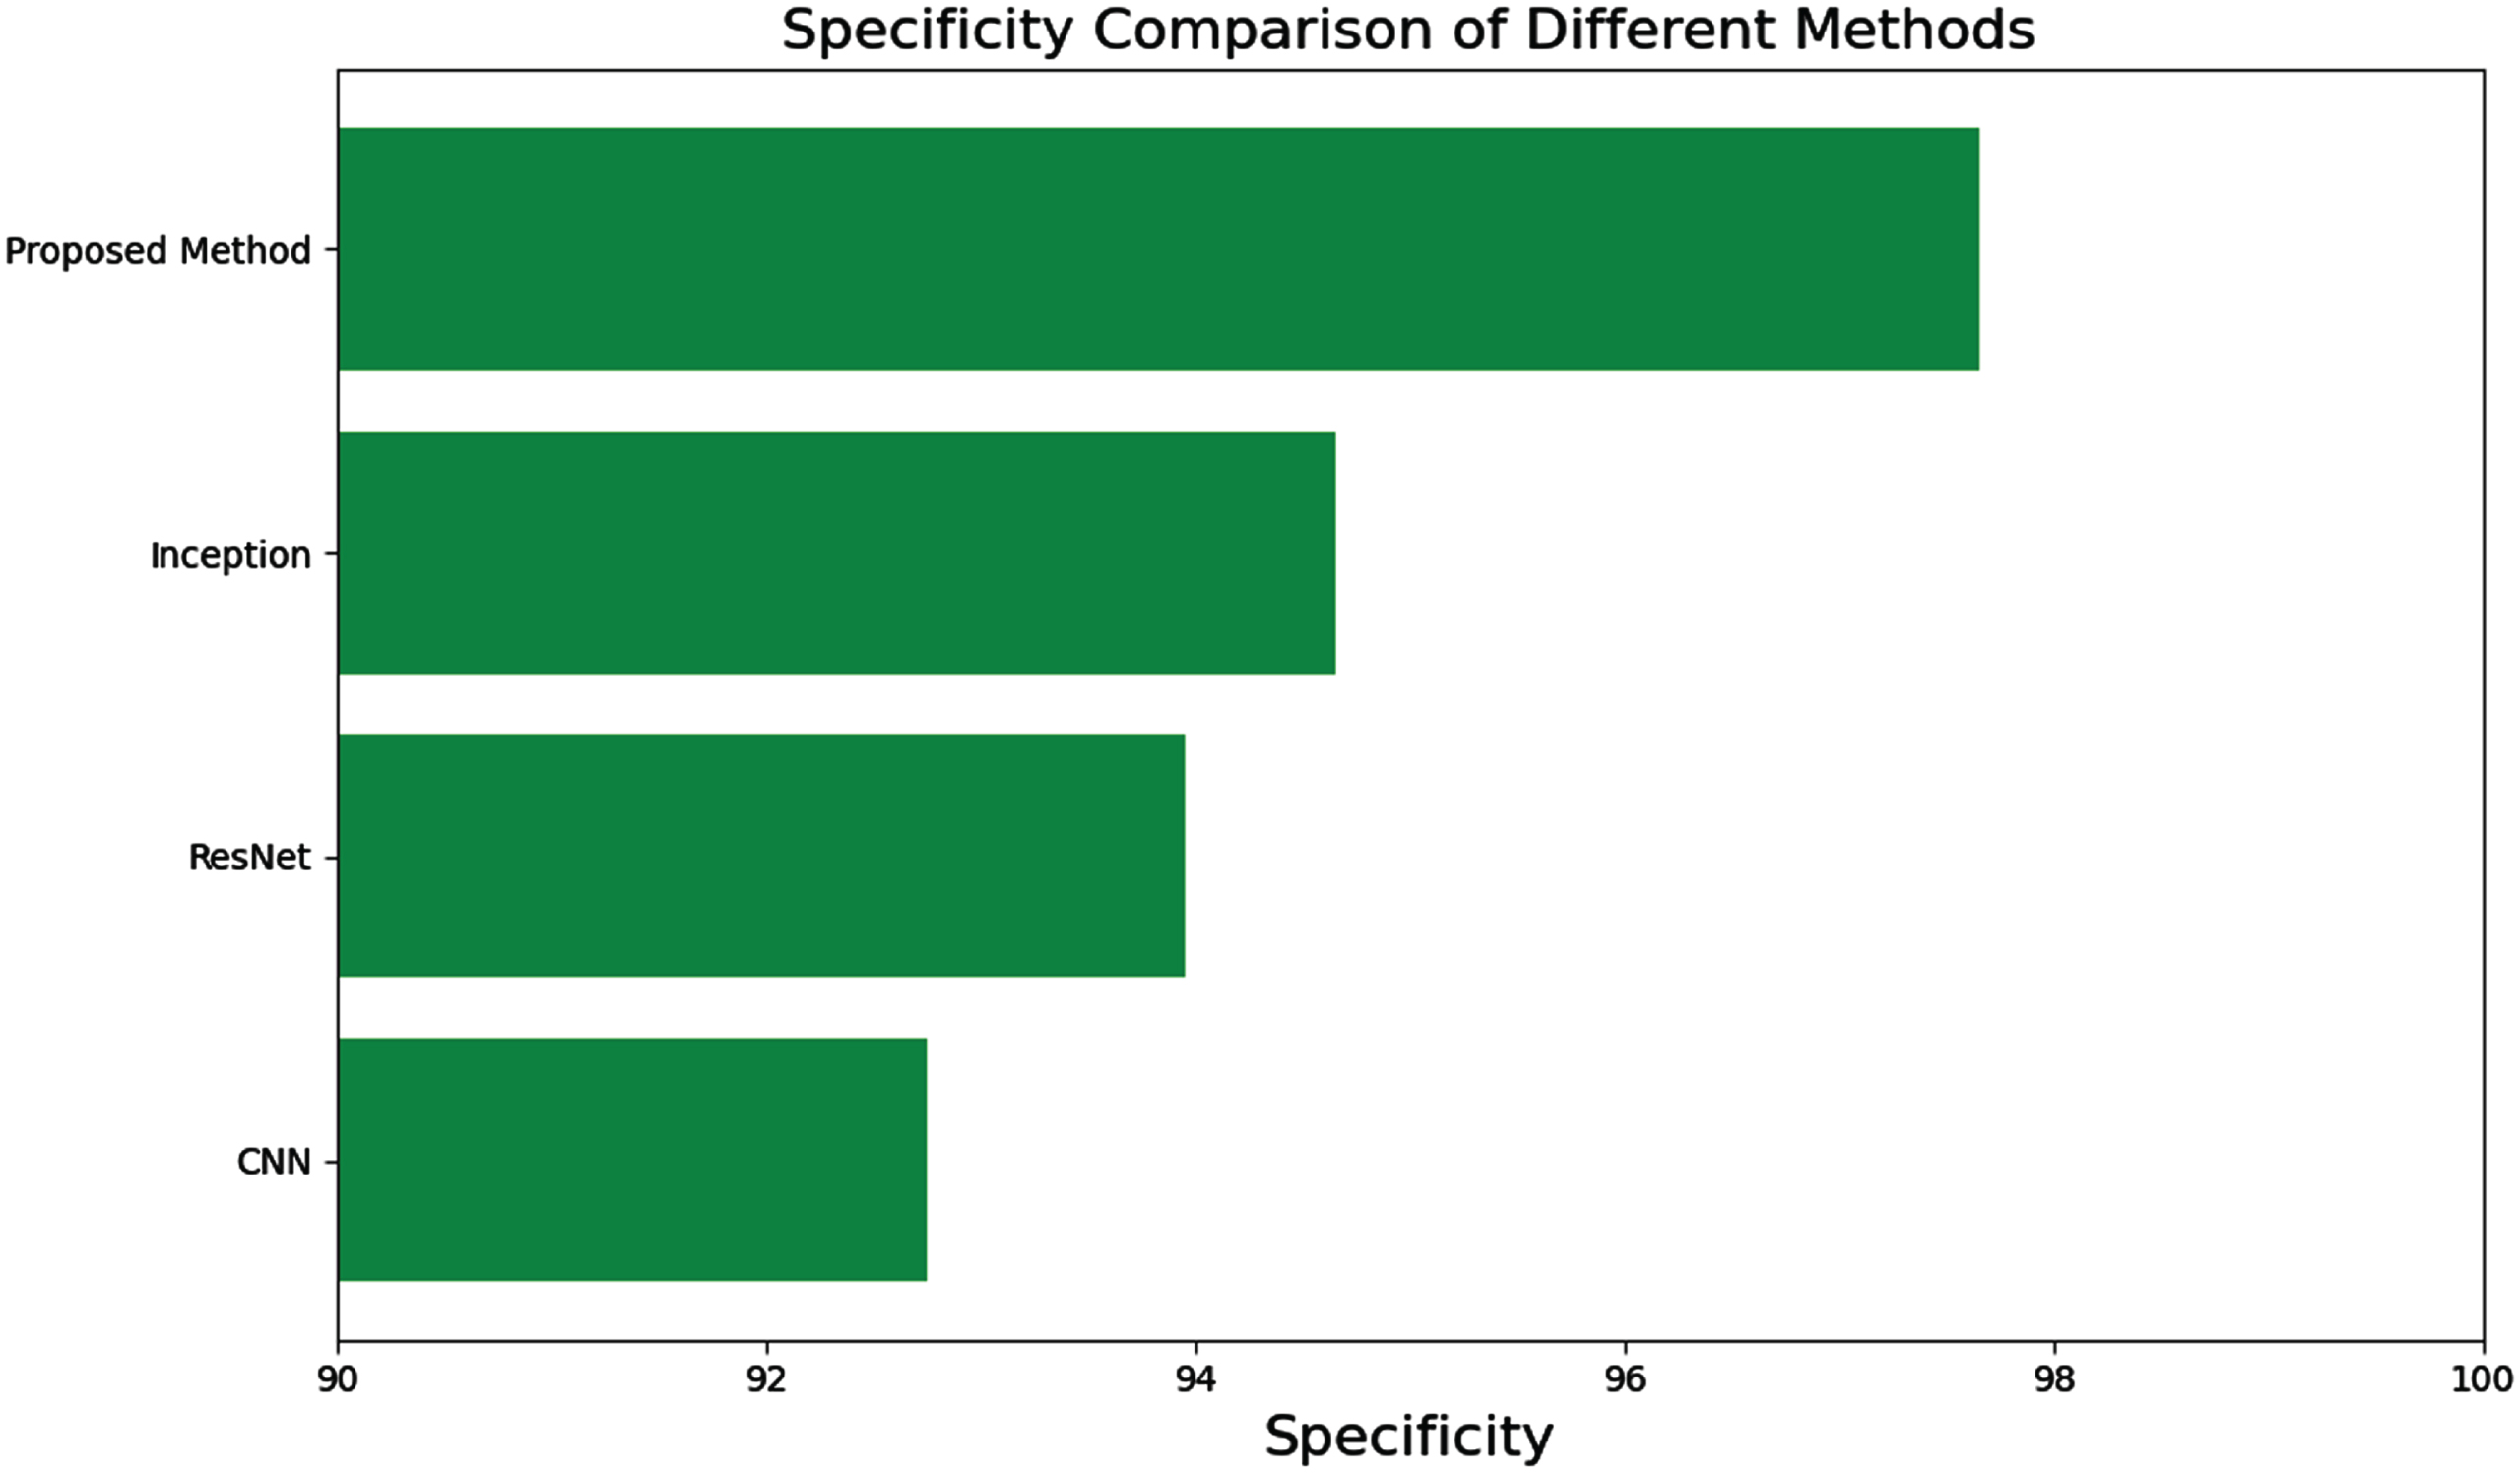
Specificity comparison of various models.
Accuracy in Fig. 14, which measures the overall correctness of classifications, reiterates the superiority of the Proposed Method, achieving an accuracy score of 98.12, signifying its exceptional overall performance. CNN, ResNet, and Inception recorded accuracy scores of 92.14, 90.25, and 93.41, respectively, indicating their capacity to provide accurate classifications but not at the same level as the Proposed Method.

Accuracy comparison of various models.
Beyond performance metrics, the efficiency of these methods was evaluated in terms of training and testing times shown in Figs. 15 and Fig. 16. The Proposed Method stands out with the shortest training time, taking only 263 minutes, while CNN, ResNet, and Inception require more substantial training times of 381, 395, and 389 minutes, respectively. In terms of testing time, the suggested method is significantly more efficient, taking only 5 minutes, while CNN, ResNet, and Inception necessitate longer testing times of 15, 16, and 19 minutes, respectively. This efficiency makes the Proposed Method not only highly effective but also resource-efficient, which can be crucial in real-world applications where computational resources are a concern.

Training time comparison of various models.

Testing time comparison of various models.
In summary, the performance metrics and efficiency evaluation collectively demonstrate the superior capabilities of the Proposed Method among the four evaluated methods. Its remarkable AUC, Kappa, sensitivity, specificity, and accuracy scores underscore its exceptional performance in classification tasks. Additionally, its efficiency in terms of training and testing times positions it as a highly effective and resource-efficient choice. While CNN, ResNet, and Inception also exhibit competence in various aspects, they fall short of matching the overall excellence demonstrated by the Proposed Method, making it the top-performing and efficient choice among the options considered.
The precise distribution of expected output results for input photos displaying the four unique retinal states is depicted in a confusion matrix, as shown in Fig. 17. Confusion matrix analysis shows how well the model can classify these photos into the various retinal disease categories.

Confusion matrix.
The receiver operating characteristic curve (ROC curve) depicted in Fig. 18 shows the compromise among the sensitivity and (1-Specificity) parameters of the model proposed in this study.

ROC curve.
In this Table 5 and Fig. 19, there are four deep learning models: CNN, ResNet, Proposed, and Inception. These models are evaluated based on several key metrics. The “Payoff Function” represents the effectiveness or performance of each model, where the “Proposed” model stands out with the highest score, indicating its superior performance. “Revenue (B)” and “Cost Components (B)” provide financial insights, with the “Proposed” model generating the highest revenue, albeit with the highest costs. The “Quality of Healthcare” category offers a qualitative perspective on how these models impact healthcare quality, with the “Proposed” model delivering “Very High” quality, while “Inception” offers “Low” quality healthcare. This dataset allows for a comprehensive comparison of these models, considering their performance, financial implications, and healthcare quality, enabling stakeholders to make informed decisions based on these factors.
Game-theoretic analysis of various deep learning models

Comparison of deep learning models.
The proposed deep learning model underwent extensive statistical testing. Accuracy, sensitivity, specificity, creating a confusion matrix, precision, F1-score, and Area Under the Curve (AUC) were among the key measurements computed. Sensitivity, which measures how well a model can distinguish between false positives and true positives, was used to assess the model’s performance. Specificity was evaluated by counting the number of correct negative outcomes as a percentage of all negative data points. By contrasting the proportion of correct predictions with the proportion of incorrect predictions, were able to generate a ROC curve that represents the true positive rate vs the false positive rate seen during model evaluation. A bigger AUC indicates superior effectiveness of the model. The next step was to determine the kappa value; a greater kappa value indicates a more precise model. These measures helped verify the model’s performance and attributes, while also allowing for straightforward comparisons to other models and previous studies.
This study presents an extensive approach that utilizes retinal OCT images to improve the accuracy and reliability of retinal disease detection. A thorough methodology that provides improved accuracy, dependability, and security in illness diagnosis has been established through the combination of deep neural networks, game theory, and sophisticated image processing techniques. Highly accurate illness classification is possible because of deep learning’s capability, especially when GANs and the Inception model are used to extract discriminative characteristics from OCT images. By adding game-theoretic analysis, the diagnostic tool’s practical value in real-world clinical settings is increased by ensuring its resilience and dependability against potential hostile attacks. By improving contrast, lowering noise, and using edge detection to find pertinent features, the whole image pre-treatment pipeline prepares OCT pictures for analysis. Pre-processing enhances the quality of the input data and expedites the procedures of feature extraction and classification that follow. By using GANs for dynamic categorization, the diagnostic process gains a strategic component that makes it possible to spot minute details and patterns in retinal pictures. This improves the model’s capacity to adjust to changes in how diseases manifest, which improves diagnostic accuracy. With OCT pictures, the GIGT hybrid model has a strong diagnostic ability to detect retinal illnesses; however, before it can be used clinically, a few issues need to be resolved. These include a lack of data, difficulties using deep learning models in real-world settings, difficulties with the interpretability of these models, susceptibility to adversarial assaults, the need for thorough validation and approval from regulators, computational needs that demand a lot of resources, and ethical problems. To improve the diagnosis and treatment of retinal illnesses while maintaining patient welfare and legal requirements, these obstacles must be overcome. Doing so will guarantee the model’s dependability, safety, and ethical application in clinical settings. The approach seems promising for several potential applications in the future. It may be incorporated into currently used clinical procedures to help ophthalmologists identify retinal illnesses early and accurately, which would enable prompt treatment as well as planning. This flexible architecture for automated diagnostic and decision support systems may be expanded to various medical imaging modalities and disease areas. The approach may be used as a starting point for more study and advancement in the field of healthcare artificial intelligence and medical image analysis. Patient outcomes may be enhanced, new obstacles in disease detection can be addressed, and contributions to the worldwide fight against retinal disorders and visual impairment can be made by continuously improving and expanding upon the technique. This work is a potential step forward in using artificial intelligence to improve healthcare, with implications for the detection of retinal diseases and other areas.
Author contributions
The authors confirm contribution to the paper as follows: study conception, Methodology, Investigation, Writing - Original Draft, Supervision: S. Vishnu Priyan; Software, Validation, Formal analysis: R. Vinod Kumar; Resources, Data Curation, Writing - Review & Editing: C. Moorthy; Visualization, Project administration, Funding acquisition: V.S. Nishok.
Conflict of interest
The authors declare no conflict of interest.
Data availability
All data analyzed during this study are included in this article.