
Abstract
Background:
Long noncoding RNA (LncRNA) TPT1-AS1 is an oncogene in ovarian cancer and cervical cancer, while its role in glioblastoma (GBM) is unknown. The bioinformatics analysis in this study showed that miR-23a-5p may bind to TPT1-AS1. This study was performed to investigate the interactions between miR-23a-5p and TPT1-AS1 in GBM.
Materials and Methods:
A total of 60 GBM patients (40 males and 20 females, 24 to 60 years old, mean age 41.7 ± 7.8 years old) were enrolled at the First Hospital of Jilin University between April 2016 and April 2018. Gene expression levels were determined by qPCR and Western blot. Cell transfections were performed to analyze the interactions between TPT1-AS1, miR-23a-5p, and extracellular matrix protein 1 (ECM1). Cell proliferation was detected by cell proliferation assay.
Results:
The authors found miR-23a-5p was downregulated in GBM and TPT1-AS1 was upregulated in GBM, whereas the expression of these two was not significantly correlated. In GBM cells, overexpression of TPT1-AS1 did not affect the expression of miR-23a-5p, but upregulated ECM1. In cell proliferation assay, overexpression of TPT1-AS1 and ECM1 resulted in increased proliferation rate of GBM cells. Overexpression of miR-23a-5p attenuated the effects of overexpressing TPT1-AS1.
Conclusions:
TPT1-AS1 may sponge miR-23a-5p in GBM to promote cancer cell proliferation by upregulating ECM1.
Introduction
Glioblastoma (GBM) is a type of malignancy that develops from astrocytes and is a major subtype of cancer in the spinal cord and brain. 1 Although GBM is a rare type of malignancy that only affects <4 per 100,000 people, it is a stage IV tumor that has an unacceptably high mortality rate. 2,3 It has been estimated that the median survival time of GBM patients after standard treatment, such as chemotherapy and radiotherapy, is only about 11–13 months, and only <5% of patients can live longer than 5 years. 4,5 Therefore, more effective and safer therapeutic approaches are always needed.
Molecular factors are critical players in the development and progression of GBM. 6 –8 Functional analysis on the roles of molecular pathways involved in GBM promotes the development of targeted therapy, which focuses on the regulation of cancer-related gene expression to suppress cancer development. 9 Besides protein-coding genes, noncoding RNAs (ncRNAs), such as miRNAs and long (>200nt) ncRNAs (lncRNAs), also have critical functions in cancer biology. 10 –12 Analysis of the functions of ncRNAs in cancer biology provides novel targets for cancer therapy. 10 –12 However, the functions of most lncRNAs in cancer remain elusive. LncRNA TPT1-AS1 has been characterized as an oncogenic lncRNA in epithelial ovarian cancer and cervical cancer, 13,14 whereas its involvement in GBM remains unknown. The bioinformatics analysis in this study showed that TPT1-AS1 may interact with miR-23a-5p, which is a tumor-suppressive miRNA that targets extracellular matrix protein 1 (ECM1), an oncogene with putative functions in enhancing cancer cell proliferation, angiogenesis, and differentiation. 15 This study aimed to investigate the interactions between TPT1-AS1 and miR-23a-5p in GBM.
Materials and Methods
GBM patients and specimen collection
This study was approved by the Ethics Committee of the First Hospital of Jilin University. A total of 60 patients with GBM (40 males and 20 females, 24 to 60 years old, mean age 41.7 ± 7.8 years old) were enrolled at the aforementioned hospital between April 2016 and April 2018. All GBM were newly diagnosed cases and the diagnosis was performed by CT scan and MRI. Pathological diagnosis was also performed to confirm GBM. No other severe clinical disorders were observed. No therapy was initiated. Biopsy was performed on all 60 patients to collect both GBM and adjacent (within 3 cm around tumors) nontumor tissues. All tissue samples were stored in liquid nitrogen before use. All patients signed written informed consent.
GBM cells and transfections
Human GBM cell line U87 from ATCC were used. Cell culture medium was composed of 10% FBS and 90% DMEM. Cell culture conditions were 37°C, 95% humidity, and 5% CO2. Negative control (NC) miRNA and miR-23a-5p mimic were obtained from Sigma-Aldrich. TPT1-AS1 and ECM1 expression vectors were established with pcDNA3.1 vector (Sigma-Aldrich) as the backbone. U87 cells were harvested at about 85% confluence and lipofectamine 2000 (Thermo Fisher Scientific) was used to transfect 10 nM vector or 45 nM miRNA into cells. Untransfected cells were used as the Control (C) group. NC group included NC miRNA- or empty vector-infected cells. The following experiments were performed 48 h post-transfection.
Dual-luciferase reporter assay
Luciferase reporter vector of TPT1-AS1 was constructed using pGL3 vector (Promega Corporation) as the backbone. Lipofectamine 2000 was used to cotransfect TPT1-AS1 and NC miRNA (NC group) or TPT1-AS1 and miR-23a-5p mimic (miR-23a-5p group) into U87 cells. Luciferase activity was measured using the Luciferase Reporter Assay Kit I (Firefly; PromoCell) at 48 h post-transfection.
RNA-RNA interaction prediction
The interaction between TPT1-AS1 and miR-23a-5p was predicted using IntaRNA 2.0. 16 The long sequence used was TPT1-AS1 and the short sequence was miR-23a-5p.
RNA preparations
Total RNAs were isolated from tissue samples and U87 cells using RNAzol reagent (Sigma-Aldrich). RNA precipitation and washing were performed using 85% ethanol to harvested miRNA. Genomic DNA was removed by DNase I (Sigma-Aldrich) digestion.
RT-qPCR assay
RNA samples with satisfactory quality were subjected to reverse transcriptions using AMV reverse transcriptase (RIBOBIO) to prepare cDNA samples. qPCRs were performed to measure the expression levels of TPT1-AS1 and ECM1 mRNA using the BlazeTaq™ SYBR Green qPCR Mix (Genecopoeia) with GAPDH as endogenous control. Expression levels of mature miR-23a-5p were measured using the All-in-One™ miRNA qRT-PCR Reagent Kit (GeneCopoeia). U6 was used as the endogenous control of miR-23a-5p. All PCRs were repeated three times and expression levels were normalized using 2−ΔΔCT method.
Cell counting kit-8 assay
U87 cells collected 48 h post-transfection were subjected to Cell Counting Kit-8 (CCK-8) assay using a kit from Dojindo (Japan). Each well of a 96-well cell culture plate was filled with 3000 cells in 0.1 mL medium, followed by cell culture under aforementioned conditions. OD values were measured at 450 nm every 24 h for a total of 4 d. CCK-8 solution was added into each well to a final concentration of 10% 4 h before the measurement of OD values.
Western blot analysis
Cells were lysed with lysis buffer (20 mM KCl, 150 mM NaCl, 1% NP-40, 1% Triton X-100, 50 mM NaF, 50 mM Tris, 1 mM DTT, 1 mM EGTA, 1 × protease inhibitor, and 10% glycerol) for 1 h and centrifuged for 30 min at 4°C. Equal amounts of protein were separated on SDS-PAGE gels and transferred to PVDF membranes. After blocking with 5% nonfat milk, the membranes were incubated first with primary antibodies and then with secondary antibodies. Signals were detected using an ECL Kit (Bio-Rad).
Colony formation assay
A six-well plate containing solid medium (0.3% agar) was used to cultivate cells with 1000 cells per well. Cells were cultivated at 37°C for 4 h in a 5% CO2 incubator. After that, images were taken.
5-Ethynyl-2′-deoxyuridine immunofluorescence assay
Cells were cultivated for 2 h with 5-ethynyl-2′-deoxyuridine (EdU) solution and afterward the medium was removed. Thereafter, cells were fixed by PBS supplemented with 4% parastained Cell-Light™ EdU Apollo® 488 In Vitro Imaging Kit (RioBio, China).
Statistical analysis
Mean ± SEM values were used to express data of three biological replicates. Paired t test was used to compare differences between nontumor and GBM tissues. ANOVA (one-way) and Tukey's test were used to compare differences among multiple groups. Linear regression was used to analyze correlation. Unpaired t test was used to compare differences between two independent groups. p < 0.05 was statistically significant.
Results
Altered expression of miR-23a-5p and TPT1-AS1 in GBM
Expression levels of miR-23a-5p and TPT1-AS1 in both GBM and nontumor tissues were measured using RT-qPCR. Compared with nontumor tissues, the expression levels of miR-23a-5p were significantly lower in GBM tissues (Fig. 1A, p < 0.05). In contrast, the expression levels of TPT1-AS1 were significantly higher in GBM tissues compared with nontumor tissues (Fig. 1B, p < 0.05). Linear regression was performed to analyze the correlation between the expression levels of miR-23a-5p and TPT1-AS1. It showed that expression levels of miR-23a-5p and TPT1-AS1 were not significantly correlated across GBM (Fig. 1C) and nontumor (Fig. 1D) tissue samples.
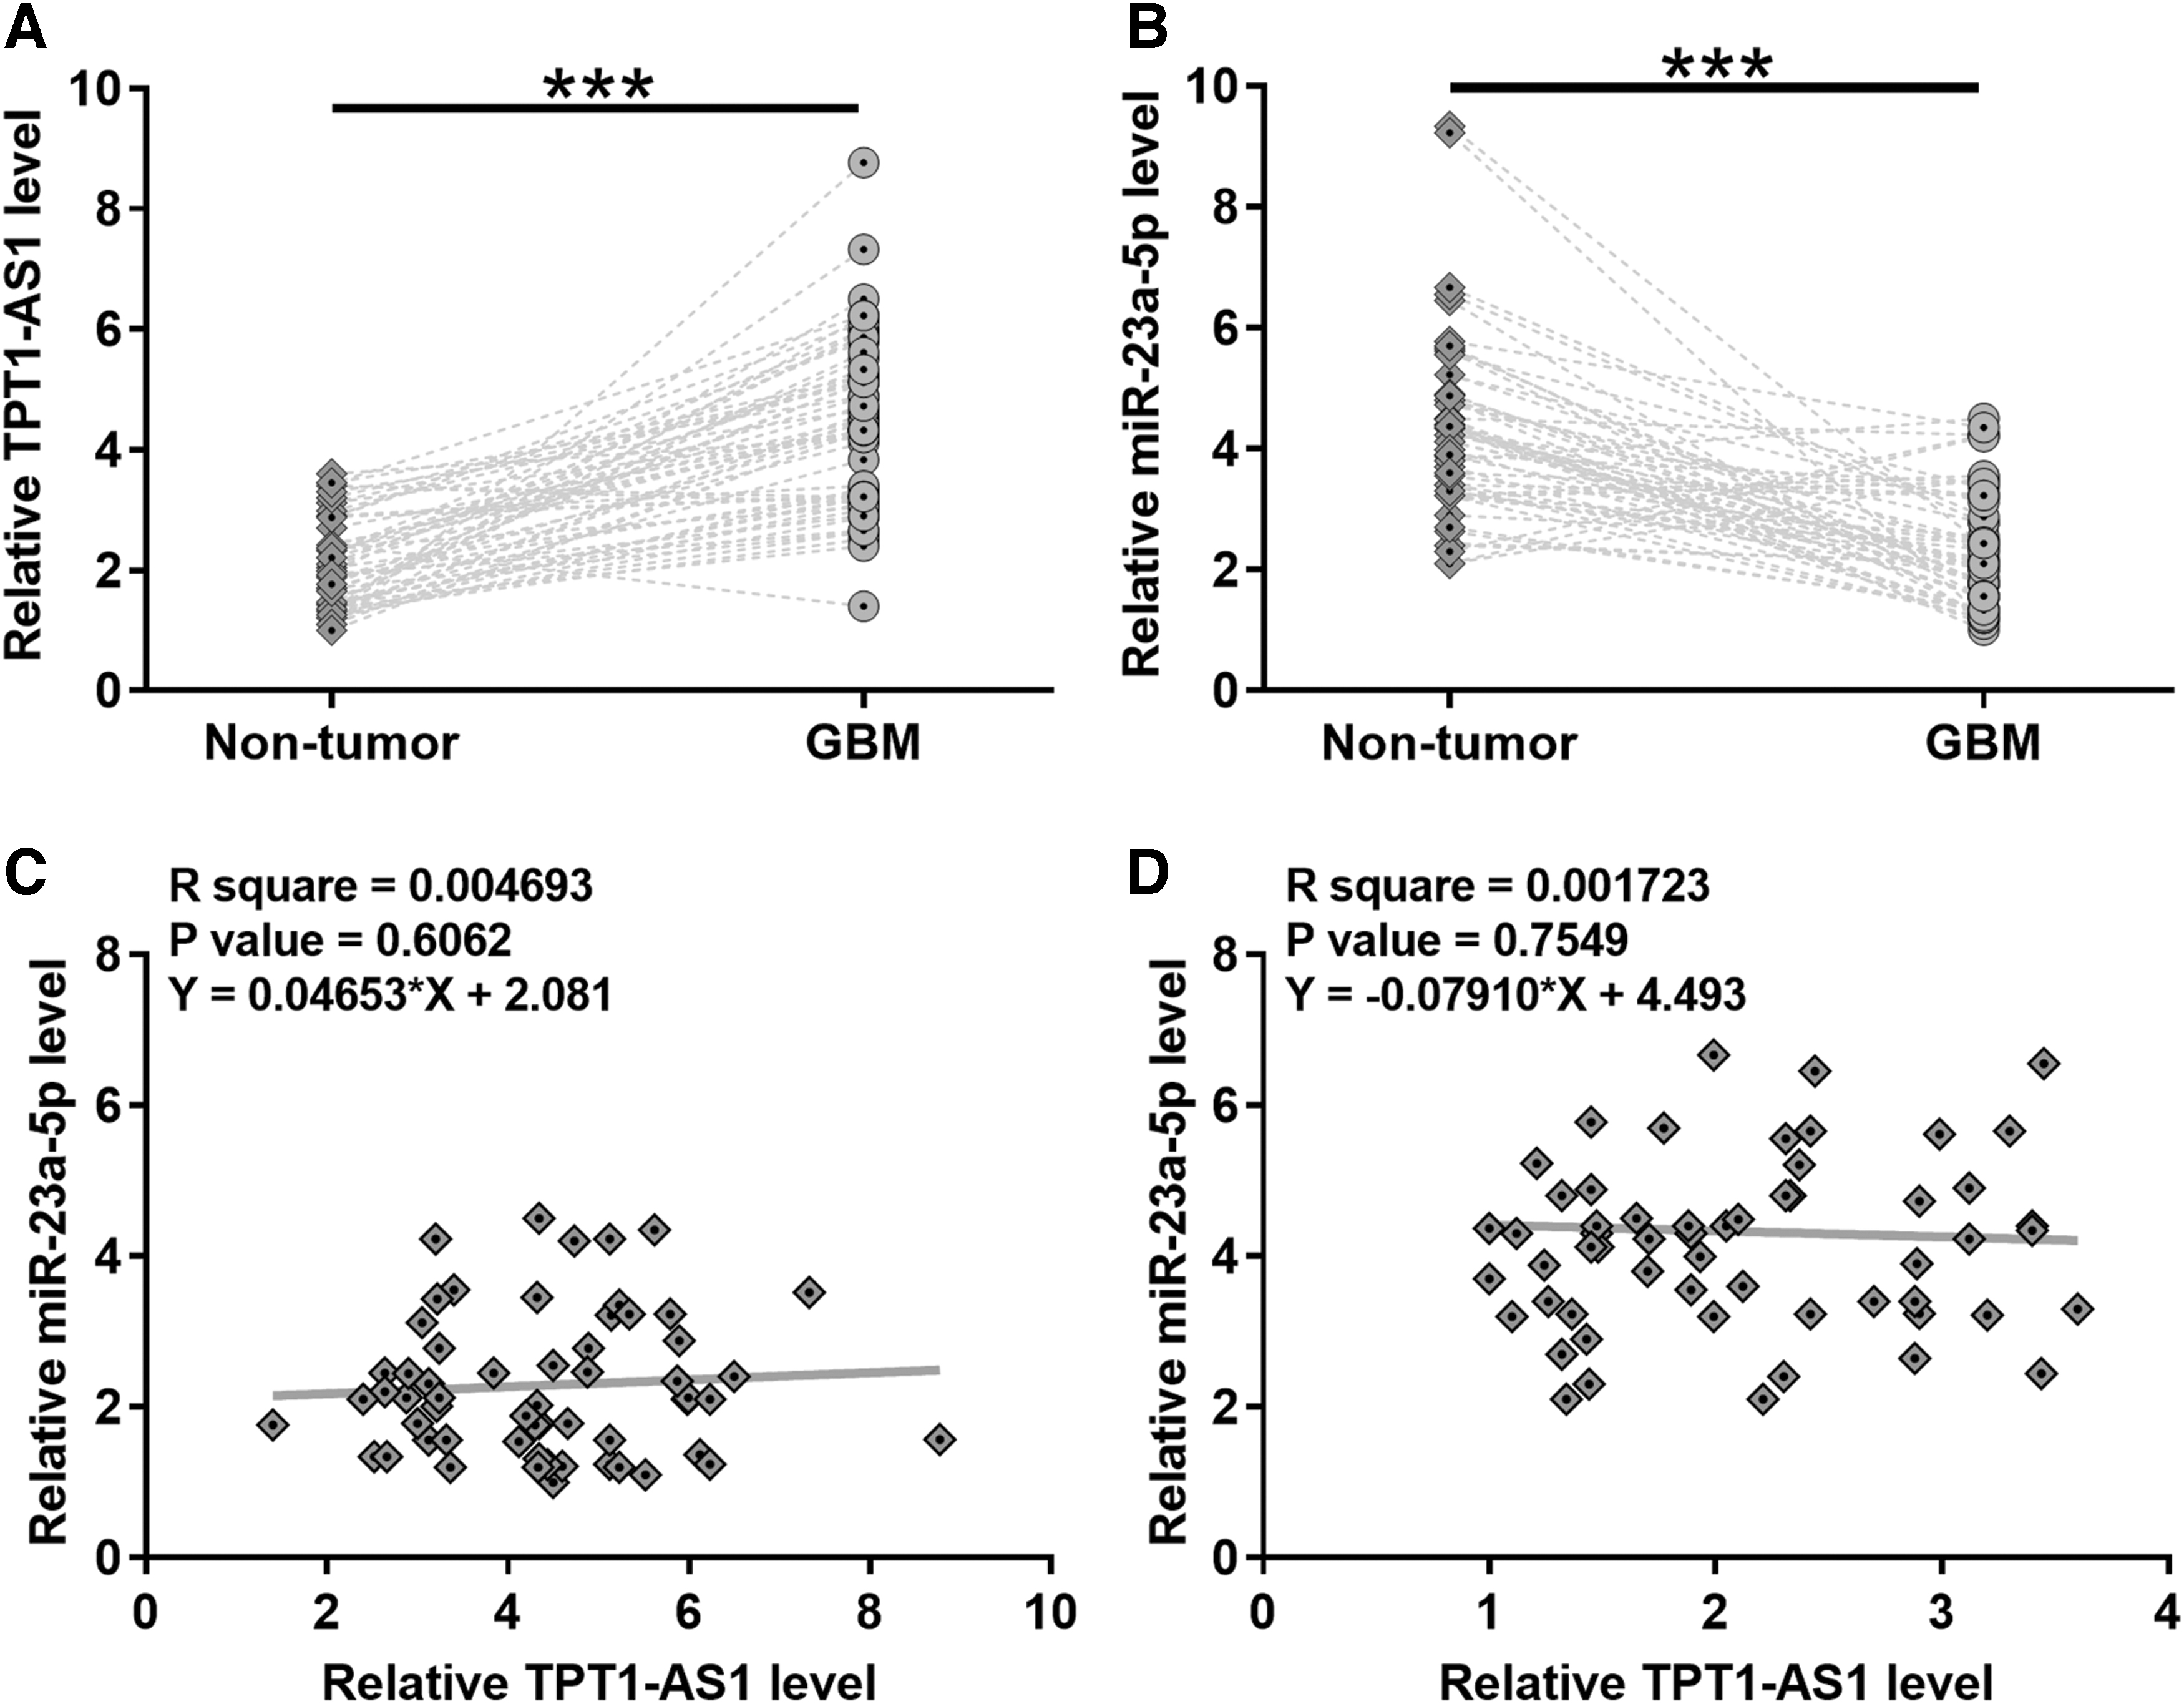
Altered expression of miR-23a-5p and TPT1-AS1 was observed in GBM. Expression levels of TPT1-AS1
TPT1-AS1 and miR-23a-5p interacted with each other but did not regulate the expression of each other
RNA/RNA interaction performed by IntaRNA 2.0 showed that TPT1-AS1 and miR-23a-5p could form multiple base pairs (Fig. 2A). Dual luciferase reporter assay was performed to analyze the interaction between TPT1-AS1 and miR-23a-5p. Compared with cells cotransfected TPT1-AS1 and NC miRNA (NC group), cells cotransfected with TPT1-AS1 and miR-23a-5p mimic (miR-23a-5p group) showed significantly lower relative luciferase activity (Fig. 2B, p < 0.05), indicating direct interaction between them. U87 cells were transfected with TPT1-AS1 expression vector or miR-23a-5p mimic, followed by confirmation of the overexpression of TPT1-AS1 and miR-23a-5p by RT-qPCR (Fig. 2C, p < 0.05). Compared with C and NC groups, overexpression of TPT1-AS1 and miR-23a-5p did not significantly affect the expression of each other (Fig. 2D). Furthermore, overexpression of TPT1-AS1 increased the expression of Ki67 (Fig. 2E).

TPT1-AS1 and miR-23a-5p interacted with each other but did not regulate the expression of each other. IntaRNA 2.0 was used to predict the interaction between TPT1-AS1 and miR-23a-5p
ECM1 was upregulated in U87 cells with the overexpression of TPT1-AS1
ECM1 is a downstream target of miR-23a-5p. Data presented above suggested the potential role of TPT1-AS1 as an endogenous sponge of miR-23a-5p. To test this possibility, effects of overexpressing TPT1-AS1 and miR-23a-5p on the expression of ECM1 were evaluated by RT-qPCR (Fig. 3A) and Western blot (Fig. 3B). Compared with C group, overexpression of miR-23a-5p led to downregulated ECM1 at both mRNA and protein levels (p < 0.05). In contrast, overexpression of TPT1-AS1 played an opposite role and attenuated the effects of overexpressing miR-23a-5p (p < 0.05).
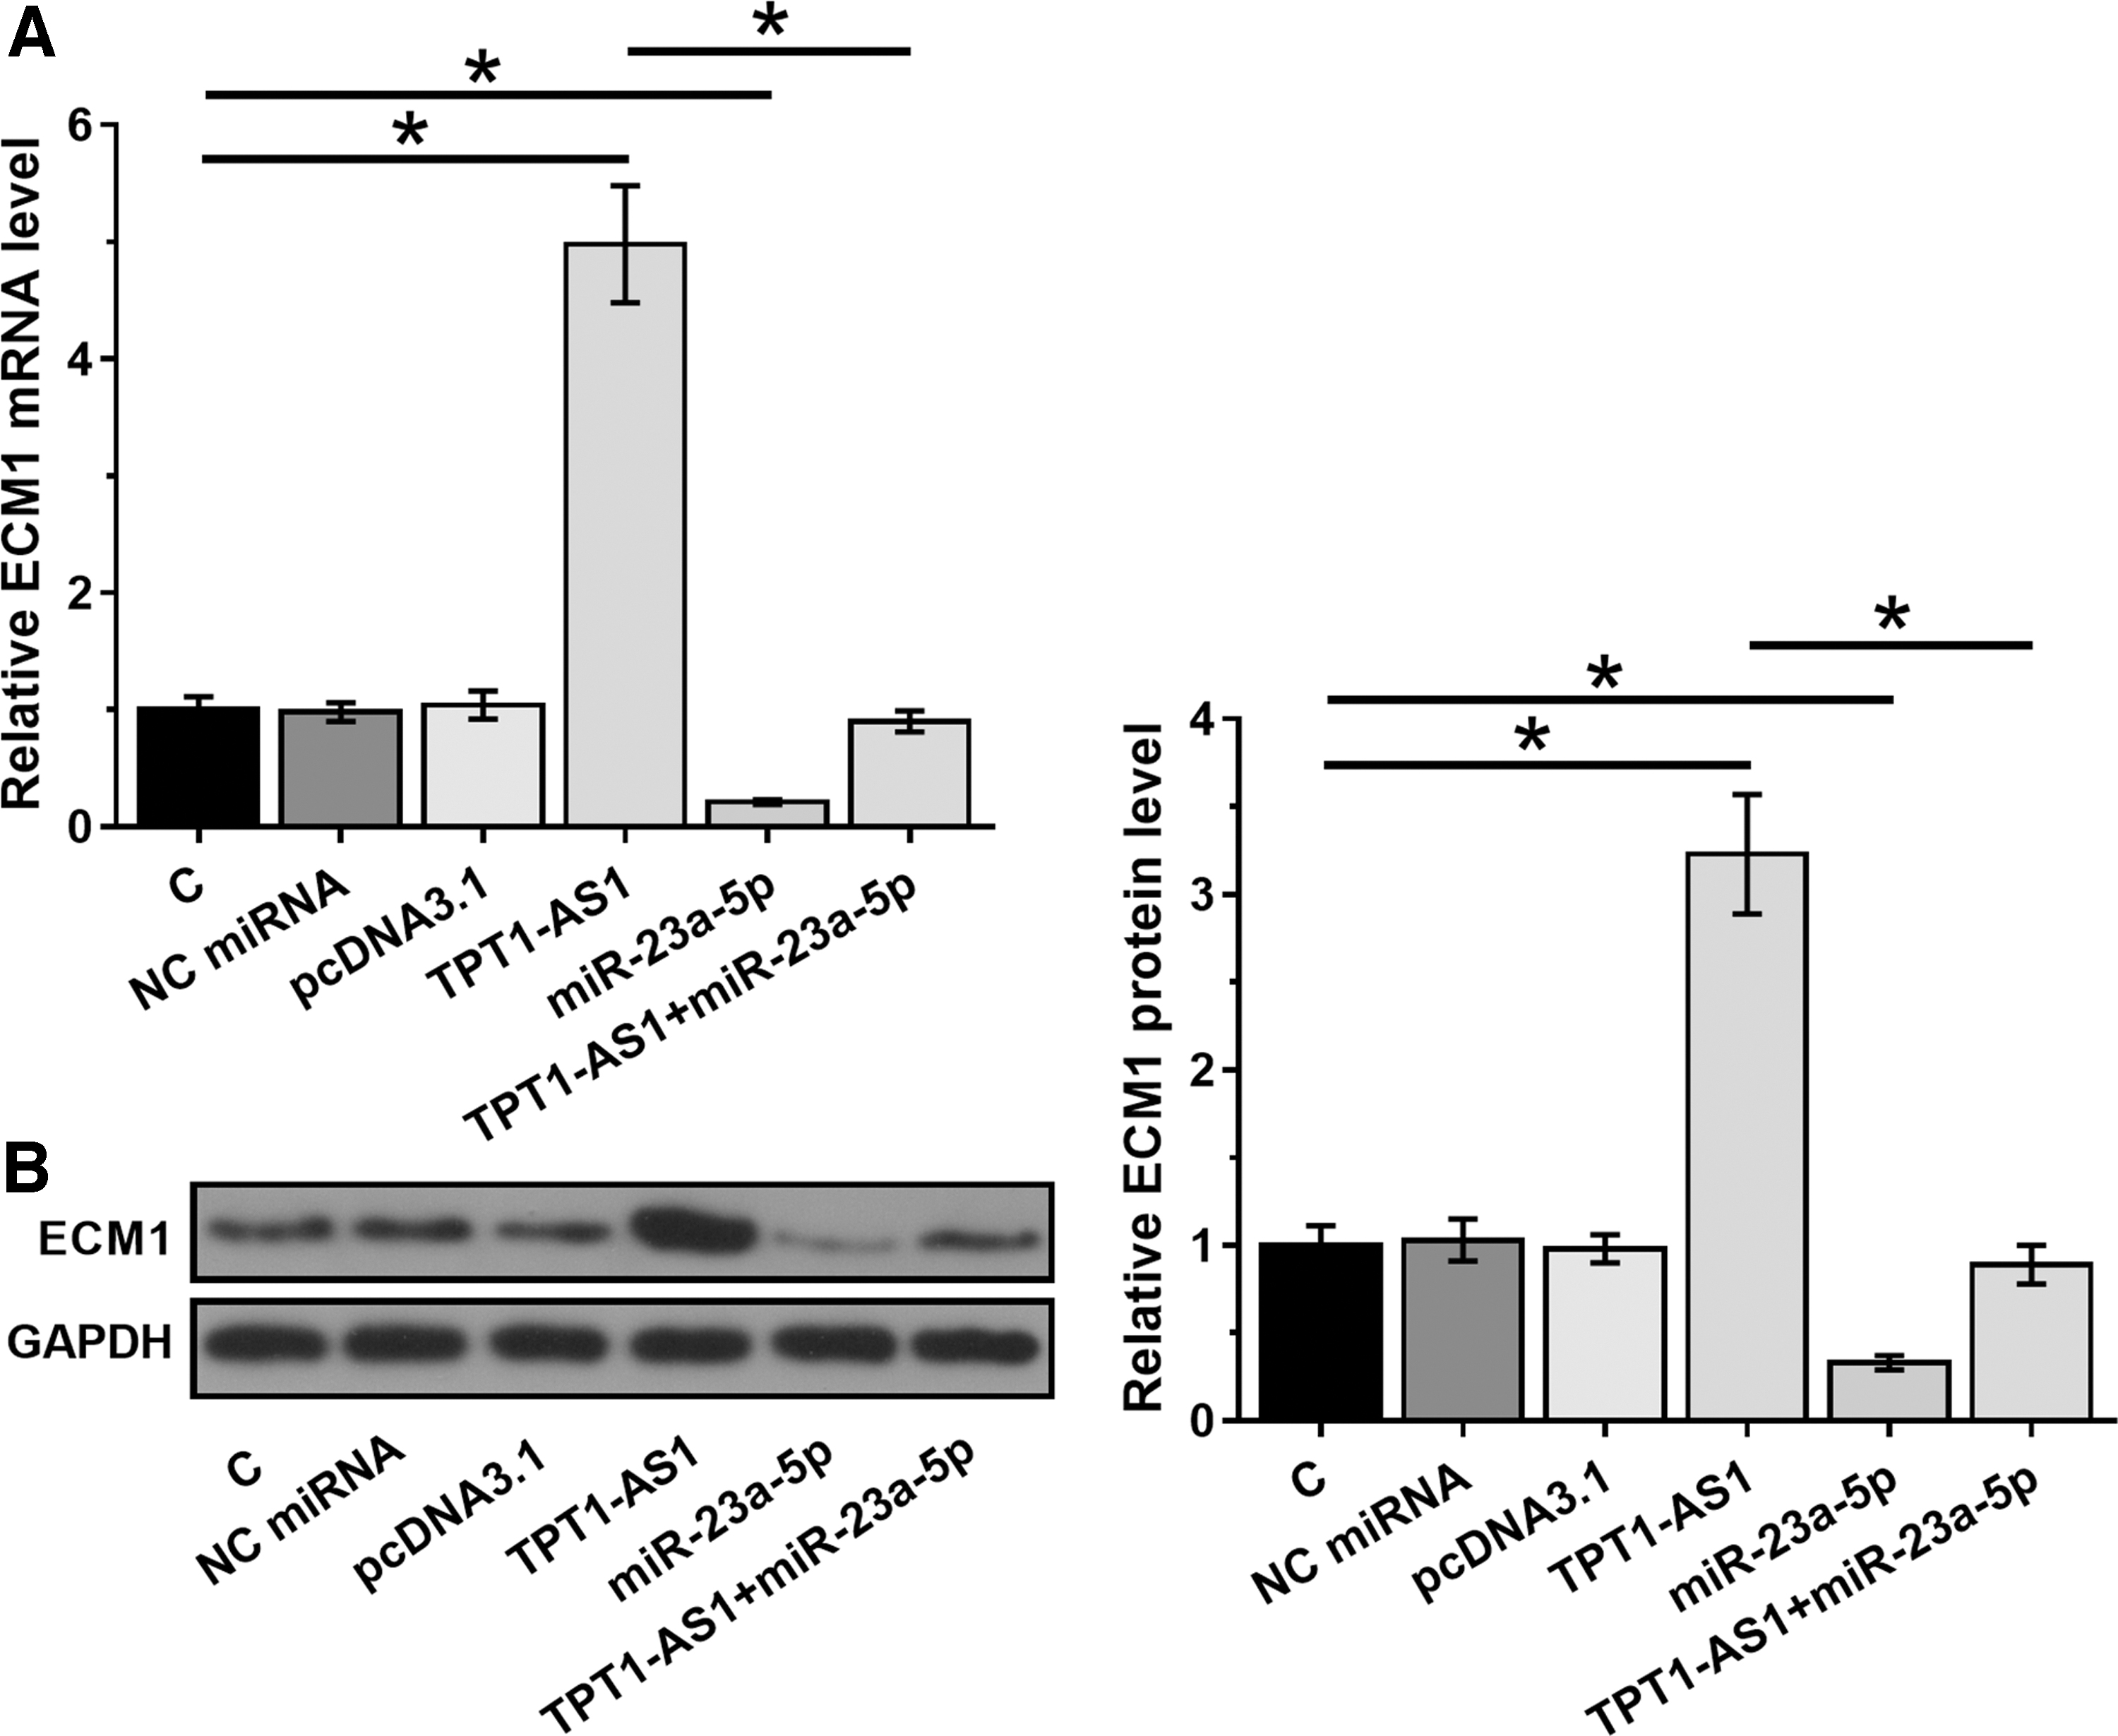
ECM1 was upregulated in U87 cells with the overexpression of TPT1-AS1. The effects of overexpressing TPT1-AS1 and miR-23a-5p on the expression of ECM1 were analyzed by RT-qPCR
TPT1-AS1 interacted with miR-23a-5p/ECM1 axis to promote the proliferation of U87 cells
The roles of TPT1-AS1, miR-23a-5p, and ECM1 in regulating U87 cell proliferation were evaluated by CCK-8 assay. Compared with C group, overexpression of TPT1-AS1 and ECM1 led to increased cell proliferation rate (Fig. 4A, p < 0.05). In contrast, overexpression of miR-23a-5p resulted in suppressed cell proliferation (p < 0.05). Moreover, overexpression of TPT1-AS1 significantly attenuated the effects of overexpressing miR-23a-5p on cell proliferation (p < 0.05), which was consistent with the expression level of proliferation marker KI67 (Fig. 4B), colony formation (Fig. 5), and EdU assay data (Fig. 6).

TPT1-AS1 interacted with miR-23a-5p/ECM1 axis to promote the proliferation of U87 cells. The roles of TPT1-AS1, miR-23a-5p, and ECM1 in regulating U87 cell proliferation were analyzed by performing CCK-8 assay
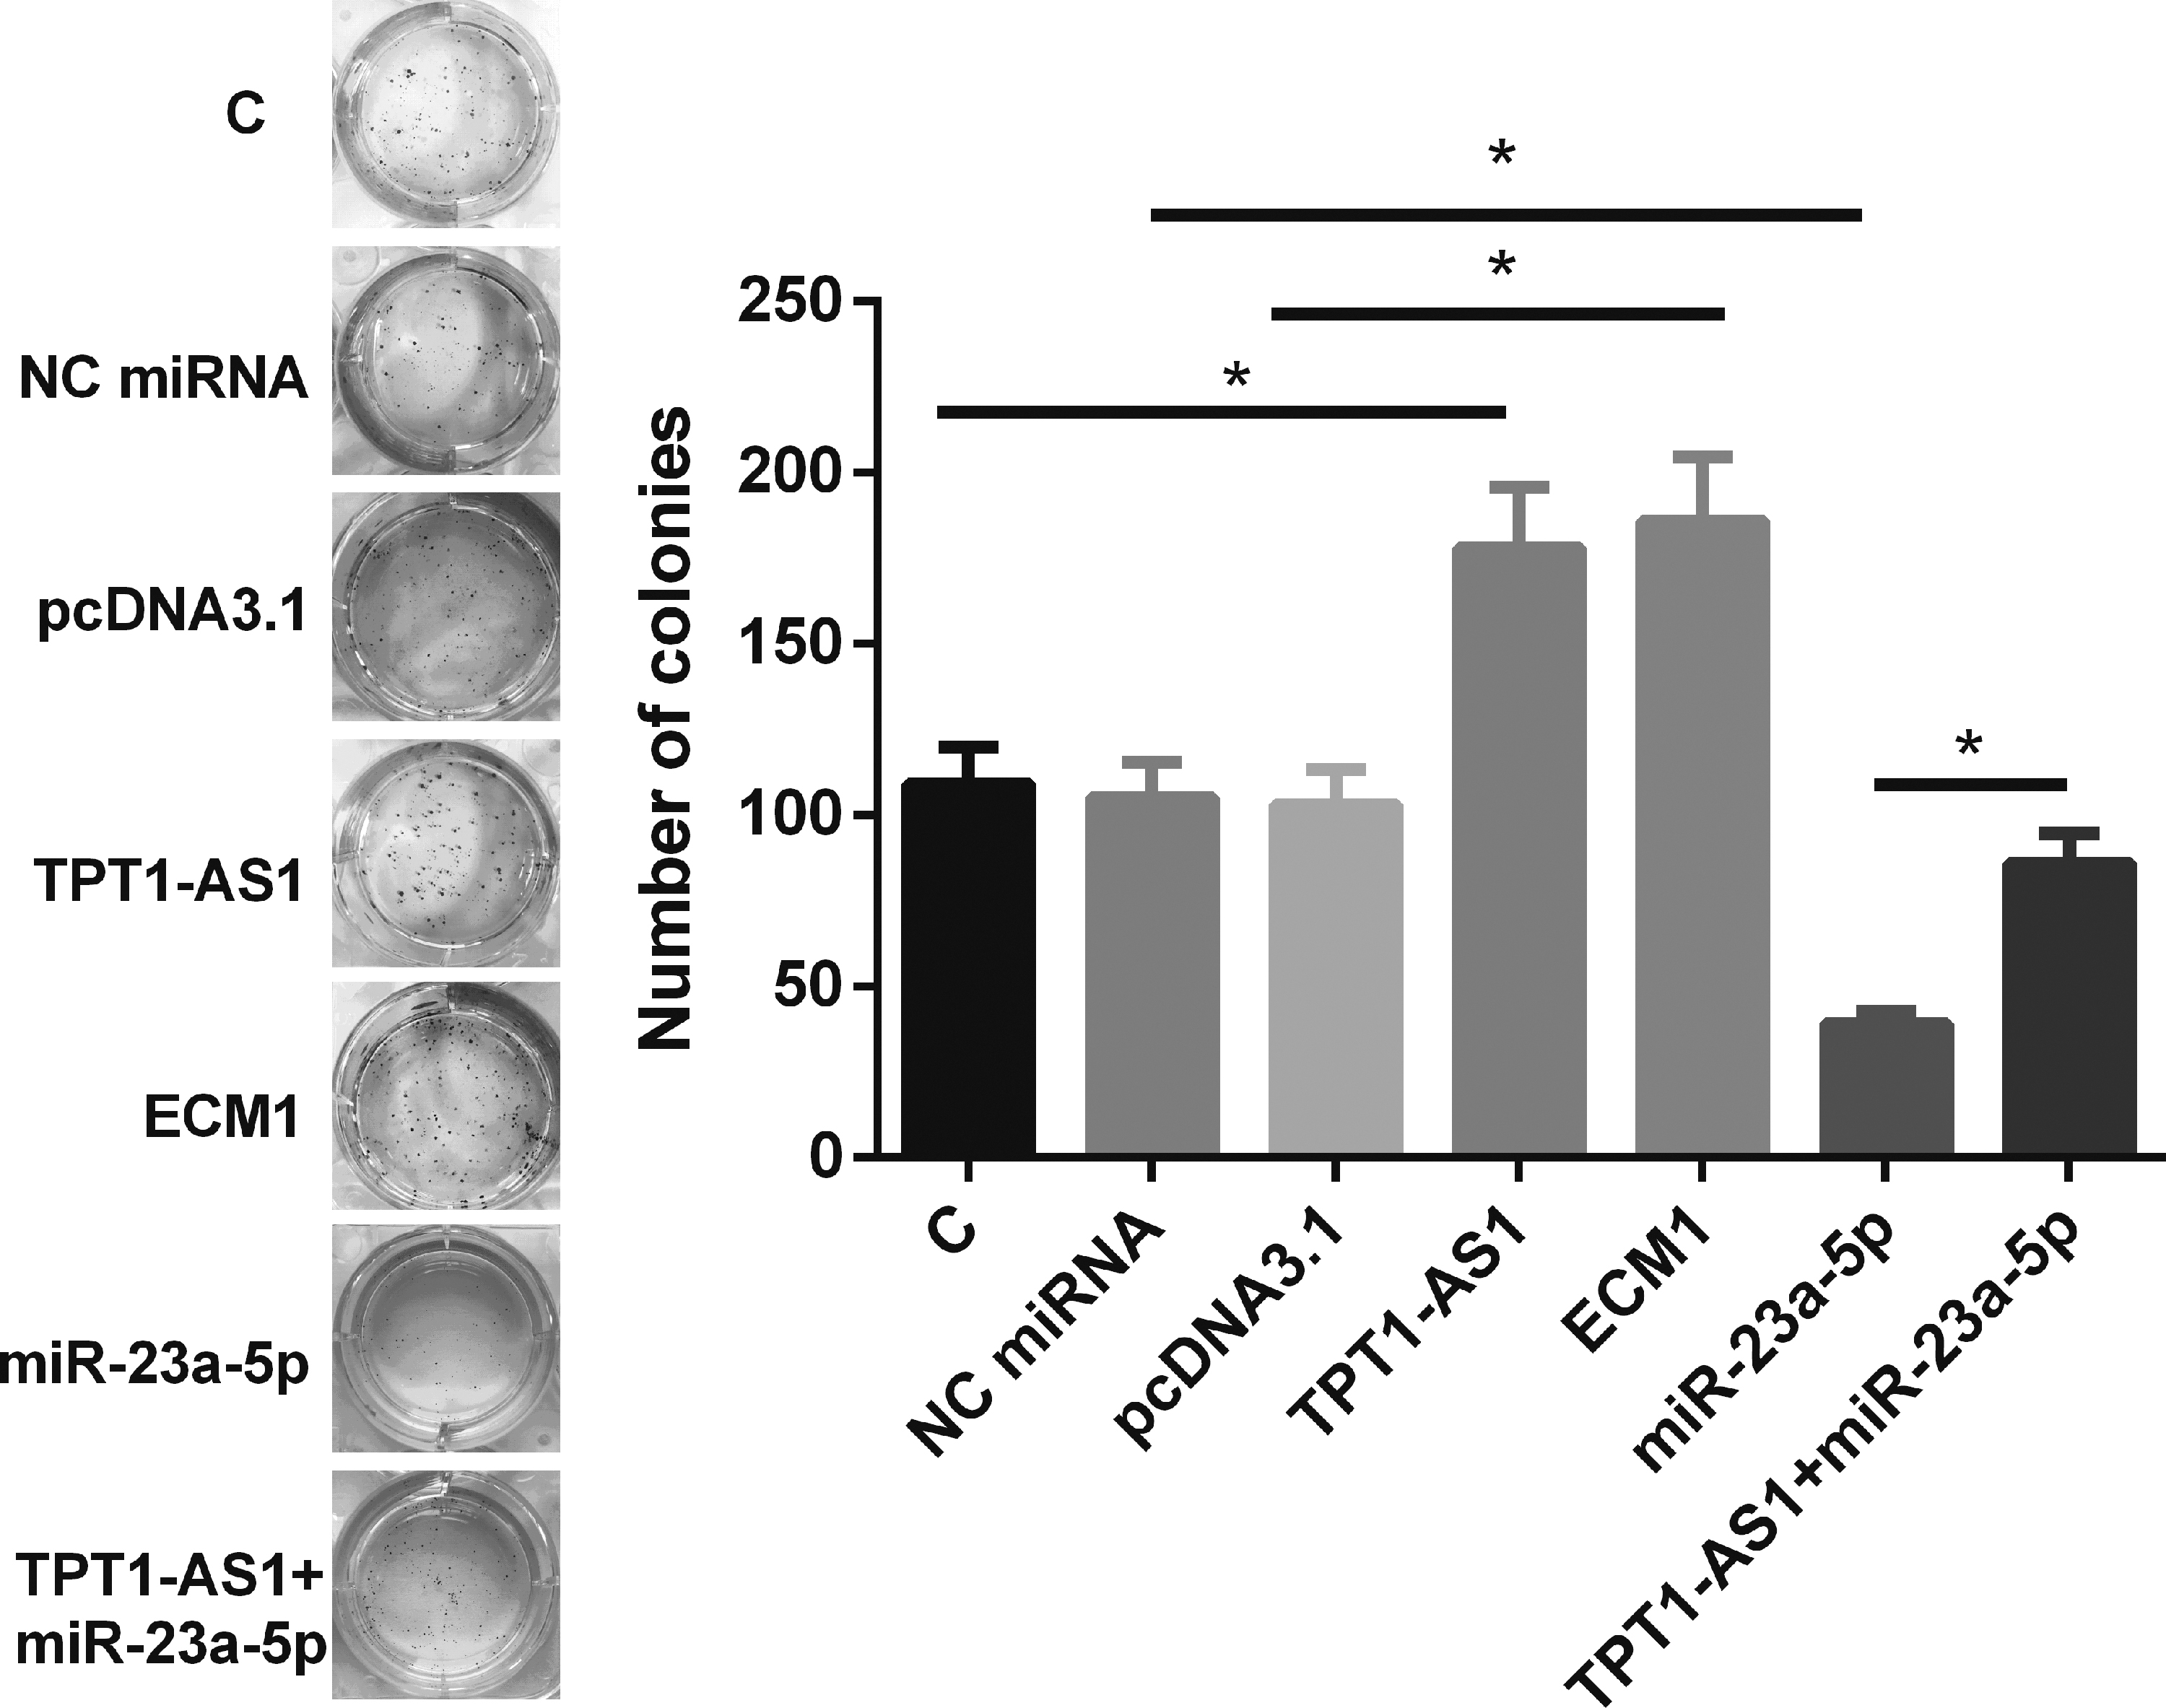
TPT1-AS1 interacted with miR-23a-5p/ECM1 axis to promote colony formation assay. The roles of TPT1-AS1, miR-23a-5p, and ECM1 in regulating colony formation were analyzed by colony formation assay. All experiments were performed in three biological replicates and mean values were compared. *p < 0.05. ECM1, extracellular matrix protein 1.
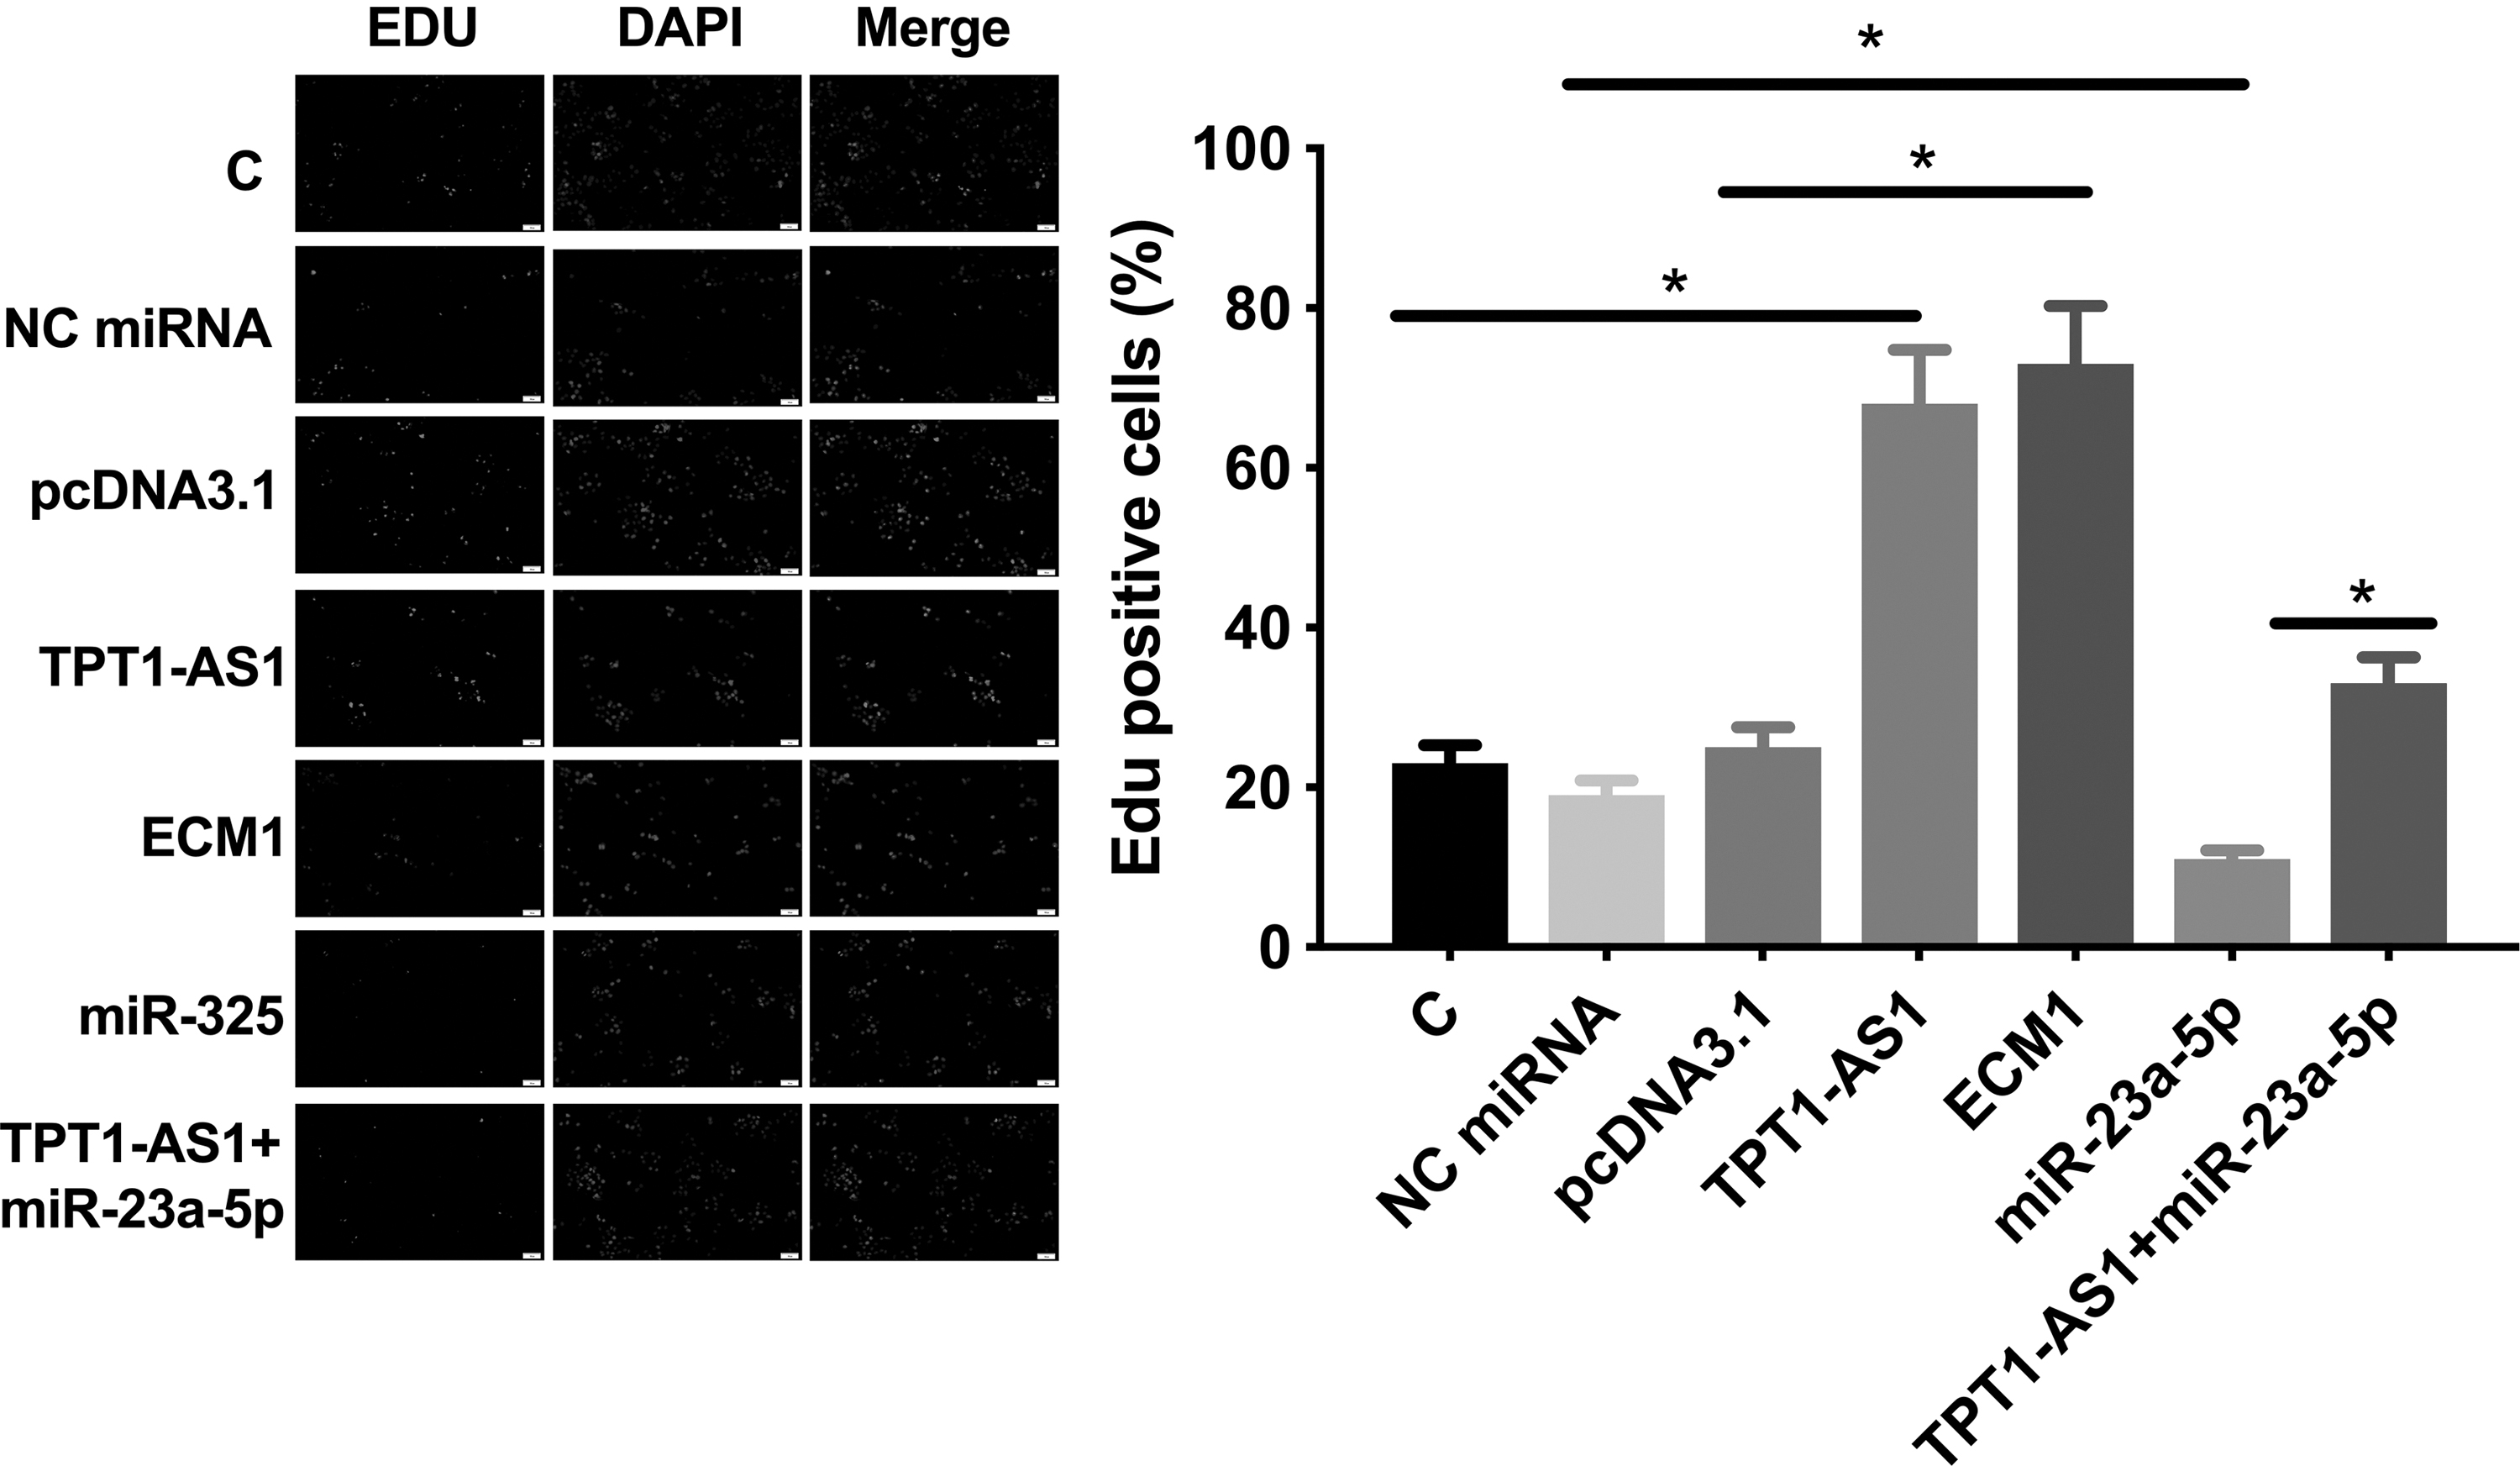
TPT1-AS1 interacted with miR-23a-5p/ECM1 axis to promote EdU assay. The roles of TPT1-AS1, miR-23a-5p, and ECM1 in regulating proliferation were analyzed by EdU assay. All experiments were performed in 3 biological replicates and mean values were compared. *p < 0.05. ECM1, extracellular matrix protein 1; EdU, 5-ethynyl-2′-deoxyuridine.
Discussion
In this study, the authors investigated the interaction among TPT1-AS1, miR-23a-5p, and ECM1 in GBM. They found that TPT1-AS1 was upregulated in GBM and might upregulate ECM1 by sponging miR-23a-5p to promote cancer cell proliferation.
The functionality of TPT1-AS1 has only been investigated in epithelial ovarian cancer and cervical cancer. 13,14 In epithelial ovarian cancer, TPT1-AS1 is overexpressed and induces the expression of TPT1 to promote cancer metastasis. 13 In cervical cancer, TPT1-AS1 is also overexpressed and can sponge miR-324-5p to promote the metastasis and growth of tumors. 14 Their study is the first to report the overexpression of TPT1-AS1 in GBM. In addition, these data proved that TPT1-AS1 could promote the proliferation of GBM cells. Therefore, TPT1-AS1 is likely an oncogenic lncRNA in GBM.
MiR-23a-5p plays different roles in different types of cancers. 15,17 For instance, miR-23a-5p is downregulated in pancreatic ductal adenocarcinoma and may suppress the expression of ECM1 to inhibit cancer cell invasion and proliferation. 15 In contrast, miR-23a-5p is overexpressed in renal cell carcinoma and promotes cancer cell proliferation. 17 The functionality of miR-23a-5p in GBM is unknown. This study showed that miR-23a-5p was downregulated in GBM and suppressed cancer cell proliferation. Therefore, miR-23a-5p is likely a tumor suppressor in GBM.
Both bioinformatics analysis and dual luciferase activity assay in the present study showed that miR-23a-5p and TPT1-AS1 could interact with each other. However, their expression levels were not significantly correlated in GBM patients. In addition, overexpression of TPT1-AS1 and miR-23a-5p did not affect the expression of each other. Therefore, TPT1-AS1 is unlikely a downstream target of miR-23a-5p. Remarkably, overexpression of TPT1-AS1 attenuated the effects of overexpressing miR-23a-5p on both the expression of ECM1 and GBM cell proliferation. Therefore, TPT1-AS1 is likely an endogenous sponge of miR-23a-5p. ECM1 is a type of secreted glycoprotein that is usually overexpressed in malignant tumors and has putative oncogenic function in promoting cancer cell differentiation, proliferation, and angiogenesis, while the exact mechanism of its oncogenic function remains elusive. 18 However, further studies are still needed to explore other underlying mechanisms.
Conclusions
In conclusion, TPT1-AS1 is overexpressed in GBM and may upregulate ECM1 by sponging miR-23a-5p to promote cancer cell proliferation.
Footnotes
Ethics Approval and Consent to Participate
Ethics approval was obtained from the Ethics Committee of The First Hospital of Jilin University. The research has been carried out in accordance with the World Medical Association Declaration of Helsinki 2013. All patients understood the aims of specimen collection and signed written informed consent.
Authors' Contributions
X.G.: carried out the experimental work, data collection and interpretation, and article writing; Y.C. and J.L.: participated in the study design, data collection, analysis of data, and preparation of the article; C.W.: carried out the study design, analysis, and interpretation of data; H.H.: research design, project management, and article review. All authors read and approved the final article.
Disclosure Statement
No competing financial interests exist.
Funding Information
No funding was received for this article.