
Abstract
Abstract
A method of establishing feedforward control strategy by integrating off-line simulations and on-line controls was proposed to improve the nutrient removal efficiency of anaerobic–anoxic–oxic processes and to save energy associated with aeration and recirculation. An activated sludge/anaerobic digestion model was applied and calibrated to provide accurate simulation by which different operation conditions were tested. Set-points of the internal recycle, external recycle, and dissolved oxygen concentration were optimized through analyzing the results of the steady-state simulations. By matching the optimal operation conditions to different influent loads, several feedforward control strategies were developed. The simple structure of the strategies made them easy to be implemented in full-scale wastewater treatment plants. Nutrient removal efficiency of the strategies was further validated through dynamic simulation. Effluent quality and energy consumption under each operating strategy were evaluated. Results showed that the removal efficiency of total phosphorus increased from 56.2% to 67.2%, whereas the effluent ammonia and total nitrogen were always kept below predefined levels. Moreover, the aeration and internal recirculation had decreased by 8.5% and 3.4%, respectively.
Introduction
The objective of this research is to develop a simple control system for the anaerobic–anoxic–oxic (AAO) process in Xiaohongmen WWTP (X-WWTP). The system was expected to ensure the effluent quality within criteria and economize operating energy during most of the operation time. In the first part, the modeling of the target process was introduced. Subsequently, the method of establishing feedforward control strategies was described. Instead of simplified models, a complete model was used to predict the behavior of the process and several feedforward rules were concluded based on the simulation results. The optimal operation set-points corresponding to different influent loads were given out and could be achieved on the specific actuators through feedback control. To validate if the simple control system was effective for X-WWTP, the strategies were finally evaluated through dynamic simulations.
Methods
Process description
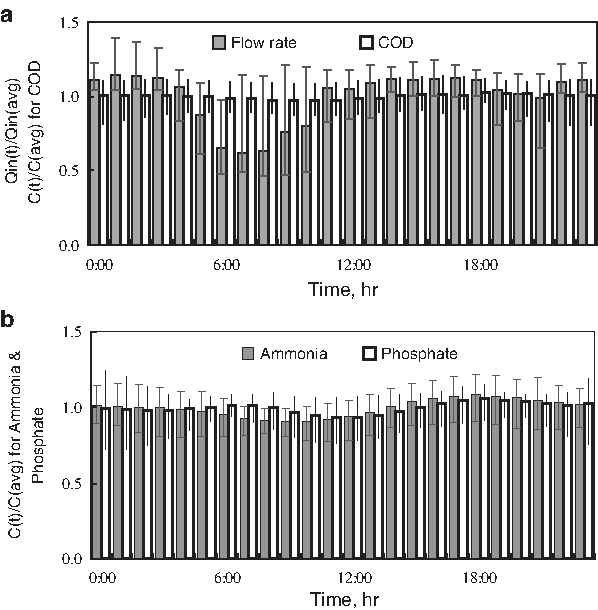
X-WWTP is the second largest WWTP in Beijing, with treatment capacity of 600,000 m3/day. A typical AAO process was adopted to achieve simultaneous removal of nitrogen and phosphorous. The oxic zone is separated into four sections as O1, O2, O3, and O4 by the independent air supply pipes from the compressor. “Dissolved oxygen (DO)—valve open” feedback loop control is applied in each section to adjust the opening degree of the electric valves in the aeration line by proportion integration differentiation (PID) algorithm based on the error of on-line measuring value and the set-point of DO. Feedback control based on PID algorithm is also applied to keep the internal and external recycle flow close to their set-points. Figure 1 shows the variation of the influent flow and water quality after time series seasonal analysis (Thomopoulos, 1980) on the hourly investigation data from September 3 to 17, 2007. The average concentrations of the influent COD, ammonia, and phosphate were 303, 44.0, and 4.2 mg/L, respectively. Figure 2 shows the cumulative frequency of the influent ammonia load (IAL) and the ratio of influent COD to ammonia (C/N).
(
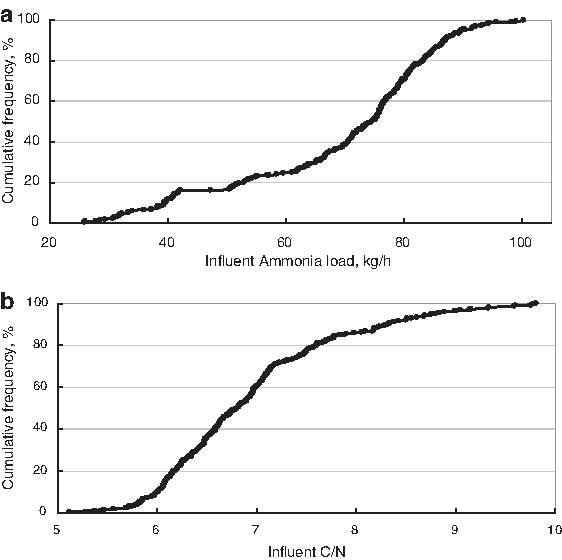
Cumulative frequency distribution of the influent ammonia load (
Modeling for the AAO process in X-WWTP
The biological treatment process of X-WWTP contains four lines in parallel. Each line consists of two primary clarifiers, four biological reaction tanks, and four secondary clarifiers. As a representation, one biological tank and one secondary clarifier were simulated. The process was built in the interface of BioWIN® by connecting one anaerobic tank, one anoxic tank, four oxic tanks, and one secondary clarifier. The dimensions of each unit are listed in Table 1. The activated sludge/anaerobic digestion model used in the simulations is a mechanistic model based on the biological phosphorus removal model (Wentzel et al., 1989), activated sludge model 1, and anaerobic digestion model 1. It could be expressed as a matrix consisting of 50 state variables and 60 process expressions. The biological processes involve the growth and decay of ordinary heterotrophic organisms, methylotrophs, ammonia-oxidizing biomass, nitrite-oxidizing biomass, anaerobic ammonia oxidizers, and phosphorus-accumulating organisms. Hydrolysis, adsorption, ammonification, and assimilative denitrification are also included. The clarifier simulation is based on the modified Vesilind model, which is essentially a one-dimensional settling model based on the flux theory.
HRT, hydraulic retention time.
The main influent characteristic and kinetic parameters of the model were determined based on the standard testing methods (Melcer and Dold, 2003), shown in Table 2. The measured and simulated values of the effluent ammonia and phosphate concentrations are shown in Fig. 3. The relative standard deviations of the simulated effluent ammonia and phosphate were 13.3% and 6.7%, respectively. The simulated effluent COD varied between 35 and 45 mg/L, whereas the measured values varied between 33 and 52 mg/L. The simulated mixed liquor suspended solids varied between 3,001 and 3,165 mg/L, whereas the measured values were 3,106 mg/L on average.
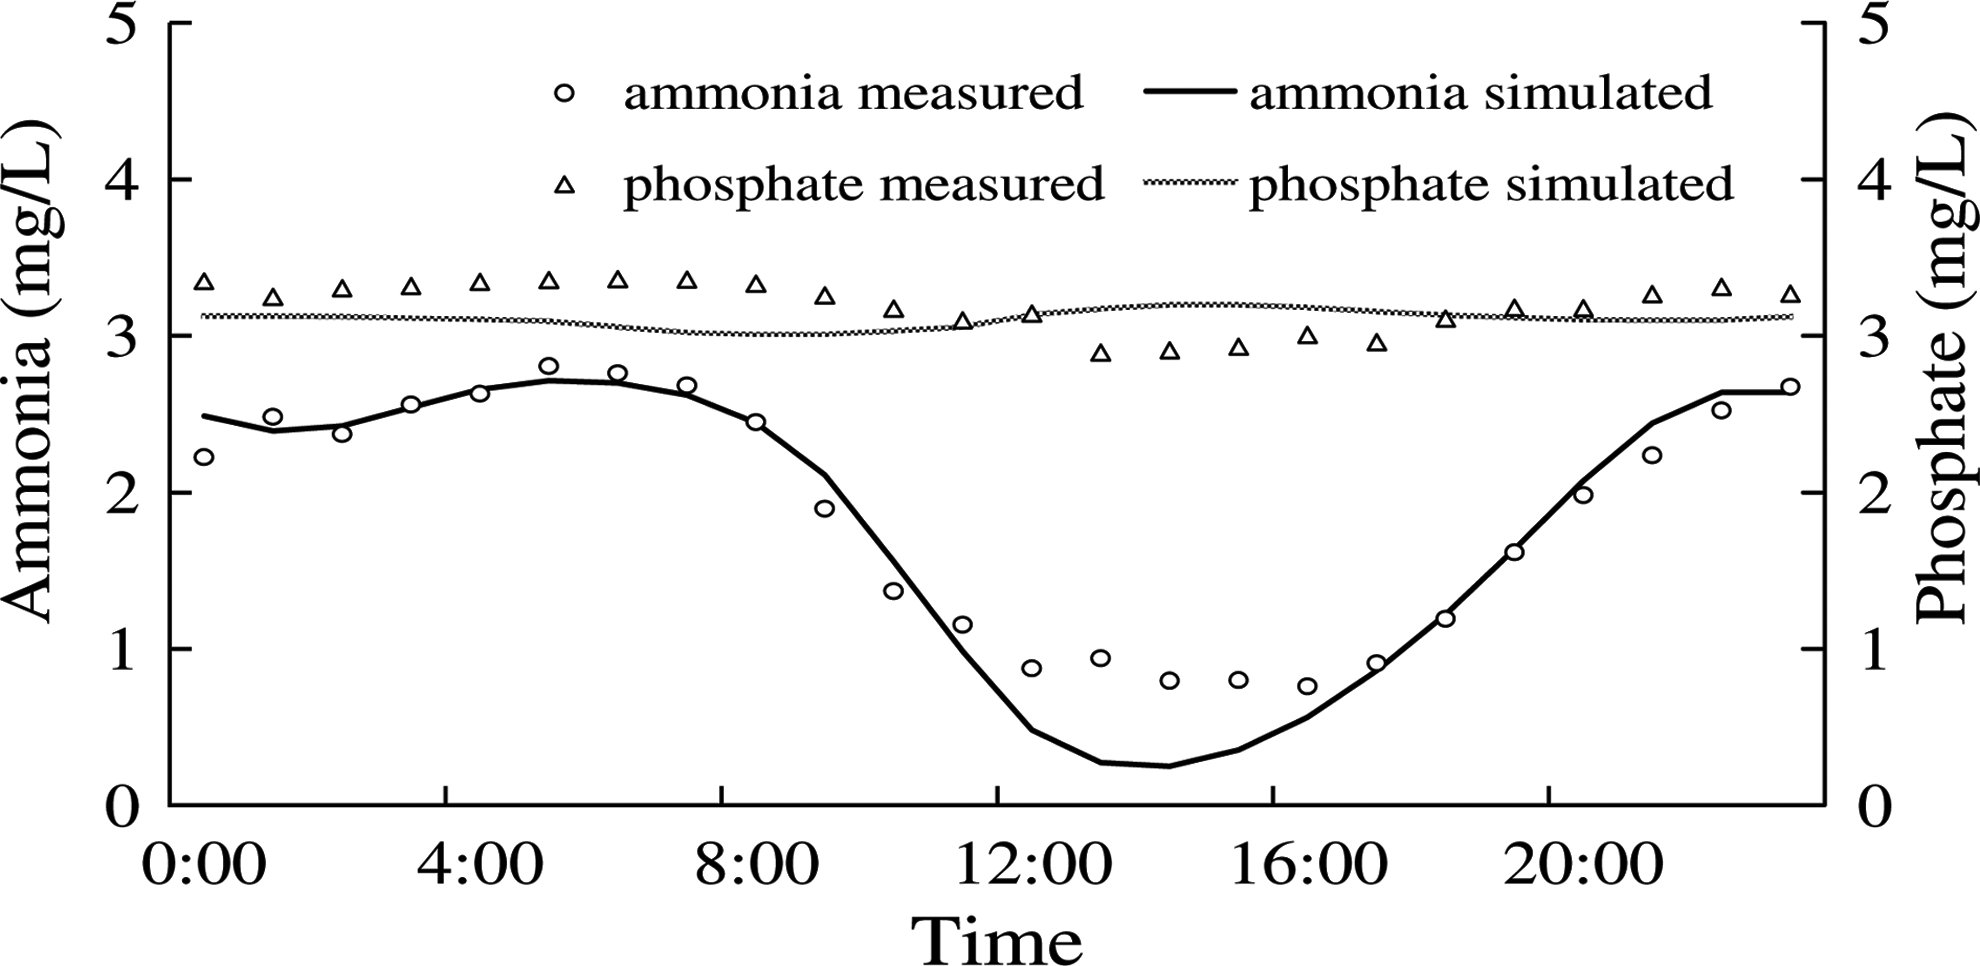
Comparison between measured and simulated values of effluent.
Default values of the model parameters in BioWIN®.
TP, total phosphorus; COD, chemical oxygen demand; CODt, total influent COD; BODt, total influent BOD; CODinf,f, filtered influent COD; CODeff,f, filtered effluent COD; VFAs, Volatile Fatty Acids; TKN, Total Kjeldahl Nitrogen.
Evaluation of operation conditions
With reference to the criteria in Benchmark (Copp, 2002), evaluation value (EV) that consisted of effluent quality and operating costs was designed to determine the optimal operation conditions. For each influent load, different operation conditions were tested through steady simulations. EV, as shown in equation (1), was calculated based on the simulation results. The operation conditions that resulted in the smallest EV were considered to be the optimal ones.
where Ei and std i were the effluent concentration and the effluent criteria of the pollutant i, respectively; Bi was the weight of i in the effluent quality evaluation; i represents COD, total suspended solids (TSS), ammonia, total nitrogen (TN), and total phosphorus (TP). OE j was the operating condition of j; dsn j was the default operation condition of j in X-WWTP; λj was the weight of j defined by its relative contribution to the total energy consumption; j represents aeration (A), external recycle (E), internal recycle (I), and sludge disposal (S).
In this research, the std i was determined as the local effluent criteria (ammonia < 5 mg/L, TN < 20 mg/L, TP < 1 mg/L, COD < 60 mg/L, and TSS < 20 mg/L). As phosphorus could be precipitated after the AAO process through metal dozing, BTP was set as 0.5, and any other Bi was defined as 1.0. The operating cost weights (λA, λE, λI, and λS) were set according to the historical data of X-WWTP. The energy consumption of aeration, external recycle, internal recycle, and sludge disposal were divided by the total energy consumption; the quotients (0.52, 0.03, 0.02, and 0.10, respectively) were defined as the weights to describe the operating cost distribution of X-WWTP. The default operation conditions defined in the design documents of X-WWTP (dsnA, dsnE, dsnI, and dsnS) were 6 m3 air/m3 wastewater, 100%, 200%, and 600 m3/day, respectively.
Control Strategies
Based on the calibrated modeling, the optimized operation conditions were summarized as the control strategies.
Considering that the adjustment of sludge retention time (SRT) had a comparatively slow effect on effluent quality, the strategies mainly focused on the real-time optimization of aeration, external recycle, and internal recycle, which took effect within a few hours. SRT was maintained at 16 days by regulating the sludge disposal. The influent phosphorus concentration was not included in the feedforward strategies because it was almost constant (Fig. 1), and feedback control was already applied at the end of secondary clarifier to ensure phosphorus removal efficiency by adjusting the metal dozing based on PID algorithm.
Input classification
To achieve simple control, the strategy inputs (IAL and C/N) were classified into several levels based on the method reported by Fu and Poch (1998).
First, the IAL was divided into five linguistic labels as extra low (EL), low (L), normal (N), high (H), and extra high (EH). The initial subregions were defined as {(XL1, XR1), (XL2, XR2), … , (XL5, XR5)}, where XL i was the left border of the ith subregion, and XR i was the right border. Then the widths of the subregions were modified to establish normalized membership functions according to the historical data shown in Fig. 2. Finally, the representative value for each label was defined as follows: Xi = (XL i + XR i )/2. The results are shown in Table 3.
IAL, influent ammonia load; C/N, ratio of influent COD to ammonia; EL, extra low; L, low, N, normal; H, high; EH, extra high.
The C/N was classified in the same way.
To cover all the cases, the five IAL labels were multiplied by the five C/N labels, resulting in 25 typical influent loads.
Operation condition optimization
For each influent load, different operation conditions (shown in Table 4) were tested in simulations. The values in Table 4 were the representative operation conditions used in X-WWTP. No other values were tested in the simulations because all the regular cases that could be performed by the actuators had been covered.
Mixed liquor suspended solids maintained at 3 g/L and temperature at 20°C throughout.
DO, dissolved oxygen.
The simulation results were recorded for the EV calculation. The optimal set of conditions that resulted in the smallest EV for each load was determined. The results indicated that the optimized conditions were related to the influent loads. Table 5 shows the relationships between the optimal external recycle ratio (R) and IAL, between the optimal DO set-points and IAL, as well as the relationship between the optimal internal recycle ratio (r) and C/N.
r, internal recycle ratio; R, external recycle ratio.
Note that all the operation conditions listed in Table 5 were the mathematical mean of five values with the same linguistic label. For example, the optimal R (86%) for the EH-level IAL was the average of 75%, 85%, 85%, 85%, and 100% (data not shown). The five values were the optimal R in the case that the IAL was EH and the C/N was EL, L, N, H, and EH, respectively.
Development of control strategy
The optimal conditions shown in Table 5 were adjusted to the values in Table 6, to be executed by the actuators of X-WWTP.
The boundary conditions in the strategies could be calculated based on the updated values. For example, the optimal R for EL and L were 65% and 75%, respectively; therefore, the boundary condition was set as the arithmetical mean (49.8) of the representative value XEL (39.4) and XL (60.1), which meant that R should be 65% when the IAL was smaller than 49.8 kg/h, whereas 75% when the IAL was larger than the value. All the domains of the independent variables were derived in the same way and are summarized in Table 7.
The essences of both the input classification and independent variable treatment (i.e., using arithmetical mean as the boundary) were to simplify the control strategy to make it easier for the operators. Considering that usually several hours were needed to observe the result of the operation changing in activated sludge systems, it was valid to use the hourly-change influent data as the input and to use the average value as the boundary. Sufficient information on the changes of the influent could be expressed. Besides, the cushioning properties of the activated sludge system would also help reduce the inaccuracies that may be caused by the simple feedforward rules.
Strategy validation
To validate the feasibility of the strategy-developing method and to evaluate the nutrient-removal efficiency of the control strategies shown in Table 7, a number of experiments were designed and implemented through dynamic simulations. All the experiments used the influent profile shown in Fig. 1. Experiment I used the original operation conditions of X-WWTP, whereas experiment II used the optimized conditions (fixed values). In experiments III–VI, individual strategy was applied separately. The integrated feedforward control system was applied in experiment VII. Table 8 sums up the operation conditions of each experiment.
Temperature maintained at 20°C throughout.
The effluent criteria rating (η) and the proportion of contaminants removed (θ) were used to evaluate the strategies. The former stood for the percentage of time when the effluent quality was within the criteria. It can be calculated by comparing the effluent profile with the local effluent criteria (std
i
). The latter represented the ratio of the pollutants removed to the total influent pollutants in a day. It can be calculated by equation (2). The effluent qualities were obtained from the dynamic simulation results at 30-min intervals.
Results and Discussions
Figure 4a shows the removed proportions of TN and TP; Fig. 4b shows the average effluent concentrations of ammonia, TN, and TP in each experiment. The effluent criteria rating (η) and aeration for each experiment are displayed in Table 9. Although the effluent TP criteria rating changed, the concentrations of effluent COD, TSS, ammonia, and TN remained below the criteria in all experiments.
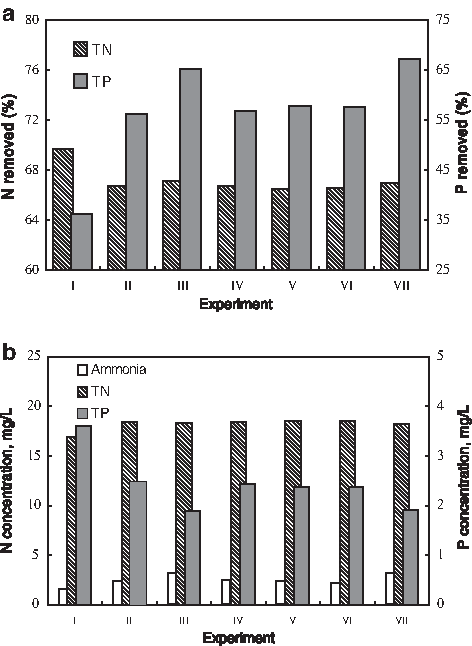
Nutrient removal efficiency of each strategy: (
η, effluent criteria rating.
Effect of optimized operation conditions
The comparison of effluent quality between experiments I and II showed the improvement in nutrient removal brought about by applying constant optimized conditions. As Fig. 4a indicated, the proportion of removed TP increased from 36.2% to 56.2%. It may be due to the adjustment of aeration. By reducing the O4 DO set-point from 2 to 1 mg/L, the external recycle returned less oxygen, thus avoiding the inhibition of anaerobic phosphate release and resulting in effective phosphate absorption during the oxic phase. On the other hand, the removal of ammonia and TN were affected by the reduction of aeration, but the effluent concentrations were always lower than the criteria.
Effect of the oxic–anoxic switch in O1
Compared with experiment II, experiment III introduced an oxic–anoxic switch in O1. Experimental results showed that the average effluent ammonia concentration increased from 2.4 to 3.3 mg/L, whereas the average effluent TN concentration decreased by 0.2 mg/L. It suggested that the denitrification efficiency was improved. Moreover, the TP removal was greatly increased, as shown in Fig. 4a. There were two reasons for the improvement. First, the effluent nitrate concentration was reduced through effective denitrification, and thus fewer nitrate returned to the anaerobic phase through external recycle. Second, the extra anoxic volume may promote some degree of denitrifying dephosphatation. This phenomenon was also reported by Soerensen (1996), who showed that the extended anoxic time had given possibilities to run the biological phosphorus removal simultaneously with the nitrogen removal.
Effect of a variable DO set-point for O2 and O3
Although the removal efficiency of experiment IV was almost the same as experiment II, the aeration decreased from 228,444 to 212,525 m3 air/day. The cost reduction was achieved by controlling the DO set-point of O2 and O3 according to the IAL. The result was similar to the research by Shen et al. (2008), in which the effluent ammonia slightly increased, TN remained stable, and the aeration was saved by the model predictive control on DO set-point.
Actually, the main purpose of aeration is to provide oxygen to maintain the growth of bacteria that remove COD and ammonia. In AAO process, part of the COD in influent is degraded during the polyphosphate-accumulating and denitrification process before entering the oxic phase. Besides, the activity of the nitrifying bacteria is much lower than the ordinary heterotrophic bacteria, which remove COD (Henze et al., 2000). Consequently, oxygen is principally consumed for ammonia removal in oxic phase. It explains the IAL-based aeration control, which was also reported by Zhang et al. (2008), who showed that the effluent ammonia was successfully kept below the limitation value under the control of DO set-point according to the influent and effluent ammonia concentration.
Effect of a variable external recycle ratio
Experiment V examined the effect of the external recycle control. The proportion of removed TP increased from 56.2% to 57.9%, whereas that of TN remained the same, compared with experiment II.
As superfluous nitrate entering the anaerobic phase would affect phosphorus removal (Comeau et al., 1986), excess external recycle should be avoided, especially when there was little carbon resource in the influent. However, low external recycle would not maintain enough mixed liquor suspended solids, which was significant for nitrogen removal (Liu et al., 2006). Therefore, R was considered to be a critical variable for the removal of both phosphorus and nitrogen, and should be well controlled. The results of experiment V showed that the control of R according to the IAL could improve the nutrient removal.
The results also showed the difficulty of enhancing the removal of nitrogen and phosphorus simultaneously. However, the proposed control strategy could help achieve maximum biological enhanced phosphorus removal while keeping the effluent nitrogen within the criteria. The improvement of biological enhanced phosphorus removal would reduce the consumption of metal dozing and further save operating costs, as shown in the full-scale study of Rosen et al. (2006).
Effect of a variable internal recycle ratio
Experiment VI studied the effect of controlling the internal recycle ratio according to the C/N. The removal efficiency and effluent concentration of TN in experiment VI remained fairly similar to those of experiment II. Note that the result was based on the influent profile shown in Fig. 1, in which the C/N was quite low. In a typical AAO process, denitrification capacity usually decreased when there was not enough organic substrate available for denitrifiers (Sorm et al., 1997). If there was more carbon resource, denitrification could be further improved by the internal recycle control (Yuan and Keller, 2003). Still, the internal recycle flow decreased from 74,636 to 72,127 m3/day, and thus energy had been saved.
Effect of integrated feedforward control system
The comparison between experiments II and VII showed the effects of the integrated feedforward control system described in Table 7. The proportion of removed TP had increased from 56.2% to 67.2%, the effluent TP concentration had decreased by 24% on average (from 2.5 to 1.9 mg/L), and the effluent criteria rating of TP had risen from 0% to 52.1%. Although the effluent concentrations of ammonia and TN had slightly increased in VII, they were strictly controlled. Further, the amount of aeration and internal recycle flow had decreased by 8.5% and 3.4%, respectively. The results were similar to the research by Ma et al. (2005), in which the aeration energy reduced up to 9.6% while the effluent ammonia and nitrate were maintained by controlling the oxic volume.
As shown by the comparison among experiments II, III, and VII, the control of O1 aeration offered the greatest benefit in the integrated control system. If the volume ratio of anaerobic/anoxic/oxic was more flexible, better results may be achieved. Ingildsen et al. (2006) controlled the length of anaerobic/anoxic/oxic stage dynamically and resulted in the decrease of aeration, effluent nitrogen, and phosphate by 15%, 27%, and 65%, respectively.
The variations in effluent concentrations and operating conditions for experiments II and VII are presented separately in Fig. 5a and b. The effluent TP peak in Fig. 5b was due to the aeration switch-off in O1 (from 6:00 to 13:00), which strongly impacted the oxic absorption of phosphate, according to Soerensen's research (1996). Considering the benefits discussed above and the fact that accessorial chemical removal of phosphorus could be temporarily introduced when the peak occurred, the switch was accepted and remained within the control system.
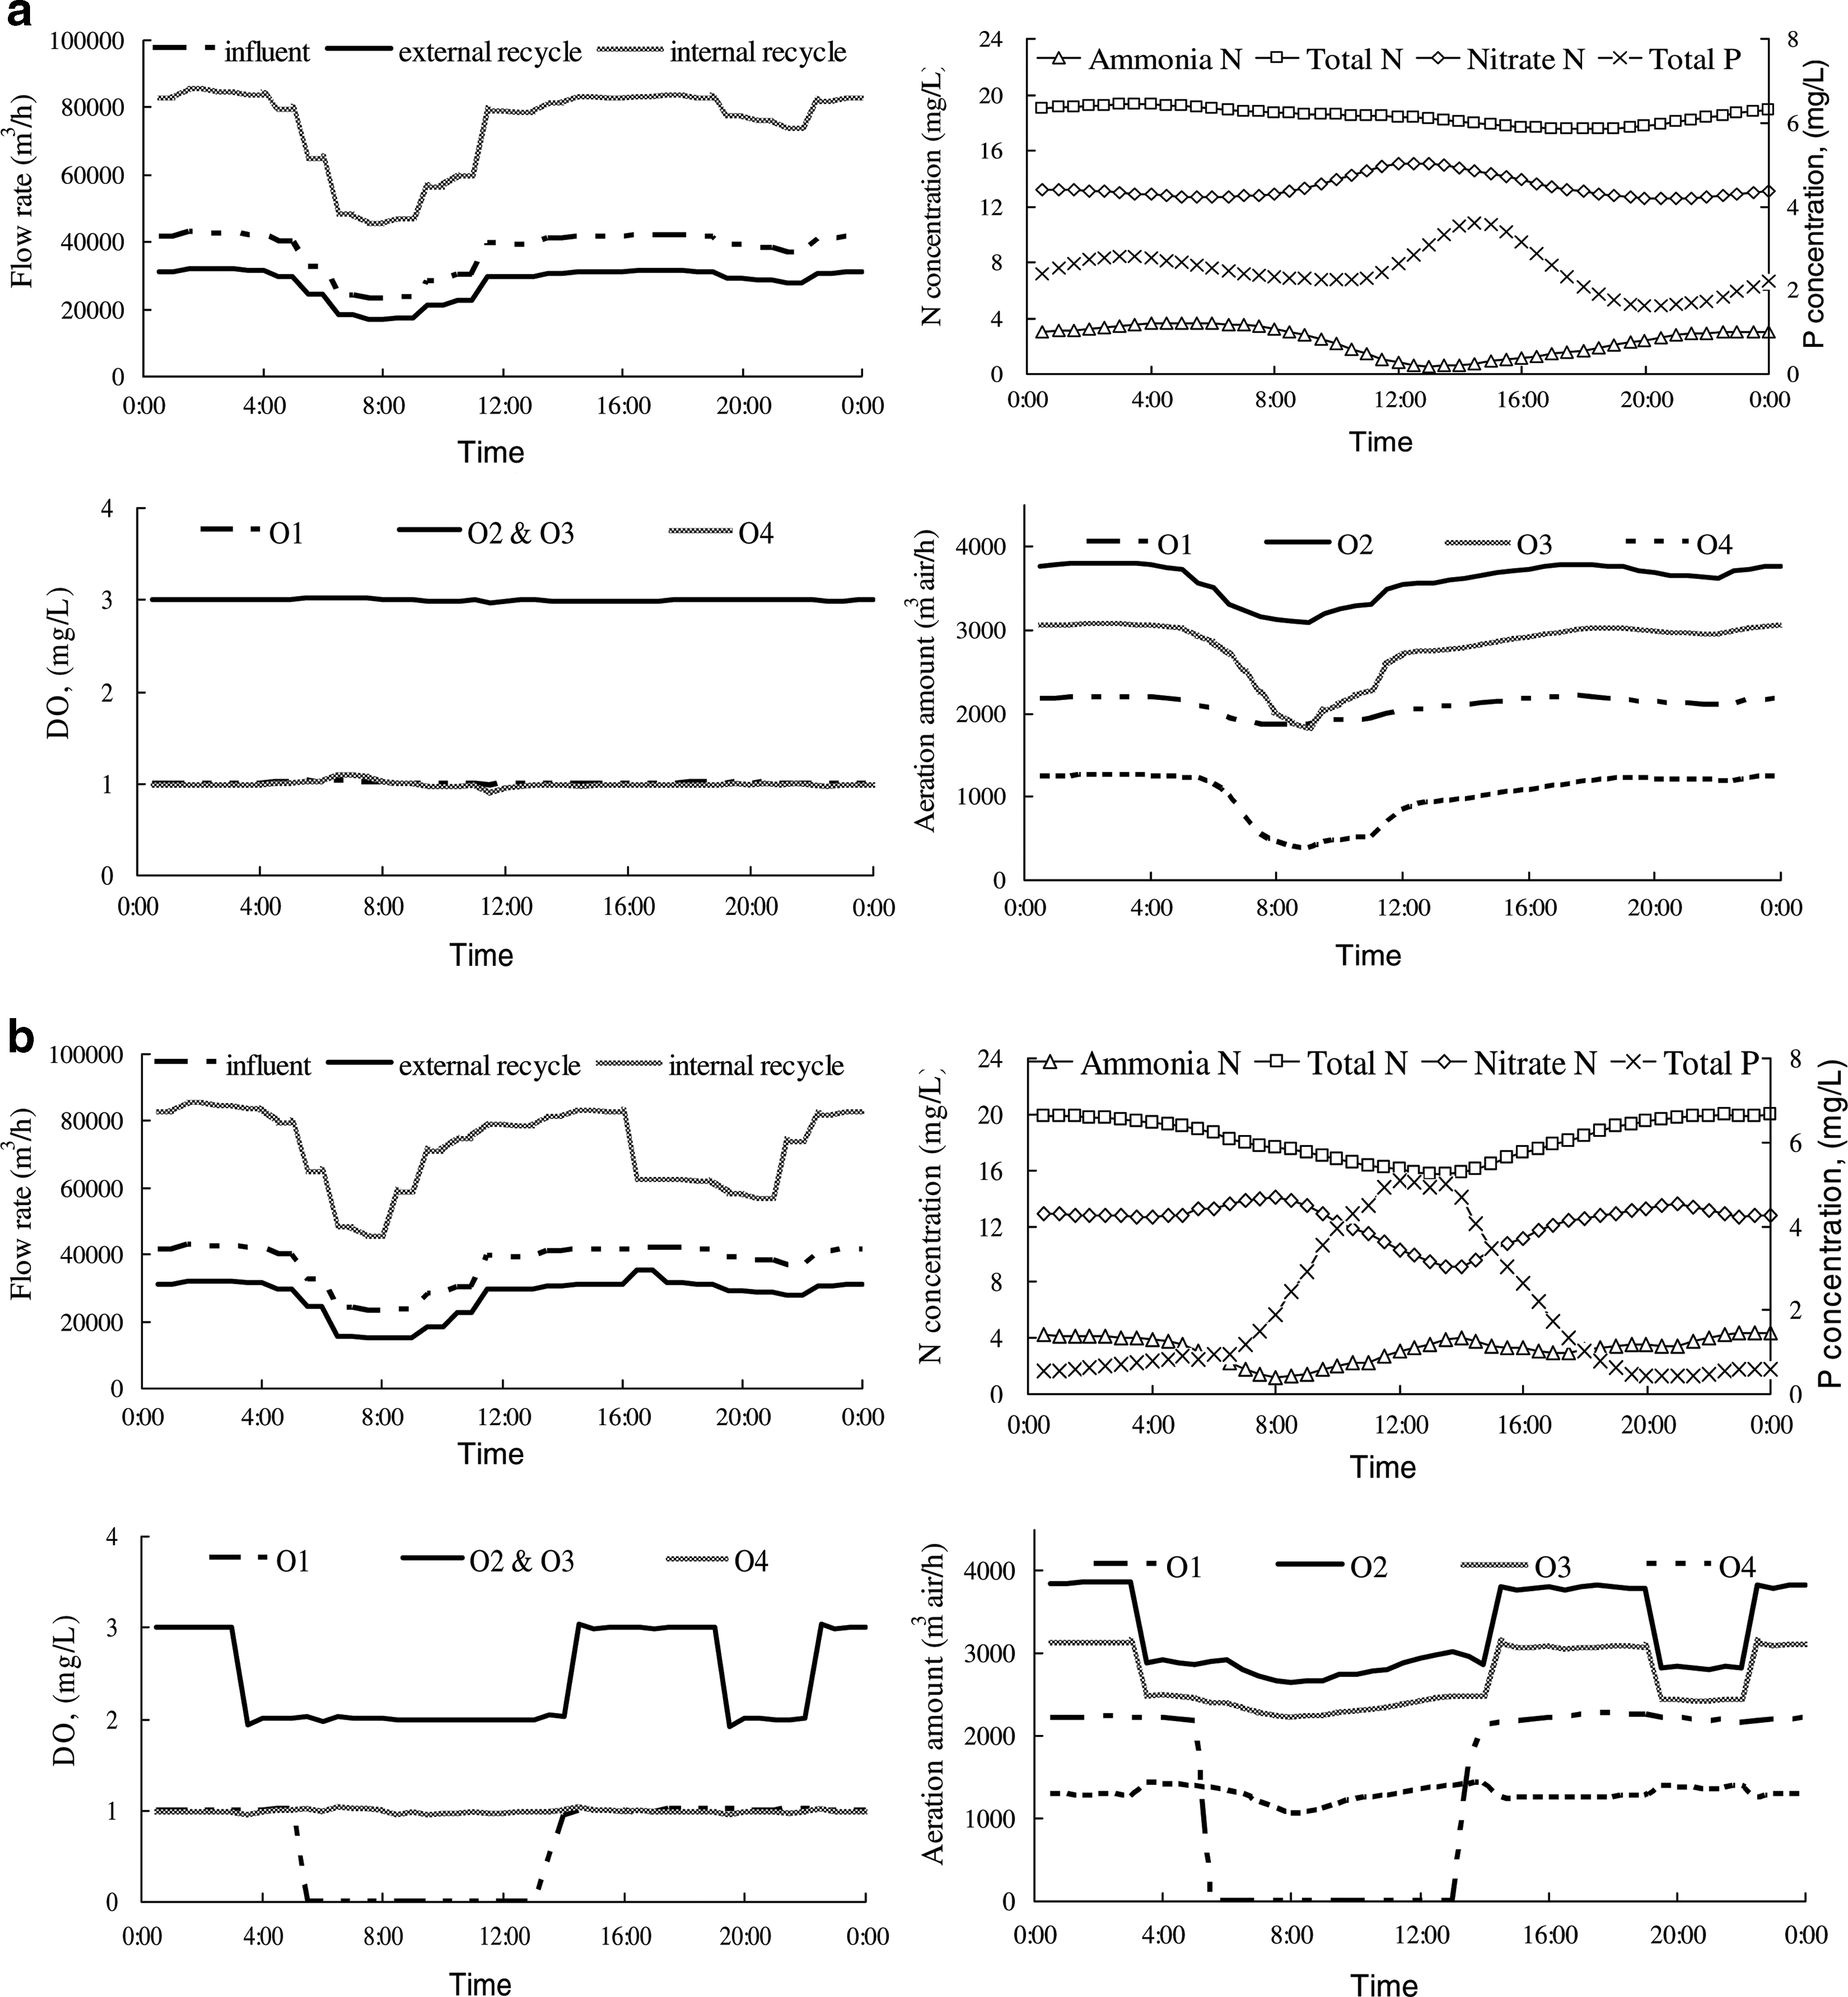
Variables in experiments II (
Conclusions
A method of establishing feedforward control strategy for AAO process by integrating off-line simulations and on-line controls has been proposed. The procedure of applying mathematical model to WWTP control was improved, instead of simplifying the predict model. It made the feedforward strategies more reliable and accurate because all the bioreactions related to nutrient removal were considered.
The method was applied to the AAO process of X-WWTP and a simple feedforward control system was established, which can be easily implemented in full-scale WWTPs. The system was validated through dynamic simulations. The results showed that the proposed strategies were practicable and the nutrient removal efficiency of X-WWTP could be improved while avoiding wasting energy on aeration and recirculation. The proportion of removed TP had increased from 56.2% to 67.2%, whereas the effluent ammonia and TN were always kept below the criteria. The aeration and internal recycle flow had decreased by 8.5% and 3.4%, respectively.
It should be noted that the parameters of the control system may not be suitable for other situations such as processes with different temperature or SRT. However, the control system can always be adapted to the WWTP's characteristic by performing particular off-line simulations.
Footnotes
Acknowledgments
This work was supported by a key project under the National Science and Technology Supporting Program of China (2006BAC19B06) and a project of the Research Fund of State Key Joint Laboratory of Environmental Simulation and Pollution Control.
Author Disclosure Statement
No competing financial interests exist.