
Abstract
Abstract
In a conventional two-stage biological nitrogen removal (BNR) process, the extent of uncertainty associated with different operating parameters (e.g., solids retention time, internal recirculation ratio, anoxic hydraulic retention time [HRT], total HRT, and sludge recycle ratio) was evaluated by simulation with Activated Sludge Model no 1. Variability in the values of kinetic parameters was incorporated in performing stochastic simulations by adopting the influent biodegradable chemical oxygen demand–to–total kjeldahl nitrogen (COD:TKN) ratio of 10, an important determinant of BNR performance. Simulation results predicted maximum level of certitude for effective nitrogen removal at 3-h anoxic HRT (and 12-h total HRT). Appreciable rise in process certitude for nitrogen removal was indicated as solids retention time was increased from 5 to 20 days. No noticeable rise in confidence level could be achieved for meeting stipulated treatment targets by increasing internal recycle (for nitrate recirculation) beyond 300%. Process certitude remained virtually unaffected by increase in either sludge recycle ratio or total HRT of the system. Such an approach for reducing treatment uncertainty, related to variability in biokinetic parameters by studying the effect of operating parameters on the system, could be regarded as a valid objective in BNR process design and operation. This would ultimately lead to the development of ranges in operating conditions for enhanced process certitude.
Introduction
Process simulation tools that have been developed and introduced over the past years have enhanced the design and analysis of biological wastewater treatment systems such as activated sludge and biological nitrogen removal (BNR). Activated Sludge Model no. 1 (ASM1) is normally used for modeling activated sludge process and includes 8 processes, 13 components, 5 stoichiometric coefficients, and 14 kinetic parameters to define carbon and nitrogen removal (Henze et al., 1987a, b). This model has been calibrated and validated by suggesting and including typical values and ranges of these process parameters for simulating treatment of different types of wastewater under various operational conditions. Calibration of the model based on field performance of full-scale installations by Choubert et al. (2008), Muller et al. (2003), Petersen et al. (2003), Kappeler and Gujer (1992), and Siegrist and Tschui (1992) provided a range of parameter estimates. Probability distributions of these kinetic and stoichiometric parameters were later characterized by Cox (2004). These recommended values are by and large accepted in modeling of activated sludge process by ASM1 and other subsequent models incorporated into a number of software packages.
Uncertainty in modeling and analysis of wastewater treatment plant performance has been studied by Sin et al. (2009), Refsgaard et al. (2007), and others. In contrast to the issues discussed in these publications, this study was specifically focused at finding the level of uncertainty associated in the two-stage BNR process by using stochastic modeling that took into account the natural variability of kinetic and stoichiometric parameters without considering variation in either quality or quantity of influent wastewater. Determination of such variability associated with attaining stipulated treatment goals was attempted. Under this present context, process certitude could be defined as the certainty (or statistical probability) of achieving any stipulated treatment target in a two-stage BNR system, as stochastic simulation results were plotted to generate empirical cumulative frequency distributions (CFDs) for the effluent concentrations under defined operating conditions. With the limited literature available on effect of variation in biokinetic parameters on process performance, information collected from this study indicating effective operating conditions could prove to be beneficial to enhance system reliability in meeting treatment targets. The effect of specific operating parameters on process certitude was analyzed to devise guidance on expected process performance, design, and operational strategies to reduce process uncertainty, ultimately leading to safety factors for enhanced process certitude in meeting treatment objectives.
Methodology
Two-stage pre-anoxic denitrification type BNR process for domestic wastewater treatment was simulated with GPS-X (2006) (Hydromantis, Inc., Hamilton, Ontario), a simulation software that incorporated ASM1 modeling. The variability in influent quality and quantity was not included in this work, and influent flow and characteristics (Table 1) were kept the same for all simulations performed. The BNR system comprised two completely mixed stirred tank reactor in series, the anoxic reactor followed by the aerobic one, and a secondary clarifier.
Typical proportions in domestic wastewater (Grady et al., 1999). Concentrations are expressed in mg/L COD for organic components, mg/L N for nitrogenous species, and mM/L for alkalinity.
Cox (2004) put forward the probability density functions (PDFs) of different kinetic and stoichiometric parameters through Bayesian analysis of recommended values and field calibration results (Table 2). These were used in performing stochastic simulations. Out of the 19 coefficients and parameters (Table 2) included in ASM1, 4 were considered to be essentially constant ( f'D, iN/XB, iN/XD, and ka). Among the rest, 14 model parameters (YH, bH, μH, KS, KNO, KO,H, YA, μA, bA, KNH, KO,A, kh, KX, and ηh) were allowed to vary as log-normal PDF Equation 1 and one (ηg) with a uniform PDF Equation 2.
ηg follows a uniform PDF with a minimum of 0.10 and a maximum of 0.90.
Values represent recommended parameter values.
where P(x) is the probability that a model parameter has a value x; ξ and σ are the mean value and variance, respectively, of the log-transformed parameter values; and a and b are the minimum and maximum, respectively, of the parameter values (Table 2). A set of 1,000 random combinations of parameter values, varying according to their respective PDFs, were generated by using Excel (Microsoft Corp., Redmond, WA). Such a stochastic simulation approach is referred to as Latin hypercube sampling and reported to help ensure uniform distribution of input points in parameter space (Morgan and Henrion, 1990).
Stochastic process simulations were performed for the defined process configuration at selected operating parameter ranges (Table 3) for each of the 1,000 parameter combinations as described above. So, each stochastic simulation comprised 1,000 Monte Carlo runs with the selected operating conditions. Besides, discrete simulations were performed using the mean parameter values (Table 2). Each simulation was allowed to run for 5 times the solids retention time (SRT) value until the state variables stabilized. To maintain the stipulated SRT, sludge wasting was done directly and proportionally from the reactors in line with Garrett configuration (Grady et al., 1999). The dissolved oxygen level in anoxic tank was set at 0 mg/L to maintain anoxic condition and at 2.0 mg/L in aerobic tank to ensure oxygen-independent biokinetics.
System configuration: Complete mix type anoxic and aerobic reactors in series followed by clarifier for biomass separation with sludge wasting and recirculation systems.
Selected ranges typical of a range of pre-anoxic biological nitrogen removal process configuration (Rittmann and McCarty, 2001; Tchobanoglous et al., 2003).
When θ1 is being varied, total HRT for the system was maintained at 12-h by allocating the balance HRT to aerobic reactor (e.g., if θ1 is 4-h, HRT for aerobic tank is taken as 8-h for 12-h total HRT).
Default ratio of anoxic and aerobic HRTs was adopted as 1:3.
HRT, hydraulic retention time.
To nullify the influence of physical separation and emphasize on the effect of the biotreatment processes on overall system performance, the secondary clarifier was modeled as an ideal biomass separator with 100% particulate removal efficiency. Consequently, the effluent contained only soluble components, i.e., SS and SI (=0) for organic species, and SNH (NH4+-N), SNO (NO3—N), and total nitrogen (TN). Output of stochastic simulations was used to develop empirical CFDs for the effluent concentrations. These were analyzed for assessment of the certitude of achieving specific treatment targets under given operating conditions.
Results and Discussion
SRT
SRT or sludge age plays a decisive role in design and operation of biological treatment process. The sludge age is adopted to establish a stable microbial population in the system. It is selected based on the minimum SRT required
where SF is the safety factor, θC is the adopted SRT, and the model parameters

Minimum solids retention time for autotrophic biomass for stochastic and discrete simulation.
To examine the effect of SRT on two-stage BNR system (being operated with θ1–3-h, R1-4.0, θ–12-h, and R −0.5), performance of biotreatment was compared at 15 and 30-day SRTs by performing stochastic simulations. The empirical CFDs for steady-state effluent biodegradable COD concentrations for 15-day and 30-day SRTs were almost similar to each other (Fig. 2a). In contrast, CFDs for steady-state effluent TN concentrations showed marginal improvement on raising the SRT from 15 to 30 days (Fig. 2b). The empirical CFDs of the steady state effluent concentrations (Fig. 2) could be construed as the certitude that a certain effluent target would be met under the given operating conditions.
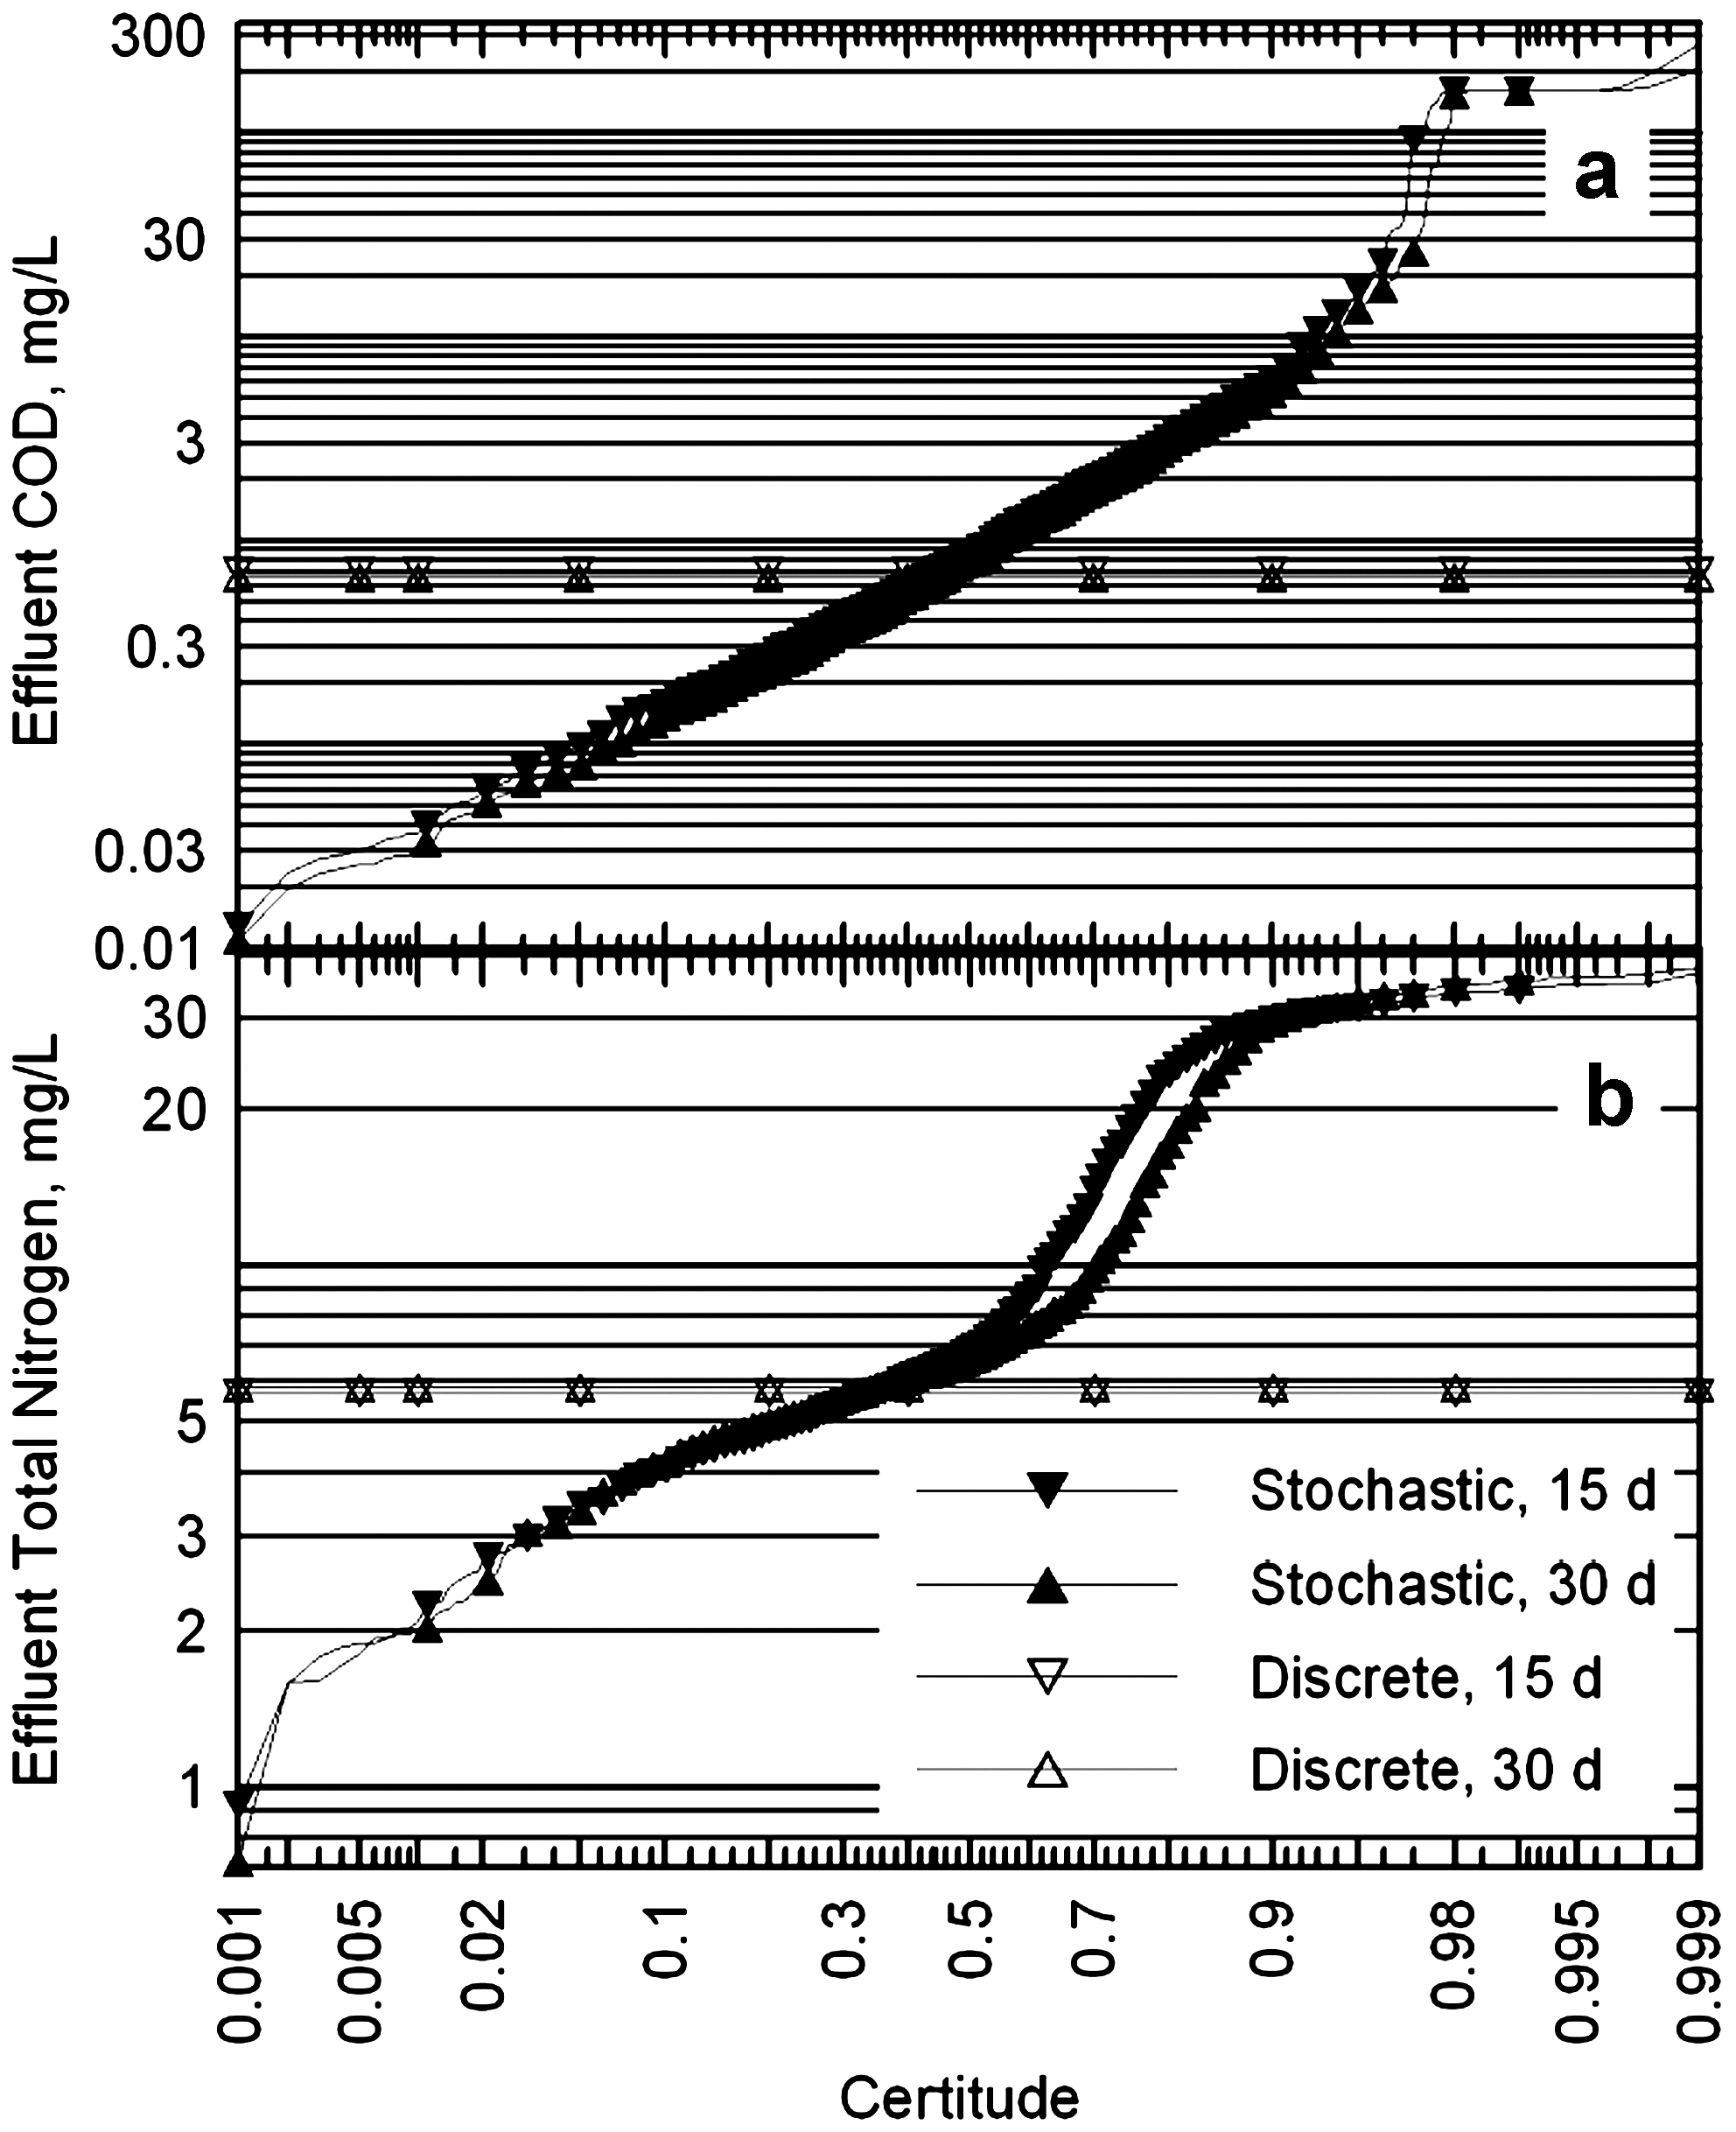
Steady-state effluent biodegradable COD and total nitrogen (TN) concentrations for stochastic and discrete simulation.
At 15-day SRT, an effluent TN concentration of 5.67 mg/L was predicted by the discrete simulation, and the certitude of obtaining this effluent TN concentration was 34% as indicated by the corresponding CFD. In other words, a two-stage BNR system operated at 15-day SRT, 3-h anoxic, and 9-h aerobic hydraulic retention times (HRTs), 400% internal recycle, 50% sludge recycle, and designed using the mean parameter values (Table 2) without any site-specific parameter estimates would have a 34% certitude of attaining a TN effluent concentration of 5.67 mg/L or less for treating a typical municipal wastewater (Table 1). Likewise, discrete simulation predicted an effluent COD concentration of about 0.71 mg/L, and the corresponding certitude was about 45%. Increasing the SRT to 30 days had marginal effect on treatment from the viewpoint of TN and organics removal and reduced the effluent TN and COD to 5.83 mg/L (35% certitude) and 0.66 mg/L (46% certitude), respectively.
Effect of sludge age on the certitude of attaining selected treatment goals for various nitrogen species and COD (Fig. 3a–d) was investigated by plotting these against increasing SRT values. Higher certitude could be attained by selecting a less stringent treatment goal or a longer SRT, as anticipated. Two levels of treatment targets were selected for this analysis and these were 5 and 10 mg/L for effluent TN, and 10 and 20 mg/L for effluent biodegradable COD. The same target effluent concentrations were used for other nitrogen species, NH4+-N (SNH) and NO3—N (SNO), for comparative analysis. Effect of high SRT values on TN and COD removal in the process was found to be different.
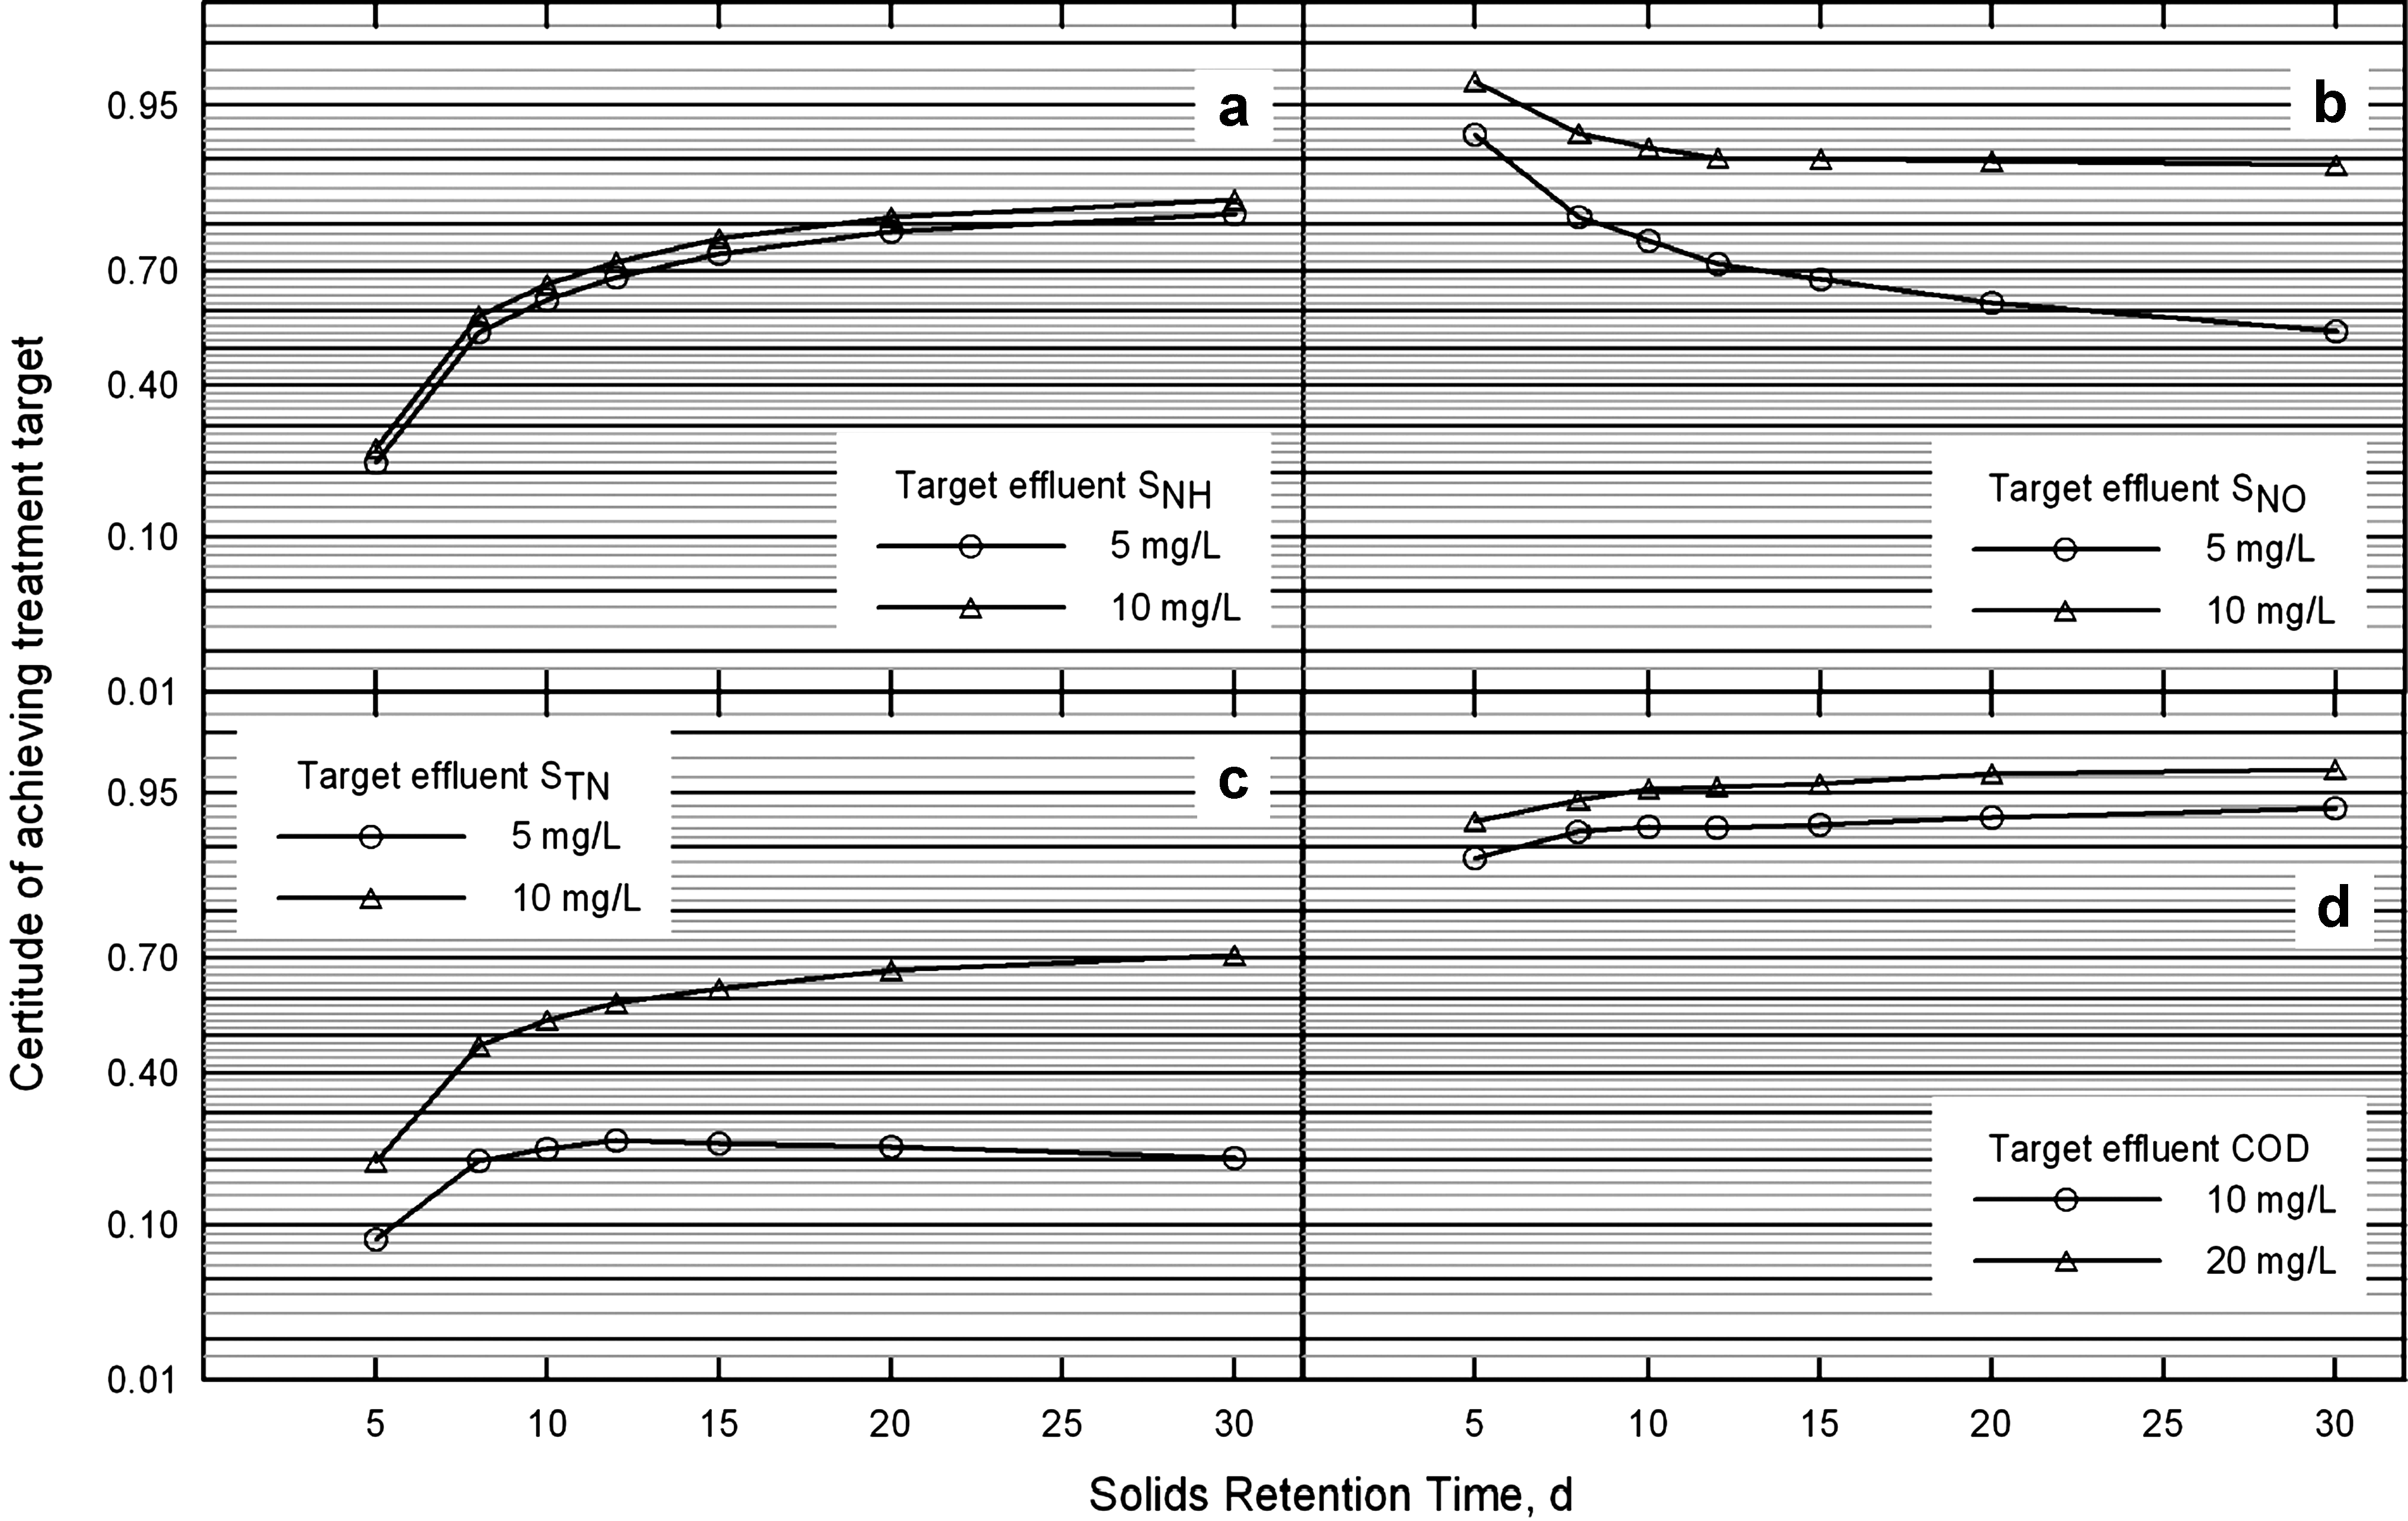
Effect of solids retention time on certitude of achieving specific target effluent
Adoption of higher SRT value increased the certitude of meeting specified TN treatment targets over a particular range of SRT with higher confidence levels being associated with less stringent treatment goal (Fig. 3c). Field experience in biological wastewater treatment indicated an SRT of 2 to 15 days for nitrification and subsequent denitrification (Tchobanoglous et al., 2003). Also, the certitude of meeting stipulated level of COD removal remained stable over the range examined with a marginal rise over 5 to 15-day SRT range (Fig. 3d). This was probably due to removal of biogenic soluble organic matter at 0.5 to 2-day SRT and particulate organic removal taking place with an SRT of 2 to 4 days (Grady et al., 1999), which would not improve with further increase in SRT. So, the stochastic simulation output was in line with results of field experience.
Notable increase in certitude for achieving target effluent TN was indicated when SRT was raised from 5 to 15 days (Fig. 3c). This could be correlated to a notable and almost similar increase in certitude (Fig. 3a) for obtaining effluent SNH concentrations (5 and 10 mg/L). This indicated occurrence of nitrification that was believed to have been established between 2- and 15-day SRT (Grady et al., 1999). Consequently, a drop in certitude for meeting treatment goals for effluent SNO implied a rise in possibility of higher effluent SNO concentration, which in turn confirmed onset of nitrification. In both cases, further increase in SRT from 15 to 20 days slightly improved process certitude for attaining treatment objectives of effluent SNH and a insignificant decrease in confidence level for target effluent SNO concentration. Its effect translated into an appreciable rise in certitude for achieving stipulated TN concentrations for rise in SRT from 5 to 15 days due to establishment of nitrification and subsequent denitrification. Adoption of any higher SRT value (e.g., 30 days) was observed to slightly enhance the associated process certitude for less stringent treatment goal (Fig. 3c). Hence, attainment of specific target effluent concentrations at any given SRT and maintenance of a stable microbial population within the two bioreactors in series were intimately connected.
Anoxic HRT
Stochastic simulations were run over a range of HRT for anoxic reactor (1-h to 8-h) keeping total HRT at 12-h (with R1-4.0, R −0.5, and θC–15-day). That is, the ratio of anoxic to total HRT (anoxic HRT fraction) ranged from 0.083 (i.e., 1/12) to 0.67 (i.e., 8/12). Appreciable reduction in certitude of attaining SNH concentration goals was noted with increase in anoxic HRT (Fig. 4a). With total HRT remaining same, as anoxic HRT was raised, anoxic conditions started to dominate ensuing rise in effluent SNH concentration. Lesser time was available for SNH to undergo nitrification as aerobic retention time was correspondingly reduced. A rise in effluent SNH level was therefore indicated with a consequent drop in certitude of attaining target SNH concentration. Probability of achieving target effluent SNO concentration was enhanced as nitrification was subsided for decrease in aerobic HRT (Fig. 4b). Longer anoxic HRT caused SNH concentration to rise that was incompletely nitrified in the aerobic reactor and returned (with 400% internal recycle) to the anoxic tank. So, denitrification was affected due to low electron acceptor (SNO) level in the internal recycle. In contrast, for low anoxic HRT, denitrification was suppressed as less time was allowed in anoxic reactor that indicated a greater chance of high effluent TN concentration.
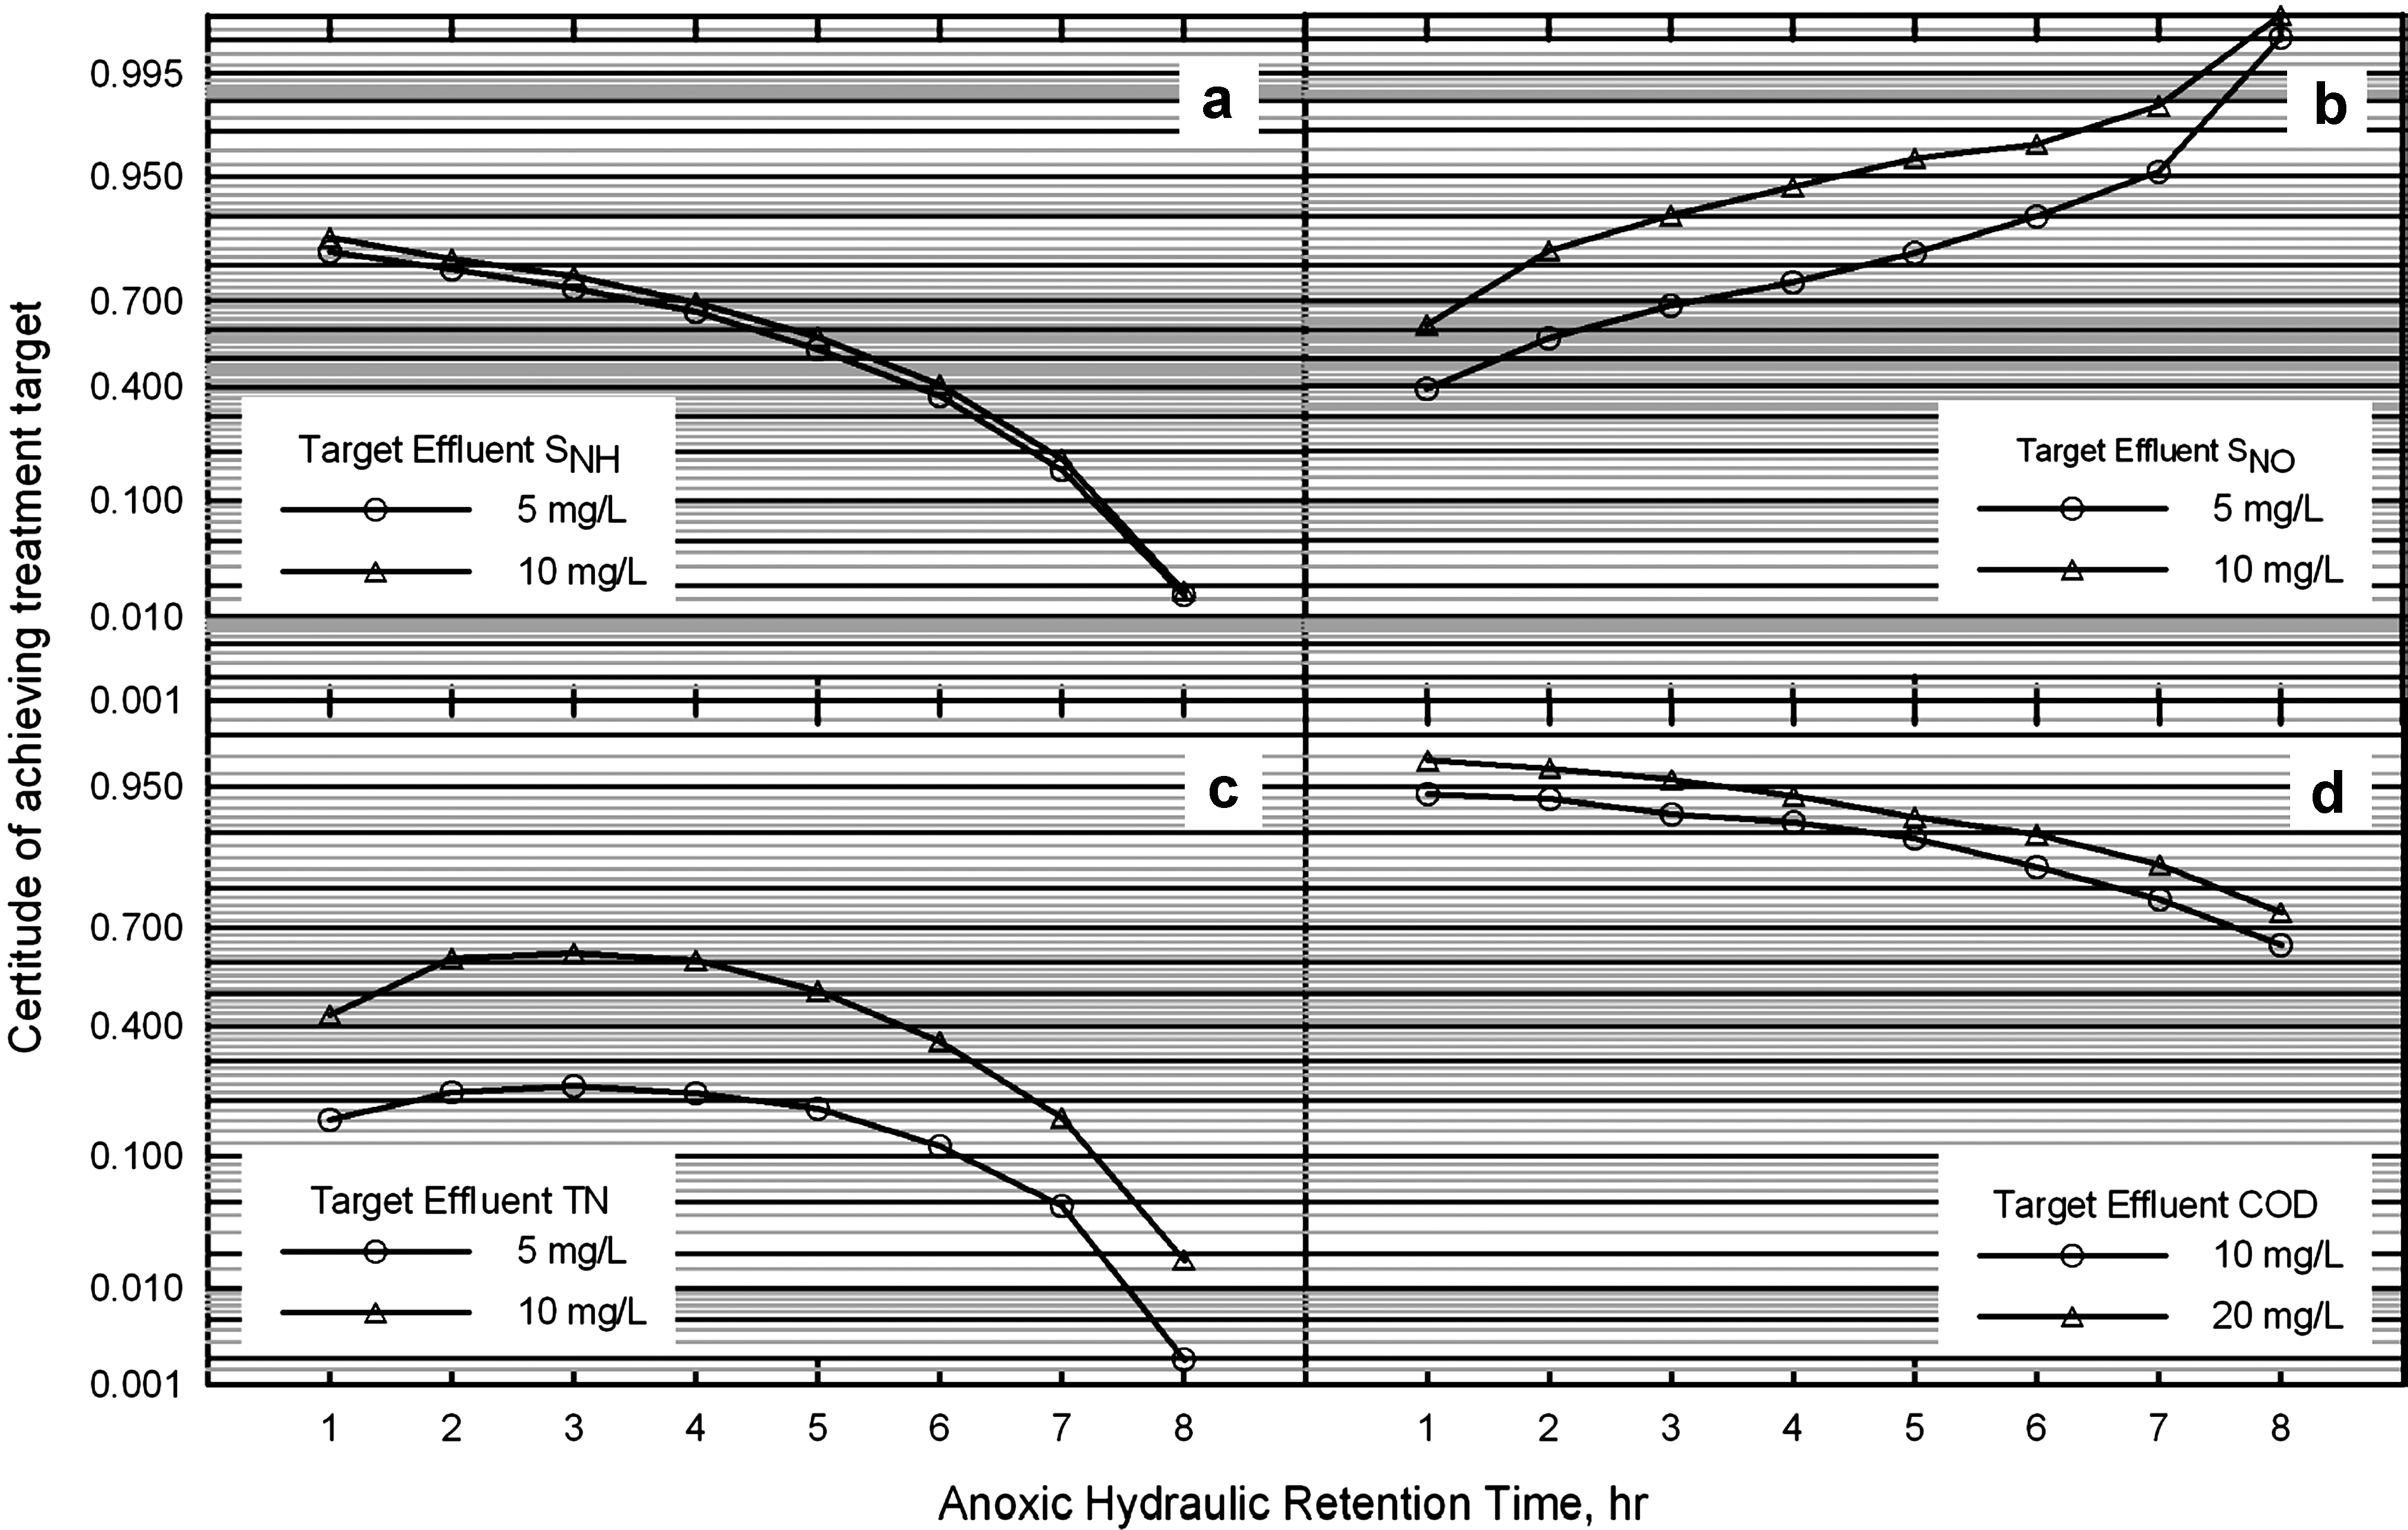
Effect of anoxic hydraulic retention time on certitude of achieving specific target effluent
Combining these two scenarios, certitude of achieving target effluent TN concentration was found to be optimum over an anoxic HRT range of 2 to 4-h (i.e., 0.17 to 0.33 anoxic HRT fraction) with the maximum occurring at 3-h (Fig. 4c). Growth of denitrifiers in anoxic tank and nitrification in aerobic tank were presumed to have been balanced over this range of anoxic HRT fraction for most effective performance.
Results indicated that there was >90% certitude that target effluent COD concentration could be attained over 1 to 4-h anoxic HRT (Fig. 4d). However, certitude of achieving such treatment level dropped steadily over 4 to 8-h anoxic HRT range could be attributed to reduced heterotrophic substrate utilization in denitrification as anoxic HRT was gradually increased beyond 3-h.
Internal recycle ratio
A relatively high internal recycle ratio (R1) needs to be maintained for pre-anoxic BNR process to return sufficient amount of electron acceptor (SNO) from aerobic to anoxic tank for effective denitrification. It was important to ascertain the effect of internal recycle ratio on certitude of achieving treatment targets, so as not to adopt an unnecessarily high recycle rate having a direct implication on capital cost for recirculation piping and associated energy charges.
Certitude associated with achieving pre-set effluent SNH and COD concentrations remained unaffected by any increase in internal recycle ratio (Fig. 5b). The certitude profile for response of the process in achieving target effluent SNO concentration to varying internal recycle ratio was very similar to that for TN (Fig. 5a). Probability of attaining more stringent target effluent SNO concentration (5 mg/L) went up steadily as the recycle ratio was increased. However, for less stringent target (10 mg/L), such rise in process certitude was found to level off beyond 200%, after rising initially. Simulation results predicted that over the R1 range of 300% to 500%, there was practically no improvement in process for meeting 10 mg/L effluent SNO concentration. The same was indicated for attaining effluent TN goals (Fig. 5a). Rate of return of SNO from aerobic to anoxic tank improved the overall nitrogen removal by supplying sufficient amount of electron acceptor (SNO) to the anoxic reactor for denitrification. Yet, certitude for achieving a treatment target of 10 mg/L for effluent TN was found to stabilize after R1 was adequately increased, and beyond this value no further improvement was recorded. However, for meeting stricter discharge criteria of 5 mg/L TN, increase in internal recycle ratio indicated better process certitude. A certitude profile was also worked out for an intermediate effluent TN concentration of 8 mg/L, indicating that probability of attaining this target flattened out beyond R1 of 300%. So, it could be concluded that over the range of less stringent treatment goal (8 to 10 mg/L STN), adoption of 400% internal recycle was adequate for optimum process certitude.

Effect of internal recycle ratio on certitude of achieving specific target effluent
Sludge recycle ratio
The certitude of attaining specific treatment targets was plotted as a function of R to examine the effect of sludge recycle ratio on system performance (with θ1–3-h, R1-4.0, θ–12-h, and θC–15-day) over a range of sludge recycle ratios (0.25 to 3.0). The response of the system was found to be consistent signifying marginal effect on the levels of certitude associated with TN and COD removal.
Total HRT
Stochastic simulations of the system (with θC–15-day, R1-4.0, R −0.5, and anoxic HRT fraction 1:4) indicated that there was virtually no effect of HRT on the certitude of meeting TN and COD treatment goals. For TN and COD removals, the certitude level remained at 62% and 92%, respectively, for less stringent treatment goals.
Summary and Conclusion
Probabilistic modeling provided a platform for quantitative assessment of the certitude levels associated with two-stage pre-anoxic BNR process. Estimated values and PDFs for biokinetic parameters suggested by Cox (2004) were used to evaluate the extent of uncertainty associated with operating parameters. In the absence of sufficient information on site-specific estimate of kinetic and stoichiometric parameter values, these results could provide process designers with useful guidance on the levels of certitude related to specific treatment targets. Output from simulations, in principle, agreed with prevailing practice and field experience in BNR process, and provided background for process certitude.
Results of the analysis can be summarized as follows:
Use of a safety factor for heterotrophic biomass, more importantly, autotrophic biomass, in the two-stage BNR system as a multiplier of minimum SRT was validated from the standpoint of increasing process certitude.
Process certitude of attaining treatment targets for effluent TN increased significantly as SRT was raised from 5 to 20 days and stabilized thereafter. The certitude of meeting stipulated level of biodegradable COD removal remained stable over the range examined with a marginal rise between 5- and 15-day SRT.
Over the range of 2 to 4-h anoxic HRT (i.e., 0.17 to 0.33 anoxic HRT fraction), maximum treatment certitude for target TN removal could be obtained and the maximum occurred at 3-h. Process certitude dropped consistently for targeted COD levels beyond 3-h anoxic HRT.
Process certitude was improved over 100% to 300% internal recycle (R1) for less stringent TN target and did not vary much beyond 400%. Internal recycle had marginal effect on certitude of COD removal being >90% for the range studied.
Treatment performance and certitude of the BNR system remained unaffected by increase in either sludge recycle ratio (R) or total HRT for nitrogen and COD removal.
The results predicted and analyzed in this study might vary depending on variation in quality and quantity of influent wastewater. However, operational strategies could be formulated from the above analysis, indicating that the pre-anoxic BNR process would have the highest probability of attaining the selected treatment goals for TN and biodegradable COD removal if operated at 15- to 20-day SRT, 2- to 4-h anoxic HRT, 300% internal recycle, 12-h total HRT, and 50% sludge recycle to counter the natural variation in biokinetic parameter values.
Footnotes
Acknowledgments
This material is based upon work supported in part by the National Science Foundation under Grant No. BES-0348161, and by the Mississippi Department of Environmental Quality under Work Order No. 05-0001MSU-006. The authors would also like to thank the reviewers for their critical and constructive comments.
Author Disclosure Statement
No competing financial interests exist.
Appendix A. List of Nomenclature
| bA | Decay coefficient for autotrophic biomass |
| bH | Decay coefficient for heterotrophic biomass |
| f'D | Fraction of biomass leading to debris |
| iN/XB | Mass of nitrogen per mass of COD in biomass |
| iN/XD | Mass of nitrogen per mass of COD in products from biomass |
| kh | Maximum specific hydrolysis rate |
| KNH | Ammonia half-saturation coefficient for autotrophic biomass |
| KNO | Nitrate half-saturation coefficient for denitrifying heterotrophic biomass |
| KO,A | Oxygen half-saturation coefficient for autotrophic biomass |
| KO,H | Oxygen half-saturation coefficient for heterotrophic biomass |
| KS | SS half-saturation coefficient for heterotrophic biomass |
| KX | Half-saturation coefficient for hydrolysis of slowly biodegradable substrate |
| ka | Ammonification rate |
| μA | Maximum specific growth rate for autotrophic biomass |
| μH | Maximum specific growth rate for heterotrophic biomass |
| ηg | Correction factor for μH under anoxic conditions |
| ηh | Correction factor for hydrolysis under anoxic conditions |
| YA | Yield factor for autotrophic biomass |
| YH | Yield factor for heterotrophic biomass |