
Abstract
Abstract
This study identified potential precursors and surrogates of dioxins during thermal extraction (TE) of a sooty filter dust in a wide range of operating conditions, mainly temperature (120°C–540°C) and time, during direct thermal extraction (DTE) in a dedicated commercial analyzer and indirect thermal extraction (ITE) in a thermobalance used as desorber. Using identical analytical techniques, DTE products were monitored in the range of 120°C–320°C, and ITE products were monitored in the range of 300°C–540°C. Emphasis was on polychlorinated dibenzo-p-dioxins/furans potential precursors and surrogates: aromatic hydrocarbons as well as O, Cl, N, and S compounds. Aliphatic compounds were not monitored. Product distributions differ markedly between both TE techniques: matrix effects eliminate heteroatoms O, Cl, and N, rendering especially DTE less suitable for characterizing a complex sample. Effects of temperature and time were specific for each compound and tentatively explained by low-temperature desorption (up to 240°C) and progressive evolution of volatiles and their eventual decomposition on the matrix at higher temperature. The particular filter dust sample was selected due to its amount of volatiles and fixed carbon; it derived from a baghouse filter, cleaning off-gas from a clean aluminum scrap-melting furnace. TE results strongly diverged from those obtained by solvent-extraction-based analysis. Hence, TE cannot be recommended for analyzing complex samples. A second article compared de novo formation from samples precleaned by TE with raw samples. Such tests may differentiate between dioxin formation and carbonaceous matter (de novo route) from the precursor route involving sorbed organics. Results suggest that there is little or no resemblance between TE and de novo products. The novelty of these articles resides in monitoring numerous dioxin structurally related compounds during (1) TE under reducing conditions and (2) de novo tests in an airflow. The scope of these tests is exploratory and the results suggested strong influence of the matrix on the products evolved.
Introduction
During TE, physisorbed organic compounds will desorb already at low temperatures. At higher temperatures also, chemisorbed organics may desorb, in either a clean or destructive mode. Supplemental organic products are generated by thermal decomposition of carbonaceous matter in the sample, in this case a black filter dust. Evolution of such cracking products (“volatile matter”) mainly proceeds at higher temperatures and after longer treatment periods. Products from TE are analyzed in this article, yet the evidence on their mode of generation is tenuous and can only be inferred by internal comparison as well as by reference to well-known thermodynamic effects. Three processes are expected to compete: desorption, de-volatilization of carbonaceous matter, and conversion by thermal and catalytic effects related to the presence of carbonaceous and mineral matter.
The tests aim at differentiating between these processes and accordingly throw some light on potential dioxin-related substances as well as on precursor-based dioxin formation modes: Indeed, thermally extracted organics may either act as a source (precursor) of dioxins or only accompany their formation as surrogate. TE compounds may consist of products of incomplete combustion, previously adsorbed onto the filter dust: Sorption of organic compounds is likely indeed during both off-gas cooling and its movement through the particulates, deposited onto filter sleeves. TE organics may also derive directly from carbon-in-dust, that is, from volatile matter thermally evolving from the carbonaceous matter or even from former de novo dioxin synthesis, that is, products from low-temperature catalytic oxidative breakdown of surface-chlorinated carbon that remained attached to the carbonaceous structures. The TE tests related here aim at creating supplemental possibilities for testing dust samples gathered during dioxin-related plant tests. They do not pretend to explain the formation of TE products in detail, rather only to observe such formation under various experimental conditions. Laboratory scale de novo tests were earlier developed for evaluating dioxin formation from filter dust samples by monitoring carbon oxidation and the accompanying dioxin formation (Tsytsik et al., 2008a, 2008b).
The dust sample studied results from a reverberatory furnace melting clean aluminum scrap: The molten aluminum chamber is directly heated by natural gas burners, the loading chamber by off-gas and by molten metal pumped from the melting room. The aluminum metal is alloyed with Mg, Mn, Fe, Si, Cu, Cr, Zn, and Ti. No flux is used. The off-gas is eventually cooled by heat exchange with incoming combustion air and dilution with air extracted from the workshop. Noteworthy is its irregular flow rate, determined by variable gas burner regimes, as well as its low dust content, even in raw gas. The sample studied has remarkably high carbon, polycyclic aromatic hydrocarbons (PAH), PCDF, and polychlorinated biphenyls (PCB) loads, as follows from the results in Table 1. Melting clean aluminum scrap always gives rise to dioxin emissions, despite a low tendency of alumina to catalyze chlorination or oxidative breakdown of carbon. Cardinal factors determining dioxin emissions in this application are cleanliness of raw materials and furnace technology. Also the quality of afterburning off-gas, heat exchange, and dust deposition in the flues (memory effects) may affect dioxin emission levels. Mechanistic studies are virtually nonexistent in this application. Moreover, fingerprints from distinct units differ rather markedly; and dust sampled at different moments is poorly reproducible in its amount, composition, and properties. Hence, there is little evidence for a single, specific catalytic system at work. This study is part of laboratory tests, conducted in parallel to technical tests, aiming at characterizing and limiting dioxin emissions, for example, by injection of mineral sorbents.
Units: μg/g and ng I-TEQ/g or ng WHO-TEQ/g (PCDD, PCDF, PCB).
Conventional PAH analysis reveals mainly large molecules, such as benzo(b)fluoranthene, indeno(1,2,3-cd)pyrene, and benzo(ghi)-perylene (which were not quantified by ITE, due to losses by adhesion to the walls in the TGA unit). Hence, the DTE and ITE values must be compared with a lower, 11-PAH value of only 330 μg/g.
PCBz, polychlorinated benzenes; PCPh, polychlorinated phenols; PCDD, polychlorinated dibenzo-p-dioxins; PCDF, polychlorinated dibenzo-p-furans; WHO, World Health Organization; PCB, polychlorinated biphenyls; PAH, polycyclic aromatic hydrocarbons; DTE, direct thermal extraction; ITE, indirect thermal extraction; n.a., not analyzed; TGA, thermogravimetric analyzer.
In this study, TE was applied to (1) verify the effects of temperature, time, and desorption technique used on the nature and amount of evolving TE products, (2) semiquantify dioxin-related products (potential precursors and surrogates) set free under various operating conditions, and (3) qualify their nature, that is, products of incomplete combustions, precursors, or de novo products. The latter are analyzed in a second article (Tsytsik et al., 2010), after conducting comparative de novo tests on samples that previously were thermally extracted. TE products are fundamentally different from those generated by de novo synthesis; the latter appear only marginally in TE products, and the comparison between TE and de novo products is the most essential feature of this study.
This article only briefly highlights the procedures used in characterizing the products. Development, testing, and validation of the analytical methods were already described elsewhere (Tsytsik et al., 2007, 2008a).
Experimental Section
Two different desorption techniques were used, featuring dissimilar sample geometries, carrier gas flow regimes (packed bed vs. shallow layer of particles), and, hence, contacting opportunities of evolving organics with the sample matrix (direct thermal extraction [DTE]: sample tube, inner diameter = 4 mm, length = 88 mm of which sample bed ∼20–25 mm; indirect thermal extraction [ITE]: shallow sample boat, inner diameter = 12 mm, height <3 mm).
Materials
Reagents were obtained from Supelco, Inc. and include EPA chlorinated hydrocarbon mix 8120, 2,000 μg/mL in methanol; EPA chlorinated hydrocarbons mix 8121, 2,000 μg/mL, in methanol; EPA 525 PAH mix, 500 μg/mL in dichloromethane; and 200 μg/mL in methanol. Benzene, toluene, ethylbenzene, xylenes (BTEX) mixture, 200 μg/mL in methanol was purchased from Restek Corporation, decafluorobiphenyl solution (10 g/L) was prepared from decafluorobiphenyl powder (Aldrich Chemical Corporation.) and diluted in methanol. Methanol (purge and trap grade) and dichloromethane (GC grade; SupraSolv) were purchased from Merck.
Sample characteristics
The filter dust tested is a micron-sized, cohesive black powder, resulting from (unknown) impurities accompanying clean aluminum scrap. The sample was characterized by scanning electron microscope/energy dispersive X-ray spectroscopy and by preliminary thermal tests. Major elements identified are Al, Si, and Ca. Next come (1–10 wt. %) F, Cl, Mg, Fe, Na, S, Zn, K, and P. Minor elements (<1 wt. %) are Pb, Ti, Mn, and Cu (0.17 wt. %). These elements were also monitored in minute amounts of furnace emissions; the resulting analyses are poorly reproducible.
Differential thermal analysis in air and helium monitored the heat effects mainly associated with dehydration and carbon oxidation (in air). High-resolution thermogravimetric analysis/MS typified the TE (cf. Paper I) and de novo (cf. Paper II) behavior of the sample, respectively, in helium and air. The effluent was scrutinized by means of both flame ionization detector and electron capture detector, signifying distinct evolution patterns for the compounds detected by both detector types. The sample is further characterized by its short analysis: moisture = 3.5 wt. %; volatile matter = 23 wt. %; fixed carbon = 24.1 wt. %; and ash = 49.4 wt. % (at 700°C). Scanning electron microscope/energy dispersive X-ray spectroscopy suggests high chlorine content (7.1 wt. %) of this sample. A distinct sample was subjected to complete elementary analysis of its organic fraction, resulting in (wt. %) 73.7 C; 3.8 H; 14.1 O; 2.1 N; 2.4 S; and 3.9 Cl.
Direct thermal extraction
DTE is performed in a commercial long-path thermal desorption system (Markes Unity TD) connected to a Finnigan Trace GC Ultra/Trace DSQ mass-spectrometer. A weighted sample is loosely packed into glass TD tubes and plugged at both ends with glass wool. The sample is rapidly heated to the temperature desired and thermally desorbed for the programmed time period in a continuous flow of helium carrier gas (70 mL/min); the resulting effluent is cryofocused at − 8°C on graphitized carbon (cold trap) before subsequent GC/MS analysis. Operating conditions and validation of the TE technique have been described elsewhere (Tsytsik et al., 2008a, 2008b).
For testing the effect of DTE time, four different sample aliquots of similar weight (∼40 mg) are heated at 300°C for, respectively, 4, 8, 16, and 32 min. After testing the effect of time, 8 min is selected as being the most efficient desorption time period even though high boiling aromatics take longer to evolve. For testing DTE temperature, the same sample (∼45 mg) is repetitively heated for 8 min, at temperatures stepwise increasing in 40°C increments from 120°C to 320°C. Such sequential testing eliminates intersample variability.
Analytes are identified by their mass spectra using National Institute of Standards and Technology Mass Spectral Library, 1998. Chromatographic retention times are used in some cases to confirm identification. Quantification is performed by the external standard method. One-point calibration is applied: Standard solutions of polychlorinated benzenes (PCBz), PAH, and BTEX are spiked onto a sorptive matrix (Tenax TA) filled into a separate glass tube; the tube is then thermally extracted for 30 min at 300°C. A new quantification tube is used for each test. For each target compound, quantification is based on peak area values of the most abundant ion in the spectra. The amounts of analytes not present in the calibration solution are semiquantified by using response of 1,3,5-trichlorobenzene as a reference, selected as showing the best correlation with the responses of other tested analytes during preliminary technique-validation studies. Applying the same quantification reference for “nonstandard” analytes in all tests allowed generating comparative data.
Recovery is estimated by spiking each sample tube with internal standard (decafluorobiphenyl) before sample introduction into the TD-GC/MS unit. Carry-over inside the instrumental transfer lines is routinely checked by running instrumental blanks (empty glass tubes) in between the sample runs.
Indirect thermal extraction
The sample is heated and thermally extracted in a shallow sample pan of a thermobalance, implying intermediate sampling of TE products from carrier gas onto sorbent. The sorbate is analyzed by TD-GC/MS, as already described in DTE. The sample hangs in a shallow open cup from the balance shoulder inside the horizontal tubular housing of a 951 thermogravimetric analyzer (TGA) (DuPont Instruments) (Tsytsik et al., 2007). The tubular housing is placed inside the temperature-controlled oven; a thermocouple close to the sample monitors its temperature. Carrier gas (He, 50 mL/min) passes over the sample while flushing the balance housing. After fast heating (>50°C/min), the programmed temperature is maintained for a selected time period. Two sorbents, Tenax TA and polydimethylsiloxane, were used for sampling compounds of dissimilar volatility from the effluent. The sorbents are introduced as two sequential beds inside a glass desorption tube (as used in DTE). While sampling, the tubes are cooled at −22°C in a mixture NaCl/ice (1:3).
For testing the effect of ITE time, the same sample aliquot (24 mg) is repeatedly desorbed at 300°C for 8, 16, and 32 min. A separate sorbent tube is used each time. For testing the effect of ITE temperature, the sample (27 mg) is repeatedly heated at five temperatures stepwise rising from 320°C to 540°C, upward expanding the DTE temperature domain (120°C–320°C). An ITE time of 16 min is selected; a separate sampling tube is used for each temperature. In this range of temperatures, evolution of volatile matter takes precedence over thermal desorption.
TD-GC/MS analysis, identification, and quantification of analytes sampled on sorbent proceed the same way as in DTE, except that the calibration standard is spiked on blank (Tenax + polydimethylsiloxane) tubes. Quality control procedures, including sorbent blanks and TGA blanks, as well as the optimization and validation of TD-GC/MS for semiquantifying analytes of interest were discussed elsewhere (Tsytsik et al., 2007, 2008a, 2008b).
Target compounds
The organic compounds to be monitored were selected due to structural similarity to dioxins as well as their consideration in other studies (e.g., Schwarz and Stieglitz, 1992). A second selection criterion relates to vapor pressure and its associated limitations affecting the TD-GC/MS technique used for both low and high boiling compounds. The domain of scrutiny, thus, extends from benzene (b.p. 80°C) to benzo[a]pyrene (b.p. 495°C), that is, a vapor pressure at room temperature between 104 and 10−5 Pa. In a second article, (Tsytsik et al., 2010) the yield losses associated with sorption on the walls of semivolatiles are also evaluated.
The following aromatic compounds were analyzed: benzene, toluene, ethylbenzene, xylenes (BTEX, or TEX, if benzene was not analyzed), biphenyl, and naphthalene; PAH, that is, acenaphthylene, acenaphthene, anthracene, benzo[a]anthracene, benzo[a]pyrene, benzo[k]- and benzo[b]-fluoranthene, chrysene, fluorene, phenanthrene, and pyrene; oxygenated compounds, that is, acetophenone, benzaldehyde, benzofuran, benzophenone, benzoic acid, dibenzofuran, fluorenone, phenol, and xanthone; individual heterocompounds such as benzothiophene, benzonitrile; and chlorinated aromatics, more in particular mono- to hexa chlorinated benzene (MCBz to HxCBz, with sum PCBz), mono- to pentachlorinated naphthalenes (MCN to HxCN, with sum of the compounds analyzed PCN), mono- to trichlorobiphenyl (PCB), mono- to pentachlorinated benzonitriles (MCBzN PeCBzN, with sum PCBzN), and tentatively mono- to pentachlorinated phenols (MCPh to PeCPh, with sum PCPh).
Results and Discussion
Effects of temperature
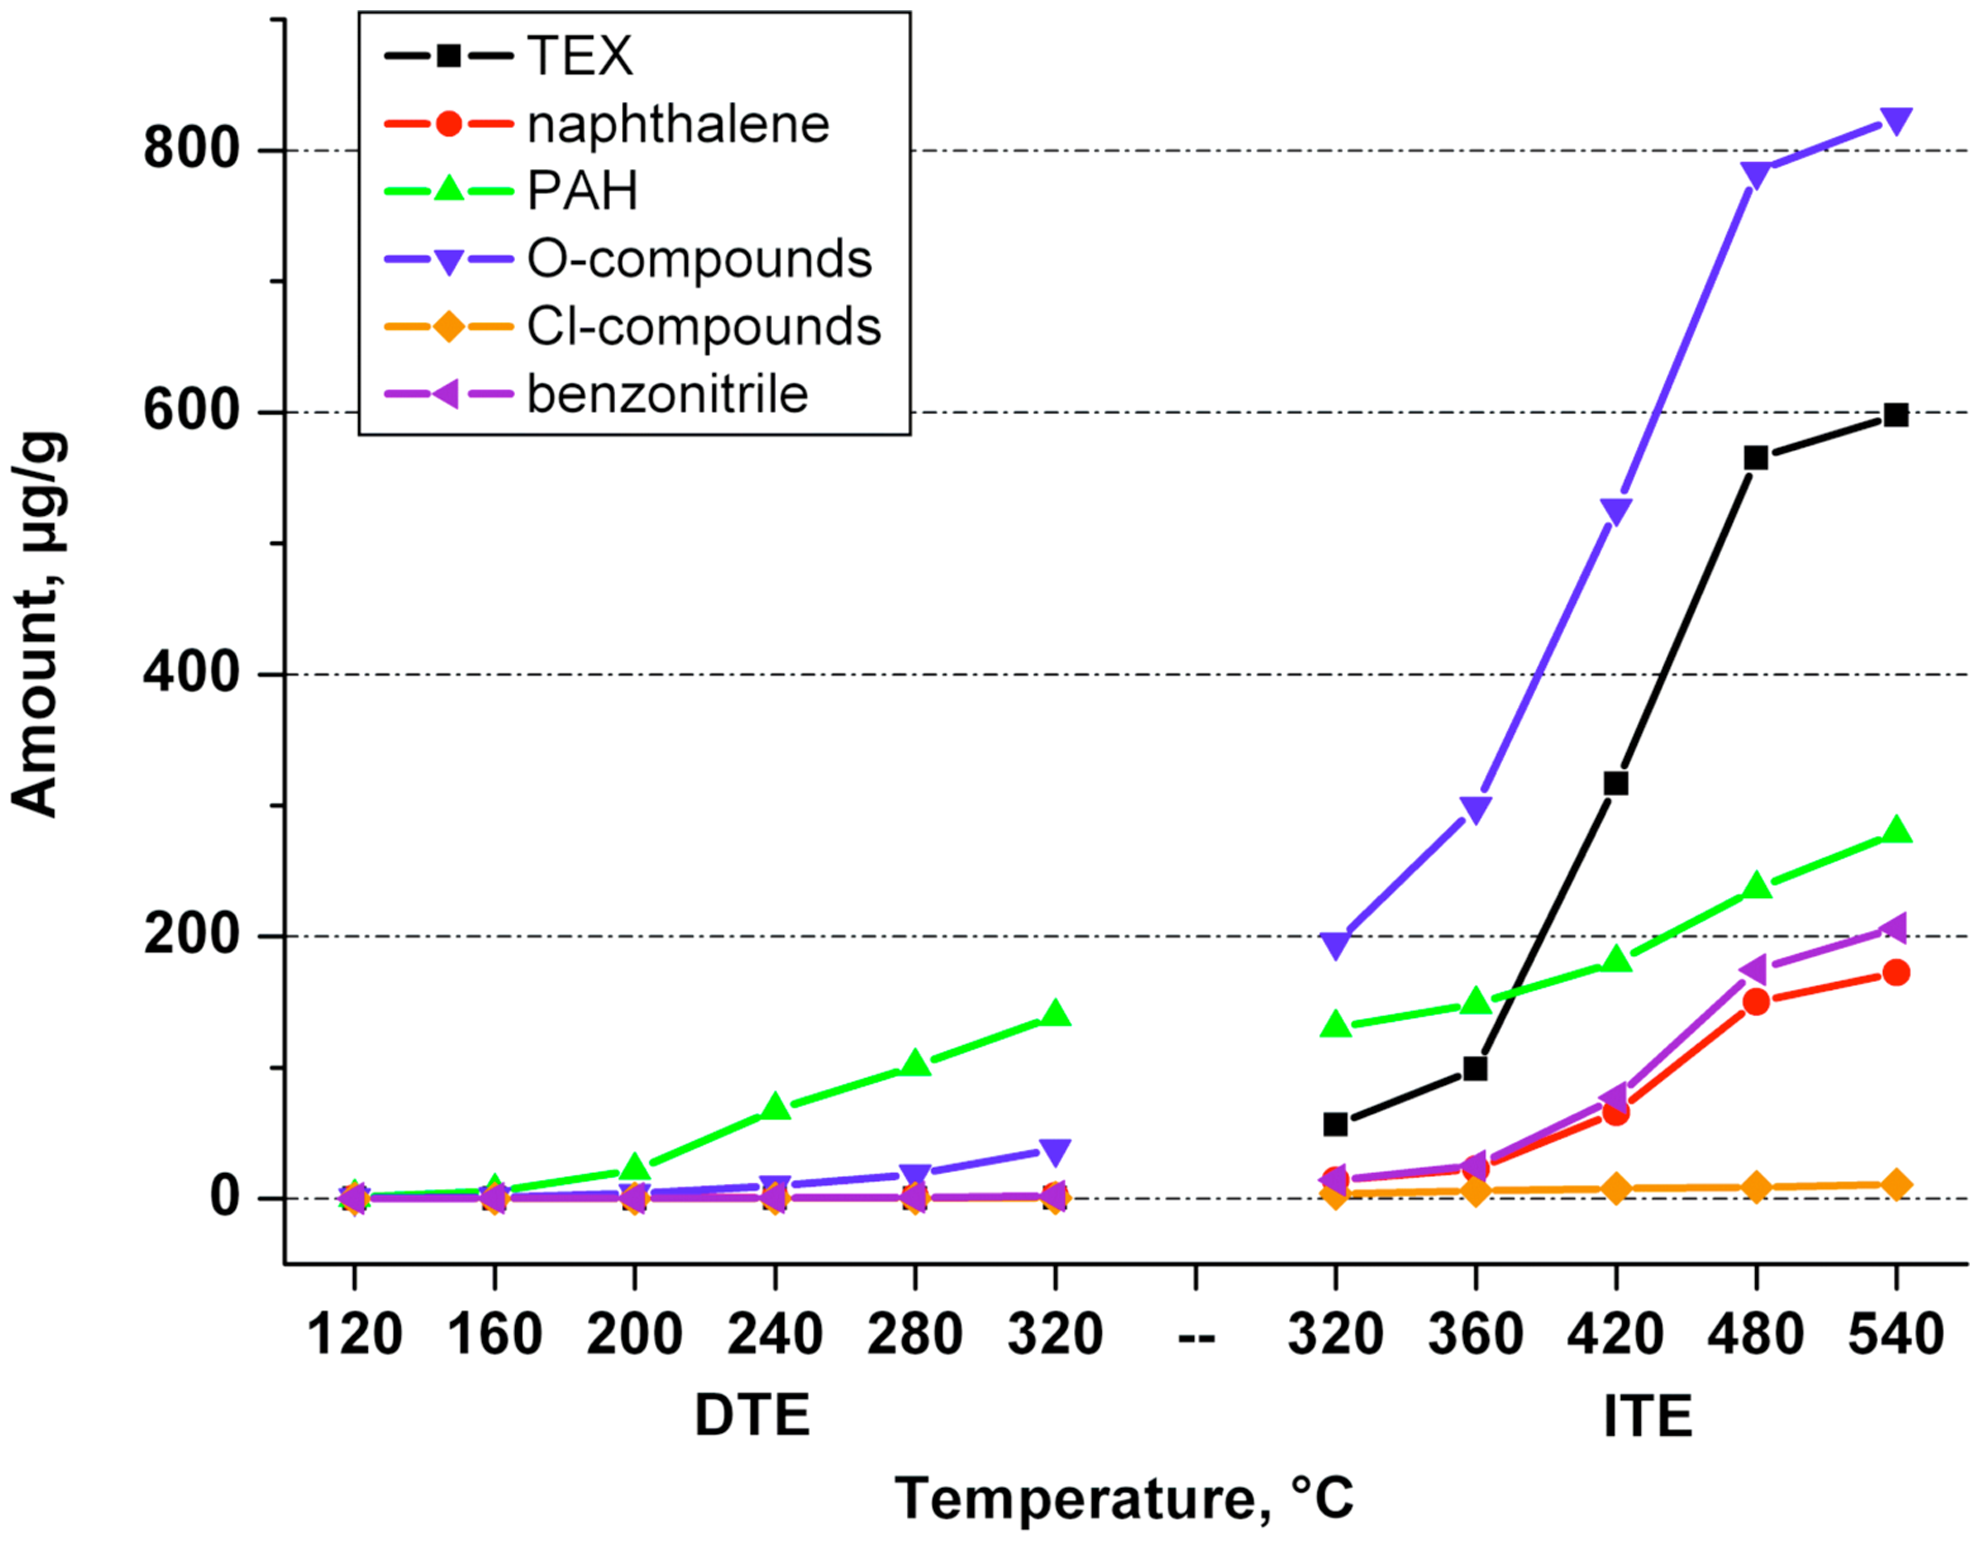
Temperature effects were studied in two temperature ranges: 120°C–320°C by sequential DTE and 320°C–540°C by sequential ITE. Sequential extraction procedures characterize temperature effects with higher sensitivity, as evolving products are undiluted by products that otherwise could have emerged already at lower temperature levels. Cumulative data total the successive differential amounts of TE compounds (Fig. 1).
Cumulative direct thermal extraction (DTE) and indirect thermal extraction (ITE) values of several compounds and compound classes (μg/g).
Amount of products
The amount of TE products steadily rises with temperature up to 240°C. Volatile matter evolves at higher temperature, in much larger amounts and an apparently erratic manner, various compounds splitting off from the matrix in specific temperature ranges.
120°C–320°C (DTE): The amount thermally extracted and identified target compounds rapidly rises with temperature from merely 1.4 μg/g at 120°C to 80 μg/g at 320°C (cumulative value: 220 μg/g). An intermediate value at 240°C (Fig. 2) looks like an outlier, yet it corresponds with peaking TE yield of several PAH and O-compounds at that temperature.
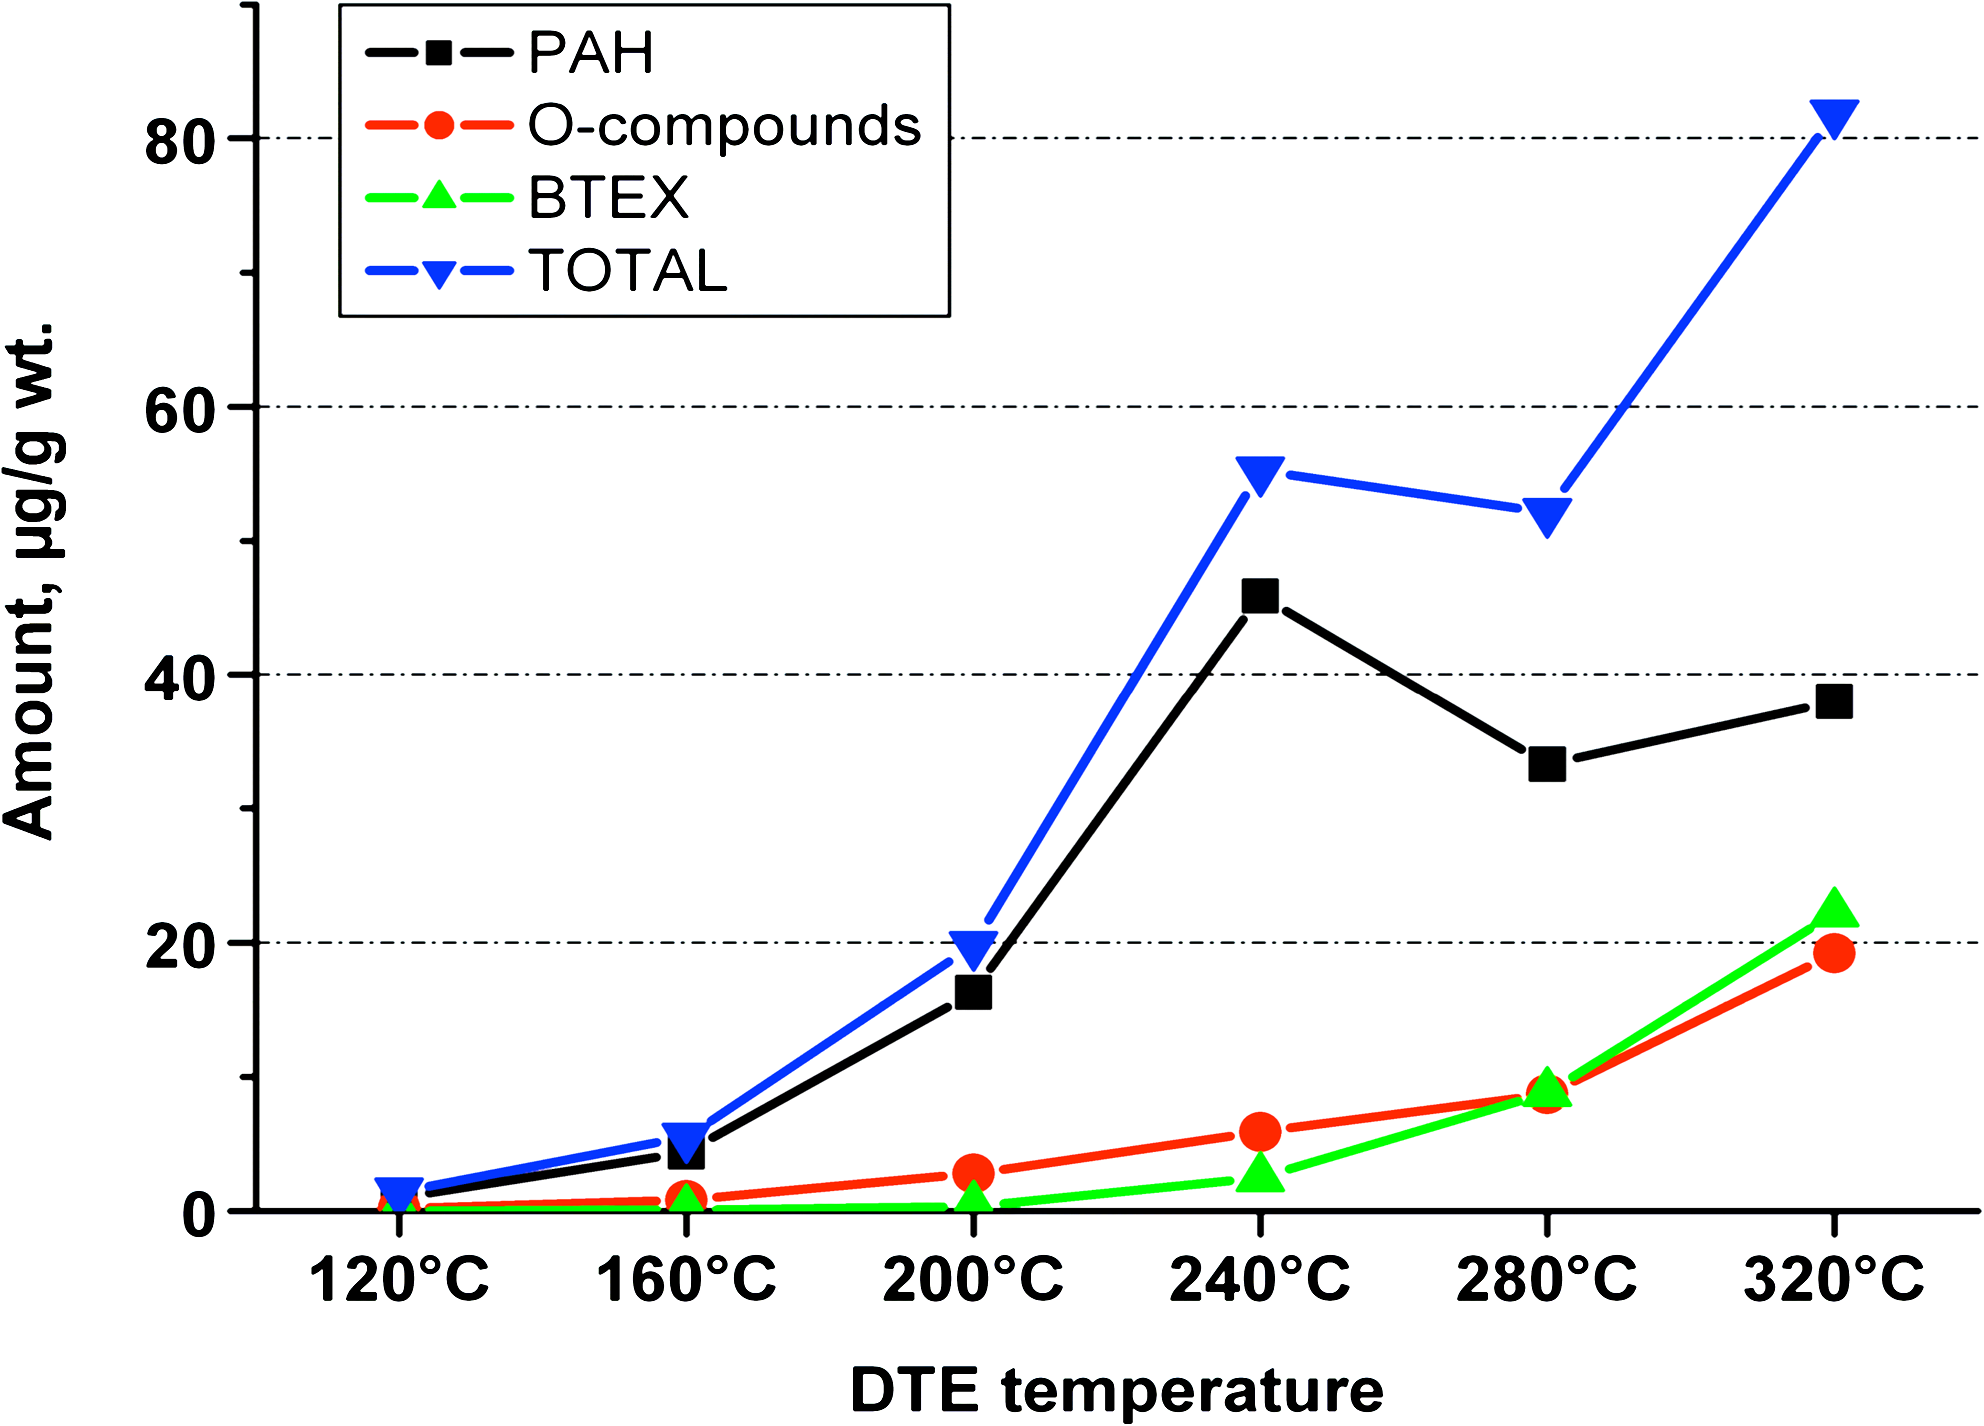
Incremental amounts of some compounds and groups: sequential DTE (120°C–320°C).
320°C–540°C (ITE): The amount thermally extracted peaks at 480°C (800 μg/g), then drops to 190 μg/g at 540°C, with a cumulative value of 2,200 μg/g, or 10 times the DTE value at 320°C.
320°C (DTE vs. ITE): The ITE value at 320°C, 16 min, compares well with the corresponding cumulative DTE value (after six successive desorption steps of 8 min at temperatures stepwise rising from 120°C to 320°C). The latter remains a factor 1.93 lower, still acceptable given the differences in geometry and operating conditions.
Product classes
The main DTE product classes are PAH and O-compounds (Fig. 2); major ITE products are O-compounds, TEX, PAH, benzonitrile, naphthalene, and biphenyl (not shown). Chlorinated compounds play only a marginal role. Aliphatic compounds have not been tracked, yet they represent presumably more than half of the real output, as is inferred from Jay and Stieglitz (1995).
120°C–320°C (DTE): The temperature field scrutinized can be subdivided into two successive ranges. From 120°C to 240°C PAH (Table 2) predominate the products analyzed and further rise in relative importance from 72 to 83 wt. % with temperature; then they decrease to 46 wt. % at 320°C. Conversely, O-compounds decline in relative importance from 16 to 11 wt. % up to 240°C, then progress, reaching 23 wt. % at 320°C. Highly volatile benzene strongly rises from nil at 120°C to 27 wt. % at 320°C. The major dioxin surrogates, PCBz, remain marginal up to 320°C (<0.3 wt. % of the output). Precursor and surrogate PCPh is first detected at the highest temperature, 320°C.
Bold-faced values indicate highest relative concentration noted in the DTE or in the ITE effluent. Underlined values indicate the main compound group at a particular temperature.
PCBzN, polychlorinated benzonitriles; TEX, toluene, ethylbenzene, xylenes.
The yield (ng/g) of almost all compounds increases step by step with DTE temperature, even if it comes on top of amounts previously extracted at lower temperatures. Exceptions are phenanthrene and fluoranthene (culminating at 200°C); acenaphthylene, anthracene, benzo[a]anthracene, dibenzofuran, fluorenone, pyrene, and xanthone (peaking at 240°C). The latter explains the peak of both “total” and PAH at 240°C (Fig. 2).
In a second approach, the yield of each compound is related to total output analyzed. At a certain temperature, ranging from 120°C to 320°C, each compound attains its relative concentration maximum (wt. %) in the DTE effluent: Individual PAH compounds and also acetophenone, benzaldehyde, benzonitrile, benzophenone, dibenzofuran, fluorenone, and xanthone emerge in a sequence of relative volatility. Tables 2–4 present the main data, both in amount (μg/g) and distribution (wt. %, of the compounds considered in that particular Table).
Bold-faced values indicate highest relative concentration noted in the DTE or ITE effluent. Underlined values indicate the main compound group at a particular temperature.
Benzo[k]fluoranthene and benzo[b]fluoranthene were not very well resolved chromatographically and, therefore, their amounts are reported as the sum.
Bold-faced values indicate highest relative concentration noted in the DTE or ITE effluent. Underlined values indicate the main compound group at a particular temperature.
320°C–540°C (ITE): At 320°C, the first ITE test value (desorption time = 16 min) is comparable to the corresponding cumulative DTE test value, totaling all volatiles liberated up to 320°C by sequential desorption (8 min at each successive temperature). ITE products show a marked maximum in output at 480°C (for total TE amount, naphthalene, biphenyl, PAH, and O-compounds) and also by thermal stability: High temperature favors shifting toward smaller molecules as well as heteroatom expulsion.
Figure 3 shows the internal distribution of PAH + naphthalene and biphenyl, as a function of TE temperature. Two tendencies add: desorption according to relative volatility, augmented with thermal formation as part of the volatile matter evolving. O-compounds similarly feature three domains: (1) desorption of various volatiles up to 240°C, (2) preponderance of phenol and benzoic acid (280°C–480°C), and (3) high-temperature compounds (fluorenone and dibenzofuran) up to 540°C. Benzonitrile escalates with temperature. PCBz and benzothiophene follow this same trend. The above seems compatible with liberation of volatiles by thermal decomposition of the soot present in the sample: In principle, the nature of evolving compounds provides information on structure and surface condition of such soot.
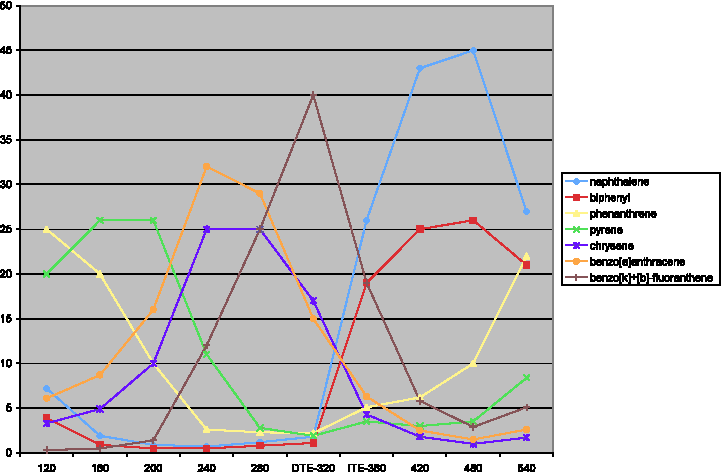
Distribution of naphthalene+biphenyl+(selected) polycyclic aromatic hydrocarbons, as wt. % of their sum. Incremental DTE values (120°C–320°C) and ITE values (360°C–540°C).
DTE versus ITE, comparison at 320°C: Theoretically, and disregarding differences in TE equipment, geometry, and conditions, the cumulative DTE value should equal the ITE value (Table 5). However, ITE values are systematically higher than those for DTE (+93% by average). Large deviations occur for TEX (benzene not analyzed in ITE) and PCPh, that is, a factor 110 and 31. Most other compounds show an ITE/DTE ratio ranging from 3.5 (PCBz) to 11 (biphenyl). Tentatively, these differences are ascribed to enhanced particle or effluent contact in DTE, prompting secondary sorption on the matrix and eventual decomposition of alkylaromatics, O, N, and Cl compounds by elimination of olefins, H2O, NH3, and HCl, probably forming further “carbonaceous matter” on the matrix.
Units: μg/g.
320°C × 8 min.
Σ (120°C × 8 min to 320°C × 8 min).
320°C × 48 min.
n.d., not detectable.
120°C–540°C (DTE + ITE): Figure 3 compares the relative importance of (selected) bi- and polycyclic aromatic compounds for rising temperatures: At 120°C, phenanthrene is the most important compound, closely followed by fluoranthene and pyrene that then take the lead at 160°C and 200°C. Benzo[a]-anthracene benzo[b]- and benzo[k]-fluoranthenes dominate at 240°C and at 280/320°C. This suggests gradual evolution, with less volatile PAH emerging at higher temperature. In contrast, the yields of relatively volatile naphthalene, biphenyl, acenaphthylene, and fluorene all keep rising, from 200°C up to the DTE final temperature of 320°C. This suggests that these compounds are mainly formed by devolatilizing carbonaceous residues.
ITE values start at 300°C and 320°C: The less-volatile PAH (chrysene, benzo[a]anthracene, benzo[b]- and benzo[k]-fluoranthenes, and benzo[a]pyrene) predominate, representing 83 wt. % of PAH (cf. Table 2). Their PAH share decreases sharply to 65% at 360°C, 38% at 420°C, and 22% at the highest temperatures. Phenanthrene becomes the most important PAH at 420°C and above, suggesting that it forms from the decomposition of larger structures.
Combining both types of data suggests that PAH desorption dominates the TE products up to 320°C, enhanced by the elimination of heteroatoms O, N, S, and Cl from the corresponding structures. Above 320°C, evolution of volatile matter, rich in O-compounds, and its eventual cracking take over. For DTE, however, matrix effects eliminate heteroatoms already at 240°C, as assessed by comparing DTE and ITE outputs at 320°C (Table 5).
At 320°C, the ITE yields of O-compounds are 5.2 times more important than in DTE (Table 5). Their further evolution with temperature, however, is quite complex. For phenol, a maximum relative share (in wt. % of total TE products) is attained at 360°C. Benzoic acid and benzaldehyde come second, yet they lose importance as ITE temperature rises (nothing suggests that their presence here is an artifact due to Tenax thermal decomposition.). At 540°C, fluorenone, xanthone, benzophenone, and dibenzofuran rise in importance (Table 3).
In DTE, benzene rises with temperature, suggesting chemical elimination rather than desorption (Table 2); BTEX is only marginally higher. Hence, de-alkylation during DTE is plausible. In ITE, TEX becomes a major product group, culminating in relative importance (36 wt. %) at 420°C. Naphthalene and biphenyl keep rising even further, attaining 12 and 9.3 wt. % at 540°C. Another strong riser is benzonitrile, attaining 17 wt. % at 540°C. Benzothiophene only appears at 420°C and higher. Chlorinated compounds (chlorobenzenes mainly) evolve somewhat erratically with temperature, with chlorophenols losing importance as temperatures increase.
The distribution of compound classes and their complex evolution with temperature in a temperature range of 120°C–540°C is presented in Tables 2–4. In relative amounts, DTE yields much more PAH (64% against 31 wt. %) than ITE, which conversely generates much more heterocompounds (Table 5). Above 320°C, however, the latter gradually become unstable, so that light aromatics and benzonitrile gain in relative importance. The question arises as to how far this distribution depends on surface structure and cracking activity of soot carbon and on matrix effects. Testing samples of diverse origin along similar lines as well as dedicated model experiments may answer this question.
Temperature effects
120°C–320°C (DTE): Individual as well as grouped yield values (ng/g) generate linear plots in an Arrhenius diagram, especially when considering cumulative rather than individual values (Fig. 4). The first show an average “activation energy” of 56 ± 29 kJ/mol. Stronger temperature effects (E > 84 kJ/mol) appear for benzoic acid, benzo[b]- and benzo[k]-fluoranthenes, BTEX, and benzene (Table 6). High E-values suggest either (a reversal of ) chemisorption or formation by chemical reaction. Lower E-values appear for Cl compounds, fluorene, dibenzofuran, naphthalene, and biphenyl (E < 33 kJ/mol), suggesting either physical desorption or—for Cl compounds—strong dechlorination.
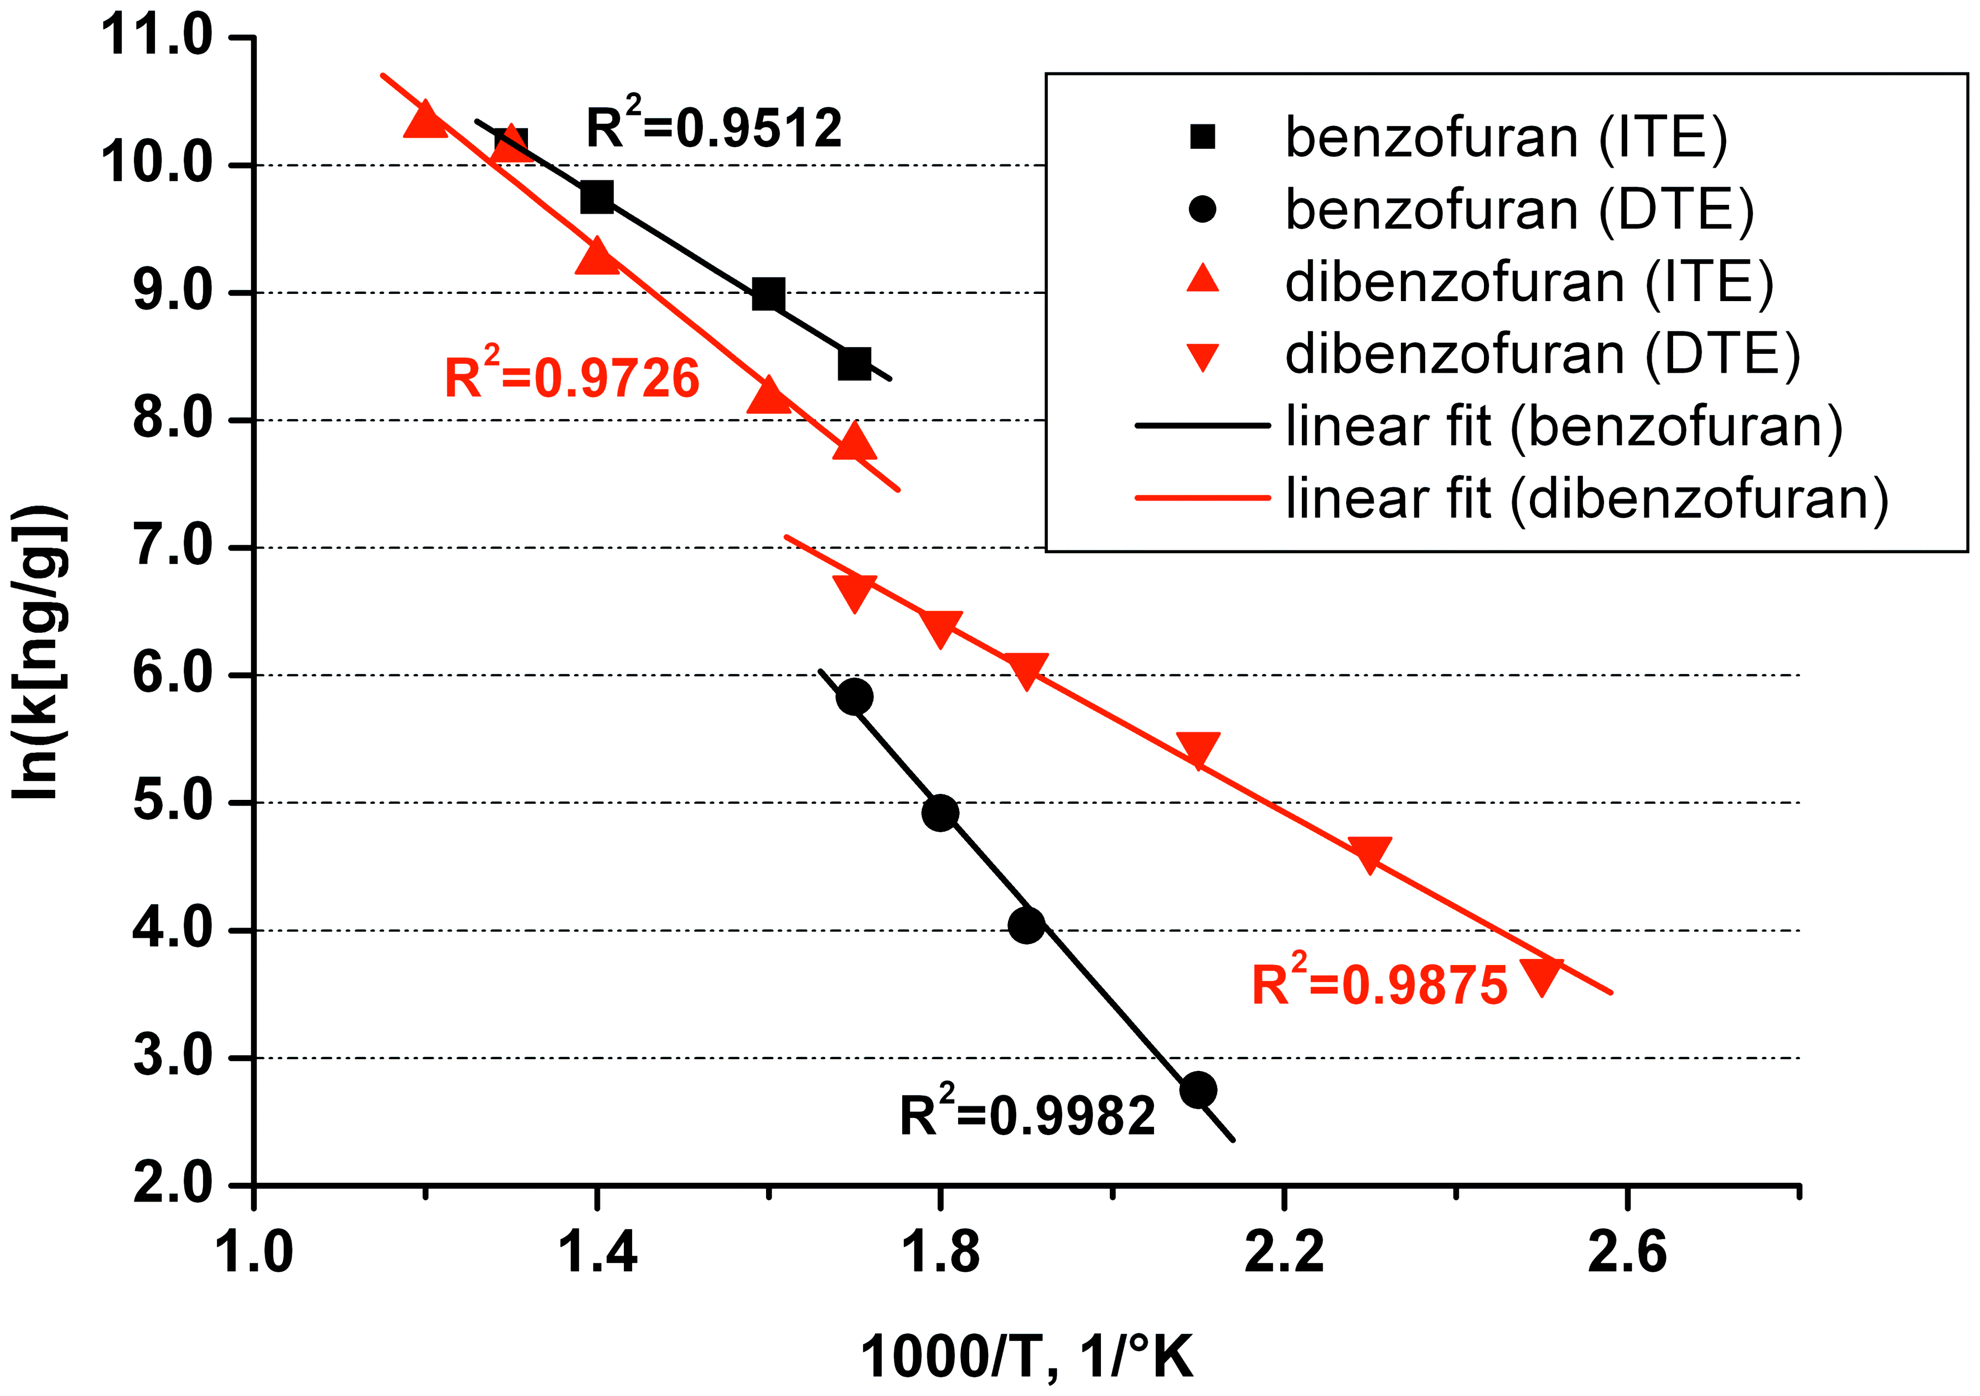
Arrhenius type representation of DTE and ITE yields for benzofuran and dibenzofuran.
DTE 120°C–320°C (8 min, each 40°C) and ITE 320°C–540°C (16 min, each 40°C).
(B)TEX, (Benzene), toluene, ethylbenzene, xylenes.
320°C–540°C (ITE): The temperature effect leads to Arrhenius plots with markedly lower average E-values (average of 32 against 56 kJ/mol) as well as doubtful linearity.
Arrhenius plots also allow comparing DTE with ITE values (Table 6). At 320°C, a step change marks the transition from DTE toward ITE (Fig. 4). DTE values for 120°C–320°C and ITE values for 320°C–540°C, although generally well defined, show no correlation at all, suggesting complex pathways in formation and destruction of individual compounds as well as distinctive effects in both techniques and associated temperature domains.
Internal crosscorrelations
The various compounds and groups were checked for the strength of statistical crosscorrelations, scrutinizing analogies and differences in appearance. Internal correlation between successive DTE values is strong (r2 > 0.993), even for “outlier” 240°C values (r2 = 0.982). Cumulative DTE and corresponding ITE value correlate reasonably well at 320°C (r2 = 0.864) and definitely better than further ITE data sets at fixed temperature (r2 varies between 0.69 for 360°C and 0.76 for 480°C), indicating important shifts in product distribution with rising temperature.
Crosscorrelations are also strong among most product groups. The sum of O-compounds correlates well with, for example, phenol (r2 = 0.998), (B)TEX (r2 = 0.985), biphenyl, naphthalene, PCBz, benzonitrile, least so with benzothiophene (r2 = 0.937), PCPh (r2 = 0.893), and—least of all—PAH (r2 = 0.64). A notable exception is PAH, poorly correlating with all other products, with r2-values ranging 0.49–0.66, BTEX excepted (r2 = 0.924). The following PAH pairs correlate well internally: fluoranthene/pyrene, naphthalene/biphenyl, and chrysene/benzoanthracene (cf. Fig. 3).
As a dioxin surrogate, PCBz deserves particular attention. Despite its marginal amount, its correlation with all other compound classes is excellent, least so with naphthalene, benzonitrile, PCPh (r2 = 0.915), benzothiophene (r2 = 0.874), and, again, PAH (r2 = 0.657).
Effects of time
Unexpectedly, time is a significant experimental variable. Packed bed DTE operating conditions favor chromatographic retention of high boiling compounds, so that high boiling compounds emerge later. Moreover, both DTE matrix effects as well as higher ITE test temperatures stimulate chemical conversion, affecting distinct TE products differently.
Direct thermal extraction
Former DTE experiments for 4, 8, 16, and 32 min at 300°C on an iron ore sintering sample (filter dust) showed that PCBz already attain full desorption after 8 min (Tsytsik et al., 2008b). Here, the DTE test time again was set at 4, 8, 16, and 32 min; total output increased from 85 μg/g after 4 min to 210, 220, and 240 μg/g after 8, 16, and 32 min, respectively (Tables 7–9). The last increments seem marginal, yet they are accompanied by marked shifts in evolved product distribution. After 4 min, few compounds already attain almost (>75%) their maximum yield (in μg/g of dust), that is, benzaldehyde, fluoranthene, phenanthrene, mono-CBz, fluorenone, and PCBz. Most compounds peak at 8 min and then decrease somewhat, especially the most volatile compounds. Conversely, benzene, phenol (the most important O-compound), and benzaldehyde continuously rise with time, suggesting continued formation. Slow starters are in escalating sequence: benzoic acid, benzoanthracene, chrysene, benzo[b]- and benzo[k]-fluoranthenes and benzo[a]pyrene (Table 7), suggesting chromatographic progression in a packed DTE column.
Acenaphthene was also analyzed, yet always remained < detection limit (DL). For each compound, the value in bold corresponds to the highest relative concentration reached.
Note the rising importance of Sum (pyrene, chrysene, benzo[a]anthracene, benzo[k]- and benzo[b]-fluoranthene, benzo[a]pyrene) up to 32 minutes.
For each compound, the value in bold corresponds to the highest relative concentration reached.
Note the initial importance of Benzophenone + Fluorenone + Xanthone.
Total, % and total, μg/g are given without n.a. compounds.
n.a., not analyzed; n.d., not detected (compound amount is below the detection limit of the technique).
Among PCBz, only mono- and di-CBzs are systematically detected, with a PCBz-amount statistically invariant with time (r2 = 0.005) at 469 ± 72 ng/g. The weight average level of chlorination is very low, at 1.23 ± 0.04. No chlorophenols are detected at all. Benzonitrile is a prominent compound. However, sulfur compounds, such as thiophene, benzothiophene, or benzothiophenone, remain undetected.
In brief, for DTE, for most compounds maximum yield is already attained after 8 min; the 4 min-values are depressed by physical factors, such as sample heating and venting. Later increases seem associated with slow TE from desorption tubes, due to re-adsorption of high boiling compounds and continued creation of phenol, benzaldehyde, and benzene by thermal devolatilization.
Indirect thermal extraction
The effect of time is strongly marked for ITE, indicating rising contributions of chemical reaction with temperature. Linear extrapolation of yields obtained after 8, 8 + 16, and 8 + 16 + 32 min, toward time zero allows tentatively distinguishing between instantaneous desorption at time zero and continued formation with time. Individual compounds were classified according to the relative share of both initial and subsequent contributions and according to the shape of their evolution-with-time curves: Chlorinated compounds almost perfectly fit a linear rise in time, whereas O-compounds follow curves with decreasing ascent slopes.
DTE Versus ITE
Evolution with time at 300°C is much more pronounced for ITE than it was for DTE. The initial ITE value extrapolated toward zero time varies from 25.9% (PCBz; r2 > 99.9%) to 78.5% (PAH) with an average value of 57.8%. Major risers with time are PCBz, chlorobenzonitrile, biphenyl, benzonitrile, TEX, and PCPh. The initial DTE value extrapolated toward zero time from the 8, 16, and 32 min values is less well defined: Only O-compounds (62.8%), PAH (72.4%), benzene (73.4%), and an average value of 72.7% can be derived.
Comparison of TE with SE
Conventional SE-GC/MS yield “standard” values for all individual EPA-16 PAH, PCBz, PCPh, PCB, and polychlorinated dibenzo-p-dioxins/furans (PCDD/F) (Table 1). Some values are now compared with those obtained by DTE and ITE. Literature cited cases with strong similarity between those two types of values (Zou et al., 2003).
Polycyclic aromatic hydrocarbons
DTE yields 11 different PAH in total cumulative amounts between 1 and 140 μg/g, escalating with temperature. However, at 320°C, only ∼40% of the comparable value from extraction-based analysis (330 μg/g) is attained. Nevertheless, some single PAH compounds actually exceed individual extraction-based values, for example, anthracene, acenaphthylene, and six others reproducing the extraction values well.
At 320°C, ITE yields slightly less than DTE; at 540°C, 90% of the expected amount (330 μg/g) appears. Some compounds, nevertheless, largely exceed expectations: naphthalene (× 110), fluorene (× 40), acenaphthylene, anthracene, and phenanthrene (× 5–7), whereas high boiling PAH show 25%–55% deficit. Possible physical explanations are strong sorption onto the sooty matrix, retarding TE, conversion into light PAH, or retention in the TGA housing.
Polychlorinated phenols
The dust contains 465 ng/g of PCPh, with a weight average chlorination level of only 1.19 (Table 1). DTE yields no chlorophenols at all in a range of 120°C–280°C, although quantification limits are well below the extraction-based concentration of diverse PCPh isomers. Only at 320°C, di-CPh (65.6 ng/g) is detected; at the same temperature (320°C), ITE yields not <2,130 ng/g of mono-, di-, and tri-CPh, rising to a cumulative 3,630 ng/g for successive runs at 320°C–540°C.
Hence, DTE liberates less than 15% of the amount available according to extraction-based analysis, whereas ITE yields 7.8 times that theoretically available amount. These contradictory figures suggest coexisting loss and formation pathways. Possibly, in particular during DTE, chlorophenol loses one or more heteroatoms on volatilization. Thermal volatilization of preexisting chlorinated and oxidized soot structures may liberate chlorophenols, yet this requires further confirmation.
Polychlorinated benzenes
All PCBz isomers are identified and monitored. Conventional analysis by SE-GC/MS yields merely 0.135 μg/g with weight average chlorination level of 1.63, to be compared with 1.23 (DTE) and 2.26 (ITE), both at 300°C.
DTE fails to show any CBzs below 240°C (b.p. of monochlorobenzene = 131°C), suggesting strong adsorption, considering their vapor pressure values, or else strong dechlorination. For 240°C–320°C, however, DTE yields a cumulated 0.47 μg/g, that is, 3.5 times the theoretical amount available.
The ITE yield of PCBz linearly rises with time at 300°C. In a temperature range of 320°C–540°C, ITE generates 6.6 μg/g, that is, 50 times the PCBz amounts available according to conventional analysis, thus suggesting that in situ PCBz formation is much more important than the amounts originally available in the sample.
In summary, there is both poor resemblance and a complex relationship between results from DTE-, ITE-, and SE-based analysis (Table 1). DTE may lead to incomplete recovery after matrix effects. ITE recoveries are partly incomplete, even at 540°C, and partly inflated by PAH in volatile matter. PCBzs as well as phenols appear at much higher concentrations than those measured by SE-GC/MS and are, hence, to be regarded as thermal decomposition products of dioxin-relevant chlorinated compounds or carbonaceous structures. Since anoxic conditions lead to thermal dechlorination, the real PCBz formation actually could have been even much higher than measured.
These results cast serious doubts on the value of TE studies conducted on reactive matrices, especially at temperatures above 240°C for a DTE sample and above 320°C for a shallow layer ITE sample.
The DTE tests truly reveal desorption up to 240°C, higher values being influenced by matrix effects, leading to heteroatoms, such as O, N, and Cl, being eliminated. The ITE tests confirm desorption up to 320°C, evolution of volatile matter at higher temperature. The contribution of chlorinated compounds on the evolved products remains marginal at all operating conditions.
Footnotes
Acknowledgments
Author Disclosure Statement
No competing financial interests exist.