
Abstract
Abstract
Industrial air pollution from point and nonpoint sources of steel complexes has drawn increasingly more public attention in the past decades. Previous research efforts have been more concentrated on point sources of particulate emissions from these complexes. However, wind-induced particulate emissions from iron ore storage piles not only result in ambient air pollution but also increase economic adverse effects to the industry by loss of process raw materials. Experiments were conducted to assess the impact of wind speed and humidity on particulate emission rates from iron ore storage piles. A wind-generating system and specific iron ore, experimental piles (L:W:H of 30:11.5:5 cm) were constructed to evaluate emission rates at four different wind velocities (4.3, 5, 7, and 11 m s−1). Optical and electron microscopes were used for determining size distribution of particles at various distances from emission source. Moreover, the decrease in emission rate was evaluated by changing the percentage of pile surface water content at the maximum speed. Finally, experimental results were compared with classic erosion equations and common parameters such as shearing velocity. Results indicated emission factors of 478, 1,527, 2,315, and 4,409 g m−2 for 4.3, 5, 7, and 11 m s−1 wind speeds, respectively. Pile surface moisture content variations indicated a decrease of 47%–77% in wind-induced particulate emissions for pile surface water content of 2% and 10%, respectively. However, inherent differences between natural winds with continued exerted force and experimental conditions of produced wind were attributed to relatively shorter distance transport of particulates in this study.
Introduction
Storage piles of iron ore constitute a major nonpoint source of particulate air pollution emissions emanating from steel industry sector. Particulate emission from these piles can occur at various stages of loading, storing, reclaiming, and handling by the belt conveyors to the processing units and it becomes more severe at higher wind speeds. As these materials serve as raw material to the steel-making process units, increased economic losses experienced exacerbates the problem.
A multitude of physiochemical parameters can influence spatial and temporal variations of particulate emissions, including wind speed, wind direction, particle size distribution, particle density, height, shape, and exposed area of the pile, prevailing relative humidity, and the hygroscopic nature of pile materials (Badr and Harion, 2005). Soil wind erosion studies date back to days when air pollution had not gained importance. Ever since, a great number of efforts have been devoted to understand the mechanics of wind-induced erosion. Greeley and Iversen (1985) defined three different modes for wind-induced particulate motions depending on the intensity of external forces exerted and the size and density of particles on the pile surface. Particle motion begins with creeping, that is, rolling motion of particles without actual dislodge from the surface. With increased applied stress from the air current, saltation, the sudden uplift, ensues in the second stage. The smallest particle fractions, ranging from silt to clay, start moving in suspension mode, a process that seems to be mainly initiated by the impact of saltating particles (Shao et al., 1993; Fang et al., 2002). Potential particulate air pollution from natural soil surface and industrial raw material piles results when conditions are ripe for onset of saltation and suspension mode wind transport.
Von Karman (1941) estimated the travel time and distance of the soil particles uplifted from the surface. Using Stokes' regime assumptions and introducing an exchange coefficient (E) to account for turbulence effects, he suggested the following expressions (Vanoni, 2006):
where t is particle travel time, L is the distance traveled by the particle, ds is the particle diameter, μ denotes fluid viscosity, ρ is the density difference between air and particle, u is the mean wind velocity, and g is the gravity acceleration. An estimate of E for relatively strong winds was suggested to be 104–105 cm2 s−1.
Wind current, the main external force, affects the surface pile in the form of shear stress. This stress is defined as a function dependent upon friction velocity, u* (Sinclair Knight Merz Group, 2005).
The minimum friction velocity that will uplift the smallest particles from the pile surface is called threshold friction velocity. Theoretical studies by Bagnold in 1941 and Iversen in 1982 have demonstrated that the size and density of particles and the air are related as follows, to estimate the threshold friction velocity values (Mansell, 2004):
Threshold shearing velocity studies (Greeley et al., 1973) conducted on simulated conditions prevailing at Mars planet surface soil (particle specific gravity of 1.3–11.3, with a diameter range of 10–1,300 μm) further refined the value of dimensionless parameter (A) in Bagnold equation as follows:
where u is the wind velocity, u* is the friction velocity, and dp and ρp denote the average diameter and density of the materials. Cl indicates lift coefficient, which is the most complicated parameter to be estimated in this equation.
There are only limited data in literature on the dynamics of wind erosion and storage pile emissions except ones using computational fluid dynamics methodology. The modeling efforts by Torano et al. (2005) focused on comparing storage piles with dissimilar formations and equal volumes (particularly oval and conical ones). Further elaborations were also made on the variability of friction velocity coefficients in various parts of the pile surface (minimum of 0.2 on the edges and up to 0.9 on the top center) and different wind directions (Torano et al., 2006; Badr and Harion, 2007). U.S. Environmental Protection Agency (US-EPA) suggested that the emission factor for wind-generated particulate emissions from mixtures of erodible and nonerodible surface materials may be expressed as follows (US-EPA, AP-42, 2006):
where EF is the emission factor in g m−2 year−1, k is the particle size multiplier depending on water and silt content, N is the number of disturbances per year, and Pi is the erosion potential corresponding to the observed (or probable) fastest mile of wind for the ith period between disturbances in g m−2.
It should be noted that the erosion potential is valid only for u* > ut* in Equation 7. If u* is less than the threshold friction velocity, dislodging of the particles will not occur (Countess Environmental of WRAP, 2006).
Experimental Protocols
Laboratory-scale iron ore piles were constructed using minerals used in typical steel complexes. These piles were positioned at the end of a designed system for wind generation. Water was used to increase pile surface water content. Experiments were conducted by varying wind speed and pile water content to evaluate the effect of influential parameters on particulate emission.
Wind generator and experimental setup
Several prerequisites need to be considered in designing a wind tunnel for wind erosion. The results of two previous researches (Wei and Desmond, 2005; Maurer et al., 2006) were used for designing the wind generator. Because of limitations in the usage of wind tunnel for collecting the wind-blown particles, the existing standard wind tunnel was modified for the particular goal of this project. The most important constraint in wind tunnel design is providing a natural logarithmic wind profile, in addition to minimizing the turbulence effect (Wei and Desmond, 2005). On this ground, a specific wind blower was designed to create the required threshold shearing velocity for dislodging and transporting particles (Fig. 1). Centrifugal blower provided up to 1,500 m3 h−1 of flow passing through a conical duct, leading to another 100-cm-long circular section having a diameter of 40 cm. In fact, the conical section acts as a diffuser to create an initially laminar flow, that is, the duct facilitated the gradual development of uniform speed at the cross section of the outlet (Hagen, 2001; Wei and Desmond, 2005; Maurer et al., 2006). The result of a classic study by Cermak (1981) showed that the required length for a wind tunnel without any elements to provide boundary layer thickness is 15 m. Consequently, a set of stone-made spires were arranged (between the wind generator and storage pile) to simulate the atmospheric boundary layer and shorten the required length (Wei and Desmond, 2005). Irwine (1981) conducted some dedicated wind tunnel experiments to investigate the role of spire geometry in the resultant boundary layer. The result of this study demonstrated that for h as the height of spires and h/2 as the space between two successive spires, the boundary layer would be generated for a distance equal to 6h. For example, set of 6-cm-high spires, which are 3 cm apart, makes a boundary layer with at most 50 cm thickness for a length of about 35 cm. In this study, 16 stone-made spires in four rows were attached to the duct bottom and their height of 6 cm provided a logarithmic boundary layer profile before contact with the pile surface according to the measurements with an anemometer at two elevations on the side walls. As the diameter of the duct was 40 cm, all the sections were inside the boundary layer.

Schematic of the experimental setup (dimensions are in millimeters).
To study the saltation condition (suspending and creeping particles were not of interest) by a wind tunnel, Froude number is dominant as it describes flow conditions in a spatially restricted environment as well as wind tunnel (Maurer et al., 2006). Equation 8 indicates how Froude number is calculated in wind tunnel studies.
where u is the mean wind speed, g is the gravity constant, and H is the wind tunnel height. Owen and Gillette (1985) suggest Fr = 20 as the maximum acceptable value, as in higher Froude numbers the saltation flow can be influenced by tunnel dimensions. As the diameter of used wind tunnel in this study was 40 cm, the highest acceptable value for wind speed to sustain Fr < 20 is 8.8 m s−1. Therefore, except the last experiment, which has been done at the highest velocity, the aforementioned constraint was not violated.
A 1-m-wide, 5-m-long table was positioned in front of the wind blower outlet so that lateral and longitudinal particle dispersion profiles could be ascertained. Low-depth plastic dishes were also positioned on the table for collection and mass estimation of dispersed particles at different distances (Fig. 1).
Storage pile
Iron ore with 65% hematite content was used to construct horizontal prisms (L:W:H of 30:11.5:5 cm) simulating actual storage pile geometry (Table 1).
Domain of particle dispersion
First, piles with known particle quantity were set up. Based on the initial set of preliminary experiments, a length of 3 m for low wind velocities and 5 m for high wind velocities were considered adequate for the transport domain of particles. The criterion for determination of the extent of dispersion was that at least 97% of the transported mass had to be accounted for. To do this, experiments were conducted for a period of 30 min at different velocities. A total of 60 plastic dishes with 20 × 15 cm dimensions were fixed to the table for collection of dispersed particles. At the end of each experiment, the weight loss of iron ore pile was measured and all the dishes, which had been weighed before the experiment, were weighed again with a digital well accurate scale device. In this way, the reduction in ore pile weight was matched with the weight of particles collected throughout the dispersion area. As particle densities were assumed to be the same, distance traveled would be related to particle size and thereby size classification could also be ascertained.
Iron ore
Chemical composition of the iron ore (Golgohar mine, located in Kerman, south central part of Iran) used in the experiments was determined by X-ray Fluorescence (XRF) method. For this part of research, it was very important for us to be acquainted with specific in-hand samples. Output tables of XRF device reported 61.08% Fe2O3 (hematite) and 25.47% FeO as the prevailing constituents of existed iron ore. MgO, SiO2, Al2O3, CaO, S, Na2O, P2O5, V2O5, TiO2, MnO, and K2O were other constituents.
Particle density was determined using a standard volume difference method. Basically, it involved pouring a sample of iron ore into a graduated cylinder containing water and determining volume difference before and after addition. The mean particle density was specified to be 4,515 kg m−3. The particle size distribution was determined by a combination of optical and electron microscopies followed by high-resolution computer-based graphical grid processing. In optical microscopy, images were taken from subsamples of 1 g of homogenized iron ore sample. The analog images were then processed digitally in 0.5 × 0.5 cm square grid resolutions by appropriate graphic softwares. By counting the number of occupied squares or a fraction thereof, an equivalent diameter was assigned. A magnifying coefficient of 100 and a photo-developing process correction factor of 1.3 were applied to these values to come up with the final particle diameter. The mean particle diameter calculated by this method was 33 μm, with a standard deviation of about 26 μm.
For electron microscopy processing, two 4-g specimens of the iron ore were selected randomly and were subjected to transmission and scanning electron microscopy preparatory procedures. As shown in Fig. 2, the particle shapes are highly irregular and far from sphericity. As mentioned earlier, an equivalent spherical diameter was calculated through digital processing of the pictures.
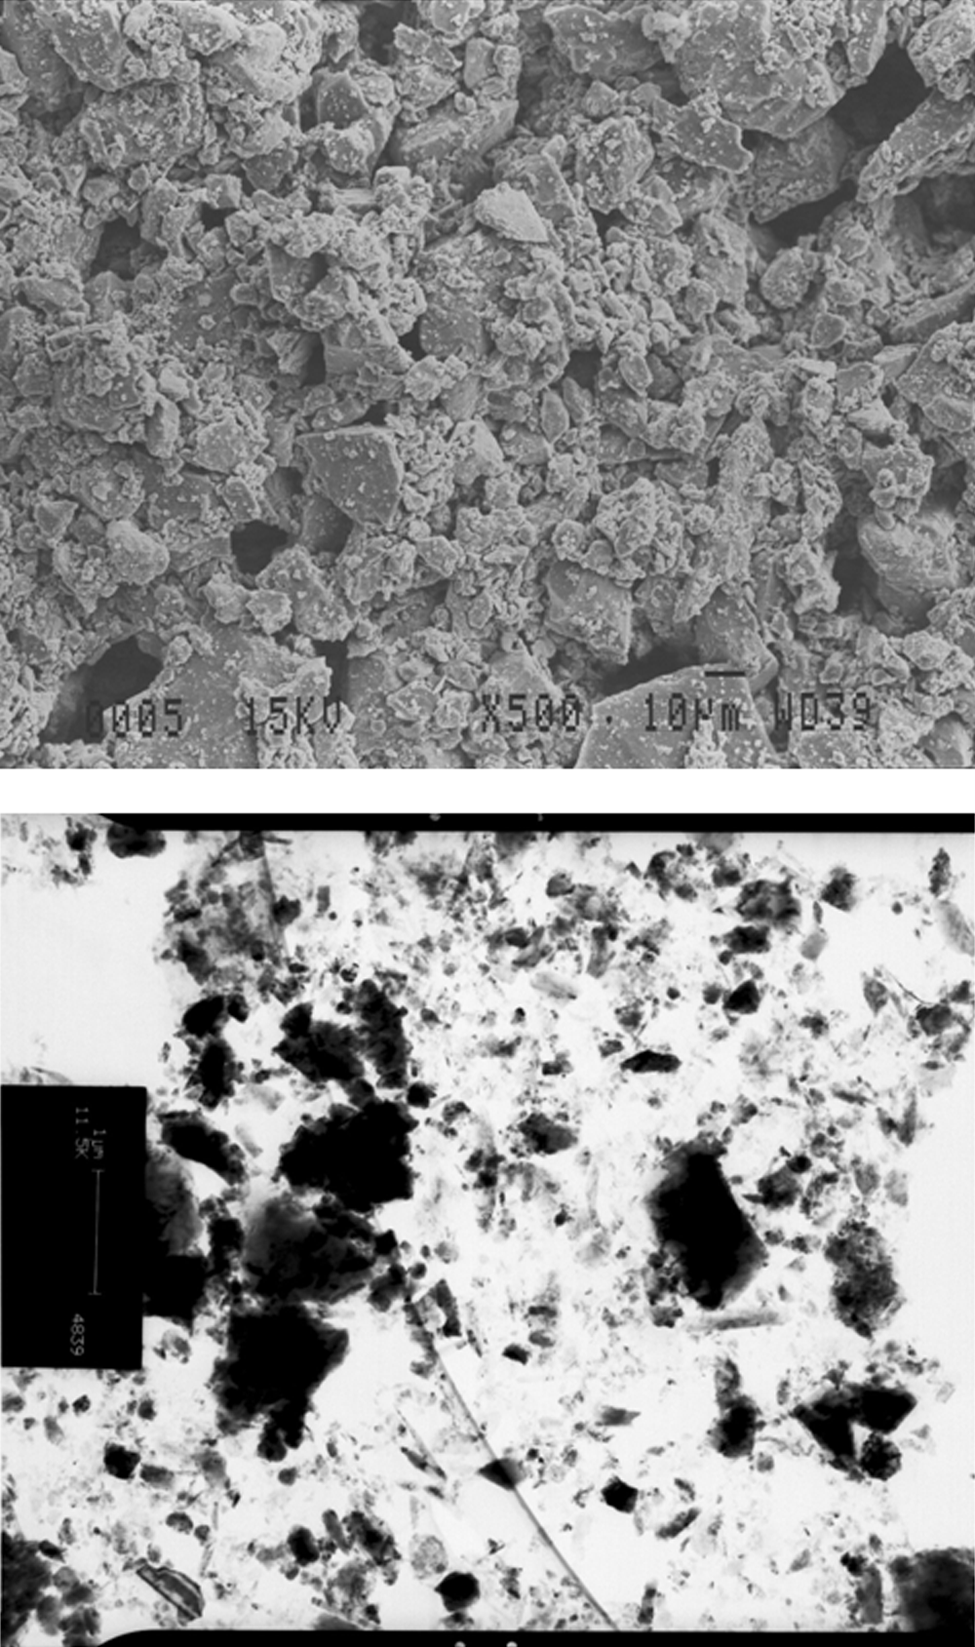
Transmission and scanning electron microscopy images from the iron ore specimens.
Wind velocity
The selected velocity range of 2–11 m s−1 for the experiments were based on the observed lowest and highest recorded wind speeds in the nearest weather station in the vicinity of the steel complex located in Ahwaz, a city in the southwestern part of Iran, in 2006. Measuring the velocity of the wind in experimental set up was done using KIMO VT 100 with a 0.1 m s−1 resolution positioned at two points with different elevations on the wall of the cylindrical duct and finally on the top of the pile crest. Maurer et al. (2006) applied pitot tube anemometers for wind profile measurements. Thus, after surveying the correspondence of produced wind at the outlet with the predicted wind profile, the digital anemometer was fixed on top of the prismatic iron pile to measure the friction velocity for each applied wind speed.
Wind erosion
Separate wind erosion experiments were conducted for 30-min periods at four different wind speeds. The same pile geometry was used for each experiment to avoid particle dislodging and transport complications resulting from changing exposed surface. For lower wind velocities, particle collection dishes were positioned up to 3 m far from the wind simulator outlet; this distance was extended to 5 m for higher velocities i.e., 7 and 11 m s−1. Light plastic dishes were used to provide direct measurements without the need for collecting particles and transferring them to other dishes prior to measurement, thereby avoiding errors resulting from residual particle mass remaining on the dish surfaces. The required length and width of the collection dish arrangement was determined from preliminary tests wherein the total mass difference of pile during the experiments was compared with the total mass collected in plastic dishes.
Water content
Atmospheric humidity affects the water content of iron ore storage piles in steel complexes. Likewise, spraying out some additives such as water on the storage pile surfaces as the simple way of reducing the wind erosion influences the phenomenon. As such, a scheme had to be developed to simulate varying behaviors of particulate emissions under different pile surface water content conditions. As the exposed surface water content is the main determinant of the change in degree of wind-induced erosion, a 1.5-cm top layer was considered as the target surface for these experiments. This depth was determined by calculating the total mass reduction experienced at the highest wind velocity of 11 m s−1. Hence, three piles with the same side slopes were built in three different surface water contents and were divided into two parts comprising a central part with 3.5 cm height and another 1.5 cm related to the upper layer. To make sure the added water was distributed only on the top layer, a plastic film was used to separate this layer from the remaining depth of the pile. Attempts were made to ensure uniform surface irrigation of this top layer by a sprinkling device from a fixed distance with a minimum common radius of influence. The exposed surface for the 1.5 cm depth constituted the volume for calculation purposes. Pre- and postwater addition weight of this layer was used to determine water contents of 2%, 4%, and 10% used in the experiments.
Water content experiments were all conducted at a fixed wind speed of 11 m s−1. The difference in top layer weight described above at the beginning and end of the 30-min experiments were determined to be the overall erosion experienced at a given pile surface water content. The same collecting dish scheme used previously was utilized with the same criterion of 97% mass recovery described earlier to avoid unaccounted particle mass.
Friction velocity
Threshold friction velocity for wind erosion was calculated by Equation 4. Using the mean calculated particle diameter of 33 μm as a representative size for all the particles and assuming aerodynamic roughness of 5 mm (Kardous et al., 2005), the value of 0.36 and 0.386 m s−1 were calculated for the dimensionless parameter A and the threshold friction velocity, respectively. Bagnold had obtained the A factor in above equation equal to 0.4 for the wind speed having Reynolds number less than 3.5 (Alfaro et al., 2004) when the mean size of surface roughness is used for Reynolds number calculation as the characterization length and u* as the pertinent value for the velocity. The threshold friction velocity of about 0.43 m s−1 was attributed to soil particles with a size less than Tyler sieve No. 60. EPA has suggested a value of 0.54 m s−1 as the threshold friction velocity for fine coal dust on concrete pads (MacDougall and Uhl, 2002).
Results and Discussion
Mass-based dispersion profile
Experiments were conducted to determine the mass dispersion profile of particle transport at different velocities. As shown in Fig. 3, a linear relationship exists between particle mass dispersed and generated wind velocities (R2 = 0.97) with no indication of particle deposition at distances less than 40 cm from the pile (Fig. 4). Higher residuals observed at the lower end of the regression line accounts for the higher initial friction and dislodging force required for onset of particle motion.

Total mass of wind-blown particles versus wind velocities.

Mass of particles versus transport distance from the pile.
Considering the fact that mass is proportional to diameter cubed, deviations from sphericity will be greatly magnified when studying mass versus distance profile for particles. As shown in Fig. 4, a similar decrease in mass is observed with increasing distance. Reflection of higher relative dislodging force for onset of motion is also observed in lower mass values at the leading edges, followed by localized peaks of mass accumulation at 40 cm far from the pile center. Once particles start moving, a relatively consistent trend of reduction in particle mass with increasing distance from the pile is observed. Note that inherent in the analysis is the assumption of uniform density for all particles.
Diameter-based dispersion profile
The experimental setup was used for the study of distance traveled by particles of different sizes. The results presented in Fig. 5 indicate the relationship between distance traveled and particle diameter for different wind speeds. This is different from the classic Von Karman equation of semilogarithmic relationship for natural settings. The differences can be explained by the fact that in the laboratory setup in this study, the applied force from designed wind blower diminishes with increasing distance from the outlet of the tunnel. However, for natural settings, applied wind force remains sustained throughout the transport path of the particles prior to deposition, entrapment, and/or change in topography characteristics. As such, it is expected that there is an exponential increase in distance traveled by particle with decreasing particle diameter considering the fact that particle mass reduction is related to particle diameter raised to the power of 3. This implies that the predicted distance traveled by the particles in the experiments should be corrected to account for the continuous wind force applied in real settings of industrial iron piles. Results proved that these two approaches correspond just for 75-μm particles. Therefore, the theoretical method gave greater values for particles equal or smaller than 75 μm (PM-75), whereas experimental values were more for the particles bigger than 75 μm.

Transported distance from the pile center for various particle sizes.
Emission factor
The EF is used for point and nonpoint sources as a means of quantifying expected emissions for a given quantity of raw material or fuel use and/or product in a given period of time (Alley and Cooper, 2002). In this study, the EF was defined as the total weight of wind-eroded particles per unit area in the first 30 min of wind erosion. Following the EPA form (Equation 7), a second-order polynomial fit was applied to the data generated in this study and the following wind erosion potential function was obtained considering the fact that
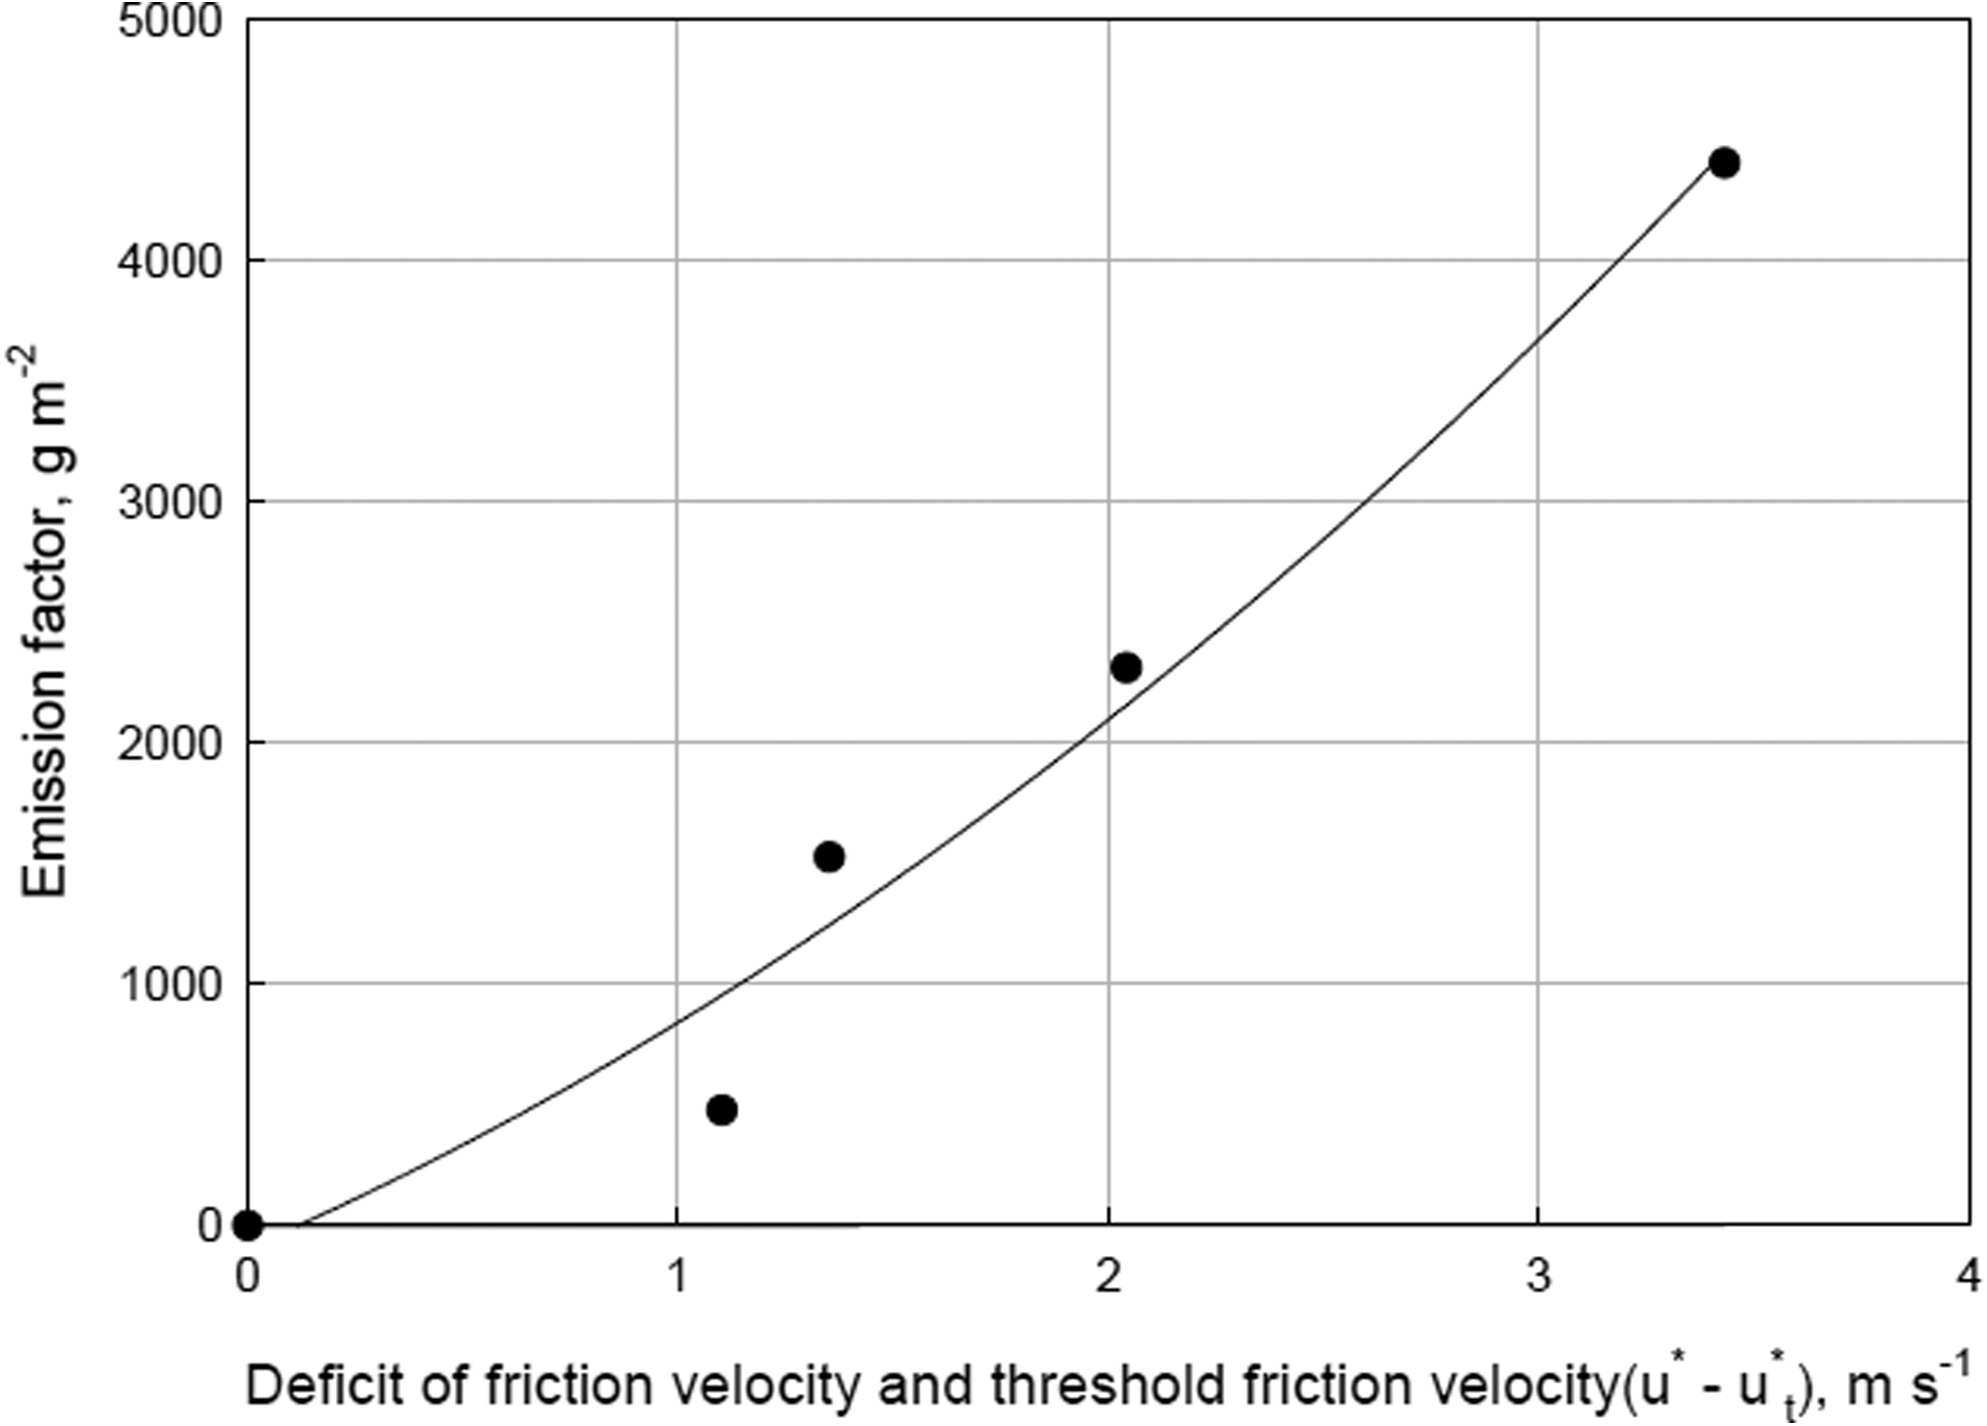
Suggested emission factor for the pile emission in 30 min.
where P is in g m−2 and shearing velocities are in m s−1.
The coefficients in the first and second terms in the above equation are higher when compared with the coefficients of EPA equation (Equation 7). Note that Equation (8) has been obtained for a specific case of iron piles under controlled experimental conditions, whereas EPA erosion potential function is more of a theoretical nature and is applicable to a wide range of natural settings and soil characteristics for a pile with height-to-base ratio lower than 0.2.
Domain of particle influence
The average distance traveled by particles with different size ranges was determined. A general trend of increased distance with increased wind speed was observed with higher relative upward slope for lower particles sizes. This is compatible with the linear relationship suggested by Von Karman (Equation 2) for a fixed particle size and constant values for other parameters. The traveled distance for PM-20 is relatively higher than other sizes. This can be explained by the fact that at lower Reynolds numbers (a value of about 15 at a wind speed of 11 m s−1 in the experiments of this study), Stokes' regime prevails and there is a higher tendency for sustained suspension, and thus the probability of being affected by the prevailing force is higher (Lee and Park, 1998).
Humidification effect
Different schemes including sprinkling of water on the surface have been practiced for reduction of wind erosion from iron ore piles. Water was added to the top layer of the iron pile to evaluate the potential for reduction of wind erosion (Table 2). Comparing the results with dispersion results under no water addition cases indicates a significant reduction in particulate emissions, ranging from 45% reduction for 2% water content to 78% reduction for 10% moisture content increase. However, the results should be interpreted conservatively for real situations because of the evaporation potential under high-temperature conditions in summer times and the potential of penetration of water into the deeper layers of the piles.
Water content % is by mass.
Summary
The major objective of this study was to develop an emission factor for estimating PM emissions from iron piles under different wind velocities. Experiments showed the dependence of particle transport on wind velocities. After dislodging of particles from the pile, there was about 25 g of particles emitted for each m s−1 increase in wind speed for this particular constant geometry pile.
Regarding the application of classical Von Karman's formula, as the assumptions of Stokes' regime and spherical particles are inherent, deviations are expected based on the results of transmission and scanning electron microscopy analyses and variations of the fluid transport regime at different wind velocities of the experiments. Further, natural conditions are different from the experimental settings of this study in terms of levels of sustained external forces.
Humidification experiments of the pile surfaces showed significant decrease in particulate emissions. The improvements were 45% and 78% reduction in particle emissions for 2% and 10% pile surface water content increase, respectively.
Footnotes
Acknowledgment
This project was funded by the Khuzestan Steel Complex, located in the southwestern part of Iran.
Author Disclosure Statement
No competing financial interests exist.