
Abstract
Abstract
Nitrogen removal is of great importance in management of sanitary landfills. To optimize the process of denitrification, a better comprehension of denitrifiers was needed. No molecular studies using function genes with a special focus on diversity and quantity of denitrifying communities in municipal solid waste (MSW) have been reported to date. This research investigated the communities of denitrifying bacteria in MSW samples collected from fresh (3-month-old) and aged (10-year-old) landfill bioreactors. The main methods were denaturing gradient gel electrophoresis and real-time polymerase chain reaction using nirK and nirS as the markers. Results showed that most nirK-containing denitrifiers related to the known Rhizobiales bacteria were from the aged MSW sample, while denitrifiers related to Alcaligenaceae bacteria were all from the fresh one. A clear difference in the diversity of nirK-containing denitrifiers between two MSW samples was observed. About half of the nirS gene sequences obtained was found closely related to the nirS of β-proteobacterium (Burkholderiales and Rhodocyclales) and γ-proteobacterium (Pseudomonadales). The rest of the nirS gene sequences were specific. Real-time polymerase chain reaction results revealed that nirK was more abundant than nirS in the fresh MSW sample, whereas nirS was predominant in the aged one. Aged MSW had more potential denitrifiers to reduce NO3− to NO2− than fresh MSW. This work provided more accurate information about the characteristics of denitrifying communities as a result of using functional gene, rather than using 16S rDNA.
Introduction
The few studies that focused on the diversity of bacterial community or denitrifying bacteria in landfill leachate system were all based on the 16S rRNA molecular analysis technique (Etchebehere et al., 2002; Huang et al., 2004, 2005). However, because most bacteria with denitrification trait belong to unrelated systematic affiliations (Bothe et al., 2000; Liesack et al., 2000), in addition to the fact that some archaea and even the mitochondria of some fungi also exhibit the ability of denitrification (Kobayashi et al., 1996; Philippot, 2002; Hayatsu et al., 2008), we cannot rely on taxonomic affinities identified by 16S rRNA gene (16S rDNA) probes to detect the capability of denitrification (Philippot et al., 2007). Therefore, functional genes are recently attracting more and more attention as an alternative approach to investigate denitrifying organisms in the environment. Actually, most molecular studies on the ecology of denitrifying bacteria are based on functional genes and their products (Philippot et al., 2002).
Four enzymes are involved in the complete denitrification process. They are nitrate, nitrite, NO, and N2O reductase. Nitrite reduction, which is the reaction of producing NO from NO2−, is the crucial step in denitrification, because it leads to gas formation and is an effective process for removal of nitrogen from the pool of fixed nitrogen, making it unavailable for most other organisms. Nitrite reductase occurs in two major types: cytochrome cd1-type nitrite reductase (NirS) encoded by nirS gene and Cu-type nitrite reductase (NirK) encoded by nirK gene (Tavares et al., 2006; Wallenstein et al., 2006). The specific primer sets as the two gene markers have been evaluated (Throbäck et al., 2004); quantity of these genes can be measured using real-time polymerase chain reaction (PCR) approach (Gilbert et al., 2008; Yoshida et al., 2009, 2010). Investigation with these genes also includes a variety of natural and engineering environmental samples, for example, marine sediment samples (Braker et al., 2000; Nogales et al., 2002; Liu et al., 2003), cyanobacterial bloom (Tuomainen et al., 2003), forest and agricultural soil (Priemé et al., 2002; Rösch et al., 2002; Katuyama et al., 2008), contaminated groundwater (Yan et al., 2003), and wastewater treatment (Geets et al., 2007; Gilbert et al., 2008). But, few studies have been published using functional gene molecular methods on denitrifying community in the landfill simulation bioreactors.
It is well known that nitrate reduction rates and reaction products are related to the type and quantity of microorganisms that exist in the refuse. Thus, landfill age is a major factor affecting microbial community structure (Chen et al., 2009). However, limited data are reported on the diversity and quantity of denitrifying community in landfill of different ages. The objectives of this study were to investigate the diversities and abundance of nirS and nirK in the fresh (3-month-old) and the aged (10-year-old) MSW samples using denaturing gradient gel electrophoresis (DGGE) and real-time PCR based on functional genes. The results may help to improve understanding of the denitrifying community in different aged landfills and to develop practical management for MSW.
Materials and Methods
Sample collection and DNA extraction
The MSW samples were collected from two complete anaerobic bioreactors. Each landfill reactor consists of a 210-L cylinder made of PVC (38 cm inside diameter, 220 cm height). A 20-cm-thick layer of gravel was placed at the bottom of each reactor. Solid waste was loaded in 160-cm layers. A polyethylene-made adapter (about 2.5 cm) was installed at the middle of each reactor as a waste collection port, and it was always sealed after collection. The second gravel layer (10-cm) was placed on the top waste to simulate intermediate cover. Finally, the reactor covers were placed on top of each cell, and the units were sealed using a construction-type sealant.
Fresh landfill bioreactor was filled with fresh MSW, which was from the refuse storage area in Haishan Road, Xiamen City. Aged landfill bioreactor was filled with 10-year-old MSW, which was from the Xiamen City Dongfu MSW Landfill Site. Both MSW samples were collected in triplicate in June 2008. The 3-month-old fresh MSW samples were collected at 3 months after the reactor was set up. The physical composition (by weight) was 27.16% of vegetable, 21.24% of fruit, 16.68% of paper, 14.04% of bone and meat, 10.14% of plastics, 3.88% of leaves, 2.40% of eggshell, 1.1% of cellulose textile, 0.50% of glasses, 0.12% of metals, and 2.74% of others. The moisture content of the mixture was 60.58% (w/w). The physical composition (by weight) of the 10-year-old MSW was 60.01% of humus, 8.71% of plastics, 0.95% of cellulose textile, 0.47% of glasses, 0.07% of metals, and 29.79% of others. The moisture content of the mixture was 38.27% (w/w).
Total DNA from the MSW was extracted using the E.Z.N.A.® Soil DNA Kit (Omega Bio-Tek) according to the manufacturer's protocol. The isolated DNA was stored at −20°C.
PCR amplification of nirS and nirK genes
Primers targeting cd3bF (5′-GTG AAC GTS AAG GAR ACS GG-3′) and R3cd (5′-GAS TTC GGR TGS GTC TTG A-3′) were used to obtain amplicons of partial nirS genes. Primers targeting F1aCu (5′-ATC ATG GTS CTG CCG CG-3′) and R3Cu (5′-GCC TCG ATC AGR TTG TGG TT-3′) were used to obtain amplicons of partial nirK genes (Throbäck et al., 2004). PCR amplification was performed in a total volume of 25 μL containing 2.5 μL of 10 × PCR buffer (750 mM Tris–HCl [pH 8.8], at 25°C, 200 mM (NH4)2SO4, 0.1% Tween 20), 200 μM of each deoxynucleotide triphosphate, 2.5 mM MgCl2, 1.5 U of Taq polymerase (Fermentas), 1.0 mM of each primer for nirS and 0.2 mM of each primer for nirK, and 10–100 ng DNA as template.
PCR amplification of the 375–425-bp fragment of nirS gene and 474-bp fragment of nirK gene reaction were performed in a thermal cycler (Mastercycler 5333, Eppendorf) by using an initial denaturation step of 94°C for 2 min, followed by 35 cycles of 30 s at 94°C, 1 min at 57°C, and 1 min at 72°C. The reaction was completed after 10 min at 72°C. PCR products were checked on agarose gels.
Denaturing gradient gel electrophoresis
To modify the melting profile and avoid complete denaturing of the amplified fragments, a 33-bp GC-clamp (5′-GGC GGC GCG CCG CCC GCC CCG CCC CCG TCG CCC-3′) was attached to the 5′ end of the R3cd, R3Cu primer, respectively (Throbäck et al., 2004). The PCR conditions for reactions with the GC-clamped primers were the same as those for the ordinary primers, as described above. The DGGE were performed using a Dcode system (Bio-Rad Laboratories Inc.). PCR products were applied to each DGGE gel as markers, to check the electrophoresis run and to compare fragment migration between gels. One-millimeter-thick, 16 × 16 cm polyacrylamide gels (7.0% [v/v] acrylamide–bisacrylamide [37.5:1], and denaturant [urea and formamide]) were poured using a gradient maker (Amresco, Inc.). A mixture of 7 M urea and 40% formamide was defined as 100% denaturant. Twenty microliters of the PCR products that had been amplified with the cd3bF:R3cd-GC and F1aCu:R3Cu-GC primer pairs were run on denaturing gradients of 70%–80% for 16 h and 40%–70% for 13 h, respectively. The gels were run in 1 × TAE (40 mM Tris-acetate and 1 mM ethylenediaminetetraacetic acid) at 100 V and 60°C. Migration patterns were visualized by staining with 1:10,000 (v/v) SYBR Geen I (Molecular Probes, Bio-V) for 45 min followed by ultraviolet translumination. Images were documented with the GelDoc XR from Bio-Rad Laboratories, and digital pictures were analyzed with the Quantity One software from Bio-Rad Laboratories.
Cloning, sequencing, and statistical analysis
The middle portion of each selected DGGE band was excised for sequence analysis and placed in 50 μL distilled H2O. The DNA was eluted at 4°C overnight. The eluted fragments were PCR amplified with primers without a GC-clamp using 10 μL DNA in a total reaction volume of 25 μL but otherwise as described above. Prior to sequencing, each PCR product was purified using Cycle-Pure Kit (Omega Bio-Tek) according to the manufacturer's protocol. The nirS and nirK fragments were cloned in a plasmid specially dedicated for the cloning of PCR fragments (pMD18-T Vector; TaKaRa Biotechnology Co., Ltd.), following the manufacturer's protocols. The ligations were transformed into supercompetent Escherichia coli DH5α (Tiangen Biotech Co., Ltd.) and plated on Luria Bertani agar supplemented with IPTG (1 mM), X-gal (40 mg mL−1) and ampicillin (50 μg mL−1). White colonies were randomly picked and collected with a toothpick. Sequencing was performed by Invitrogen Biotechnology Co., Ltd.
The partial sequences of nirS and nirK were aligned with the nucleotide sequences of equivalent length from the GenBank (NCBI) database using the CLUSTALX software. The phylogenetic tree was constructed using the maximum likelihood method. A bootstrap analysis with 100 replicates was carried out to check the robustness of the tree. Finally, the tree was plotted using the Tree View program.
The partial nirS gene sequences obtained in this study had been deposited in the GenBank database under accession numbers GQ496051 to GQ496075. The nirK sequences are available under accession numbers GQ496024 to GQ496050.
Real-time PCR assay
Quantitative PCR was performed on the ABI PRISM® 7500 (PE Applied Biosystems). CloneS5 and CloneK16 were chosen as standard plasmid DNA. Plasmid DNA was extracted with the AxyPrep™ Plasmid Minprep Kit (Axygen Biosciences) according to the manufacturer's protocol. The plasmid concentration (nanograms per microliter) was measured spectrophotometrically using a NanoDrop ND-1000 spectrophotometer (Gene Co., Ltd.). As the sequences of the vector and PCR inserts were known, nirS and nirK copy numbers could be calculated from the concentration of extracted plasmid DNA. To quantify nirS and nirK genes, cd3bF-R3cd and F1aCu-R3Cu were used, respectively, as primers in real-time PCR. In the two primers, cd3bF-R3cd has been successfully applied to detect the nirS gene in different environment samples, such as pasture, sludge water, and rice paddy field soil (Geets et al., 2007; Chroňáková et al., 2009; Yoshida et al., 2009). Also, F1aCu-R3Cu has been applied in quantity analysis of nirK gene in Antarctic soil (Yergeau and Kowalchuk, 2008). Amplification reactions were carried out with the SYBR Green Realtime PCR Master Mix-Plus-QPK-212 (Toyobo Co., Ltd., Life Science Department). DNA template volume of 1 μL, 0.4 mM of each primer for nirS, and 0.2 mM for nirK were added to 49 μL PCR master mix in Thin Wall PCR Tube. Amplification conditions for all primer sets were as follows: 95°C for 60 s, and then 40 cycles at 95°C for 15 s, 57°C for 15 s, and 72°C for 45 s. Fluorescence data were acquired at 72°C. All measurements were done in triplicate. In all experiments, appropriate negative controls without template DNA were subjected to the same procedure to exclude or detect any possible contamination or carryover. The samples and all standards were assessed in at least two different runs to confirm the reproducibility of the quantification. The cycle threshold (CT) was calculated as the cycle number at which the reaction became exponential. CT of each sample was then compared with a standard curve and results were expressed as a numerical value of the number of target copies in the sample.
Results and Discussion
DGGE analysis of partial nirS and nirK genes
Both types of nir genes were used as the functional markers to investigate diversity of denitrifying bacteria in the fresh and the aged MSW. The DGGE banding patterns of partial nirS gene are clearly shown in Fig. 1. Only a few bands in both samples with three dense bands dominate in the middle of the gel. The only different pattern of nirS gene between two samples was that the bands were denser in the aged sample than in the fresh one. Ten visible bands were cut, and 25 different clones were obtained.
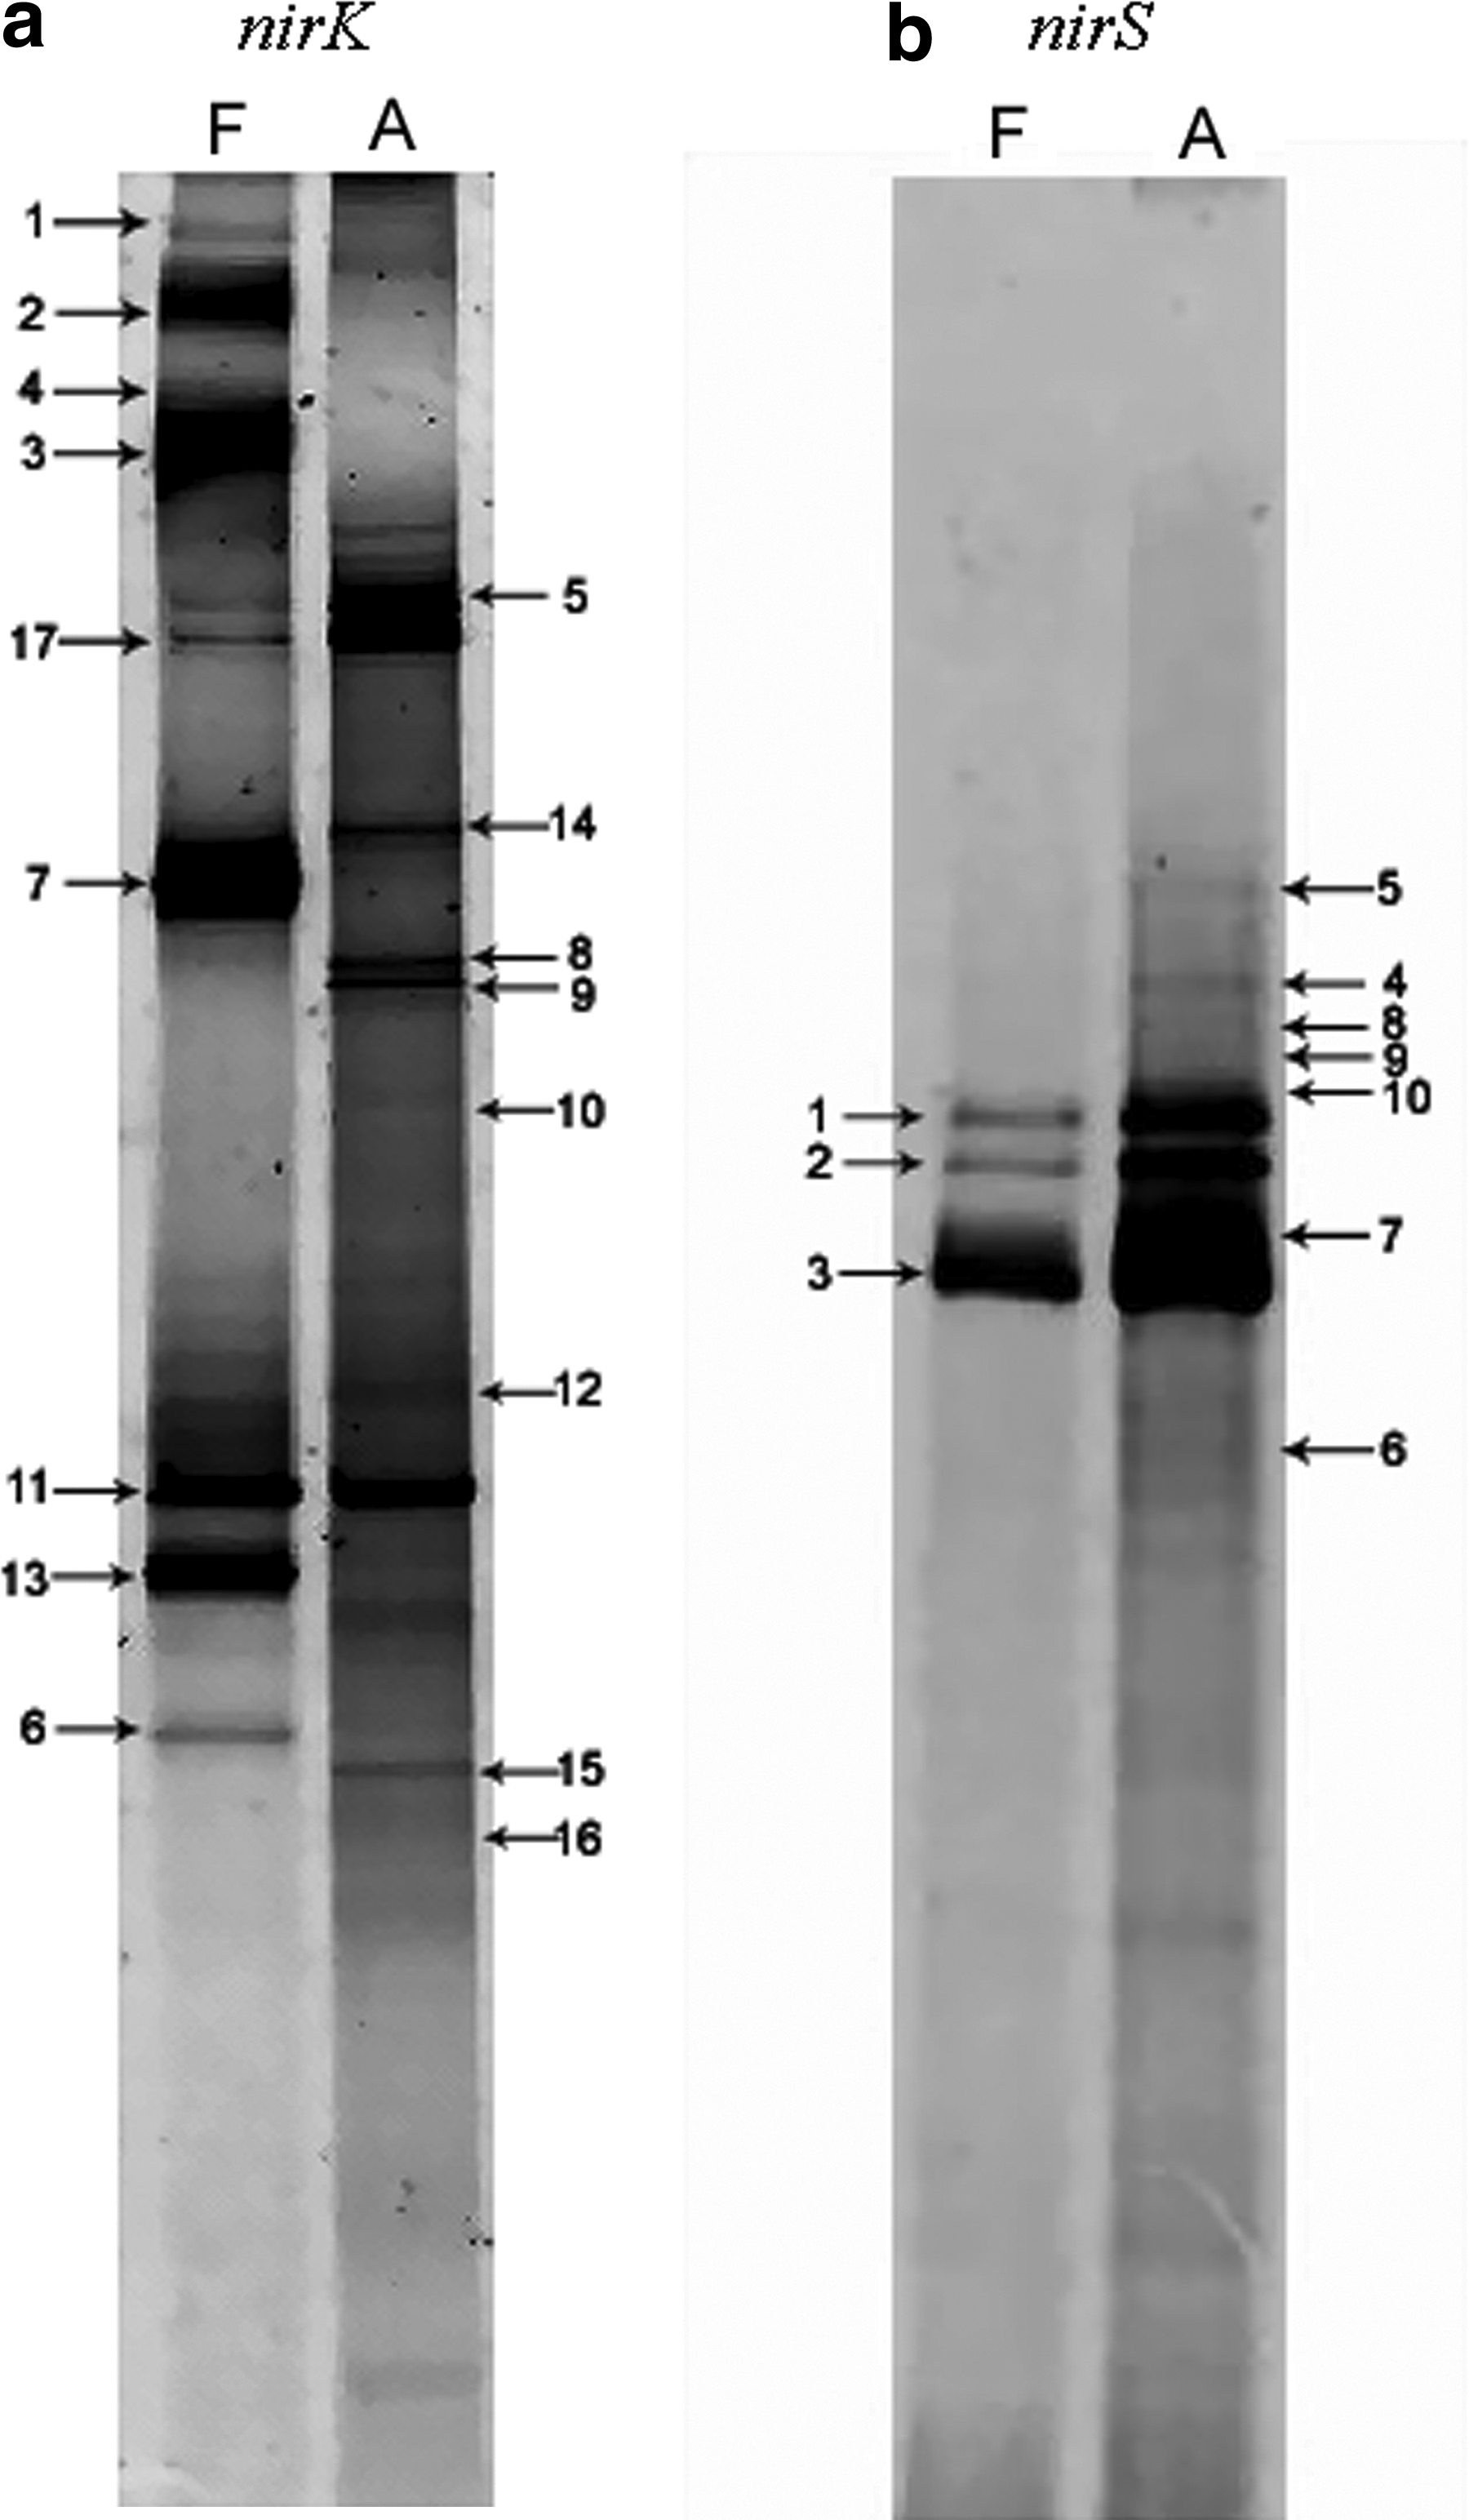
Denaturing gradient gel electrophoresis fingerprints of dominating denitrifying communities in fresh municipal solid waste (MSW) sample (F) and aged MSW sample (A).
In contrast to nirS, more composite bands could be observed on the nirK gene DGGE fingerprints (Fig. 1). There was a clear difference in the pattern between the fresh and the aged MSW samples. Seventeen visible bands from two samples were cut, and 27 nirK sequences were obtained. One of the 17 bands contained five sequences, 3 bands contained three sequences, and others contained one sequence (Table 1).
MSW, municipal solid waste.
The DGGE analysis of partial nirK gene provided an alternative identification of more bands, and most bands contained one sequence. Clear difference between DGGE patterns of the two MSW samples could be observed. Unfortunately, the DGGE analysis resulted in only 10 nirS bands, with insufficient resolution for amplicons. Seven of the 10 bands contained three sequences, 1 band held two sequences, and 2 bands held one sequence (Table 1). Molecules with different sequences may have different melting behaviors and stop migrating at different positions, but not necessarily so. Therefore, multiple melting domains typically result in fuzzy bands in the migration direction, hampering band resolution (Throbäck et al., 2004).
Sequence analysis of nirS and nirK clones
A total of 25 nirS clone sequences were obtained. Partial nirS sequences (375–425 bp) were obtained from these clones, representing the dominant nirS-containing denitrifiers in two MSW samples. Environmental clones as well as pure cultures in the database were compared with these partial nirS sequences in a tree based on distance matrix analysis and maximum likelihood method (Fig. 2). It appeared that nirS clones were widespread in the phylogenetic tree. Six clones were closely related to the nirS sequences of Burkholderiales and Rhodocyclales bacteria, which belong to β-proteobacterium. Seven clones were closely related to the nirS of Pseudomonadales bacteria, which belong to γ-proteobacterium. Similar results were observed in previous studies in different soils (Throbäck et al., 2004; Yoshida et al., 2009). Twelve clones, which were identified as distantly related to the known nirS sequence, were similar to the uncultured nirS sequences from sediment, water column, or sludge (e.g., EF615458, AB278659, AY583444 in Fig. 2). But each similarity was not high (<90%). It was suggested that these of nirS-containing denitrifiers obtained from landfill were specific.
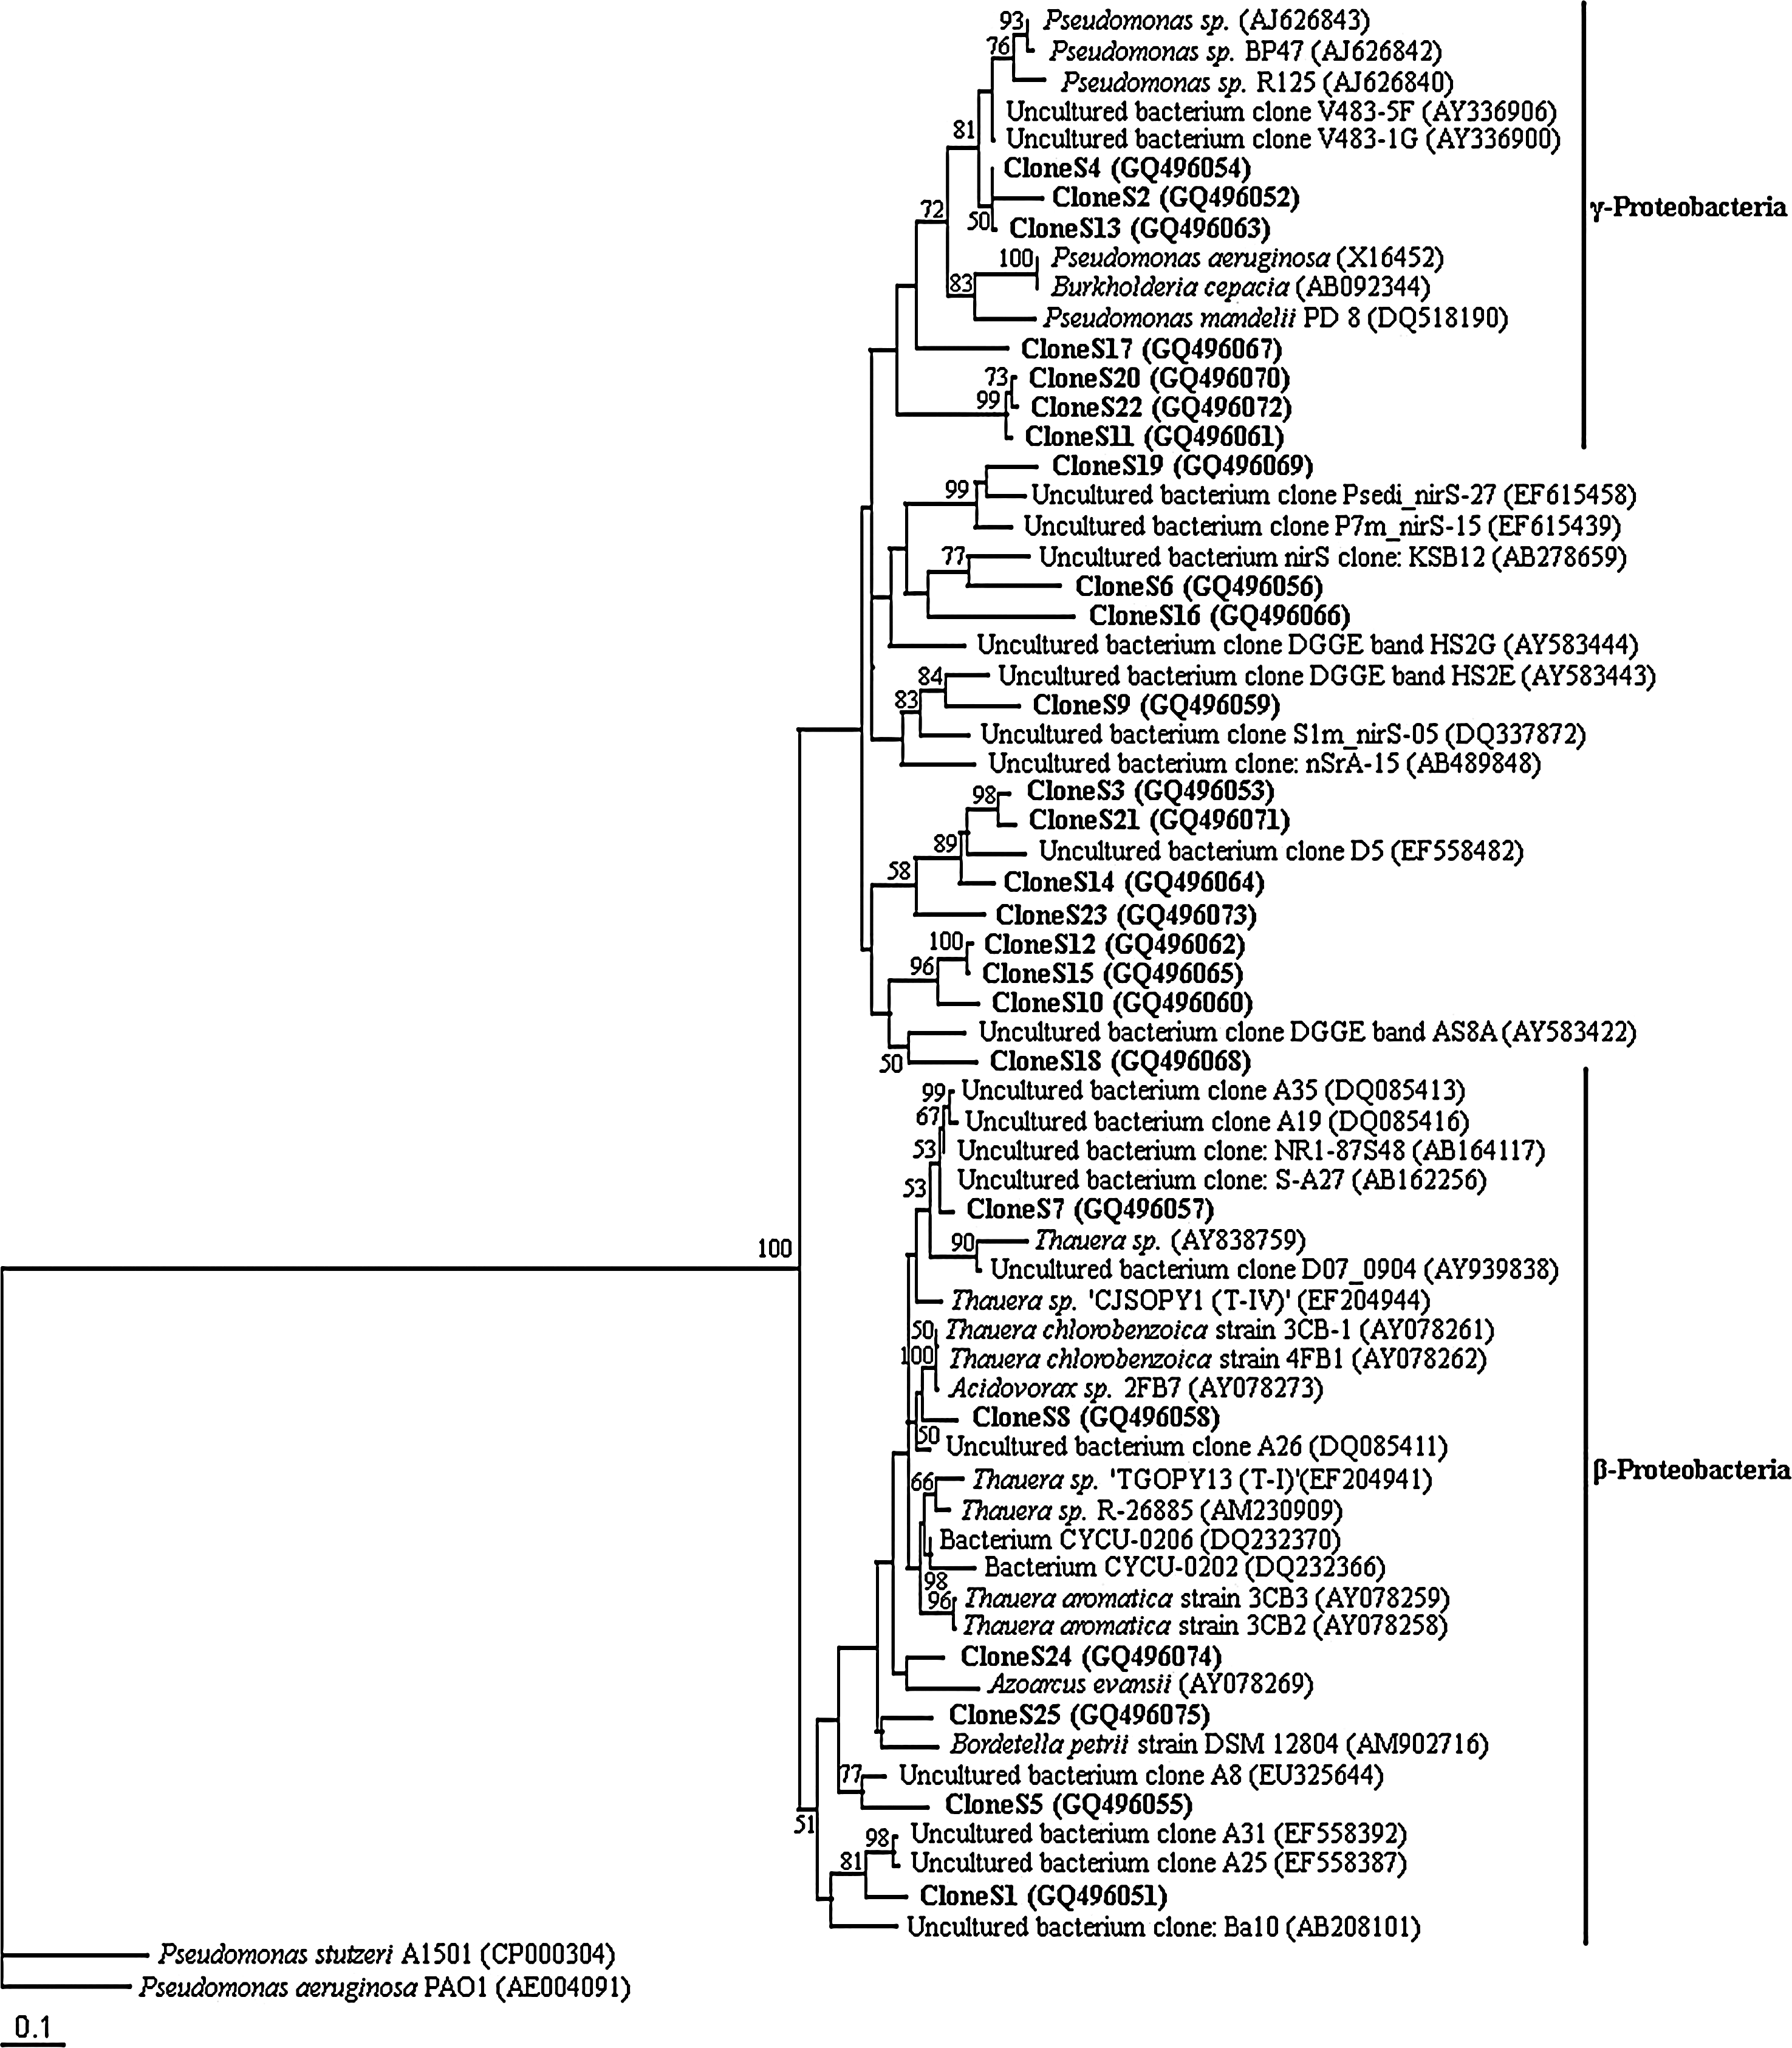
Phylogenetic position of the nirS clones compared with nirS sequences from environmental samples and culture collection strains. This maximum likelihood tree is based on partial nirS fragments. Bootstrap values were generated from 100 replicates of maximum likelihood. Bootstrap values higher than 50 are given. Pseudomonas stutzeri A1501 (CP000304) and Pseudomonas aeruginosa PAO1 (AE004091) were used as outgroups. Putative divisions are listed to the right.
The 27 partial nirK sequences (474 bp) were compared with sequences in the database from different environments as well as pure cultures (Fig. 3). Three major clusters were observed from the nirK phylogenetic tree. The upper cluster, that is, CloneK12, CloneK13, CloneK14, and CloneK1, all came from the aged MSW sample and branched with cultured bacteria Rhizobium sp. PY13 (DQ096645), which belong to α-proteobacteria. The middle cluster was constituted of two subclusters. The upper subcluster, that is, CloneK23, CloneK24, CloneK3, CloneK9, CloneK20, and CloneK15, showed identity to Paracoccus denitrificans PD1222 (AF114788), which belongs to α-proteobacteria. The lower subcluster, CloneK22, CloneK25, CloneK26, CloneK16, CloneK27, CloneK5, and CloneK21, was related to the cultured denitrifying bacteria β-proteobacterium R1-Apr-MIB-6 (AB118904) and Alcaligenes faecalis (AF114786). Noteworthy was that all the clones grouped in the middle cluster were from the fresh MSW sample, and the clones showing high identity to β-proteobacterium were only found in the fresh MSW sample. This means the clones from aged MSW sample were all affiliated with α-proteobacteria. CloneK2, CloneK7, CloneK8, and CloneK19, which were obtained in both the fresh and the aged MSW samples, were scattered in other clusters.
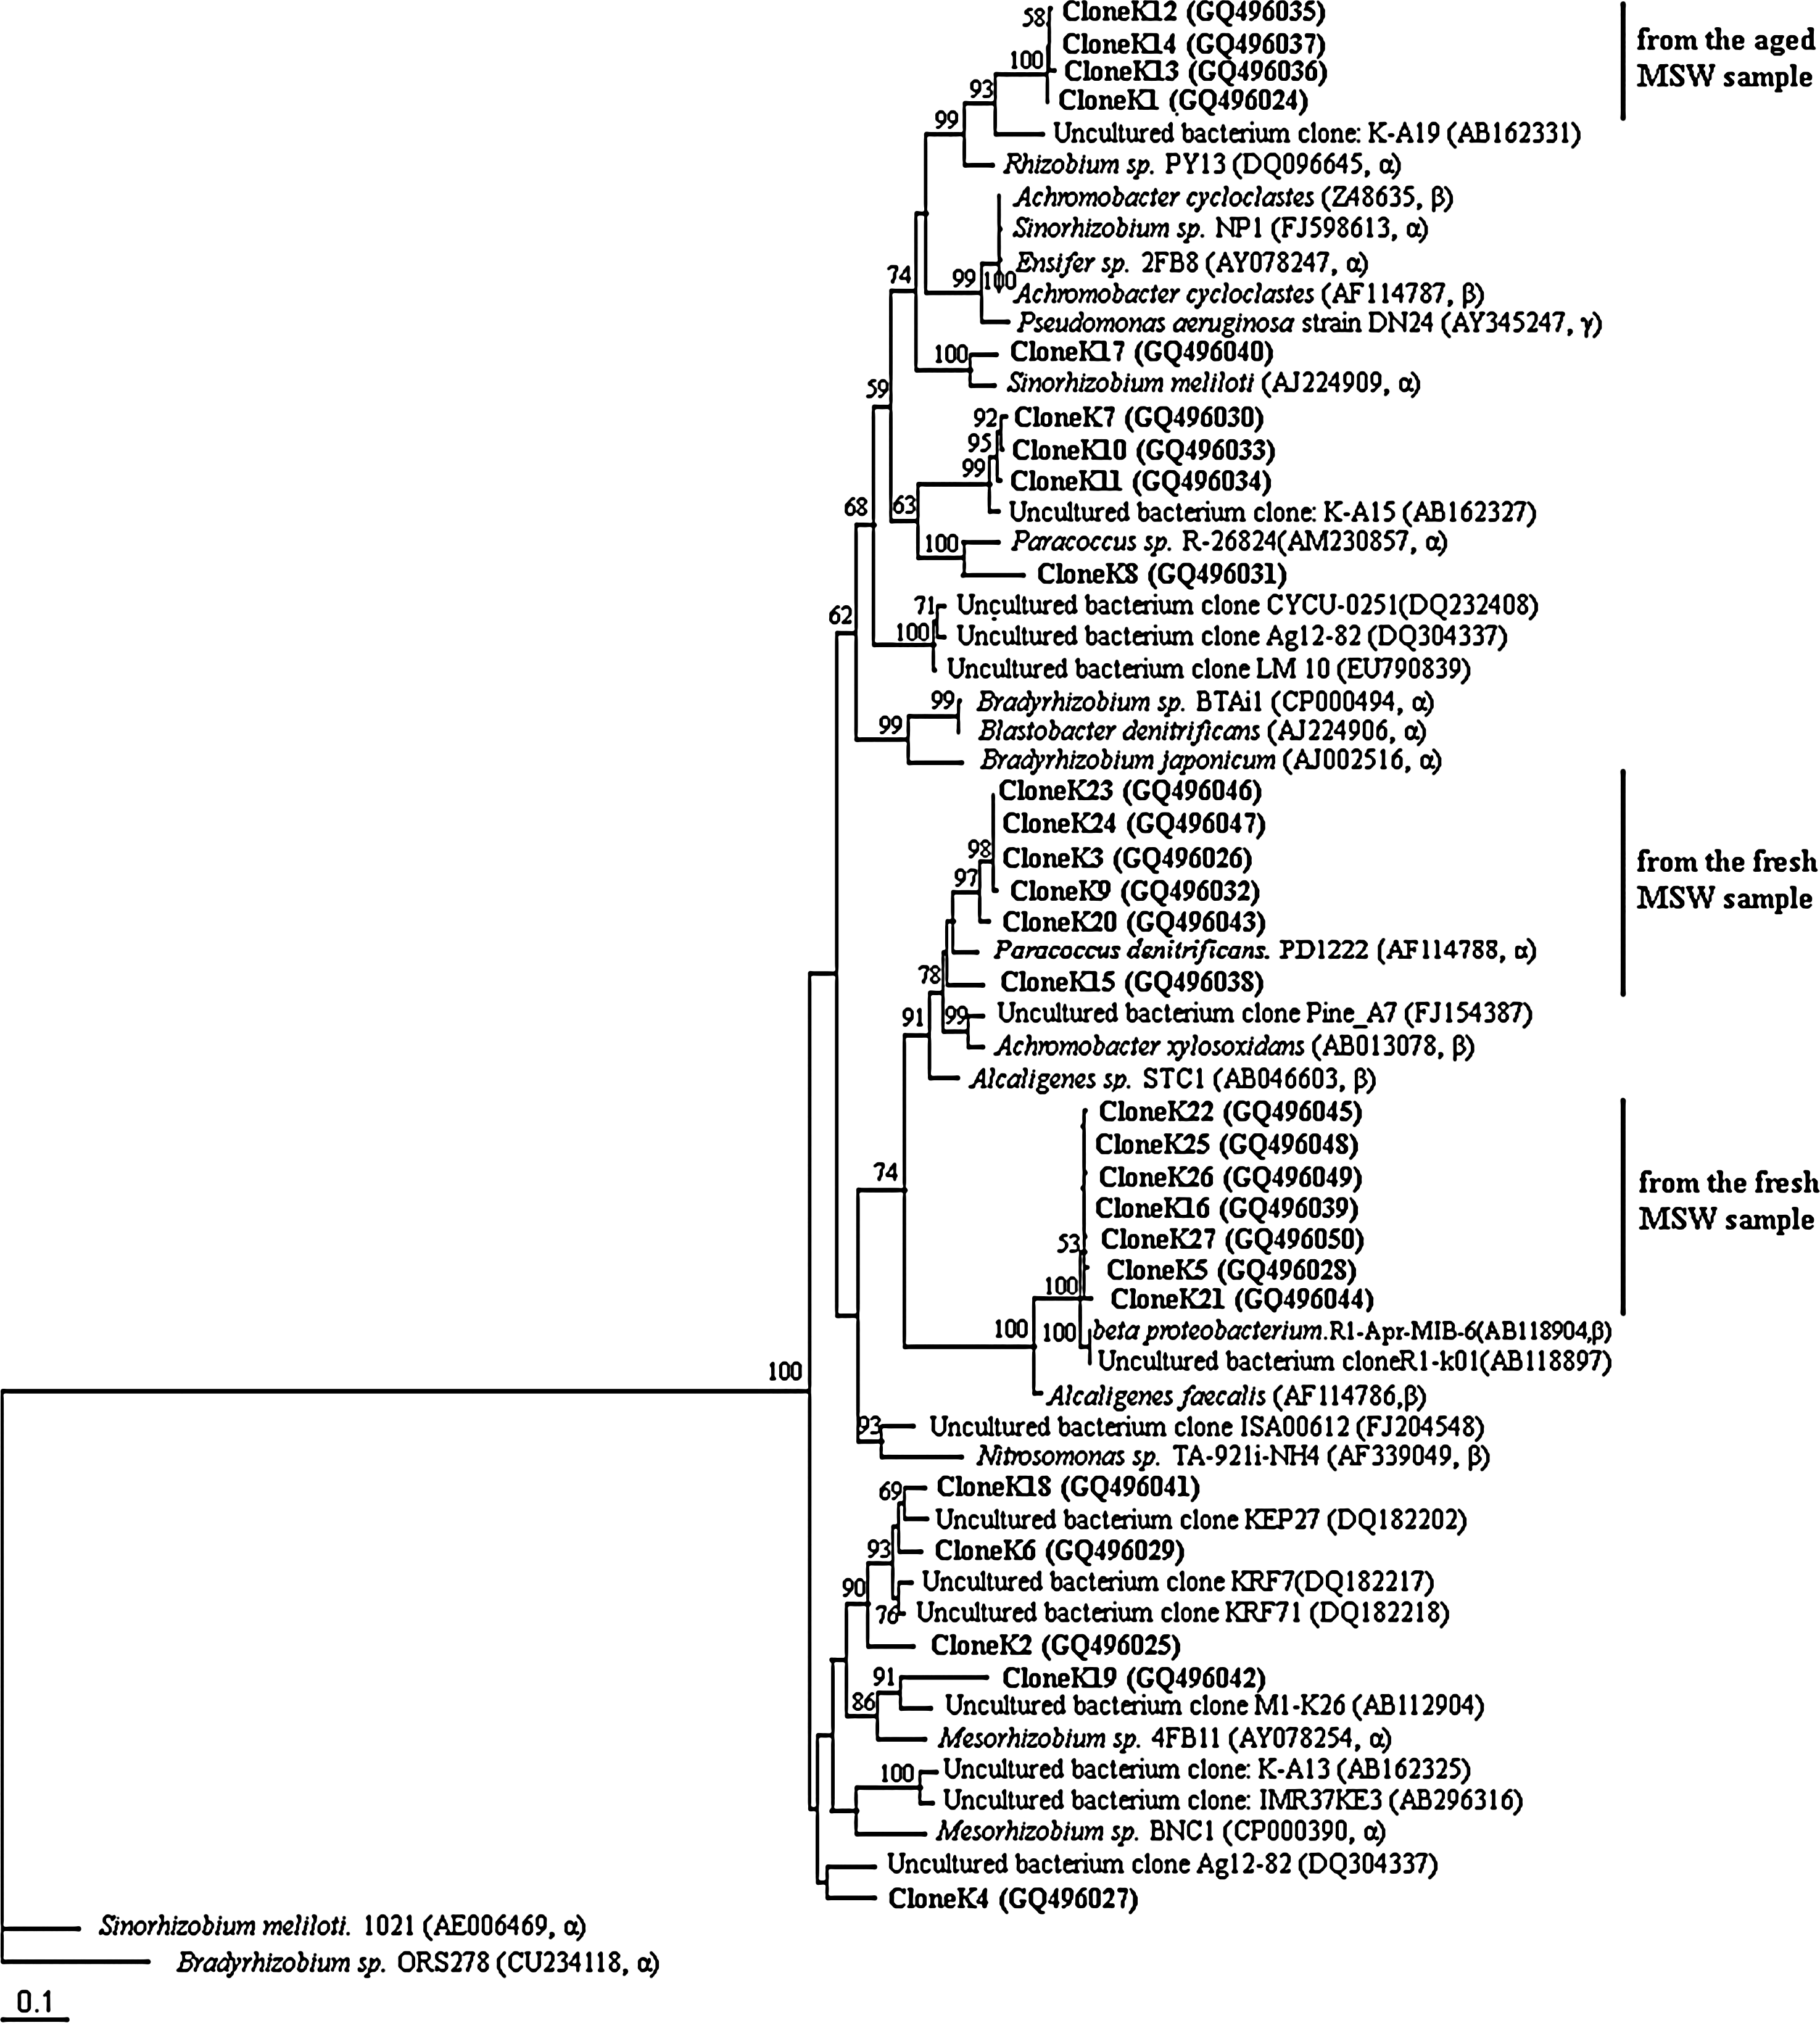
Phylogenetic position of the nirK clones compared with nirK sequences from environmental samples and culture collection strains. This maximum likelihood tree is based on partial nirK fragments. Bootstrap values were generated from 100 replicates of maximum likelihood. Bootstrap values higher than 50 are given. Bradyrhizobium sp. ORS278 (CU234118) and Sinorhizobium meliloti 1021 (AE006469) were used as outgroups. The source of partial sequences are listed to the right.
The results showed that nirK genes sequence types were closely related to α and β subdivisions the Proteobacteria. Most clones from the aged MSW sample were related to the nirK from Rhizobiales bacteria (Rhizobiaceae, Phyllobacteriaceae, Bradyrhizobiaceae). In contrast, most clones from the fresh MSW sample showed high affiliate to Alcaligenaceae. Phylogenetic tree of nirK clones showed an obvious diversity shift from the middle cluster in the fresh MSW sample to the upper cluster in the aged MSW sample from the phylogenetic tree. It was indicated that the fresh and aged MSW samples contained different nirK-containing denitrifiers. The causes of such difference are unclear, though we consider it might be due to different environmental response or long-term evolution of distinct communities.
One of the major challenges in microbial ecology for the bioreactors is to establish links between structural and functional biodiversities, and the predominate groups always determine the function of the community. The phylogenetic tree analysis from DGGE band can provide enough information of the predominant populations in a community.
Real-time PCR assay
Denitrifiers contain either NirS or NirK, and no strain is known to harbor both enzymes so far (Yoshida et al., 2010). It means nirS-containing denitrifiers and nirK-containing denitrifiers may have different niches. So, quantity analysis is important to identify the difference. Application of the nirS and nirK primers to MSW samples was performed using SyberGreen as detection system. In contrast to the TaqMan™ detection system, SyberGreen detection does not need the development of additional probes, which is unrealistic for the nitrite reductase genes because of their high polymorphism between different taxonomic groups of denitrifiers (Philippot, 2002). In this study, real-time PCR was carried out on total DNA instead of mRNA because a previous study found that a large proportion of samples showed no detectable amplification product when targeting mRNA of N-cycle functional genes, even if the corresponding genes could be readily detected via PCR assays targeting DNA (Henry et al., 2006).
Standard curves for target quantification were prepared from plasmid clones of target nirS and nirK genes. The linear response (R2 = 0.9812 for nirS gene and R2 = 0.9941 for nirK gene) was observed at 6 orders of magnitude, ranging from 104 to 109 gene copies for both nirS and nirK genes. Both standard curves had a high correlation coefficient and similar slope (−3.1 for nirS gene and −3.5 for nirK gene).
The copy number of nirS gene showed significant differences between fresh and aged MSW samples. The abundance of nirS gene for aged MSW sample was 8.3 × 10⁵ copies ng−1 of DNA, whereas for fresh MSW sample a lower abundance was found (1.7 × 10⁴ copies ng−1 of DNA) (Fig. 4a). The absolute levels of gene abundance of nirS gene were 1.5 × 10¹⁰ and 1.3 × 10⁸ copies g−1 dry weight for aged and fresh samples, respectively. Generally observed trends were similar to the findings referred to per ng of DNA (Fig. 4b). In contrast, nirK gene copy numbers did not show much difference between two samples. The abundance was 5.0 × 10⁴ copies ng−1 of DNA for aged MSW sample and 1.3 × 10⁵ copies ng−1 of DNA for fresh MSW sample (Fig. 4a). And 9.1 × 10⁸ and 6.3 × 10⁸ copies g−1 dry weight for aged and fresh samples, respectively, for nirK gene (Fig. 4b). This indicated that the quantity of nirK-containing population did not show significant difference between fresh and aged MSW samples.
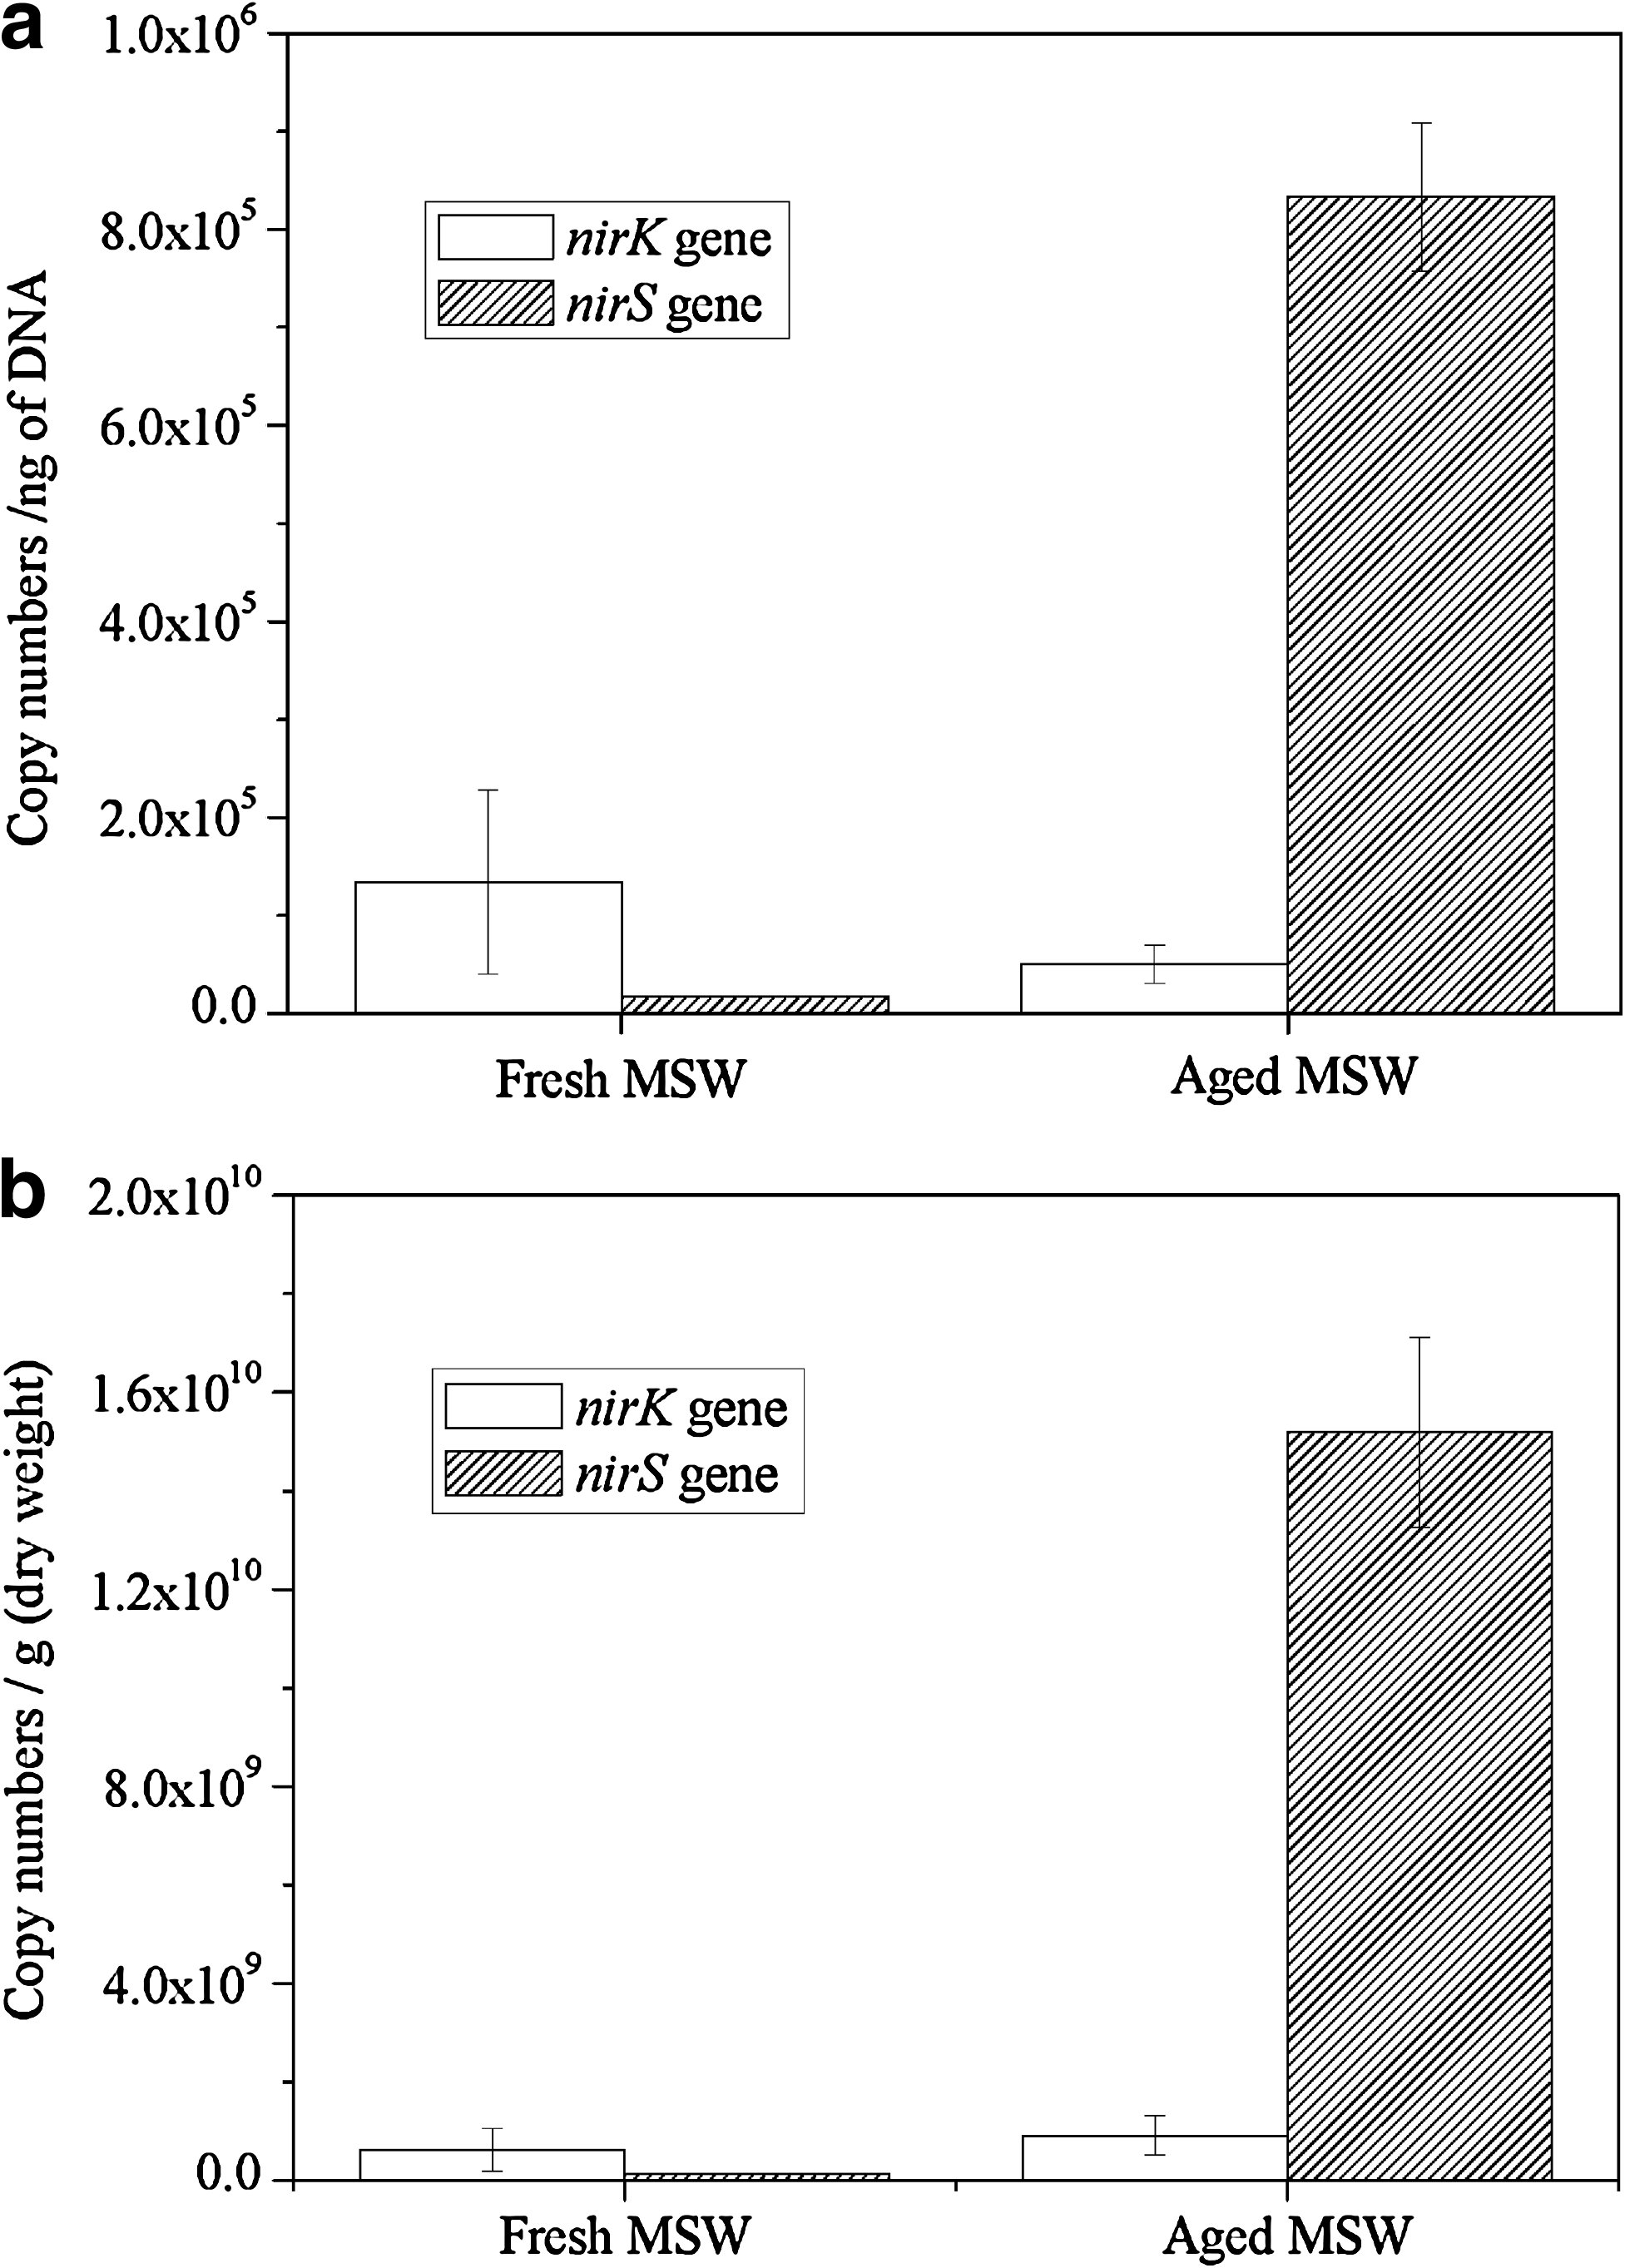
Niche differentiation between nirS and nirK genotypes were found in MSW changing from fresh to aged. The quantity of nirS gene was about 16 times greater than that of nirK gene in the aged MSW sample. This observation strongly suggested that nirS-containing denitrifiers were the predominant microbiota in the 10-year-old (aged) MSW ecosystem and might be largely responsible for nitrate transformation into atmospheric nitrogen (N2 + N2O). This result is similar to previous reports dealing with pig manure and pasture soil. Gilbert et al. (2008) quantified nirS genes by real-time PCR in environmental samples for the first time and demonstrated that the number of nirS-containing denitrifiers varied in the same way, in which potential denitrifying activity did. These observations strongly suggested that nirS-containing denitrifiers were largely responsible for nitrate transformation into atmospheric nitrogen (N2 + N2O) in organic biofilters treating pig manure. Chroňáková et al. (2009) found that at both spring and fall, for all pasture soil sites, the abundance of nirS genes was higher in comparison with nirK. The works of Zumft (1997) and Braker et al. (1998) also indicated that nirS represented from two-third to three quarters of all denitrifiers.
The quantity of nirK gene was about seven to eight times greater than that of nirS gene in the fresh sample. Similar to our study, Yoshida et al. (2009, 2010) quantified nirS and nirK gene copies in the rice paddy field soil based on the real-time PCR methods and found that the abundance of nirK was always greater than that of nirS in the same sample. In addition, the quantity of the nirK gene was about 10 times greater than that of the nirS gene in rice paddy field soil throughout the field sampling season. Wallenstein and Vilgalys (2005) found a similar trend in Harvard and Duke forest soil. Other research found that high abundance of nirK is often linked to the rhizosphere of annual plants (Sharma et al., 2005).
The physical composition was different between the tested samples, and the leachate from the simulation reactors was also different. The average NO3− concentrations of leachate were 10.38 ± 4.81 and 52.87 ± 27.9 mg L−1 in fresh and aged MSW, respectively. The difference of diversity and quantity of nirS and nirK between the fresh and aged samples might be due to the differences in physical composition and environmental factors, as well as the long-term evolution of denitrifier communities in the process of MSW decomposition.
One of the notable findings in this study was that the abundance of nirS gene is greater than that of nirK in the aged MSW simulation reactor, whereas the abundance of nirK gene was greater than that of nirS in the fresh sample. It suggested that the nirK-containing denitrifiers might be more abundant than the nirS-containing denitrifiers in the aged MSW reactor, whereas the nirS-containing denitrifiers might be more abundant than the nirK-containing denitrifiers in the fresh MSW reactor. These, however, do not necessarily indicate that the nirK-containing denitrifiers contribute more in denitrification than the nirS-containing ones in aged sample, or the nirS-containing denitrifiers contribute more in denitrification than the nirK-containing ones in fresh sample, because gene expression was not evaluated.
The values obtained from the real-time PCR may not be accurate or absolute because of limitations of primer design and extraction efficiency. It is very difficult to quantify the total denitrifier communities because the primers of denitrifiers were designed based on a few conserved full-length genes, and they are unlikely to cover the entire diversity of denitrifiers in any given environment (Throbäck et al., 2004). But, gross differences and changes in population size are still detectable. Developing more specific primer sets will help in deeper understanding of the dynamics of denitrifier population.
This research showed that nirK-containing denitrifiers show clear shift in community diversity between fresh and aged MSW samples, whereas nirS-containing denitrifiers show great change in quantity between the samples. Our follow-up research will focus on understanding the response of these population dynamics to different denitrifying conditions and the functional gene activity in response to conditions that influence denitrification.
Footnotes
Acknowledgments
The authors thank Prof. James Tiedje for valuable comments and the reviewers for kind suggestions. Thanks are also extended to Ms. Wan Xiong for checking the English in this article. This research was supported by the National Natural Science Foundation of China (50778156) and by the Institute of Urban Environment, Chinese Academy of Sciences.
Author Disclosure Statement
The authors declare that no competing financial conflicts exist.