
Abstract
Abstract
Ferrous iron–based degradative solidification and stabilization is a modification of conventional solidification and stabilization in which organic compounds are destroyed while inorganic compounds are immobilized. The effect of using different sources of Portland cement (PC) (i.e., CPC, TPC, LPC, QPC) on degradation of tetrachloroethene (PCE) was examined and the solids produced in the process were examined by instrumental analyses (X-ray diffraction, scanning electron microscopy, scanning electron microscopy with energy-dispersive spectrometry). Regardless of the type of PC source, more than 90% of initial PCE were transformed within a month. Each showed different types of PCE degradation kinetics. Use of CPC and TPC resulted in pseudo-first-order kinetics for PCE degradation and the use of QPC resulted in second-order kinetics. In the case of LPC, pseudo-first-order kinetics was observed in cement slurries (cement and water mixture, 10% [w/w]) and second-order kinetics in cement extracts (acid-digested cement solution). Iron added to the cement as an additive was selectively associated with hexagonal thin plate particles, which appear to be aluminate-ferrite-mono phases. Depending on PC sources, different types of aluminate-ferrite-mono phases were associated with iron: calcium aluminum hydroxide hydrate dominated the solids produced in slurries prepared with TPC, QPC, and LPC, whereas calcium chloroaluminate (Friedel's salt) was the major phase found in solids made with CPC.
Introduction
Degradative S/S (DS/S) is the modification of conventional S/S in which organic pollutants are degraded while inorganic pollutants are immobilized. Ferrous iron (Fe(II)) added to the cement system, called iron-based DS/S (Fe(II)-DS/S), demonstrated successful transformations of chlorinated hydrocarbons to less or nonchlorinated hydrocarbons via reductive dechlorination (Hwang and Batchelor, 2000, 2002; Hwang et al., 2005; Jung and Batchelor, 2008, 2009; Lee et al., 2009).
It is important to identify the chemical form of the compounds responsible for reductive dechlorination of chlorinated hydrocarbons and similar compounds to develop and optimize the Fe(II)-DS/S process. PC clinker mainly consists of four solid phases: tricalcium silicate (Ca3SiO5, 50%–70%), dicalcium silicate (Ca2SiO4, 15%–30%), tricalcium aluminate (Ca3Al2O6, 5%–10%), and tetracalcium aluminoferrite (Ca2(Al x Fe1−x)2O5, 0 < x < 0.7, 5%–15%) (Talyor, 1997). After water is mixed with cement clinker, the anhydrous solids found in cements are dissolved, supersaturated in solution, and reprecipitated as various hydration products. This process is the very complicated chemical reaction and diverse factors affect the formation of cement hydration products, such as chemical compositions of cement and pore solution and the time of hydration (Taylor, 1997). Therefore, it is very difficult to identify and characterize the Fe(II)-containing solid phases that are responsible for tetrachloroethene (PCE) degradation in DS/S system. Reductive dechlorination occurs at solid surfaces (Klausen et al., 1995), and thus, cement hydration processes probably play an important role in degradation reactions by forming the solid phases, called cement hydration products, which interact with Fe(II) to produce the compounds that are responsible for reductive dechlorination.
The chemical compositions of PC are different depending on the cement types (types I–V in the American Society for Testing and Materials) to meet their specific purpose, for example, type I for general purpose and type II for the moderate sulfate attack resistance by limiting tricalcium aluminate contents. Moreover, even the same types of cement contain a slightly different chemical composition depending on manufacturers. Therefore, the characteristics of cement hydration products, which could play an important role of PCE degradation kinetics as well as active reducing agent formations in Fe(II)-DS/S, could be varied depending on the types of PC source.
In this study, the effect of different types of PC sources used in Fe(II)-DS/S on the kinetics of PCE degradation and the formation of solid phases were examined to improve the understanding of how chemical composition affects the formation of active reducing agents. PCE was chosen as a representative organic pollutant because of its human toxicity and prevalence at contaminated sites on the National Priority List (ATSDR, 1997; USEPA, 2006) and types I and II PCs as representative cements because of their universal usage.
Experimental Protocols
Materials
PCE (99.9+%, high-performance liquid chromatography [HPLC] grade; Aldrich) was used as a target organic compound. PCs (type I and type I/II) and ferrous chloride (99+%, tetrahydrate; Aldrich) were used as DS/S agents. The chemical compositions of PCs used in this experiment are presented in Supplementary Table S1. De-aerated, deionized water (DDW) was prepared by purging water purified by the Barnstead Nanopure system with nitrogen for at least 12 h in an anaerobic chamber (Coy Laboratory Product) that contained 5% hydrogen and 95% nitrogen. All experiments were conducted in the anaerobic chamber to simulate the anaerobic conditions typically found in subsurface soils. Ferrous chloride stock solutions were prepared daily in DDW in the anaerobic chamber. PCE stock solution was prepared daily in methanol (99.8%, HPLC grade; EM). Hydrochloric acid (36.5%–38%, American Chemical Society [ACS] grade; EM) was used to dissolve the cement. Calcium hydroxide (Fisher Scientific) was used to increase the pH of dissolved cement solution to around 12.
Preparation of 10% (w/v) PC extract and PC extract solid containing Fe(II)
The reactive solid phases might be relatively simple compounds that were formed from elements that were released from components of PC during hydration. To test this hypothesis and try to identify the elements in the reactive solids, a PC extract (PCX) was prepared by addition of strong acid. Plastic bottles (1 L) containing 100 g PC in 1 L strong acid (2.2 N HCl) were placed on the shaking table to dissolve PC. After 24 h, the mixture of PC and acid was transferred to several 250-mL plastic centrifuge bottles and centrifuged at 6,000 rpm (6,650 g) for 5 min (model J-6M centrifuge, JS-7.5 rotor; Beckman). The 24-h period was believed to be sufficient to dissolve representative constituents in cement. Supernatant was filtered with filter paper (2-μm quantitative filter paper; VWR Scientific Products) to remove the visible suspension, and solids at the bottom of bottle were discarded. The filtered solution was called a PCX and was used to prepare Fe(II)-containing PCX (PCXFe) solids. To remove oxygen, PCX was purged with nitrogen for at least 24 h in the anaerobic chamber. The chemical composition of PCX was analyzed using inductively coupled plasma (ICP; Perkin Elmer Optima DV 3300 dual-view optical emission ICP spectrometer, Department of Oceanography at Texas A&M University). Trace amounts of Fe, B, Ba, Be, Cu, Mn, Ni, Sr, and Zn were detected by ICP analysis along with major components such as Ca, Al, Mg, and S. The concentration of Si was lower (1.62 mM) because calcium silicates are not very soluble at low pH.
PCXFe solids were prepared by adding 200 mL of 196 mM ferrous chloride and 92.6 g calcium hydroxide to PCX. This resulted in concentrations of 39.2 mM Fe(II) and 1.25 M Ca(OH)2. This dose of calcium hydroxide increased the pH of PCX to around 12, which was the pH that showed the highest PCE degradation in DS/S (Hwang and Batchelor, 2000). After adding reagents, the solutions were mixed on the magnetic stirrer for a few hours in the anaerobic chamber. The mixtures were transferred to several plastic centrifuge bottles (250 mL) and bottles were tightly sealed with parafilm (American National Can™) before being taken from the anaerobic chamber. Mixtures were centrifuged at 6,000 rpm (6,650 g) for 5 min to separate blue solids at the top from other solids at the bottom. The blue solids that were retained were believed to contain most of the Fe(II) and to be responsible for PCE degradation. They were subsequently used for PCE degradation tests and were dried in an anaerobic chamber prior to analyses by X-ray diffraction (XRD), scanning electron microscopy (SEM), and SEM with energy-dispersive spectrometry (SEM-EDS).
Preparation of 10% PC slurry solid containing Fe(II)
Fe(II) and PC (2.3 g) were mixed with DDW (23 mL) to produce a slurry with a mass ratio of solid to solution of 0.1. Fe(II) was added to the slurry at the same concentration as used in the PCX experiment (39.2 mM). All preparations were conducted in an anaerobic chamber. The glass vials and three-layer closures (Teflon, lead foil, Teflon-lined rubber septum) (Hwang and Batchelor, 2000, 2002) were equilibrated in the anaerobic chamber before conducting the sample preparations. After Fe(II) was added to the cement slurry, the vials were mixed on the shaking table for 5 days outside an anaerobic chamber. After 5 days, the sample vials were taken into an anaerobic chamber and then transferred to several plastic centrifuge bottles (250 mL). These bottles were tightly sealed with parafilm before being taken from the anaerobic chamber. These bottles were centrifuged at 6,000 rpm (6,650 g) for 5 min and the solids in the top layer were removed (see Supplementary Fig. S1). The solids from this PC slurry containing Fe(II) were identified as PCSFE solids and they were dried in an anaerobic chamber prior to XRD and SEM analyses.
Experimental design for PCE degradation kinetic study
A completely mixed batch reactor was used for the PCE degradation study. Clear borosilicate glass vials with 20 mL volumes were closed with a screw cap and a three-layer seal. The procedures for batch experiments studying PCE degradation with mixtures of Fe(II) and cement (PCSFe) or solids formed from cement extracts (PCXFe) followed the methods developed by Hwang and Batchelor (2000, 2002). In experiments with PCSFe, 10 μL of methanolic PCE was spiked to reaction vials that contained 2.3 g of cement, 23 mL of DDW, and 39.2 mM of Fe(II) (PCSFe). For experiments with PCXFe, 24.3 mL of the PCXFe solid slurry was added to the reaction vials followed by 10 μL of methanolic PCE. The final concentration of PCE in both systems was 0.242 mM. After spiking PCE, the reaction vials were quickly closed with the three-layer screw cap. Reaction vials were put on an end-over-end tumbler at 7 rpm rotation speed to achieve complete mixing. Samples were removed at each sampling point for analysis of PCE in the aqueous phase. Controls, which contained only water and PCE, were run at the same time to monitor PCE loss. Samples with Fe(II) were prepared in triplicates and controls were prepared in duplicates. All sample preparations were conducted in the anaerobic chamber.
Instrumental analyses (XRD, SEM, and SEM-EDS)
A Riga automated diffractometer using Cu Kα radiation (λ = 1.5406 Å) was used to obtain the powder X-ray patterns (Geology Department and Texas Transport Institute at Texas A&M University). The sample was scanned between 5θ and 60θ with a scan speed of 3θ/min. A Jeol 6400 Scanning Microscope (Microscopy and Image Center at Texas A&M University) was used to analyze the morphology of the solid samples of PCXFe and PCSFe and to provide semiquantitative chemical composition.
PCE and iron concentration measurement procedures
PCE in the liquid phase was analyzed by gas chromatography (Hewlet-Packard 6890GC) with an electron capture detector and DB-VRX column (60 m length × 0.25 mm internal diameter × 1.4 μm film thickness; J&W Scientific). Aqueous samples were separated from solid phases by centrifuging the reaction vials at 2,000 rpm (739 g) for 3 min (model CS centrifuge; International Equipment). PCE in the liquid phase was extracted with hexane (99.9%, HPLC grade; EM) containing 1,2-dibromopropane (1,2-DBP, 97%; Aldrich) as an internal standard.
Iron concentrations (Fe(II) and total iron) in the PCXFe suspensions were measured right after solid synthesis and before PCE spiking by the Ferrozine method (Gibbs, 1976). An aliquot of the solid suspensions was digested in 10 mL of HCl in the anaerobic chamber and the resulting solution was diluted with deionized water outside the anaerobic chamber. The concentration of Fe(III) was calculated as the difference between the total iron concentration and the Fe(II) concentration.
Results and Discussion
Variability of PCE degradation behavior
Table 1 and Fig. 1 show the results of PCE degradation experiments using 10% cement slurries from four different cement manufacturers (TPC, QPC, LPC, and CPC). They were type I PCs, except TPC, which was type I/II. The previous Fe(II)-DS/S system showed that PCE degradation kinetics followed pseudo-first-order kinetics (Hwang and Batchelor, 2000). Second-order kinetics was also observed for reductive dechlorination with iron-bearing minerals (Lee and Batchelor, 2002a, 2002b). Therefore, both first- and second-order rate constants were calculated by nonlinear regressions using Matlab to characterize kinetics of PCE degradation. In these rate constants calculations, total mass of PCE was considered to be equal to mass in liquid (Vl = 23 mL), gas (Vg = ∼0.3 mL), and solid phases (cement, reactor wall, and Teflon), where PCE sorption to cement was negligible and most of PCE were partitioned to the Teflon lining material of the closure (Hwang and Batchelor, 2000). PCE degradation experiments were conducted at an average pH of 12.6 with variation of ± 0.05.
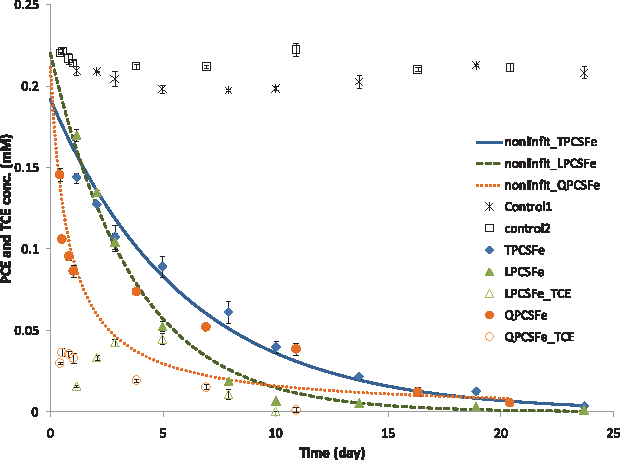
Kinetics of PCE reduction by Fe(II)-containing 10% cement slurry. Dotted line for QPCSFe represents the second-order kinetic model fit, whereas the dashed line for LPCSFe and solid line for TPCSFe represent the first-order kinetic model fit. Control 1 is for TPCSFe and LPCSFe and control 2 for QPCSFe. Initial PCE concentrations were 0.242 mM. Fe(II), ferrous iron; TCE, trichloroethene; QPCSFe, Fe(II)-containing 10% Q Portland cement slurry; LPCSFe, Fe(II)-containing 10% L Portland cement slurry; TPCSFe, Fe(II)-containing 10% Txi Portland cement slurry. PCE, tetrachloroethene.
The first-order rate constant was referenced from Hwang and Batchelor (2000); uncertainties represent 95% confidence limits expressed in % relative to estimate k; initial PCE concentration was 0.242 mM except CPCSFe, 0.245 mM.
k1Fe(II), the ferrous iron (Fe(II)) concentration–normalized first-order rate constant, k1Fe(II) = k1/[Fe(II)]; SS1, the sum of square of the first-order rate model; k2Fe(II), the Fe(II) concentration–normalized second-order rate constant, k2Fe(II) = k2/[Fe(II)]; SS2, the sum of squares of the second-order rate model; TPCSFe, Fe(II)-containing 10% T Portland cement slurry; QPCSFe, Fe(II)-containing 10% Q Portland cement slurry; LPCSFe, Fe(II)-containing 10% L Portland cement slurry; CPCSFe, Fe(II)-containing 10% C Portland cement slurry; PCE, tetrachloroethene.
Both first- and second-order kinetic models fitted the data for PCE degradation by TPC slurry containing Fe(II) (TPCSFe, exp. 1) equally well. The pseudo-first-order rate constant for TPCSFe was two times higher than that for experiments with CPCSFe (Hwang and Batchelor, 2000). The first-order kinetic model provided a better fit to data from the experiment with LPCSFe (exp. 3) than did the second-order model. The pseudo-first-order rate constant for LPCSFe was 2.5 times higher than that for CPCSFe and 1.5 times higher than that for TPCSFe. About 50% of PCE was degraded by both TPCSFe and LPCSFe after 3 days. Experiments with QPCSFe (exp. 2) showed unique PCE degradation behavior (Fig. 1). The kinetic data fit a second-order model better than a first-order model, in contrast to data from experiments with other cement slurries. The second-order kinetic model fits the initial and final data points well, but did not fit points in the middle very well. Values predicted by the kinetic model were much below the measured values for data from days 4 to 11. Although it was the same type of cement as CPC, it showed a different kinetic behavior. About 50% of PCE was degraded within 10 h and then the rate of PCE degradation slowed down. Approximately 75% of PCE was removed within 7 days. Uncertainties in the calculated rate constants for these three cement slurry systems were significantly higher than those for CPCSFe. This is especially true for coefficients obtained with QPCSFe.
Another behavior that was different from CPC was the detection of trichloroethene (TCE) during PCE degradation experiments. TPCSFe did not show accumulation of any TCE during the experimental period. However, some TCE was detected during PCE degradation experiments by LPCSFe and QPCSFe. TCE concentrations equal to about 20% of the PCE concentration in controls were measured in experiments with QPCSFe after 2 days. Then, TCE concentrations decreased to below 0.6% of the PCE concentration in the control after 10 days. TCE concentrations slowly increased in LPCSFe and reached a maximum of 20% of the control at 5 days. TCE concentration in LPCSFe also decreased to below 0.1% of the control after 10 days.
The PCE degradation by CPCSFe has been reported to follow a β-elimination pathway. This conclusion was based on the observation that TCE was not detected as an intermediate product and acetylene (C2H2) was detected as a final product (Hwang and Batchelor, 2000). Although there were no attempts to identify the byproducts of PCE degradation other than TCE in this experiment, detection of TCE indicates that a hydrogenolysis reaction could be also the PCE degradation pathway in LPCSFe and QPCSFe, along with β-elimination pathway.
Table 2 and Fig. 2 show results of the PCE degradation experiments conducted with 10% cement extract from four different cement manufacturers. The first- and second-order rate constants were obtained by nonlinear regressions using Matlab. PCE degradation experiments were conducted at an average pH of 11.6 with variation of ± 0.05 for experiments with extracts made from TPCXFe, LPCXFe, and QPCXFe. Although the same concentration of Ca(OH)2 (1.25 M) was used in all experiments, pH values in experiments with TPCXFe, LPCXFe, and QPCXFe were lower than those with CPCXFe. This might result from lower initial pH of the cement extracts after acid digestion. The pH of CPCX was about 4 and others were about 3, even though the same volume (10 mL/g) and concentration (2.2 N) of HCl was used to dissolve the four different cements.

Kinetics of PCE reduction by Fe(II)-containing 10% cement extract. The solid line for TPCXFe represents the first-order kinetic model fit, whereas the dashed line for LPCXFe and the dot line for QPCXFe represent the second-order kinetic model fit. Initial PCE concentrations were 0.242 mM. TPCXFe, Fe(II)-containing 10% T Portland cement extract; LPCXFe, Fe(II)-containing 10% L Portland cement extract; QPCXFe, Fe(II)-containing 10% Q Portland cement extract.
The Fe(II) concentration–normalized first-order rate constant was referenced from Ko and Batchelor (2007); uncertainties represent 95% confidence limits expressed in % relative to estimate k; initial PCE concentration was 0.242 mM.
TPCXFe, Fe(II)-containing 10% T Portland cement extract; QPCXFe, Fe(II)-containing 10% Q Portland cement extract; LPCXFe, Fe(II)-containing 10% L Portland cement extract; CPCXFe, Fe(II)-containing 10% C Portland cement extract.
The first-order kinetic model fitted well to TPCXFe data (exp. 4) and the second-order kinetic model fitted well to QPCXFe data (exp. 5) and LPCXFe data (exp. 6). The pseudo-first-order rate constant normalized by Fe(II) (k1Fe(II) = k1/[Fe(II)]) for TPCXFe was 1 order of magnitude lower than that for CPCXFe. About 50% of PCE was removed within 7 days and 95% was removed at the last sampling time (37 days). TPCXFe showed a k1Fe(II) that was about 40% lower than that for TPCSFe. This contrasts with CPXFe, which had a k1Fe(II) that was 1 order of magnitude higher than that for CPCSFe. Values of k1Fe(II) for QPCXFe and LPCXFe are 1 order of magnitude lower than k1Fe(II) of CPCXFe (Table 2). The solids in QPCXFe and LPCXFe showed lower degradative activities than CPCXFe. Moreover, TCE was consistently detected in the range of 5%–10% of PCE concentration in the control for QPCXFe. After 20 days, TCE concentration increased to 15% and was steady until the last sampling time. TCE was also detected in LPCXFe after 1 day and reached a maximum of 14% of the PCE concentration in the control after 7 days. TCE was not detected after 10 days.
Although the second-order kinetic model gave a slightly better fit to QPCXFe data than the first-order kinetic model, it did not fit the data well. It underestimates in the middle of three data points and overestimates the last four data points, although it estimates well the first three data points. Data from experiments with QPCSFe and QPCXFe did not fit well to any kinetic model. Solids from the experiment with QPCXFe showed PCE degradative activities that were 1 order of magnitude lower than those from experiments with QPCSFe. Solid activities represent the ability of the solids to degrade target organics as indicated by values of kinetic constants. The second-order kinetic model fitted well to data from experiments with LPCXFe, whereas the first-order kinetic model provided a better fit to data from experiments with LPCSFe.
The poor fit of these kinetic models to data obtained with QPCSFe and QPCXFe might result from not taking into account the surface sites at which the reaction occurs. Abiotic reductive dechlorination is a surface reaction, so the presence of available surface sites can be pivotal in maintaining the reaction. The slower rates of removal observed at longer reaction times with QPCSFe and QPCXFe might be due to slower formation of hexagonal hydrates. Sufficient surface sites might be available initially to support good rates of removal, but the slower production rate of sites might not be able to maintain the concentration of available surface sites, resulting in lower rates during the later parts of the experiment. Available active sites were not considered in the kinetic model in this study because the actual reductant solids were not precisely identified. However, including information on surface sites such as their surface areas and Fe(II) contents would improve the kinetic model.
Different PCE degradation behaviors were observed in experiments with cement extract and cement slurry even though they used the same brand of cement. The fact that TPCXFe, LPCXFe, and QPCXFe had lower solid activities than CPCXFe might be caused by either formation of lower amounts of the active solids or similar amounts that have lower activity, because of, for example, different chemical compositions of cements or pH. After centrifugation of the mixture of PCX and Fe(II), the concentration of Fe(II) recovered at the top of the pellet was about 30 mM and solid content was about 45 g/L. The concentration of Fe(II) recovered from CPCXFe solids was 20 mM and solid content was 31 g/L. The ratio of Fe(II) to solids was about 0.67 mmol Fe(II)/g solid for TPCXFe, LPCXFe, and QPCXFe, whereas 0.97 mmol Fe(II)/g solid for CPCXFe. This supports the observation that less-active solids were formed in TPCXFe, LPCXFe, and QPCXFe because they contained less Fe(II). It might also indicate that formation of active solids was very sensitive to pH, because pH values of experiments with those three cement extracts (pH 11.6) were 0.2 pH units lower than the pH of CPCXFe (pH 11.8).
Moreover, the different Fe(II)-to-Fe(III) ratios in the solids might be the fact that these three solids showed lower activities than CPCXFe. The Fe(II)-to-Fe(III) ratio was 3 in the CPCXFe solid suspensions, 12 in TPCXFe suspensions, and 19 in QPCXFe and LPCXFe suspensions. It also indicates that the higher degree of oxidation of Fe(II) to Fe(III) may lead to the formation of more reactive solids such as green rust (GR), whose ratio of Fe(II) to Fe(III) is in the range of 2–3. GR has been shown to be an effective reductant for chlorinated hydrocarbons (Erbs et al., 1999; Lee and Batchelor, 2000b) and belongs to the family of a layered double hydroxide (LDH) that has sheets of metal hydroxides with anions in the interlayer. A general formula for LDH is as follows:
Aluminate-ferrite-mono (AFm) phases formed in the course of hydrations of tricalcium aluminate and tetracalcium aluminoferrite in anhydrous PC are also LDH (Taylor, 1997). The rate of incorporation of Fe(II) into LDH (i.e., a substitution of Ca or Al to Fe(II)) or the rate of transformation of Fe(II) hydroxide, which is not as reactive as GR, to LDH might be slower in TPCXFe, QPCSFe, and LPCXFe than in CPCXFe.
The last possible reason might be different iron content in cement sources. Weight percentage of Fe2O3 in CPC is 2.5%, the lowest Fe percentage among four PC sources, and 4.4% in QPC, the highest among them. TPC and LPC have 3.7% and 3.6% Fe contents, respectively (refer Supplementary Table S1). Iron content of aluminoferrites affected the rate of hydration, that is, increasing hydration rate as iron content decreases (6CaO·2Al2O3·Fe2O3 > 4CaO·Al2O3·Fe2O3 > 6CaO · Al2O3·2Fe2O3) (Csizmadia et al., 2001). The slightly different iron content might have an influence on the formation of hydration products and the rate of hydration, resulting in different behaviors during PCE degradation. Because the PCE degradation reaction occurs at the solid surface and Fe(II) preferentially associates with hexagonal hydrates (Ko and Batchelor, 2007), the formation of hexagonal hydrates might have a critical impact on PCE degradation behavior. For future studies, it would be interesting to investigate the formation and transformation of AFm phases in the presence of different concentrations of iron and cement elements and, if possible, to monitor iron concentration variations in the solution as PCE is transformed.
Formation of TCE indicates that PCX solids might also follow a hydrogenolysis pathway for PCE degradation, as observed for experiments with cement slurries. PCE degradation rates of PCX solids were slower than that of PCS solids.
Understanding the kinetics and pathways of dechlorination can provide valuable information for design of systems to treat contaminated soils and to monitor the behavior of the treated soils after treatment. Knowledge of the degradation pathway allows identification of the intermediate compounds expected when the parent compound is degraded. Knowledge of the kinetics of degradation allows prediction of the concentrations of parent compounds and their degradation products over time. These predictions can be used to optimize design by choosing doses of reagents that will achieve desired levels of treatment within specified times with minimum cost. When ground water contacts the contaminated soils, it is particularly important to know when the concentrations of hazardous components will be reduced to desired levels in the treatment zone. Although conventional S/S treatment can reduce the rate of leaching, the chlorinated organic contaminants remain in the soils and retain the potential to contaminate ground water. In contrast, DS/S retains the contaminants for a sufficient time to bring about their destruction. Therefore, it is important to understand the processes with as much detail as possible so as to predict mass destruction and reaction time as well as to manage Fe(II)-DS/S applications properly.
Variability of the formation of the active solid phases
Figure 3 shows the XRD patterns for TPCSFe, QPCSFe, and LPCSFe and d-spacing values corresponding to 2θ in x-axis. Peaks at 9.50, 5.54, and 2.75 Å in TPCSFe solids represent ettringite (JCPD 41-1451). Peaks at 7.7 and 3.78 Å represent Friedel's salt (JCPD 35-105). The peak at 3.85 Å might come from either ettringite or Friedel's salt. Peaks at 3.03, 3.20, and 2.87 Å represent calcium aluminum silicate hydrate (JCPD 18-274). Other minor peaks could be due to either Friedel's salt or calcium aluminum silicate hydrate. The presence of ettringite in TPCSFe was different from CPCSFe in which ettringite was not observed (Ko and Batchelor, 2007).
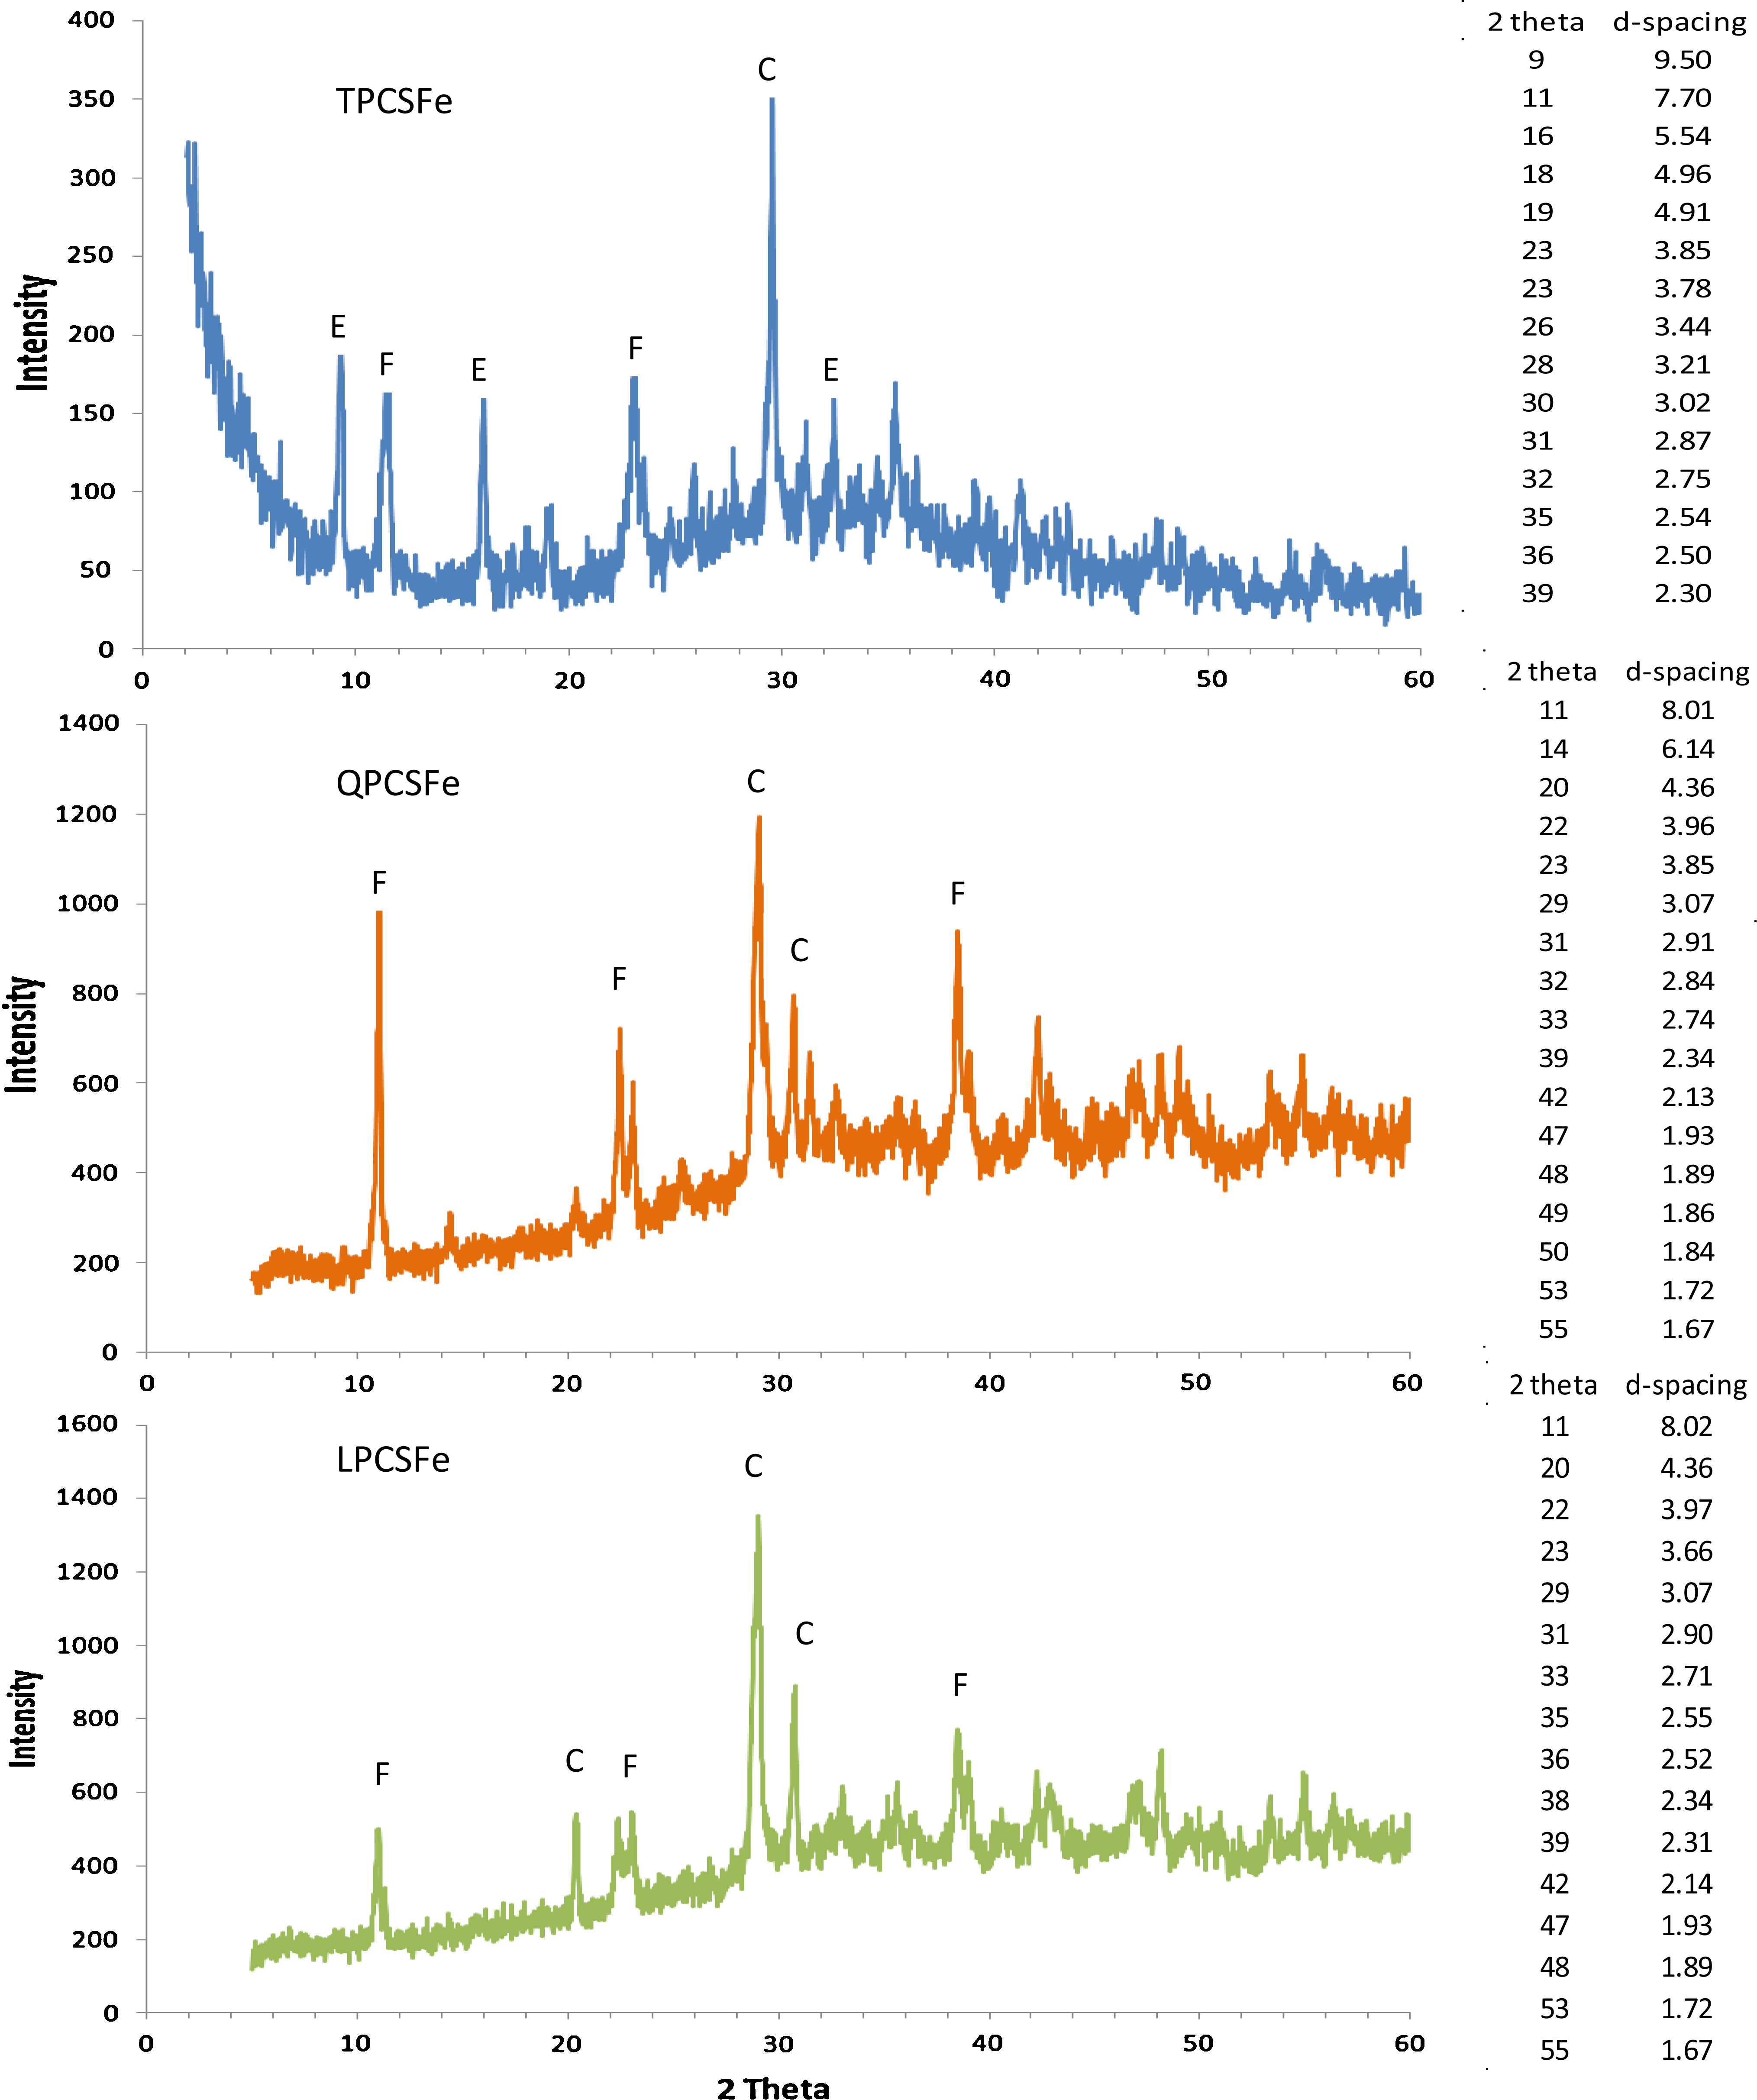
X-ray diffraction patterns of solids prepared with Fe(II) and 10% Portland cement. Unit of d-spacing is Å. E, ettringite; F, Friedel's salt; C, calcium aluminum silicate hydrate.
LPCSFe, QPCSFe, and CPCSFe had similar XRD patterns. Friedel's salt was the solid most clearly identified in QPCSFe, with peaks at 8.01, 3.95, and 3.84 Å, and in LPCSFe, with peaks at 8.02, 3.97, and 3.86 Å. Calcium aluminum silicate hydrate was identified with peaks at 3.07 Å in QPCSFe and LPCSFe. Peaks at 4.35 Å in both solids also could represent calcium aluminum silicate hydrate. Ettringite peaks were not observed in either solid. Peaks from Friedel's salt in QPCSFe showed a higher intensity than in LPCSFe, which maybe because they were more highly crystalline. Peaks at 2.34 and 2.31 Å would be Friedel's salt. They were recognized as seventh and eighth high-intensity peaks in reference solids, respectively, but they showed higher intensity in LPCSFe and QPCSFe than the peaks at 3.96 and 3.85 Å, which were the second and third most intense ones in reference solids (JCPD 35-105) (see Supplementary Table S2). The different degrees of crystallization and different amounts of solids might cause intensities to differ from standards and from one another. However, solids from the four Fe(II)-containing cement slurries had very similar XRD patterns. Friedel's salt and calcium aluminum silicate hydrate were identified in all four solids. Ettringite was only identified in TPCSFe. The d-spacings and the order of high-intensity peaks were a little bit different from reference solids. This might be caused by different chemical compositions of reference solids compared with solids formed in cement slurries with Fe(II).
Figure 4 shows the SEM images and EDS spectra of solids from TPCSFe, QPCSFe, and LPCSFe. EDS spectra were taken from a certain region within a single hexagonal particle. Hexagonal thin plates were the dominant solid morphology in mixtures containing Fe(II) and they were the most clearly observed in QPCSFe. Particle sizes of three sets of solids were around 3–7 μm, which were similar to those for CPCSFe solids. EDS spectra showed that the same elements (Ca, Cl, Al, Si, and Fe) were present in all three solids and these are the same as observed in CPCSFe. Small amounts of Mg were detected in LPCSFe solids.
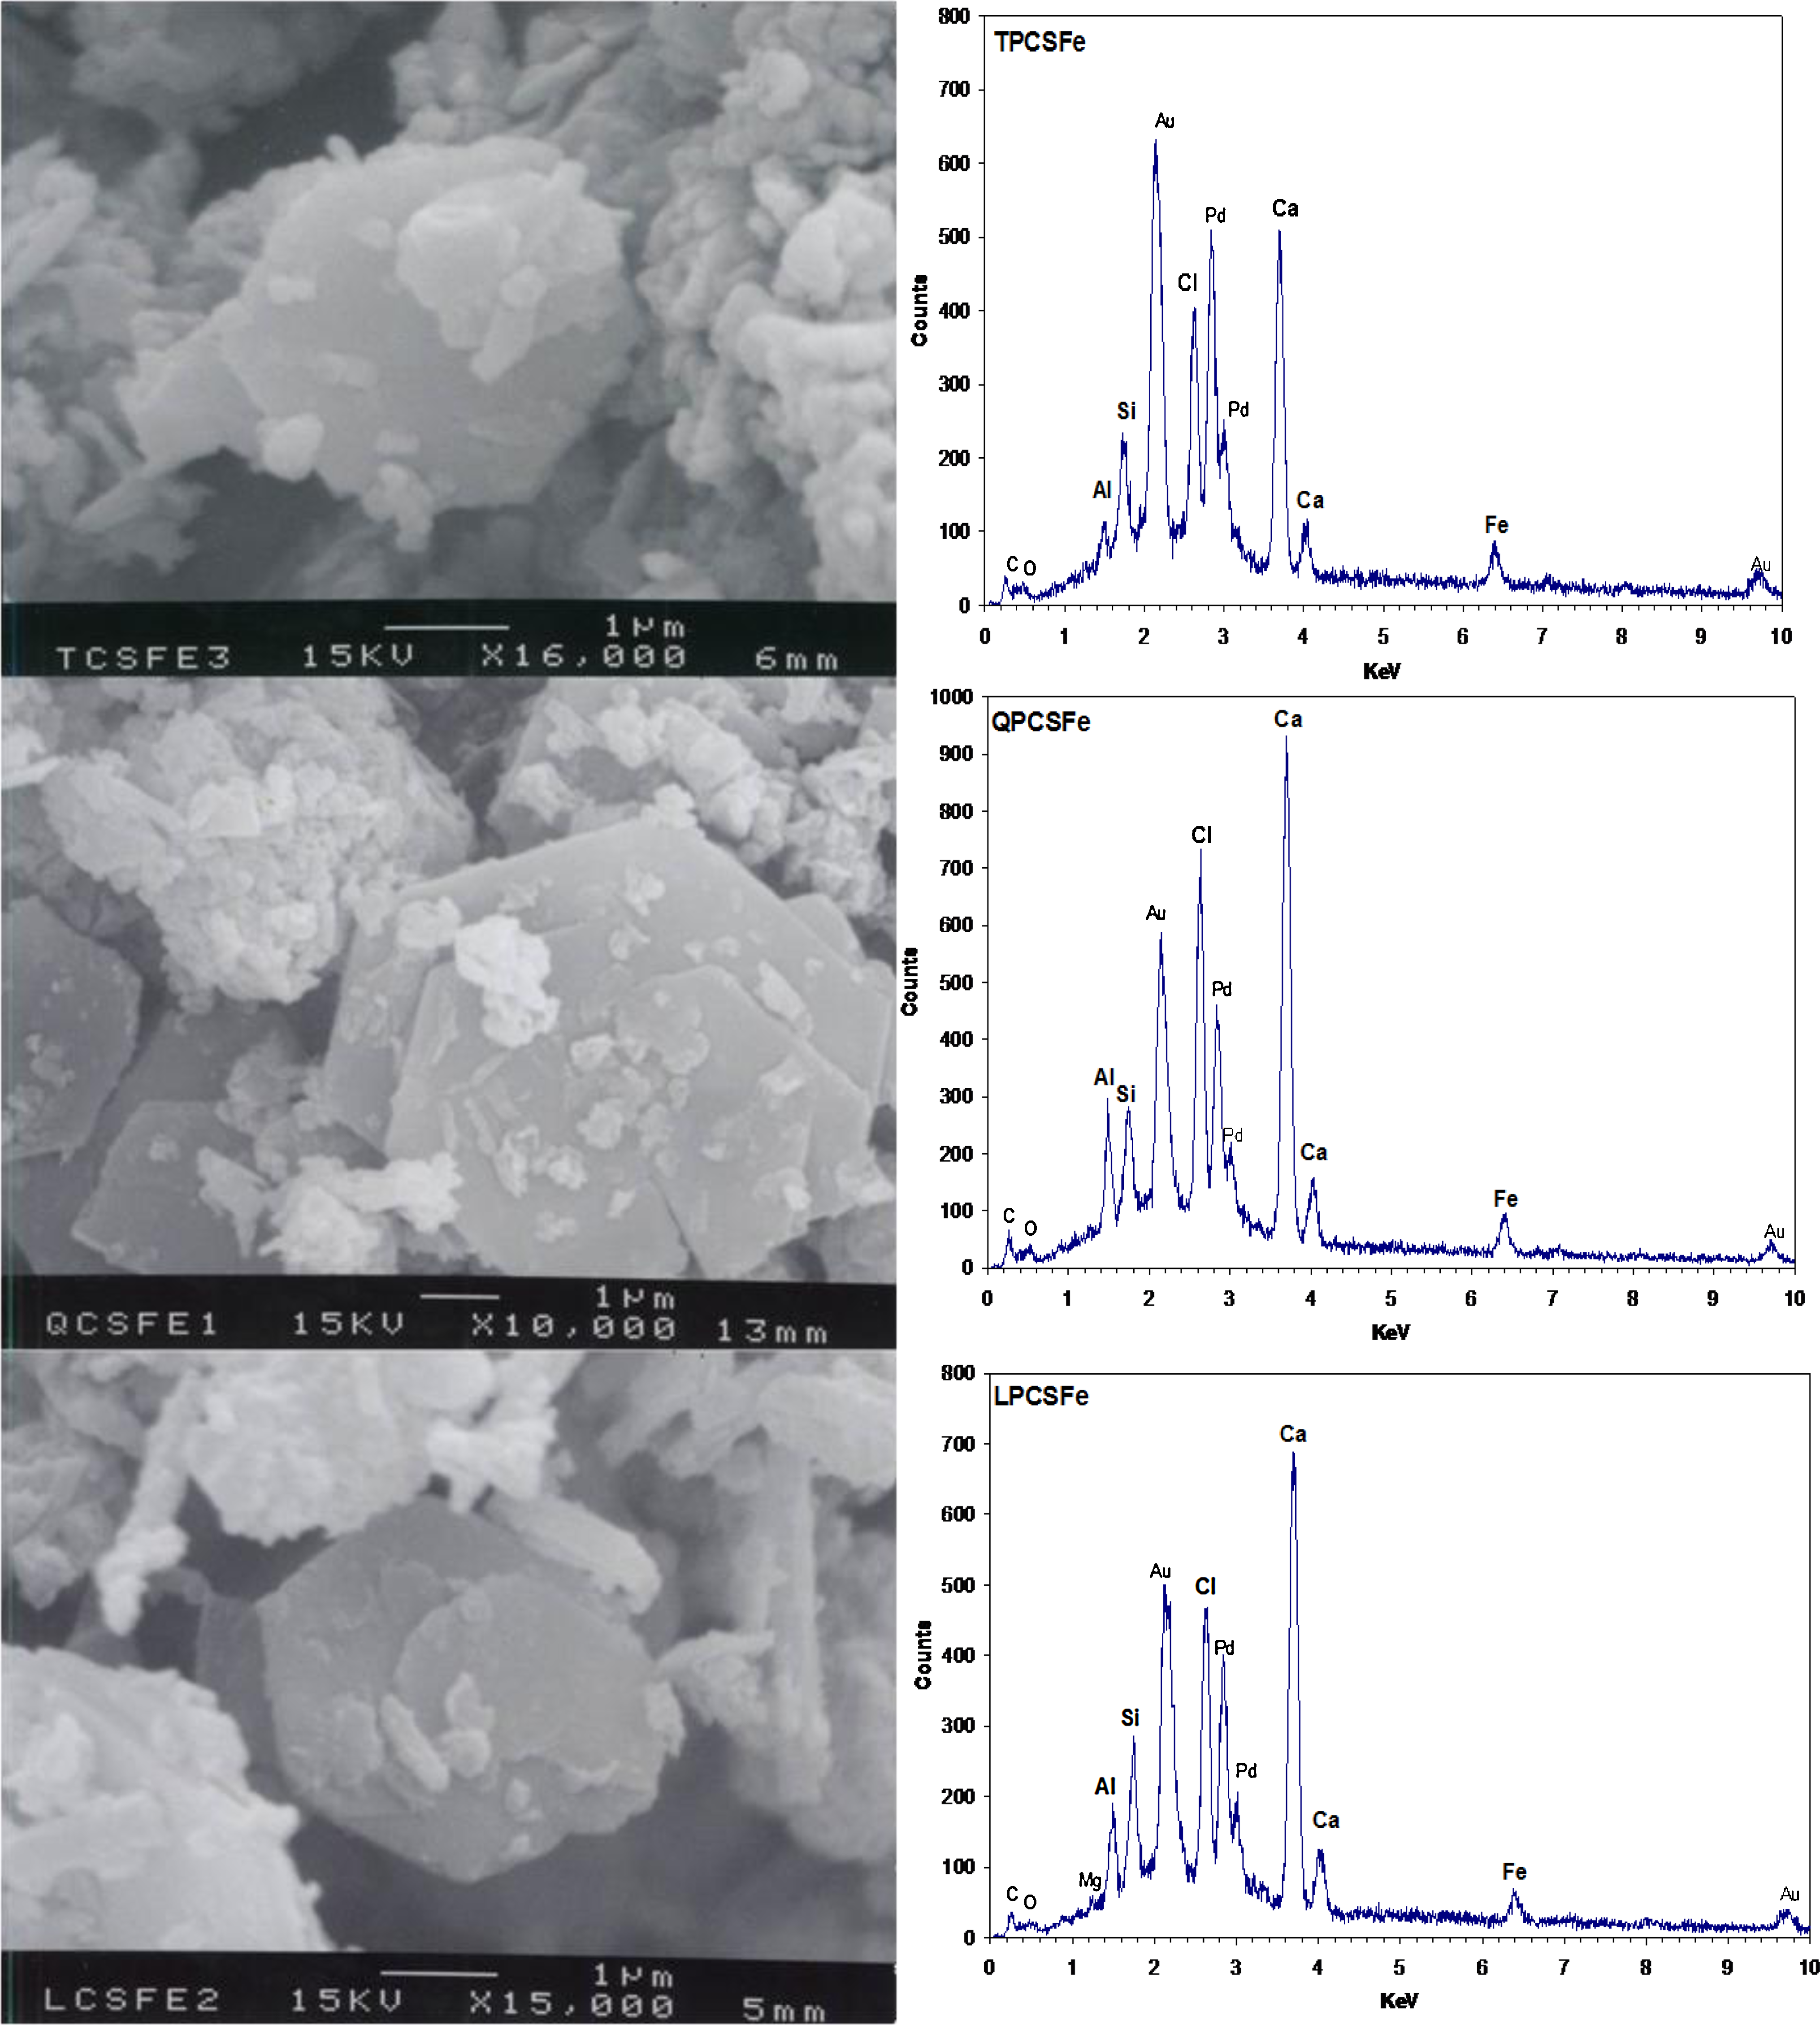
Scanning electron microscopy image and energy-dispersive spectrometry of solids prepared with Fe(II) and 10% (w/v) Portland cement slurry.
XRD patterns, SEM images, and EDS spectra showed that solids from cement slurries containing Fe(II) prepared with four different cements had the same elemental composition, similar particle sizes, and similar kinds of solid phases. However, they showed different behaviors in PCE degradation experiments. One possible reason might be different chemical composition, for instance, the ratio of Fe(II) to Fe(III) might be different among the different Fe(II)-containing cement slurry solids. A quantitative elemental analysis was not conducted and so this hypothesis could not be thoroughly investigated. The first reason that we did not conduct quantitative analysis on the ratio of Fe(II) to Fe(III) was that the importance of the ratio was not recognized until after the experiments were conducted. Second, although the ratio is important, other factors were considered more important and only limited amount of things could be done under this project. Finally, the ratio could theoretically be determined by knowledge of composition of cement and doses of chemical added. There would be several possible factors that have effects on the formation of solid phases responsible for PCE reductive dechlorination and they would be good subjects to investigate further for future researches.
Figure 5 shows the XRD patterns of solids prepared with three cement extracts and the corresponding d-spacings to 2θ in Fig. 5. Solids prepared with three cement extracts (TPCXFe, QPCXFe, LPCXFe) contained the same solid phases, because their d-spacing values and intensities were very similar to one another. The same kinds of solid phases were identified in all samples: Portlandite (JCPD 87-673), Friedel's salt (JCPD 35-105), calcium aluminum silicate hydrate (JCPD 18-274), and calcium aluminum hydroxide hydrate (JCPD 16-339). Significant amounts of Portlandite were detected because of high amount (92.6 g/L) of Ca(OH)2 addition for pH adjustment. Like CPCXFe, peaks from Friedel's salts in the three other samples were clearly observed with peaks at 3.9 and 3.8 Å (peak no. 5 and 6). Several peaks from Friedel's salt and calcium aluminum hydroxide hydrate were very close to each other because of their similar crystal structures. Thus, it was difficult to say whether Fe(II) was associated with Friedel's salt alone or with both solids.
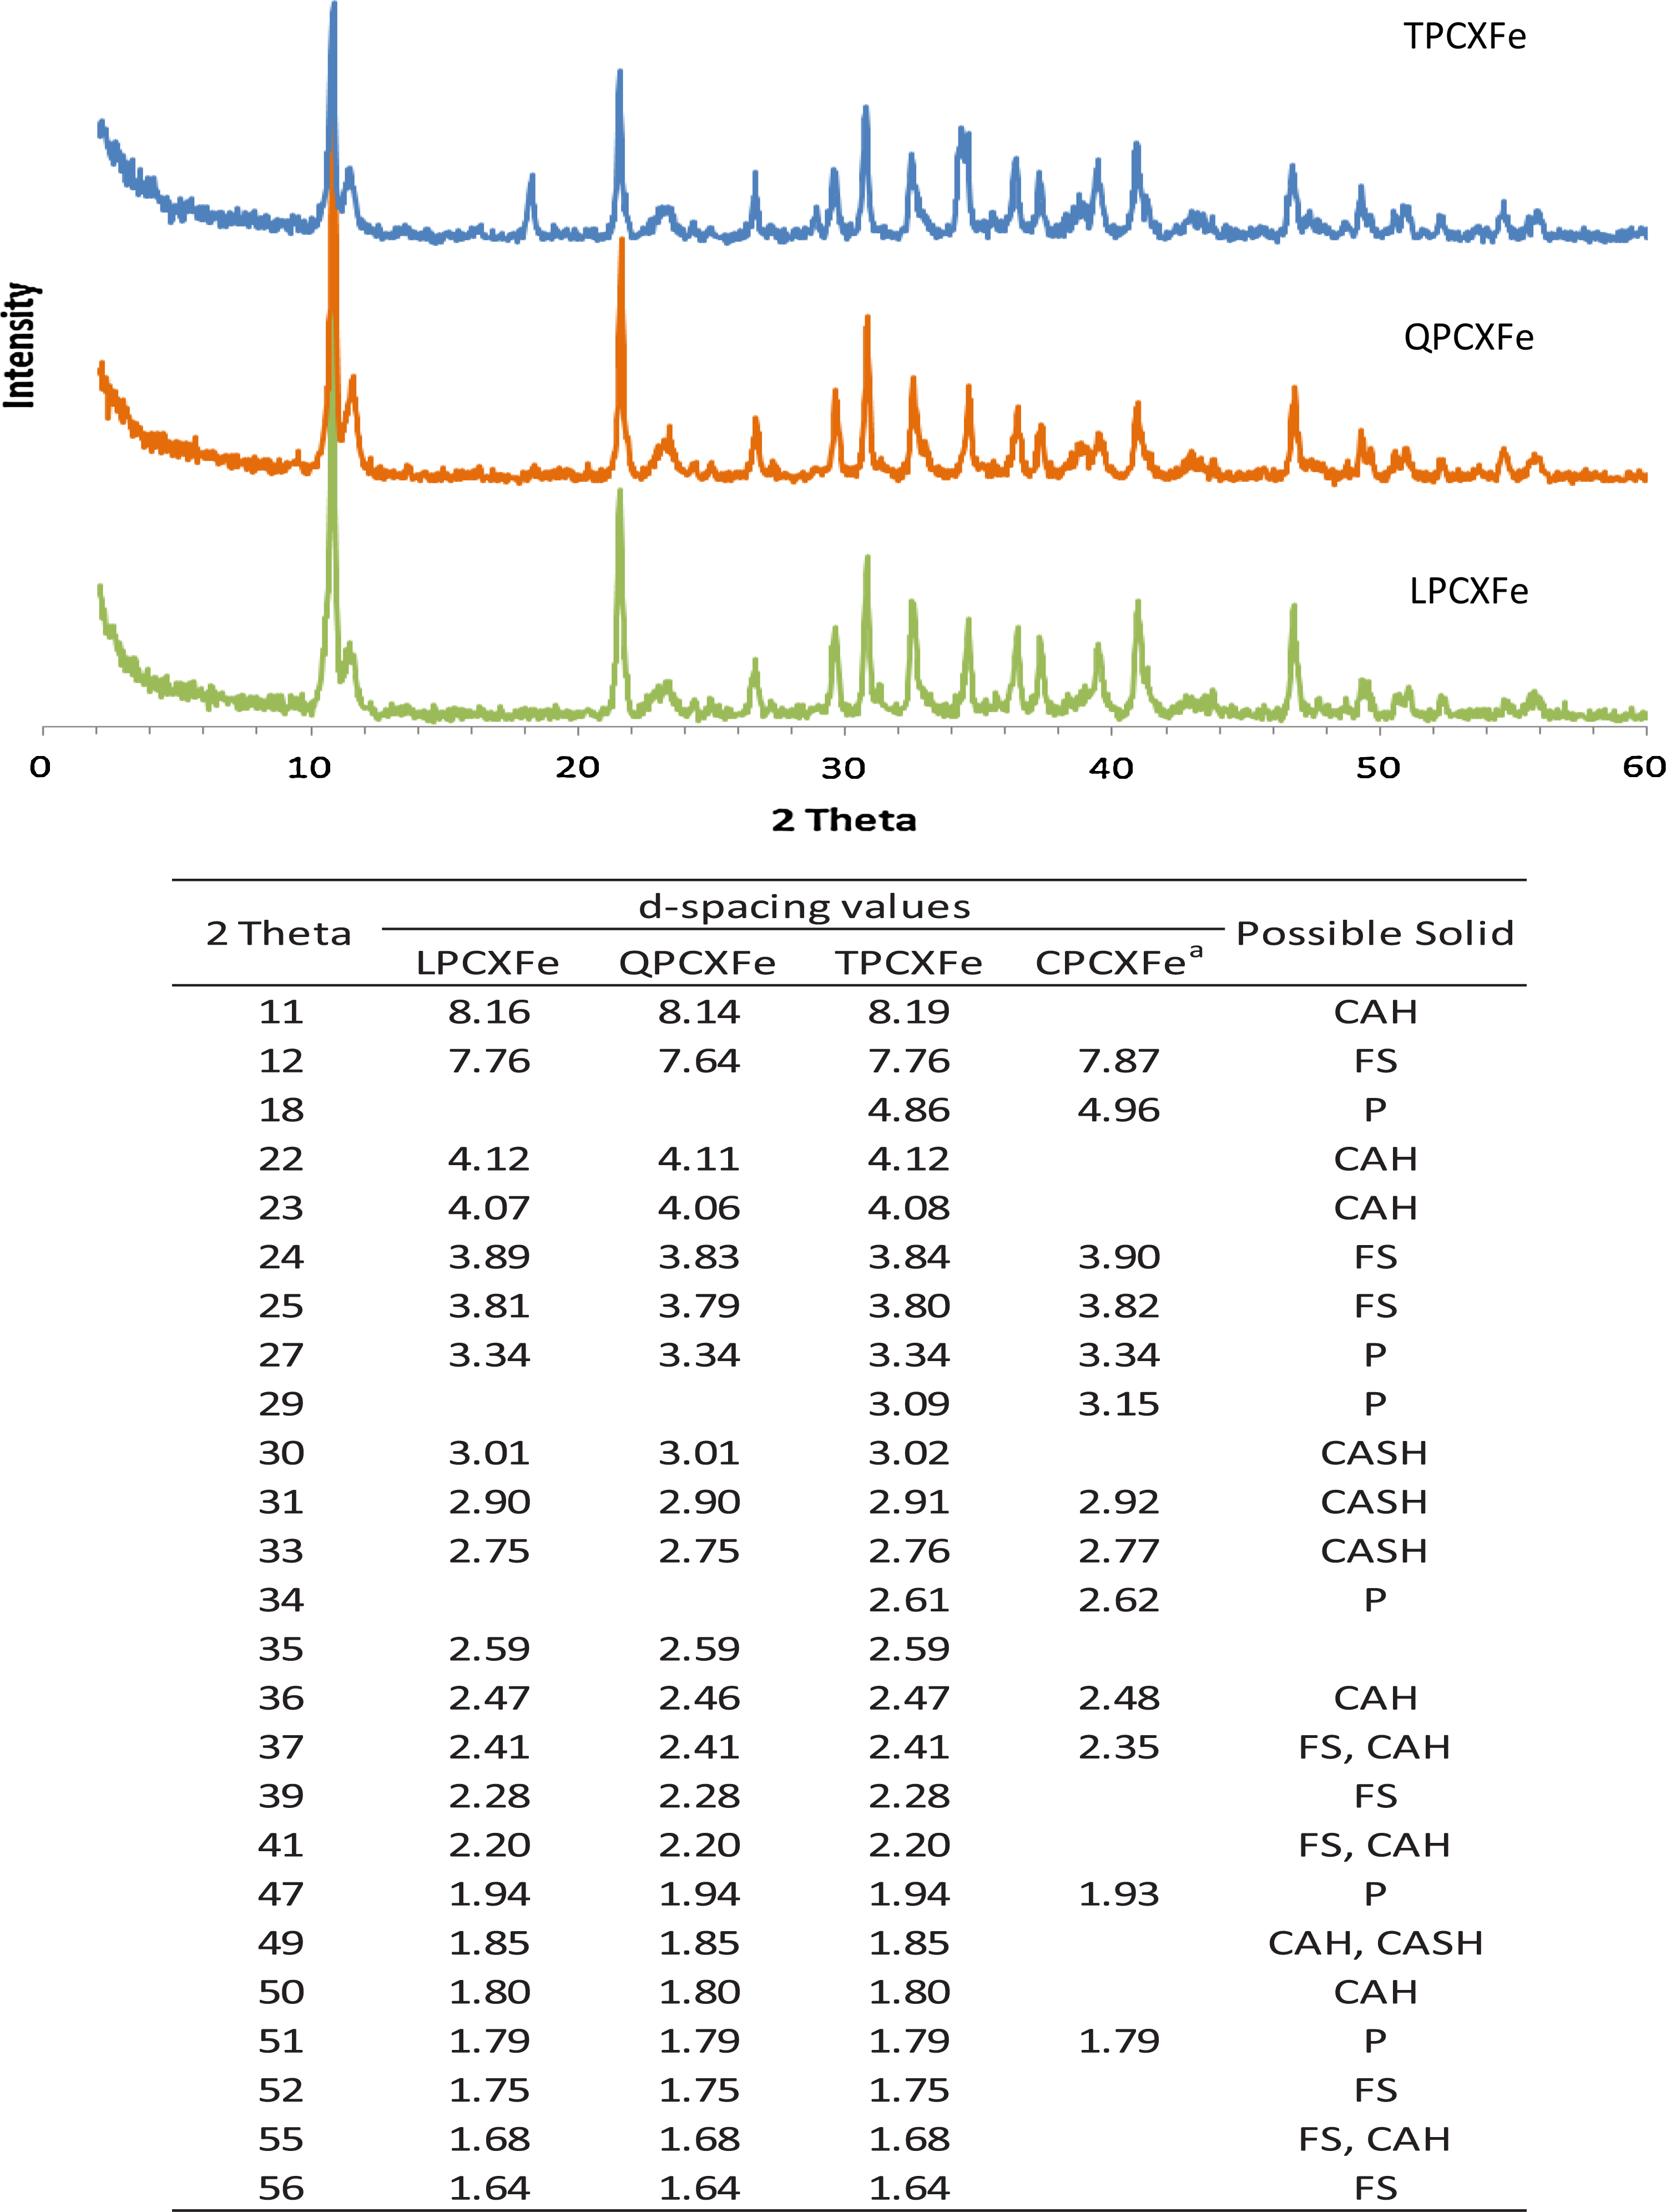
X-ray diffractogram of solids prepared with Fe(II) and 10% Portland cement extracts and d-spacing values (unite = Å) corresponding to 2θ (x-axis). aReference from Ko and Batchelor (2007). CAH, calcium aluminum hydroxide hydrate; FS, Friedel's salt; P, Portlandite; CASH, calcium aluminum silicate hydrate.
Figure 6 shows SEM images and EDS spectra for TPCXFe, QPCXFe, and LPCXFe solids. EDS spectra of three samples were taken from a certain region within a single hexagonal particle. Solids with hexagonal shapes were observed in all three samples, as observed for CPCXFe. Although individual particle shape was not clearly observed in QPCXFe and LPCXFe, particle sizes of QPCXFe and LPCXFe solids were around 0.5–1 μm and those for TPCXFe solids were around 5 μm. Aggregated small hexagonal particles were observed next to a large hexagonal particle in the SEM image of TPCXFe. The size of the smaller particles was much smaller than in PCSFe solids (3–7 μm) and it was similar to sizes observed in other samples prepared from extracts (0.3–1 μm).
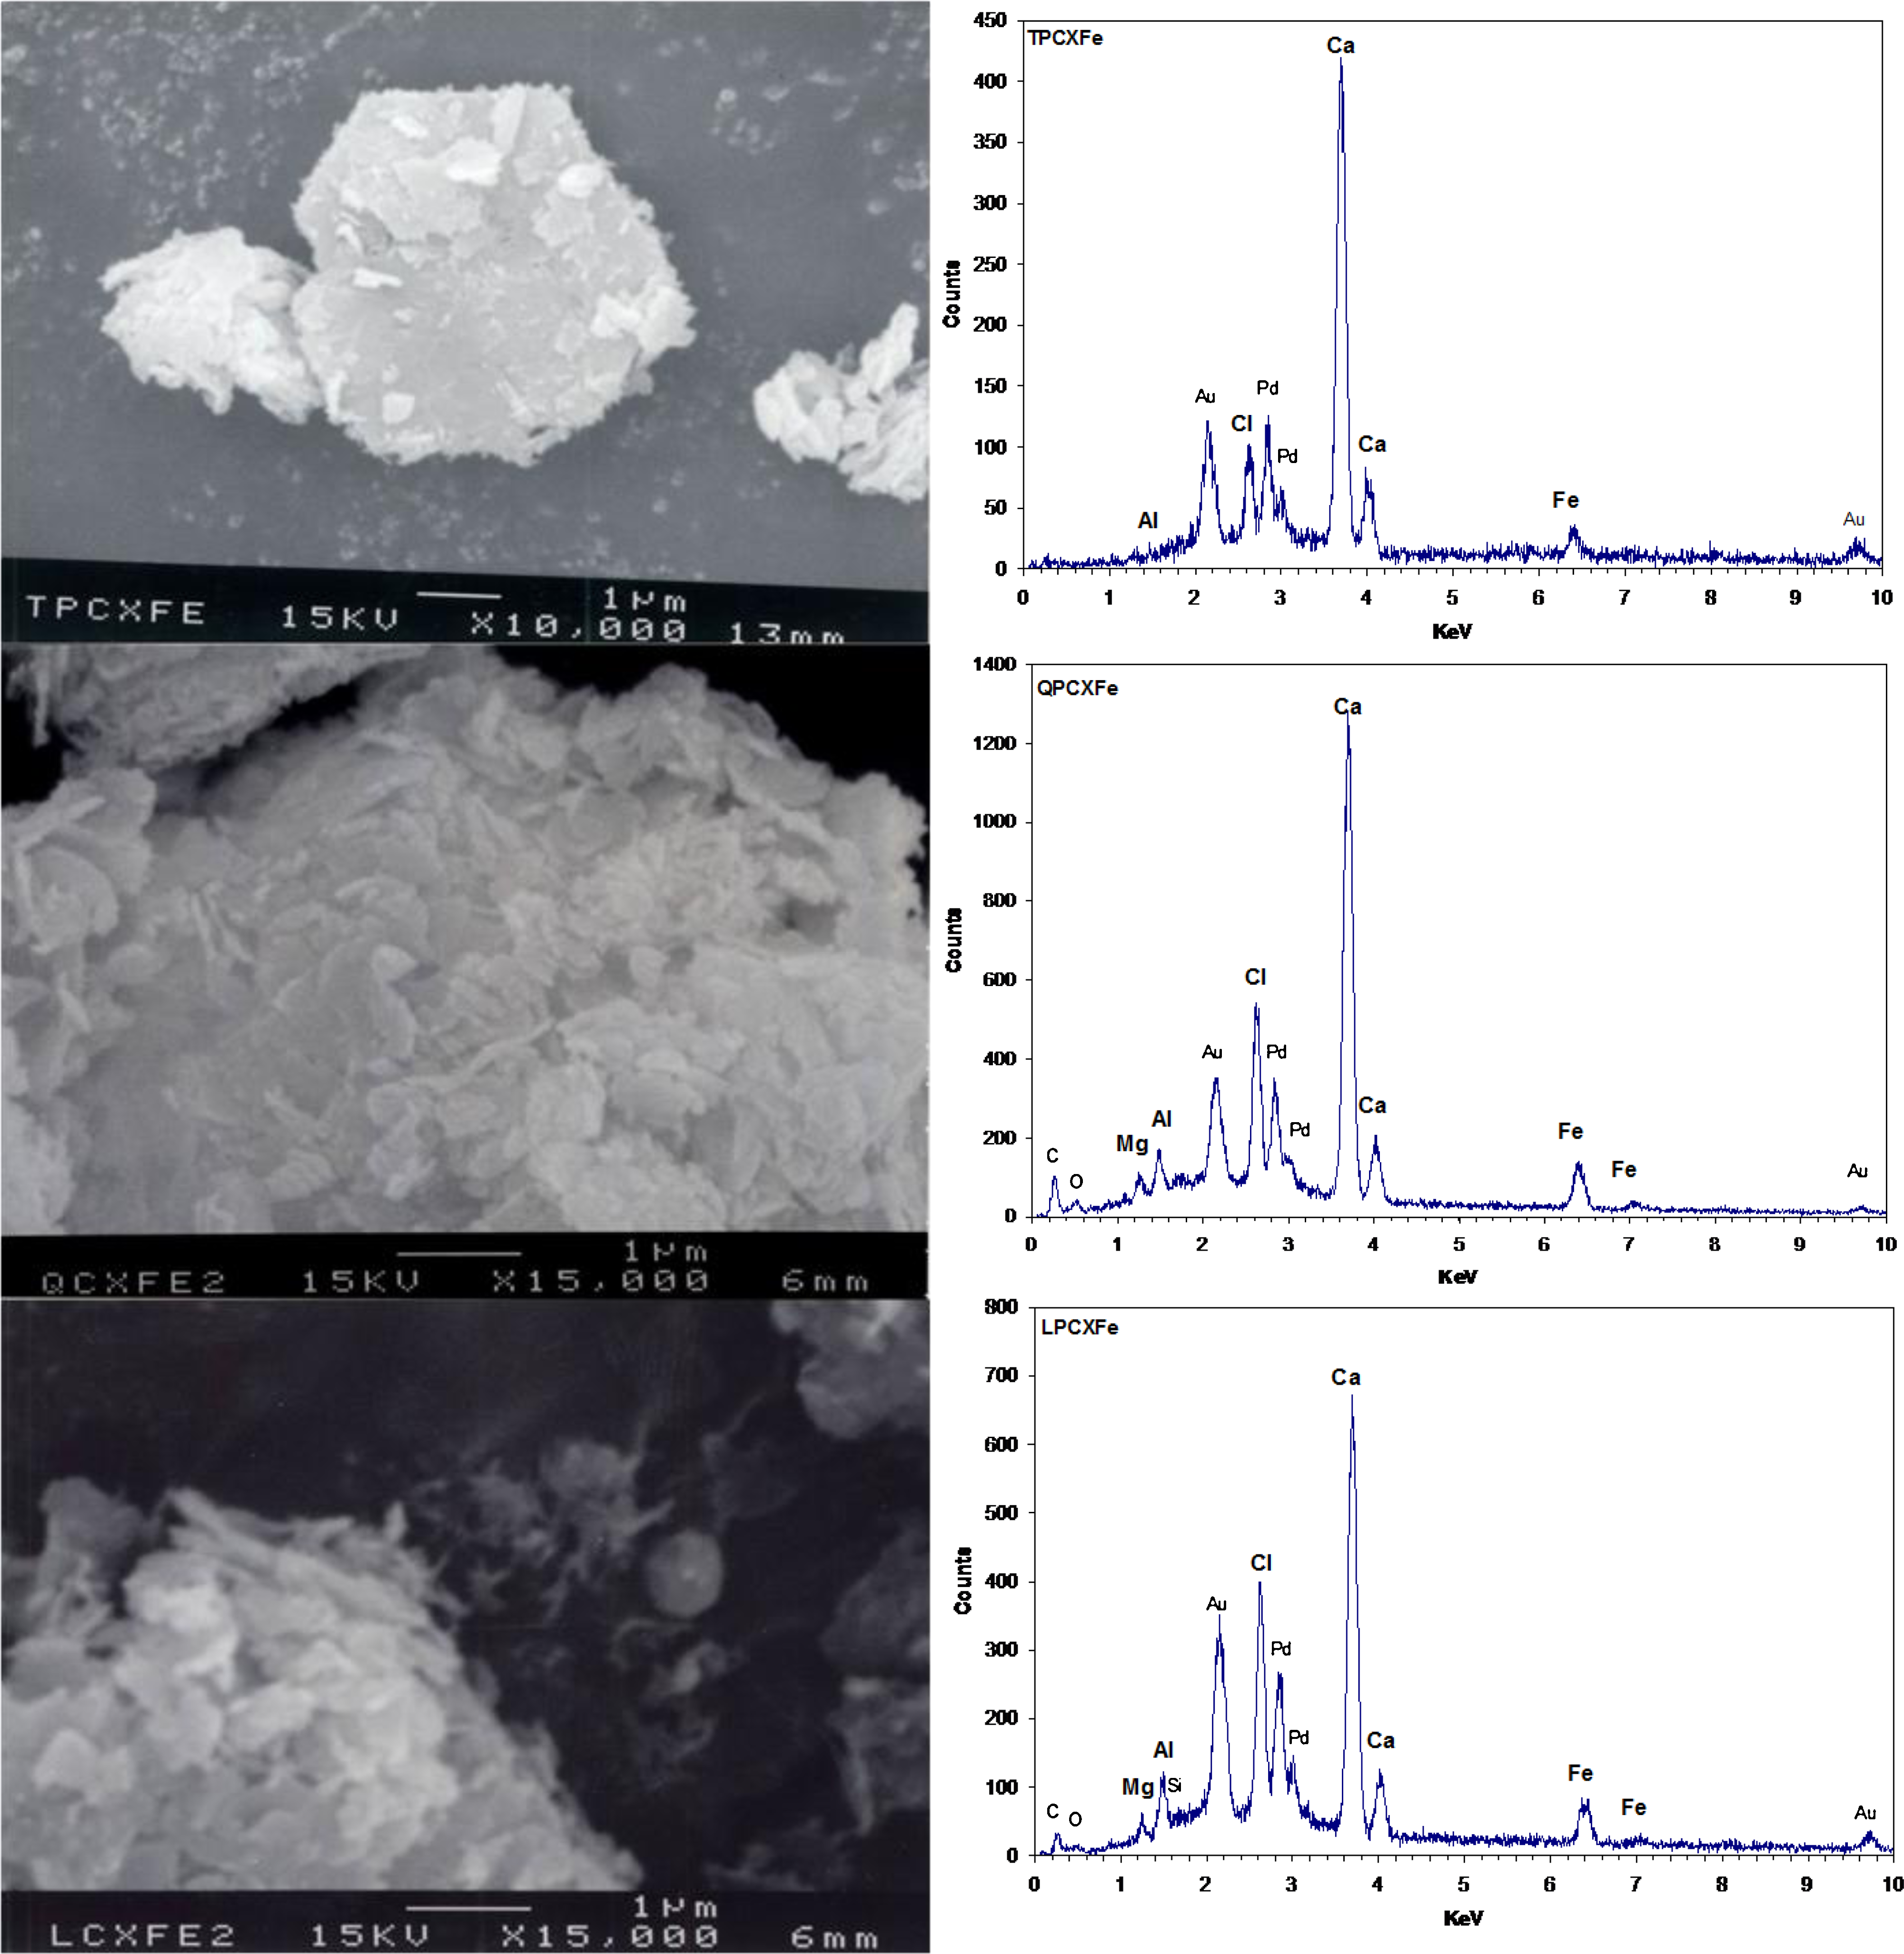
Scanning electron microscopy image and energy-dispersive spectrometry of solids prepared with Fe(II) and 10% (w/v) Portland cement extract.
EDS spectra showed that the major elements in Fe(II)-containing cement extract solids were Ca, Cl, Al, and Fe. Low amounts of Si and Mg were also detected. High amounts of Cl in all solids came from the high concentration of HCl used to digest the cement. In general, the particle size of Friedel's salt was around 2–3 μm and the size of tetracalcium aluminum hydrates was around or less than 1 μm. Portlandite was a bigger particle, with sizes up to 100 μm (John et al., 1998; Luo et al., 2003). Calcium aluminum hydroxide hydrates probably are shown as aggregates of smaller particles in Fig. 6. Based on the particle size comparison, the major solid phases in TPCXFe, QPCXFe, and LPCXFe were calcium aluminum hydroxide hydrates rather than Friedel's salt, which was the dominant solid phase in CPCXFe.
Interestingly, solids that did not show hexagonal particles had little or no Fe in the EDS spectra (Ko and Batchelor, 2007), suggesting the supposition that Fe is preferably associated with hexagonal particles. Although it could not be determined if Fe was adsorbed or substituted, it was clearly shown that hexagonal solids are associated with Fe.
Conclusions
CPCSFe, TPCSFe, and LPCSFe followed pseudo-first-order kinetics, whereas QPCSFe followed second-order kinetics. Solids made by adding Fe(II) to extracts of CPC and TPC (CPCXFe and TPCXFe) followed pseudo-first-order kinetics, whereas those made from LPC and QPC (LPCXFe and QPCXFe) followed second-order kinetics. QPCSFe and QPCXFe did not follow simple pseudo-first-order kinetics in which the rate of removal of PCE would be proportional to the concentration of PCE and it did not follow second-order kinetics in which the rate of removal of PCE would be proportional to the product of the concentration of PCE and the concentration of Fe(II) or the concentration of reductive capacity.
TCE was detected in PCE degradation experiments using LPCSFe, QPCSFe, LPCXFe, and QPCXFe. Slurries with Fe(II) made from four different cements formed the same kind of solids, although their kinetic behaviors were different. This might be caused by different compositions of the cements, for example, Fe(II)-to-Fe(III) ratios of LPCXFe and QPCXFe were about 19, whereas 3 for CPCXFe and 12 for TPCXFe. In the case of solids made from extracts, the main solid phases might be different because of their different particle sizes. Calcium aluminum hydroxide hydrate dominated solids made with TPC, QPC, and LPC and their particle sizes were 1 μm or less. However, Friedel's salt was the major phase found in solids made with CPC and had particle sizes in the range of 2–3 μm.
The chemical composition of cement and the pH during kinetic studies appear to be the important factors to determine PCE degradation behavior and the formation of solid phases. They are very sensitive to chemical composition and pH so that slightly different chemical composition and pH can lead to different PCE degradation behaviors and solid formation in Fe(II)-DS/S. Although the roles of trace elements in cement (e.g., Cu, Zn, Ni, Mn) are not examined here, it is possible that they might have an effect on the variation of Fe(II)-to-Fe(III) ratio in each cement.
The experimental studies presented here indicate that possible active reducing agents in Fe(II)-DS/S system are a type of AFm phase, either tetracalcium aluminate or Friedel's salt. This is based on the observation that Fe(II) added to cement slurries or extracts is likely to be associated with particles that are thin hexagonal plates. However, it has not been determined if the Fe(II) is structural or adsorbed.
Author Disclosure Statement
No competing financial interests exist.
References
Supplementary Material
Please find the following supplemental material available below.
For Open Access articles published under a Creative Commons License, all supplemental material carries the same license as the article it is associated with.
For non-Open Access articles published, all supplemental material carries a non-exclusive license, and permission requests for re-use of supplemental material or any part of supplemental material shall be sent directly to the copyright owner as specified in the copyright notice associated with the article.