
Abstract
Abstract
Effects of oil composition on dispersion effectiveness (defined as the mass fraction of oil entrained as droplets in the water column) and droplet-size distribution were investigated using baffled-flask mixing systems. The composition of oil samples used in dispersion experiments was systematically manipulated by varying the relative concentrations of the saturates, aromatics, resins, and asphaltenes (SARA) fractions. Forward stepwise linear regression was used with a generalized linear model that included main effects and two-factor interactions to evaluate the effects of oil composition on chemical dispersion. Limited sensitivity analysis was used to determine whether the significant effects were strongly dependent on the specific combination of responses observed in these experiments or insensitive to small changes within the range of variation that was observed. The concentration of the aromatics fraction and the saturates–resins interaction exerted statistically significant, positive effects on dispersion effectiveness (p<0.05). Regardless of composition, the droplet-size distributions observed in these experiments were multimodal consisting of small- (<7 μm), medium- (7–20 μm), and large-sized (>20 μm) droplets. Higher concentrations of the saturates fraction favored the entrainment of floating oil as small and medium-sized droplets, whereas the aromatics–asphaltenes interaction reduced the amount of oil present as small droplets. Aromatics–asphaltenes interaction increased the overall diameter of mean volume (DMV) of the dispersed oil droplets, and the saturates–asphaltenes interaction reduced it.
Introduction
Investigation of the effects of chemical composition on the performance of chemical dispersion is difficult due to the extreme complexity of petroleum. Crude oil contains thousands of components that can be broadly grouped into four fractions—saturates, aromatics, resins, and asphaltenes (SARA)—based on simple separation procedures that take advantage of similarities in molecular structure and polarity among the components of each fraction (Speight, 1991; Head et al., 2006). The relative proportions of these four groups and the specific components that constitute each group vary with oil type and extent of weathering. Previous studies have observed inconsistent effects of oil composition on dispersion effectiveness (DE) partly due to the compositional complexity of oil and partly due to differences in the methods that were used to evaluate the treatment effects. In particular, the most common approach for evaluating the effects of oil composition on dispersant performance has been to use multiple linear regression to determine the correlations between component concentrations and the effectiveness of chemical dispersion for different oils (Blondina et al., 1999; Canevari et al., 2001; Fingas et al., 2003). An inherent weakness of this approach is that the component concentrations used to represent each oil may covary with other (unmeasured) characteristics. As a result, inconsistent treatment effects have been observed between studies.
The objective of this research was to systematically investigate the effects of oil composition on DE by creating oil samples that differed in the relative proportions of the four SARA fractions by adding the isolated fractions to the same base oil. In this study, the concentrations of each fraction varied over the range that is typically observed for conventional crude oil. The effects of chemical composition on the size distribution of dispersed oil droplets were also investigated. Compositional effects on droplet-size distribution are important because droplet-size affects the rate of vertical transport (Li and Garrett, 1998) and, therefore, the tendency of dispersed droplets to reform a surface slick.
Experimental Materials and Methods
Materials
Compositionally modified oils were prepared by adding SARA fractions isolated from Lloyd crude oil (American Petroleum Institute [API] gravity, 22) to evaporatively weathered Arabian Light crude oil (initial API gravity, 39; 37% of the initial mass was lost due to evaporation) and evaporatively weathered Mars crude oil (initial API gravity, 30; 27% of initial mass lost due to evaporation). Both crude oils were evaporated under a stream of air at room temperature (20°C–22°C) in a fume hood. The composition of the weathered Arabian Light, estimated by preparative-scale column chromatography, is provided in Table 1. Samples with desired compositions were prepared by adding the required mass of specific SARA fractions isolated from Lloyd blend crude oil to weathered Arabian Light or Mars in 20 mL glass vials. For example, 1.5 g of an oil composed of 45% saturates, 30% aromatics, 15% resins, and 10% asphaltenes was prepared by adding 1.27 g of 37% weathered Arabian Light to a tared glass vial followed by 7.2 mg of the Lloyd-derived saturate fraction, 38 mg of the aromatic fraction, 69 mg of the resin fraction, and 118 mg of the asphaltene fraction. The SARA fractions were dissolved in dichloromethane (DCM) to aid mixing with the weathered crude oil. The oil mixtures were shaken on an orbital shaker at 200 rpm for 24 h under a stream of air to promote homogenous distributions of the components and to remove DCM. Because the crude oils were extensively weathered by evaporation and the light components of the Lloyd crude oil were lost during the fractionation process, significant additional evaporative loss of oil did not occur during preparation of the experimental mixtures (the mass remaining after evaporation of the solvent was within 5% of the expected mass).
±One standard deviation of three independent measurements.
Corexit 9500 (Nalco Energy Services) was used at a dispersant-to-oil ratio of 1:25 (v/v) in these experiments. Corexit 9500 consists of about 48% nonionic and 35% anionic surfactants in a mixture of food-grade aliphatic hydrocarbons (NRC, 2005). The nonionic surfactants include ethoxylated sorbitan mono- and trioleates and sorbitan monooleate. Sodium dioctyl sulfosuccinate is the major ionic surfactant in the dispersant (Pollino and Holdway, 2002).
Artificial seawater was prepared by dissolving 35 g of sea salts (Sigma-Aldrich) in 1 L of ultrapure deionized water. The seawater was filtered through 0.2 μm membrane filters (Millipore) to remove any suspended materials that might interfere with particle size measurements. Aluminum oxide (Brockmann Type I), DCM, and sodium sulfate were ACS reagent grade and were purchased from Fisher Scientific.
Crude oil fractionation
The saturate, aromatic, resin, and asphaltene fractions of the Lloyd crude oil were isolated using a modification of the SARA procedure described by Speight (1991). The asphaltene fraction of the oil was precipitated by dissolving 50 g of crude oil in 4 L of hexane at room temperature (20°C–22°C). The precipitated asphaltene was collected by filtration and was washed with additional hexane to remove any saturates, aromatics, or resins trapped with the solid during filtration. The asphaltene fraction was dissolved in 25 mL of DCM (final concentration, 160 g/L) and was stored in a glass reagent bottle in a refrigerator for later use. The volume of the asphaltene-free solution was reduced to about 200 mL by rotary evaporation under vacuum in a 60°C water bath. Approximately 100 mL of the concentrated solution (containing <30 g of asphaltene-free oil) was separated into three additional fractions by chromatography on a column packed with 1 kg of activated aluminum oxide (Brockmann Type I) and 100 g of anhydrous sodium sulfate. The column was packed with slurry of aluminum oxide in hexane followed by a layer of sodium sulfate, which was also added as slurry in hexane. Care was taken to ensure uniform distribution of the column packing material throughout the cross-sectional area of the column. The saturate, aromatic, and the resin fractions were collected by sequentially eluting the column with 1.5 L of hexane, 10 L of DCM, and 10 L of methanol, respectively. Complete elution of the saturate fraction was verified by monitoring the difference in light refraction as the eluate mixed with hexane in the collection flask. The blue-green fluorescence that results when aromatic hydrocarbons are illuminated with long-wavelength (365 nm) UV light was monitored to ensure complete elution of this fraction. Elution of the resin fraction was monitored using the orange color of the eluate. Each fraction was concentrated by rotary evaporation, and the residues that were obtained were measured gravimetrically. The residues were separately dissolved in 25 mL of DCM to give final concentrations of 240 g/L, 380 g/L, and 63 g/L for the saturates, aromatics, and resins fractions, respectively. The concentrated fractions were stored in glass reagent bottles in a refrigerator. Note that a mass balance could not be performed to evaluate the recovery efficiency of the fractionation procedure because some components were irreversibly bound to the aluminum oxide, and volatile components may have been lost when the solvents used to elute the saturates, aromatics, and resins fractions were evaporated.
Experimental design
Fourteen different oil compositions were prepared for each base oil by combining the weathered crude oil with varying proportions of each of the four SARA fractions that were isolated from Lloyd crude oil (Table 2). The compositions were selected to maximize the variation within the typical concentration ranges that are observed for each SARA fraction. The lower and upper concentration limits for the saturate, aromatic, resin, and asphaltene fractions were 30%–45%, 30%–45%, 5%–15%, and 5%–10%, respectively. Although this experimental design is superficially similar to a 24 factorial design, it is constrained by the requirement that the sum of the four fractions must equal 100%. Because the four factors cannot be varied independently of each other, McLean and Anderson's algorithm was used to determine the coordinates of the extreme vertices for the design (Cornell, 2002). The extreme vertices defined the limits of the experimental space and consisted of seven oil compositions for which at least three of the four components were present at either their maximum or minimum concentrations (Fig. 1). The compositions for the extreme vertices were obtained by constructing a 23 factorial design with the high and low levels for three of the four components set at the limits of their practical ranges. The concentration of the fourth component was determined based on the constraint that the sum of the four components must equal 100%. The process was then repeated three more times until four unique 23 designs had been generated. The seven compositions that included concentrations of all four components within the previously defined practical ranges were used. Six additional unique oil compositions—referred to as “face centroids” in this work—were produced by averaging the factor levels for the vertices that defined a unique face of the convex polyhedron that described the experimental space (Fig. 1). Finally, the oil composition that represented the overall centroid of the polyhedron was obtained by averaging the factor levels of all seven extreme vertices. A total of 42 independent DE experiments were conducted for each base oil by testing each of the 14 oil compositions in three independent experiments (14 compositions × 3 tests/composition). The order of the tests was randomized to preclude confounding of systematic (e.g., temporal) effects with treatment effects.

Polyhedral experimental space representing the experimental design of this study. The tetrahedron represents all possible combinations of relative saturates, aromatics, resins, and asphaltenes concentrations, with the vertices representing pure saturate, aromatic, resin, and asphaltene fractions. Blow-up image of the polyhedron represents the actual experimental space. The 14 oil compositions that were tested are indicated by 7 vertices (circles), 6 face centroids (squares), and 1 overall centroid (not shown). Numbers correspond to the oil compositions listed in Table 2.
Sa, Ar, Re, and As indicate saturates, aromatics, resins, and asphaltenes, respectively.
Samples were prepared using 37%-weathered Arabian Light and SARA fractions isolated from Lloyd crude oil.
±One standard deviation of three independent measurements.
DE, dispersion effectiveness; DMV, diameter of mean volume; SARA, saturates, aromatics, resins, and asphaltenes.
Mixing system
Dispersion experiments were conducted using a baffled-flask mixing system (Sorial et al., 2004a, b). The baffled flasks were modified 150 mL trypsinizing flasks with four glass baffles (Wheaton Science Products, Millville, NJ). Modification involved installing a stopcock near the bottom to enable collection of samples without disturbing the surface oil. The contents of the flasks were mixed by rotating on an orbital shaker (Lab-Line Instruments, Melrose Park, IL) (orbital diameter=19 mm) at a rotational speed of 150 rpm. The average energy dissipation rate corresponding to this speed was estimated to be 0.016 J/kg-s (Kaku et al., 2006). This energy dissipation rate is similar to what could be observed in the surface layer of the open ocean (NRC, 2005).
Dispersion effectiveness tests
One hundred twenty milliliters of filtered artificial sea water was placed in a baffled flask, and 0.1 mL of oil was added to the water surface. The oil samples were thoroughly homogenized by repeatedly drawing them into a Repeater pipette (Eppendorf, Westbury, NY) and dispensing back into the vial before they were added to a baffled flask. The floating oil was dispersed by adding 4 μL of Corexit 9500 and mixing for 45 min on an orbital shaker at 150 rpm. Preliminary results showed that dispersion of all 14 oil-dispersant combinations used in this research reached steady state within 45 min of mixing. At the end of the mixing period, 3 mL of the resulting suspension of oil in water was drained through the stopcock and discarded. A 50 mL sample was then collected in a clean 100 mL beaker, and the concentration of dispersed oil and size distribution of the dispersed oil droplets were determined using the analytical methods described below. Dispersed oil was undetectable when tests were conducted in the absence of dispersant.
Analytical methods
The mass concentration of dispersed oil was determined gravimetrically after extraction into DCM (Mukherjee and Wrenn, 2009a). The oil was extracted from 30 mL of artificial seawater in a 125 mL separatory funnel using three 5 mL portions of DCM. The extracts were pooled, dried by passing through a bed of anhydrous sodium sulfate, and collected in a clean beaker. The sodium sulfate was rinsed with additional DCM to recover any trapped oil. The solvent was evaporated from the pooled extracts under a stream of nitrogen, and the vial was placed in a desiccator for 24 h. The mass of residual oil was determined using an AE200 analytical balance (Mettler-Toledo, Columbus, OH). The average coefficient of variance for this gravimetric method was about 8%.
The size distribution and number concentration of oil droplets dispersed in the aqueous phase (i.e., droplets/mL) was estimated using an optical particle counter (OPC) (Particle Measuring Systems, Boulder, CO). Using a micropipette with disposable tips cut to create an opening of at least 2 mm, 500 μL of the sample was transferred in to a clean 100 mL volumetric flask and diluted with ultra-pure DI water. The dilution ratio was varied as needed to ensure that the number concentration of oil droplets was <10,000 mL−1. Dilution did not affect the size distribution of the dispersed oil droplets (Mukherjee and Wrenn, 2009a). The OPC consisted of an LS-200 sample module and a Liquilaz E20P detector (Particle Measuring Systems), which uses a 12 mW laser diode (λ=785 nm). The droplet-size distribution was determined by measuring the number concentration of oil droplets in 15 adjustable channels between 2 and 125 μm.
Dispersion effectiveness and droplet-size distribution
The DE is the fraction of the initial mass of floating oil that was transferred to the aqueous phase as droplets and is defined as follows:
where Moil,aq and Voil,aq are the mass and volume, respectively, of oil dispersed into the aqueous phase; Moil,tot and Voil,tot are the mass and volume, respectively, of oil added to the baffled flask at the beginning of the experiment; and ρoil is the density of the oil.
The characteristics of droplets formed by oils with different composition were compared using the diameters of mean volume (DMV) of the droplet-size distributions. The DMV is defined as follows:
where Ni is the number concentration of droplets in channel (or bin) i (droplets/mL),
Statistical analysis
The effects of composition on oil dispersion by Corexit 9500 were investigated by fitting the generalized linear model (GLM) shown in Equation 3.
This model includes the main effects of the individual SARA components (Xi) and the two-factor interactions (XiXj) between components, where X1, X2, X3, and X4 are the concentrations of the saturate, aromatic, resin, and asphaltene fractions in each of the oil compositions that were tested. The response variable, Y, that was considered included the DE and the DMV of the droplet-size distribution.
The coefficients of the model, ai and aij (the main effects and two-factor interactions, respectively), were estimated by stepwise linear regression. Forward stepwise regression uses a partial F test to identify the variable with the highest correlation with the dependent variable and adds that variable to the model. At each subsequent step, the partial-F values for the remaining variables are determined and compared to a predefined critical value (p=0.05). The variable with the largest partial-F value greater than the critical value is added to the model, and the process is repeated until the largest partial-F value for the remaining variables is less than the critical value. When this occurs, the analysis is terminated (Draper and Smith, 1998). Backward regression, which is an alternative stepwise approach to parameter estimation for GLMs, starts with the complete model and removes factors at each step. Forward regression was used in this study because it is preferred when the number of model parameters is large relative to the number of treatments.
A limited sensitivity analysis was performed to determine whether the statistically significant parameters that were identified were likely to have resulted from spurious correlation (i.e., due to the specific combination of response variables that were measured in this study rather than to any other combination of responses that would have given statistically indistinguishable mean values). The sensitivity of the model to the specific mean response values that were observed in this study was evaluated by generating 10 sets of alternative responses and determining the frequency with which the same factors and interactions were included in the final model. This was done by generating 10 populations of normally distributed random errors with a mean of zero and a variance equal to that measured for the original data set (total of 420 errors; 10 errors/replicate×3 replicates/treatment×14 treatments). The errors were added to the measured response for each oil composition, and the 10 unique data sets that were obtained were analyzed by forward regression. For each significant factor, values of coefficients obtained from the analysis of the ten unique data sets were pooled to obtain the average and its 95% confidence interval. The coefficient of a factor was considered to be zero if that factor did not appear in a model for one or more of the data sets. Note that the number of alternative responses that were investigated in this analysis was too small to be definitive. Instead, the purpose was to eliminate those effects or interactions that were likely to be spurious. The accuracy of the conclusions from the sensitivity analysis depends on the validity of the assumption of normally distributed errors. Because the error in each of the response variables is likely to have contributions from several sources (e.g., setup of independent replicate experiments, dispersion process, sampling, and analysis), however, the overall experimental error should approximate normality in this study (Box et al., 1978).
Results and Discussion
Dispersion effectiveness
The DE observed for oil samples produced using Arabian Light as the base oil is given in Table 2. Because four main effects and six two-way interactions were tested with only 14 treatments (Table 2), forward stepwise linear regression was used to evaluate the statistical significance of the coefficients of the GLM (Eq. 3). The concentration of the aromatics fraction exerted a statistically significant effect (p<0.05) on DE, and the two-factor interactions between the concentrations of saturates and aromatics and saturates and resins were also statistically significant (Table 3). Although this model explains 98% of the total variation that was observed in DE (Fig. 2A), the correlation between the residuals and the measured DE (Fig. 2B) suggests that some important factors have not been identified.
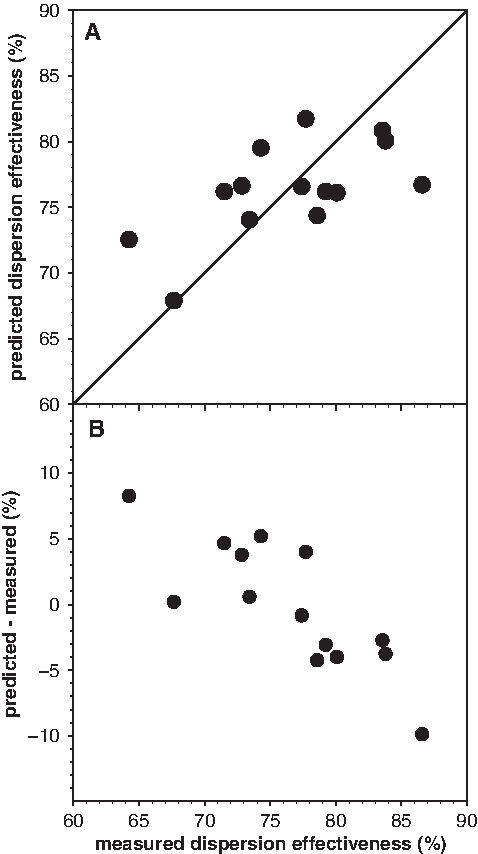
Fit of the generalized linear model for dispersion effectiveness using model coefficients shown in Table 3:
p-Value is the probability that the coefficient is zero.
The average of GLM coefficients (±the 95% confidence interval) over all runs of the sensitivity analysis; the coefficients were assumed to be zero for any factor not identified as being statistically significant in a given run.
Percentage of times a factor was found to be statistically significant in sensitivity analysis.
GLM, generalized linear model.
A limited sensitivity analysis was performed to determine whether the significant effects and interactions that were identified were likely to be due to spurious correlation that depended on the specific combination of DE values that were measured. This was accomplished by generating 10 families of random errors for each replicate and adding the errors to the observed DE. The forward stepwise regression analysis was repeated for each data set that was produced, and the coefficients for each significant main effect or interaction were determined. The same main effects and interactions were not identified as being statistically significant for all 10 data sets, but the main effect of the aromatics fraction was significant in all 10 cases, and the two-way interaction between saturates and resins was significant in 70% of the cases. Like the original GLM, the aromatics fraction and the saturates–resins interaction positively affected DE (i.e., DE increased as the concentration of the aromatics fraction—or the product of the concentrations of the saturates and resins fractions—increased), and the average values of their coefficients were significantly different from zero at the 95% confidence level (Table 3). The saturates–aromatics interaction, on the other hand, was very sensitive to changes in DE within the range of measurement uncertainty. Therefore, it may not represent a real compositional effect on DE.
The positive effect of the aromatics fraction on DE is consistent with the results of some previous studies of the effects of oil composition on DE (Blondina et al., 1999; Fingas et al., 2003). In one study, however, the correlation between effectiveness and polycyclic aromatic hydrocarbon (PAH) concentration was strongly positive when oil was dispersed with Corexit 9527 and negative or very weakly positive (depending on salinity) when it was dispersed with Corexit 9500 (Blondina et al., 1999). Since these dispersants differ only in the solvent used to dissolve the surfactants (Georges-Ares and Clark, 2000), these correlations may have been spurious. Another study observed a positive correlation between the performance of Corexit 9500 and the sum of the concentrations of major PAHs as measured by gas chromatography (Fingas et al., 2003). These investigators also observed a positive correlation between DE and the sum of the concentrations of n-alkanes with chain lengths of 12 to 18 carbon atoms. When the composition was measured using an analytical method that separates the oil into four SARA fractions similar to those used in this study, the concentration of the saturates fraction was positively correlated with the performance of Corexit 9500, but the concentrations of the aromatics, resins, and asphaltenes fractions were negatively correlated (Fingas et al., 2003). Canevari et al. (2001), on the other hand, observed a negative effect of the saturates fraction on dispersibility of 14 heavy fuel oils by Corexit 9500 but could not discern effects due to the aromatics, resins, or polars (asphaltenes) fractions.
None of the previous studies evaluated interactions between fractions, but the positive interaction that was observed between the saturates and resins fractions in this study indicates that the effect of one factor varied with the level of the second. That is, the positive effects of the resins and saturates fractions were only observed when both compounds were present at high concentrations. Alone, neither fraction exerted discernible effects on dispersant performance. The basis of this interaction is not clear, but resins are relatively high-molecular-weight (700–1,500 g/mole) polar compounds that may accumulate at the oil–water interface and reduce the interfacial tension (Speight, 1991; Clayton et al., 1993). Unlike the surfactants in Corexit 9500, resins are strongly lipophilic, and on their own, they would tend to promote the formation of water-in-oil emulsions (Clayton et al., 1993; Fingas and Fieldhouse, 2003). Hydrophilic and lipophilic surfactants can interact to promote and stabilize the oil-in-water emulsions that are the desired outcome of chemical dispersion (Myers, 2006). Therefore, high concentrations of the saturates fraction may enhance dispersion of the oil as small droplets in water by facilitating the formation of favorable associations between the lipophilic surfactants of the resins fraction and the hydrophilic surfactants of the dispersant.
The oil samples that were produced using weathered Mars as the base oil were extremely viscous, and <10% of the added oil was dispersed, which was too little to observe effects due to chemical composition. The viscosity of the Mars-based oils was not measured, but flow characteristics observed during setup of dispersion experiments suggest that they were more viscous than the weathered Lloyd that was used as the source of the SARA fractions, which had a viscosity of 8.5 Pa-s (8,500 cP). Although viscosity is not a good predictor of dispersibility, poor dispersion is consistently observed for oils more viscous than about 20 to 30 Pa-s (Fiocco et al., 1999; Canevari et al., 2001; Fingas et al., 2003). Highly viscous oils are more difficult to disperse because the dispersant cannot penetrate into the oil phase effectively, and the surfactants migrate to the oil–water interface very slowly (Clayton et al., 1993). Viscosity also affects the average size of droplets that are produced (Coulaloglou and Tavlarides, 1977; Aravamudan et al., 1981; Li and Garrett, 1998; NRC, 2005; Mukherjee and Wrenn, submitted), and large droplets are more likely to float and coalesce at the surface.
Size distributions
All of the size distributions obtained in this investigation were multimodal, with three major droplet-size modes: small (<7 μm), medium (7–20 μm), and large (>20 μm). Similar multimodal size distributions have been observed in previous dispersion studies in which mixing occurred in baffled flasks (Mukherjee and Wrenn, 2007, 2009b, 2011). Figure 3 shows representative droplet-size distributions observed during the course of these experiments. Sample 10 (high saturate concentration, intermediate concentrations of aromatics, resins, and asphaltenes) had prominent small- and medium-sized droplet modes, whereas the largest size class existed only as a shoulder on the medium-sized droplet mode (Fig. 3B). In sample 5 (low concentration of saturates, and high concentrations of aromatics, resins, and asphaltenes), the area under the small droplet-size mode was negligible compared to the two larger size modes (Fig. 3A). Significant overlap between the medium and large droplet-size modes made the distribution appear to be nearly bimodal for this sample. In sample 14 (intermediate concentrations of all four fractions), all three modes were prominent but the medium and the large-sized droplets were dominant (Fig. 3C).
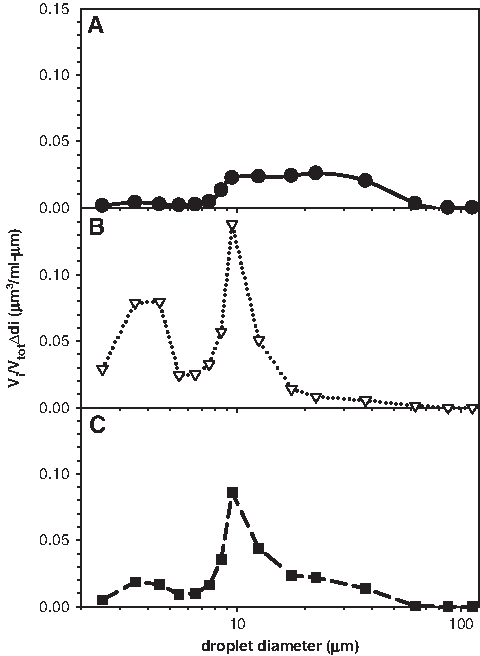
Effect of oil composition on normalized volume distribution for three representative cases:
The DMVs estimated for the small, medium, and the large droplet-size modes were relatively insensitive to changes in the oil composition over the range tested. The average DMV for the small-, medium-, and large-sized droplet modes were 3.6±0.1, 11.0±0.5, and 30.8±1.1 μm, respectively. The low coefficients of variance (<5%) indicate that the droplet-size modes were essentially independent of composition. Oil composition did, however, affect the relative amount of oil present in each size class (Fig. 4). For the compositions tested in this study, the largest fraction of dispersed oil was entrained as either medium or large droplets. Forward stepwise linear regression was used to evaluate the effects of oil composition on the volume fraction of oil in each droplet size class, and the significant main effects and two-factor interactions identified for each size class are shown in Table 4. The concentration of the saturates fraction and the aromatics–asphaltenes interaction significantly affected the amount of oil that was entrained as small and medium-sized droplets (p<0.05). Although no significant main effects were identified as being important in determining the amount of oil that was present in the large droplet-size mode, four statistically significant two-way interactions were identified (p<0.05).
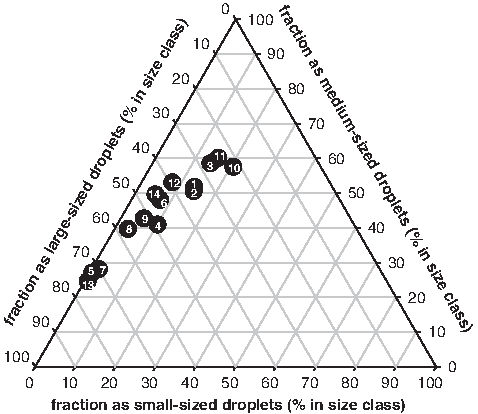
Ternary plot of the distribution of dispersed oil among small, medium, and large droplet-size modes for 14 oil samples of differing composition prepared using Arabian Light as the base oil. The fraction of the oil entrained in different droplet-size modes was normalized by the amount of oil that was dispersed. Numbers correspond to the oil compositions listed in Table 2.
p-Value is the probability that the coefficient is zero.
The average of GLM coefficients (±the 95% confidence interval) over all runs of the sensitivity analysis; the coefficients were assumed to be zero for any factor not identified as being statistically significant in a given run.
Percentage of times a factor was found to be statistically significant in sensitivity analysis.
The sensitivity analysis confirmed that the concentration the saturates fraction exerted a statistically significant positive effect on the amount of oil present as small and medium-sized droplets: the effect of the saturates fraction was identified as being statistically significant in all ten test cases, and the model coefficient was significantly different from zero at the 95% confidence level. The aromatics–asphaltenes interaction exerted a significant negative effect on the relative abundance of small- and medium-sized droplets in 70% and 40% of the cases, respectively, and the model coefficients were significantly different from zero for both droplet-size modes (Table 4). This suggests that the aromatics–asphaltenes interaction was not particularly sensitive to the specific values measured in this study and, therefore, is probably real, but this conclusion is stronger for the small droplet-size mode than for the medium size mode. None of the interactions were consistently identified as exerting significant effects on the fraction of oil dispersed as large droplets, but the model coefficient for the aromatics–asphaltenes interaction was significantly different from zero at the 95% confidence level (Table 4). Although it was sensitive to the specific combination of values observed in this study, the positive effect of the aromatics–asphaltenes interaction on large droplets is consistent with its negative effects on small and medium-sized droplets. Overall, these results suggest that high concentrations of the saturates fraction promoted the formation of smaller droplets, but when the concentrations of the aromatics and asphaltenes fractions were both high, formation of small droplets may have been inhibited.
Because oil composition affected the amount of oil that was entrained in different droplet size classes, it also affected the overall DMV of the droplet-size distributions. The average overall DMV for the oil mixtures that were tested in this study are shown in Table 2. Sample 5, which had a low percentage of saturates and high concentrations of aromatics, resin, and asphaltenes, had the largest DMV (14.0±1.9 μm). In contrast, sample 10, which had a high concentration of saturates and intermediate concentrations of aromatics, resins, and asphaltenes, had the smallest DMV (5.8±0.5 μm).
Forward stepwise linear regression was used to evaluate the effects of oil composition on the overall DMV (Table 5). No significant main effects were observed, but three significant two-way interactions were identified. These interactions provided a reasonable description of the measured DMV (Fig. 5). The aromatics–asphaltenes and saturates–resins interactions both exerted positive effects on the DMV (i.e., DMV tended to increase as the product of the concentrations increased). The aromatics–asphaltenes interaction appeared as a significant term in 100% of the data sets tested in the sensitivity analysis, and the average coefficient for this interaction was significantly different from zero at the 95% confidence level. The saturates–resins interaction, on the other hand, was identified as being significant in only 50% of the cases tested during the sensitivity analysis, and the average coefficient was statistically indistinguishable from zero (Table 5), suggesting that it occurred as a significant term in the GLM due to chance and not due to its real effect on droplet formation. The negative interaction between the concentrations of the saturates and asphaltenes fractions (i.e., the DMV tended to decrease as the product of these concentrations increased) was significant in 90% of the cases, and the average coefficient for this interaction was significantly different from zero (p<0.05).
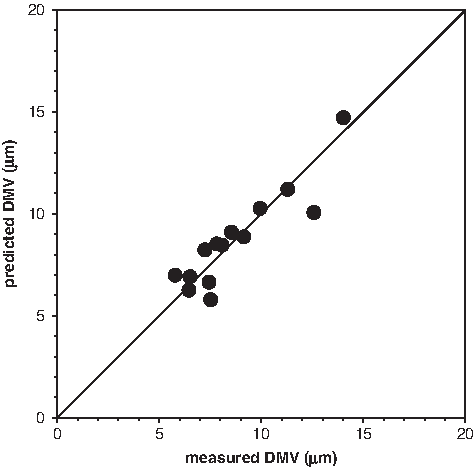
Fit of the generalized linear model for overall diameter of mean volume. The model coefficients are given in Table 5. DMV, diameter of mean volume.
p-Value is the probability that the coefficient is zero.
The average of the coefficients (±the 95% confidence interval) over all runs of the sensitivity analysis; the coefficients were assumed to be zero for any factor not identified as being statistically significant in a given run.
Percentage of times a factor was found to be statistically significant in sensitivity analysis.
Multiple droplet-size modes suggest the involvement of several droplet formation mechanisms in this mixing system. For example, relatively large droplets may have been sheared from the floating oil slick during the initial droplet formation event, and the smaller droplets may have resulted from subsequent breakage of the initial droplets by processes occurring in the water column (Tsouris and Tavlarides, 1994). This may suggest that the amount of oil present in the each size class was determined by the rate at which the large droplets broke into smaller droplets, whereas DE may have been determined by the rate at which larger droplets were sheared away from the floating oil.
Conclusions
The effects of oil composition on the chemical dispersion of crude oils were investigated in a baffled-flask mixing system at an energy dissipation rate similar to that encountered in the surface layer of the ocean in the absence of breaking waves. Forward regression analysis with a GLM showed that the concentration of the aromatics fraction exerted a statistically significant (p<0.05) positive effect on DE (i.e., more oil was dispersed into the aqueous phase in oil samples with higher concentrations of the aromatics fraction). The saturates and resins fractions interacted to also promote dispersion. In addition to its effect on DE, oil composition affected the size distribution of dispersed oil droplets, which contained three distinct modes. The composition affected the distribution of oil among the three modes: high concentrations of the saturates fraction promoted entrainment of the oil as small- and medium-sized droplets, whereas the concentrations of the aromatics and asphaltenes fractions interacted to reduce the amount of oil in these droplet size classes relative to the amount dispersed as large droplets. The positive effect of the aromatics–asphaltenes interaction on the overall DMV of the droplet-size distributions is consistent with its effect on the distribution of oil among the different size modes. A significant saturates–asphaltenes interaction, which reduced the overall DMV of the dispersed oil droplets, was also observed, suggesting that the asphaltenes fraction was less effective in preventing droplet breakage when the concentration of the saturates fraction was high.
The results of this study provide important insights into the effects of oil composition on DE and the formation of dispersed oil droplets. The manipulative experimental approach that was taken in this study avoids many of the potentially confounding factors that exist when a purely observational approach is used (e.g., measuring DE for a variety of different oils). More thorough characterization of the oil fractions and better control of the final viscosity of the oil samples that are used in DE testing would eliminate some of the major sources of uncertainty in future studies.
Footnotes
Acknowledgments
The authors would like to thank Larry Heugatter (Conoco Philips) for providing the crude oils used in the research, and Pratim Biswas (Washington University) for providing access to the OPC. The Department of Energy, Environmental, and Chemical Engineering provided financial support to B.M. during this research.
Author Disclosure Statement
No competing financial interests exist.