
Abstract
Abstract
This article presents results on the synthesis, characterization, and application of ferrites encapsulated by titanium dioxide as a catalyst for the photodegradation of azo dyes and color removal of textile effluents. X-ray diffraction and scanning electron microscopy (SEM)/energy dispersive systems (EDS) results showed that encapsulation was effective, yielding a nanocomposite with a magnetic core and photoactive surface. Photocatalytic tests carried out with azo dye blue HFRL and with textile effluents showed that in the presence of encapsulated ferrites, color removal was enhanced with both low- and high-energy lamps. Photocatalysis of textile effluent led to the removal of anionic surfactants but did not result in chemical oxygen demand removal; nevertheless, it enhanced the aerobic biodegradability of the textile effluent, mainly when ultraviolet light was used. Mass spectrometry data showed that chemical profiles of intermediates accumulated in solution after photocatalysis depended on the type of radiation used, corroborating the biodegradability tests.
Introduction
One option for the treatment of high-colored effluents relies on the use of advanced oxidative processes (Moraes et al., 2000). Such processes involve the generation of highly oxidative species, mainly the hydroxyl radical, which are not selective and able to degrade a variety of organic compounds, including the dyes used in textile industries. Hydroxyl radicals can be generated by different processes, but one considered cost-effective process employs ultraviolet (UV) radiation in combination with semiconductors or photocatalysts. Although many semiconductors have the ability of generating hydroxyl radicals, it is consensus that the use of titanium dioxide (TiO2), especially in the anatase form, yields higher removal efficiencies (Gregg, 2005; Hagfeldt and Gratzel, 1995; Hofmann et al., 1995; Trentler et al., 1999). In addition, experimental and theoretical studies have demonstrated the convenience of TiO2 synthesis in the nanometric scale as a mechanism of stabilizing the phase of interest (e.g., anatase) in relation to other polymorphs (e.g., rutile), thereby producing a more efficient catalyst (Barnard and Curtiss, 2005; Ribeiro et al., 2007; Ronconi et al., 2008). Different researchers have demonstrated the use of TiO2 for the degradation of dyes used in the textile industry (Qu et al., 1998; Zhao et al., 1998) and for color and organic material removal from real wastewaters (Rincon and Pulgarin, 2005).
Many studies have reported the use of disperse TiO2, which requires a solid–liquid separation for recovering the photocatalyst. As the photodegradation of organic molecules might be accomplished with the adsorption of the molecule onto the semiconductor, there is always a possibility of such phenomena leading to stabilization of the catalyst suspension by electrosteric effect (Sato and Ruch, 1980; Napper, 1983). This would hamper the sedimentation of catalyst nanoparticles, making it difficult to recover them from the treated wastewater. Experimental studies have indeed reported difficulties associated with the separation of nanometric scale particles from the aqueous phase and the reuse of nanocatalyst (Senna, 2004).
One way of destabilizing the colloidal suspension of catalyst is to associate the nanoparticles of interest (e.g., TiO2-anatase) with a solid phase having a magnetic activity (e.g., Fe3O4-magnetite) so that the nanocomposite can be removed from the water phase by a magnetic trap, such as a settler enhanced by a magnetic field. Therefore, the main objective of this article was to present results on the synthesis, characterization, and application of magnetic ferrites encapsulated by TiO2 as a catalyst for the photodegradation of azo dyes and color removal of textile effluents.
Materials and Methods
Synthesis and characterization of ferrites encapsulated by TiO2
Magnetic ferrites of CoFe2O4 of different sizes (10–100 nm) were synthesized according to the polymeric precursor method (Kakihana and Yoshimura, 1999; Ronconi et al., 2008). Two solutions were prepared: solution A having 0.3 M citric acid and 0.1 M ferric chloride, and solution B having 0.3 M citric acid and 0.1 M cobalt chloride. The citrates were then analyzed gravimetrically to quantify the complexed metals and check whether the stoichiometric proportion of 2:1 (Fe3+ to Co2+) was being held to obtain the desired ferrite (CoFe2O4). After the citrates were mixed, ethylene glycol was added in a proportion of 2:1 (ethylene glycol to citric acid) under constant mixing at 50°C for a few minutes. After this esterification process, the obtained solution was calcinated at 450°C for 2 h to crystallize the material. The resulting crystals were then characterized by X-ray diffraction (XRD) to check the phases obtained.
In parallel to the synthesis of CoFe2O4, a titanium resin containing 0.1 M of TiO2 was prepared according to the following procedure: first, 39.71 g of citric acid was dissolved in 500 mL distilled water at 70°C and then 18.8 mL of titanium isopropoxide was added to the solution. Next, 26.5 g of ethylene glycol was added to yield a mass proportion of 60:40 (citric acid to ethylene glycol)—this mixture was held at 90°C for 30 min under constant mixing. The resulting resin was properly diluted to yield a final concentration of 0.1 M TiO2.
To encapsulate the ferrite, 0.1 g of magnetically separated material (CoFe2O4) was mixed with 100 mL of TiO2 resin (0.1 M) according to a previous work, which demonstrated that this procedure optimized the encapsulation (Ronconi et al., 2008). The mixture ferrite/resin was then held with constant mixing on a heating plate until its volume was reduced by 90%. Then the resulting polymeric resin was calcinated at 450°C for 2 h for crystallization of the composite. After the synthesis and encapsulation of the ferrites, the magnetic composite was sent to XRD to verify the proportion between the anatase/rutile phases. In addition to that, analyses of scanning electronic microscopy (SEM), Raman spectroscopy, surface area, and zero charge point were also carried out as follows.
The crystal structure and phase purity of the synthesized catalysts were studied by XRD using a Shimadzu D-6000 diffractometer (DEQUI/UFOP) with a graphite monochromator and a nickel filter in the 2θ range of 5°–70° (step 0.02°), operating with Fe Kα radiation (λ = 0.19360 nm), 40 kV, and 20 mA (the results were automatically converted to Cu Kα radiation for data treatment and manipulation).
SEM images of TiO2 and CoFe2O4@TiO2 metalized with graphite were obtained in a JSM 5510/Jeol equipment of 20 kV (DEGEO/UFOP), using both secondary electron and retro scattered electron detectors. Qualitative chemical analysis of the materials surface was possible with the energy dispersive system (EDS) technique using a NORAN/Thermo equipment (DEGEO/UFOP), which allowed to verify the efficiency of the encapsulation procedure. Surface area and porosity of the synthesized catalysts were measured by the Brunauer-Emmett-Teller (BET) adsorption method in a NOVA 1000 Quantachrome equipment adsorption (DEMET/UFOP) according to detailed procedures described by Pena et al. (2008).
Point of zero charge (PCZ) of TiO2 and encapsulated ferrite were determined by the mass titration technique, as detailed by Oliveira et al. (2008). For this, six Erlenmeyer flasks containing different mass of catalyst had the pH initially adjusted to 3.0 with 0.1 M HNO3 and/or 0.1 M NaOH and were then kept under constant mixing (130 rpm) at ambient temperature for 24 h to attain equilibrium. After this period, the pH was measured and a graph relating the mass percentage of catalyst with final pH was plotted. The procedure was repeated by changing the initial pH to 6.0 and then to 12.0.
Photocatalytic tests
Both TiO2 and encapsulated ferrite (CoFe2O4@TiO2) were used in photocatalytic tests, employing the azo dye Drimaren blue HFRL as the model dye. Unfortunately, the chemical structure of the dye was not provided by the manufacturer and could not be found in the Chemical Abstracts Service; however, the safety and chemical information factsheet confirms it as an azo dye.
The photodegradation assays were carried out in completely stirred tank reactors (CSTRs) using a jar-test equipment (model 218-6 LDB; Nova Ética) under batch and continuous feeding mode. In both cases, compact bulb lamps (UV, fluorescent, or black light) were fitted in the reactors (Fig. 1) and the operation was carried out at ambient temperature (18°C–25°C), using a mixing speed of 250 rpm (G = 400 s−1). The UV lamp had a nominal potency and maximum emission wavelength of, respectively, 27 W and 253.7 nm. For the fluorescent and black light lamps, these values were 26 W (430–500 nm) and 28 W (380 nm), respectively.
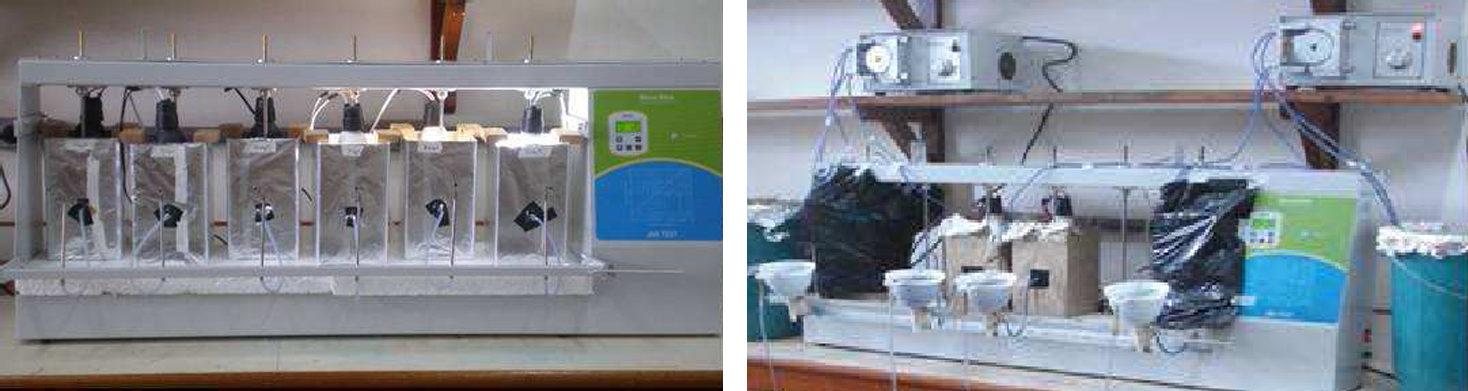
Jar test equipment adapted for the photocatalytic tests under batch (left) and continuous feeding (right).
In addition, degradation tests were also carried out with treated wastewater from a small textile industry that finishes cotton fabric and uses HFRL as one of the blue dyes. In this case, grab samples were collected at the equalization tank (raw wastewater) and at the discharging tube, that is, effluent from the secondary clarifier of the activated sludge process in operation at the industry. The samples were collected twice during the project, but the tests that compared the influence of operational parameters on color removal were made with the same effluent (raw or treated). All effluent samples were kept frozen (−10°C) in the dark until the tests and analyses were made.
For the tests carried out with the model dye, the efficiency of color removal was assessed by following the absorbance (HP 8453 spectrophotometer UV–visible system) of the solution at 611 nm after centrifuging (Fanem Excelsa 11, Model 206 BL) the sample for 10 min at 5,000 rpm for complete removal of the solid catalyst. During the batch tests, the centrifuged sample was returned to the reactor after reading its absorbance, thereby keeping constant the reactors liquid level.
For the tests with raw and treated textile wastewater, color removal was assessed by measuring the absorption over the range 190–1,100 nm using the diode array spectrophotometer mentioned earlier. In addition, the raw and treated effluents were characterized by organic matter and anionic surfactant content using the parameters chemical oxygen demand (COD) and methylene blue active substances (MBAS), respectively, as detailed in the Standard Methods for the Examination of Water and Wastewater (APHA/AWWA/WEF, 2005).
The batch tests were carried out for at least 5 h at different pH values (2, 7, and 12), adjusting the pH solution with either 1 M HCl or 1 M NaOH. The concentration of catalyst and HFRL blue was fixed at 140 and 50 mg/L, respectively (or otherwise stated, such as in the test that assessed the influence of initial dye concentration on color removal), whereas for the textile effluents the samples were used without dilution after decanting them for 1 h for removal of settleable solids.
During the continuous feeding tests, plastic funnels were adapted to the jar test equipment as settlers (Fig. 1, right) so that the settled catalyst could be recovered from the treated effluent and manually returned (twice a day) to the reactor. At the beginning, a magnet was strapped at the bottom of the funnels to enhance the sedimentation of the ferrites; however, this may not be necessary for the recovery of catalyst because the high density of the ferrites provided itself a high settling velocity, yielding its complete recovery.
The continuous feeding tests were carried out with both fluorescent and UV lamps, adopting the hydraulic retention time (HRT) of 5 or 20 h and fixing the pH of the HFRL blue solution (50 mg/L) at 7 (pH of the biologically treated textile effluent) or 12 (pH of the raw textile effluent). The effluent UV–vis absorbance was followed for at least 3× HRT, and during this time, the radiation intensity upon the solution was also measured with an optic radiometer (MP 125 UV-C), which read the irradiated potency, allowing the calculation of irradiation dose [equation (1)].
where I is the radiation intensity (mW/cm2) measured by the radiometer and t the exposure time (s) or the HRT during the continuous feeding experiments.
Mass spectrometry analysis
Samples collected at the end of the photocatalytic test carried out in continuous mode (HRT = 20 h) were centrifuged and the supernatant filtered (0.45 μm) and stored (−20°C, in the dark) for analysis in a mass spectrometer (LC-IT-TOF-MS; Shimadzu) in an attempt to correlate the degradation products with operational conditions. The samples were injected (5 μL), without any previous treatment, directly into the mass spectrometer (without any chromatography step) and the organics were ionized (4 and 3.5 kV for the positive and negative modes, respectively) by the electrospray technique. Water was used as carrier (0.2 mL/min) and the ions were scanned in the m/z range of 100–1,000 Da, setting an acquisition time of 10 ms. Each injection lasted 5 min and the resulting mass spectra were statistically treated (multivariate analyses, Excel® software) using the principal component analysis tool of the Minitab® software.
Biodegradability tests
To evaluate whether the photocatalysis could affect the aerobic biodegradability of the organics present in the textile effluent, batch aerated assays were carried out with raw and photocatalytic treated (with UV and fluorescent lamps) wastewater.
The aerobic biodegradability tests were carried out in 250-mL amber glass flasks continuously aerated by means of porous stones and aquarium pumps. The dissolved oxygen was kept from 1.5 to 2.5 mg/L throughout the experiment, and returned sludge (from the same activated sludge process where the samples were collected) were used as seed (2,250 mg/L). The food/microorganisms (F/A) ratio was kept at 0.1 and macro- and micronutrients employed in the biochemical oxygen demand test were complemented. At the beginning of the experiment, the pH was checked and adjusted to 6.8–7.2 using HCl or NaOH, both 0.1 M. Each flask contained 10 mL of sample (raw or treated effluent), 135 mL of sludge, 10 mL of macronutrients solution, 5 mL of micronutrients solution, and 40 mL of diluting water. All flasks were kept at ambient temperature and the liquid level was checked and continuously replaced with distilled water.
The aerobic biodegradability was assessed in terms of organic matter removal. For this, 5 mL samples were periodically collected and centrifuged for removal of suspended solids and the supernatant was then analyzed for COD as described earlier. The test lasted for 3 days, and in the first 12 h, samples were collected every 2 h for analysis.
Results and Discussion
Characterization of catalysts
XRD obtained for synthesized materials are shown in Fig. 2, which shows that the synthesis and encapsulation of ferrite (CoFe2O4@TiO2) did not change its phase distribution because the anatase/rutile ratio (5:1) was kept nearly the same when compared with that obtained for TiO2. The fact that the encapsulation process, which involved calcination at 450°C for 2 h, did not alter the phase composition of TiO2 allowed a direct comparison between the photocatalytic properties of modified catalyst (with magnetic properties—CoFe2O4@TiO2) and raw catalyst (TiO2) to be made.

X-ray diffraction of ferrite
The results of BET analyses of the synthesized materials (Table 1) show that the surface properties of CoFe2O4@TiO2 are very similar to that of TiO2, indicating that the morphologic characteristics of the catalyst was not changed with the encapsulating process. It can be seen that the surface area of synthesized materials are relatively high, hence favoring the adsorption of the dye molecule onto the catalyst. In addition, the results show that the encapsulated ferrites have high pore size that falls in the 20–500 Å range, thus characterizing it as mesoporous. Such intermediate pore size can facilitate the entrance and adsorption of large molecules into the catalyst, which may favor the degradation of complex organics such as the azo dyes used in textile industries.
TiO2, titanium dioxide.
The SEM results (data not shown) of encapsulated ferrites and TiO2 revealed that the morphological properties of encapsulated ferrite were similar to that observed for TiO2, indicating that the technique of encapsulation was effective. This was also confirmed by the energy dispersive system (EDS) data (Table 2), which shows that only one out of four points scanned contained Fe and Co and that the Fe content in the encapsulated ferrite surface was always low. This is another indication that the encapsulating process was effective and that, although the material could not be considered homogeneous, there was a predominance of TiO2 on the catalyst surface, which is crucial for a good catalyst performance. In addition, the use of ferrite in the photocatalytic tests did not result in the erosion of TiO2 and de-encapsulation of the ferrite because the SEM/EDS results obtained (not shown) with the nanocomposite after its use showed a predominance of titanium (Ti) and oxygen (O) onto its surface, similar to what is shown in Table 2. As expected, the SEM/EDS of TiO2, before and after its use in the photocatalytic tests (data not shown), also confirmed the predominance of Ti and O onto the material surface.
The PCZ of the synthesized materials (Fig. 3) showed that the ferrite PCZ was 6.25, indicating that at pH lower than this value the magnetic catalyst would have positive surface charge, having, on the other hand, negative charge at higher pH. The measured value is pretty close to that (6.3) regarded by Arslan et al. (2000) and Moraes et al. (2000) as being the PCZ of TiO2. For the synthesized TiO2, the PCZ could not be precisely measured because the titrimetric data did not converge. Nevertheless, extrapolation of the data showed that the PCZ value would be around 6.0, which is very close to that measured for the encapsulated ferrite, confirming that the TiO2 properties were not significantly changed during the encapsulating process.

Zero point of charge (ZPC) measured for encapsulated ferrite
The characterization results presented above showed that encapsulation of ferrites was satisfactory and did not change the main properties (morphology, phase distribution, surface characteristics) of TiO2. The results presented before confirmed that a nanocomposite with magnetic core and photocatalytic surface was obtained during the synthesis process, whereas the results that follow show its photocatalytic effectiveness.
Photocatalytic tests in batch mode
Figure 4 shows that the degradation of azo dye blue HFRL was only effective using the UV lamp and that a higher degradation rate was observed during the first 2 h of contact at higher pH. The beneficial effects of the encapsulated ferrites was only marginal with the use of high-energy light (UV lamp), because the removal efficiency increased from 50% to 60% in the first 2 h of contact and from 80% to 90% after 5 h at pH 2. As a higher removal efficiency (∼80%), after 2 h of contact, was obtained at pH 12, when compared with the other values studied (∼60% at pH 2 and ∼30% at pH 7), the basic conditions were considered optima for azo dye photocatalysis, agreeing with the findings of Guillard et al. (2003) and Zielińska et al. (2003). Although significant color removal also occurred at pH 2, it is known that acidic conditions favor the adsorption of dye onto the catalyst (Guillard et al., 2003; Garcia et al., 2007).
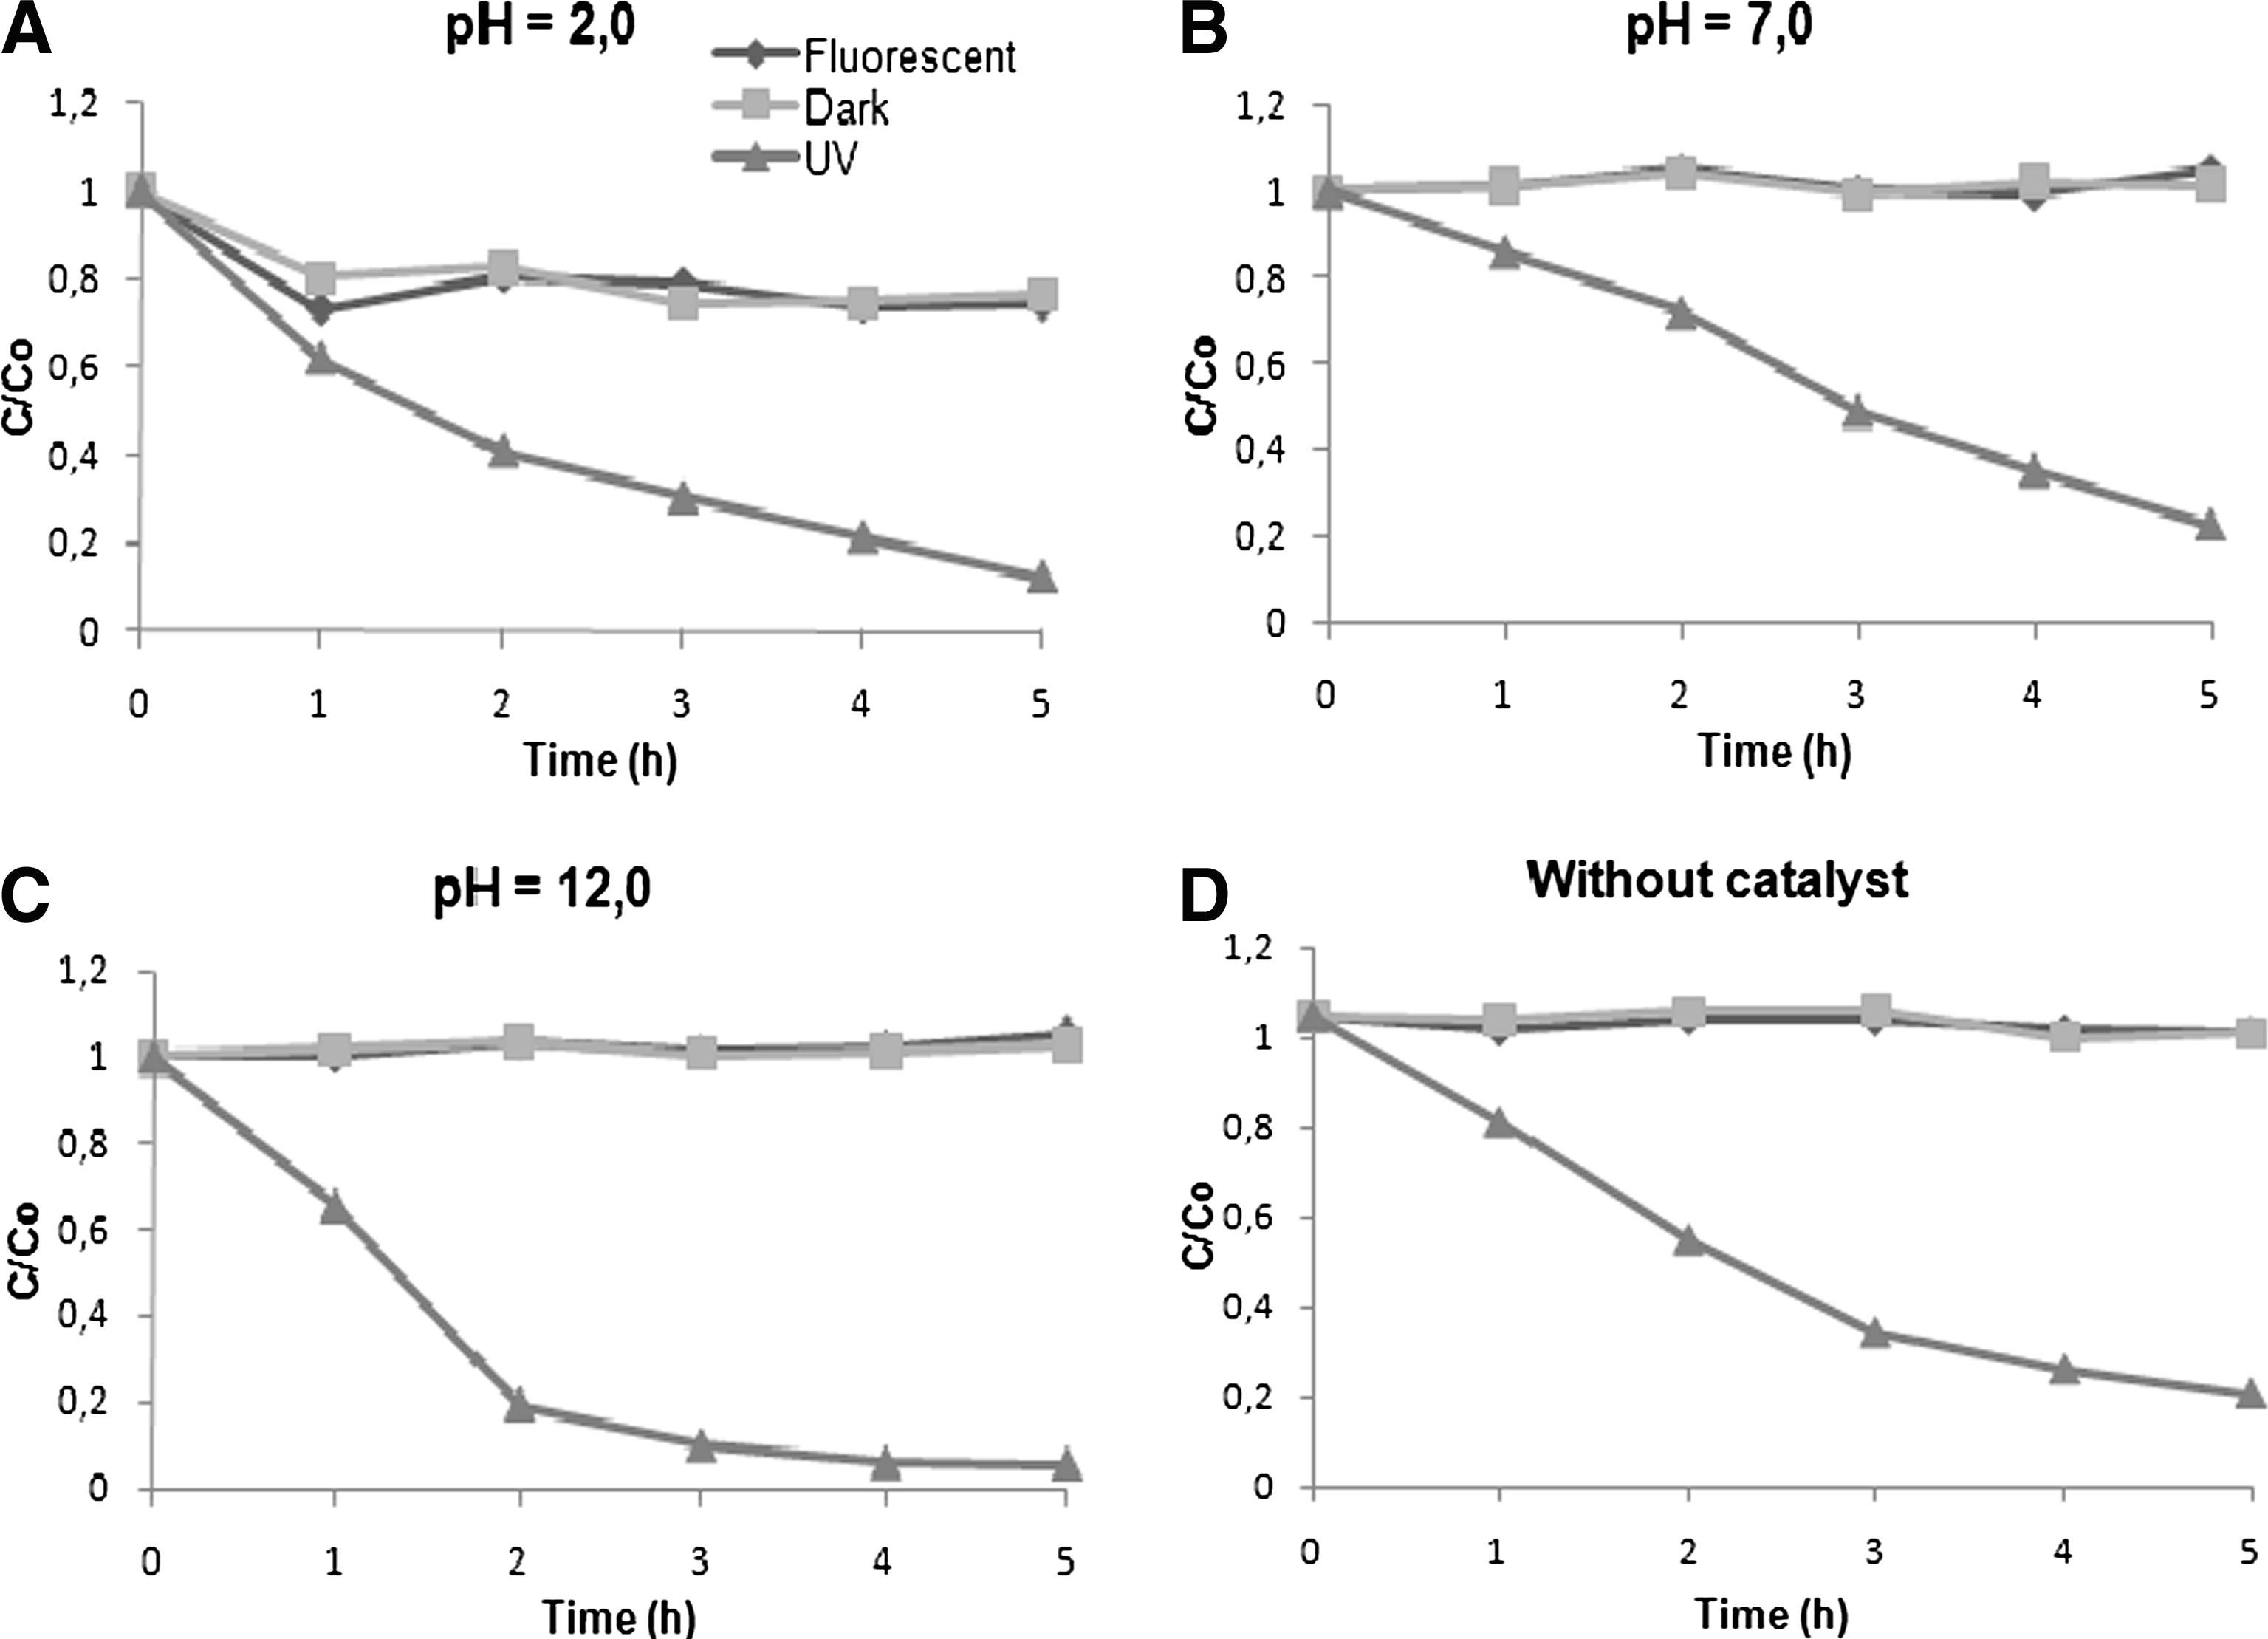
HFRL blue degradation with encapsulated ferrites using different lamp types and pH values,
When fluorescent and black lamps were used, color removal was negligible at pH 7 or 12 but increased to 20% at pH 2 in the presence of the encapsulated ferrite (CoFe2O4@TiO2). In the absence of catalyst, no dye removal was observed (graph D) with low-energy lamps. The results presented in Fig. 4 indicate that the azo dye blue HFRL is more recalcitrant than the model dye methylene blue, because experimental data presented by Lacerda (2010) show that an increase in color removal from ∼20% to ∼100% and from ∼6% to ∼80% could be obtained with fluorescent and black lamps, respectively, after 5 h of contact (CSTR, batch mode), using 10 mg/L methylene blue and 140 mg/L of encapsulated ferrite.
Table 3 shows that the photocatalysis of the azo dye blue HFRL under UV light with the encapsulated ferrites followed first-order kinetics with an average K value in the range of those reported by Guillard et al. (2003) and Sahoo et al. (2005). The increase in the initial dye concentration increased, as expected, the half life time when the fluorescent and black lamps were used, but had little influence under UV radiation (Fig. 5). These results confirm that under UV lamp the degradation is quick and little affected by other variables. This may happen due to the relatively high UV dose provided by the UV lamp (17.6–23.1 mJ/cm2) compared with the fluorescent and black lamps (0.4–0.9 mJ/cm2).
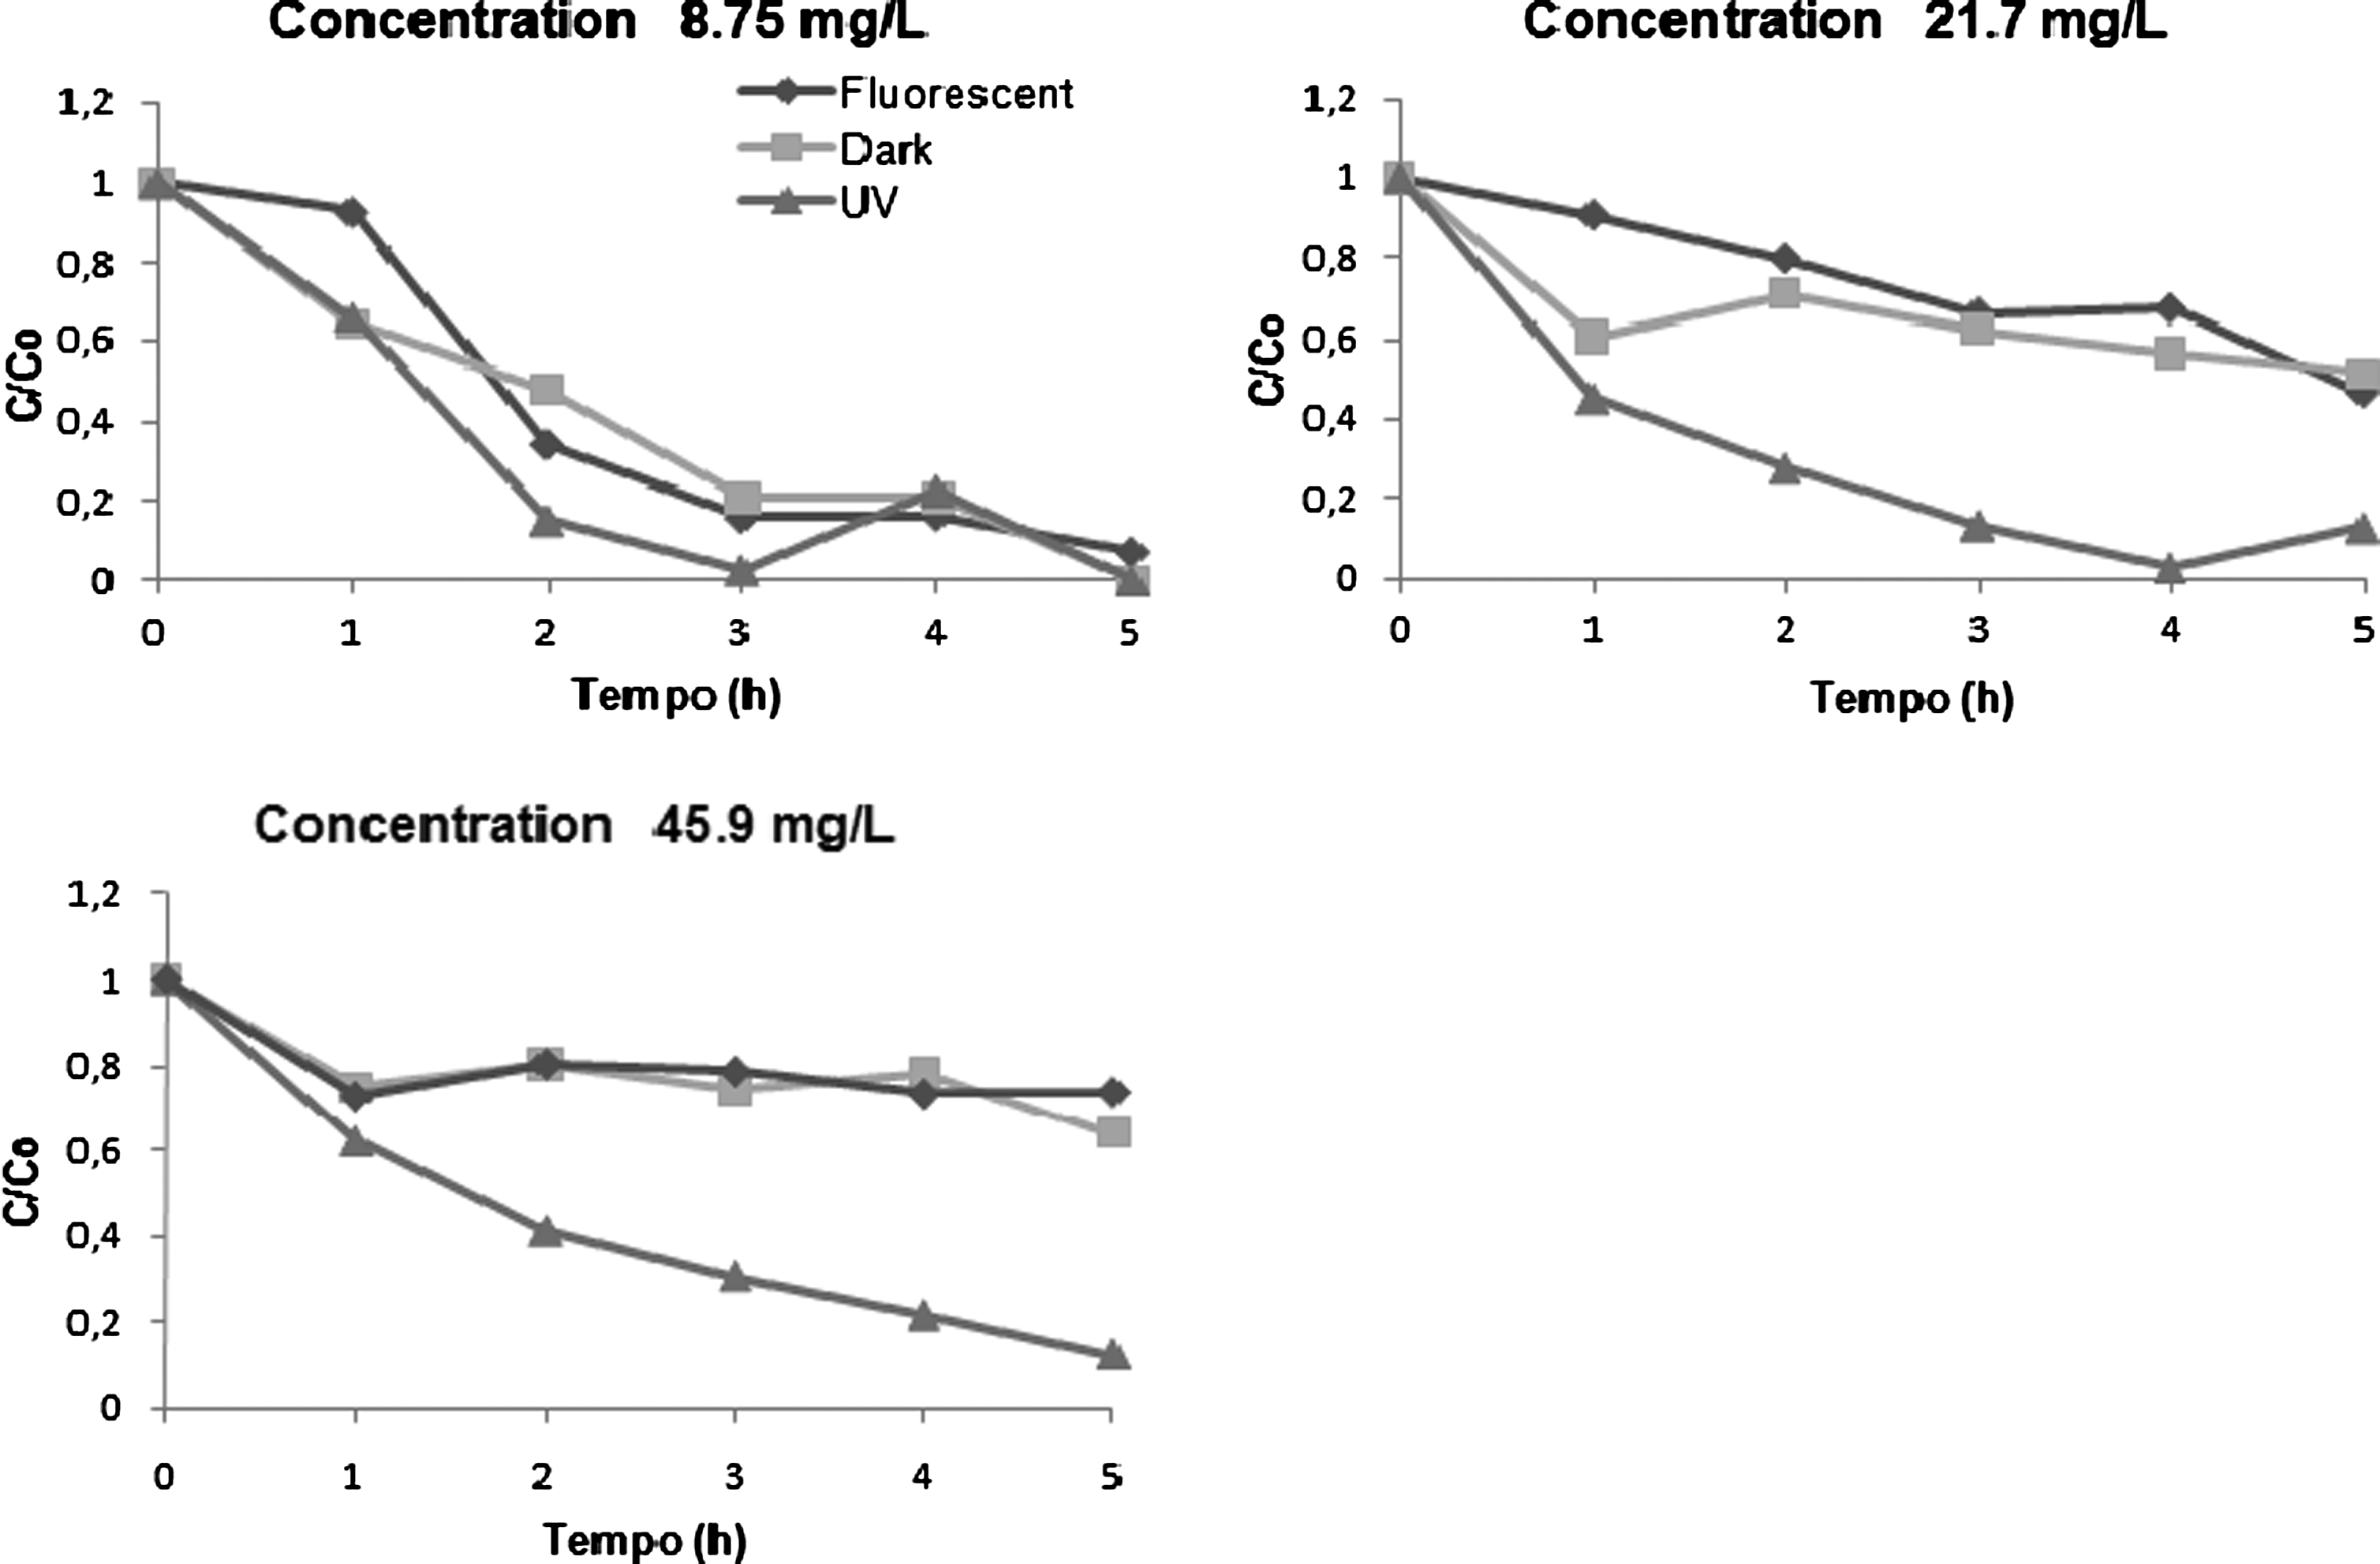
Influence of HFRL dye initial concentration on its photodegradation in the presence of encapsulated ferrites under different irradiation lamps at pH 12.
UV + CoFe2O4@TiO2.
UV + TiO2.
UV, ultraviolet.
Comparing these results with those presented by Lacerda (2010) it can be concluded that the impact of changing the initial dye concentration is more significant for the blue HFRL when compared with the methylene blue, particularly when the low-energy lamps (fluorescent and black) are compared. This confirms that the azo dye blue HFRL is more photo-recalcitrant than methylene blue and that this issue must be taken into account when studying the photocatalytic processes that are to be applied to real systems.
Table 4 shows the results of the characterization of raw and treated wastewater after carrying out photocatalytic tests with encapsulated ferrites (140 mg/L) and different lamp types. It can be seen that the phototreatment did not change the organic matter content (expressed as COD) of the samples, implying that no mineralization reaction occurred extensively. As far as the anionic surfactants are concerned, the data showed that there was a reduction of ∼67% in the MBAS when the UV lamp was used. Such results indicate that although the photocatalytic treatment with UV and encapsulated ferrites did not result in organic matter mineralization, it caused structural changes in the molecules of surfactants and dyes so that color and MBAS was reduced without changing the organic load of the treated effluent.
Expressed as methylene blue active substances.
COD, chemical oxygen demand.
The biodegradability tests (Fig. 6) show that at the beginning of the experiment (6 and 12 h of incubation) the COD removal did not follow any particular trend, reflecting perhaps an adaptation time of aerobic microorganisms (lag phase). However, toward the end of the experiment it can be seen that the samples catalytically treated with UV light showed higher COD removal than the raw wastewater. This result implies that the use of encapsulated ferrite with UV light improved the aerobic biodegradability of the organics present in the raw textile effluent, probably because it caused structural changes in the contaminant molecules. This is coherent with the results presented before, where it was seen that the photocatalytic treatment with UV light changed the color and MBAS concentration without changing the amount of oxidizable organics (COD content) present.
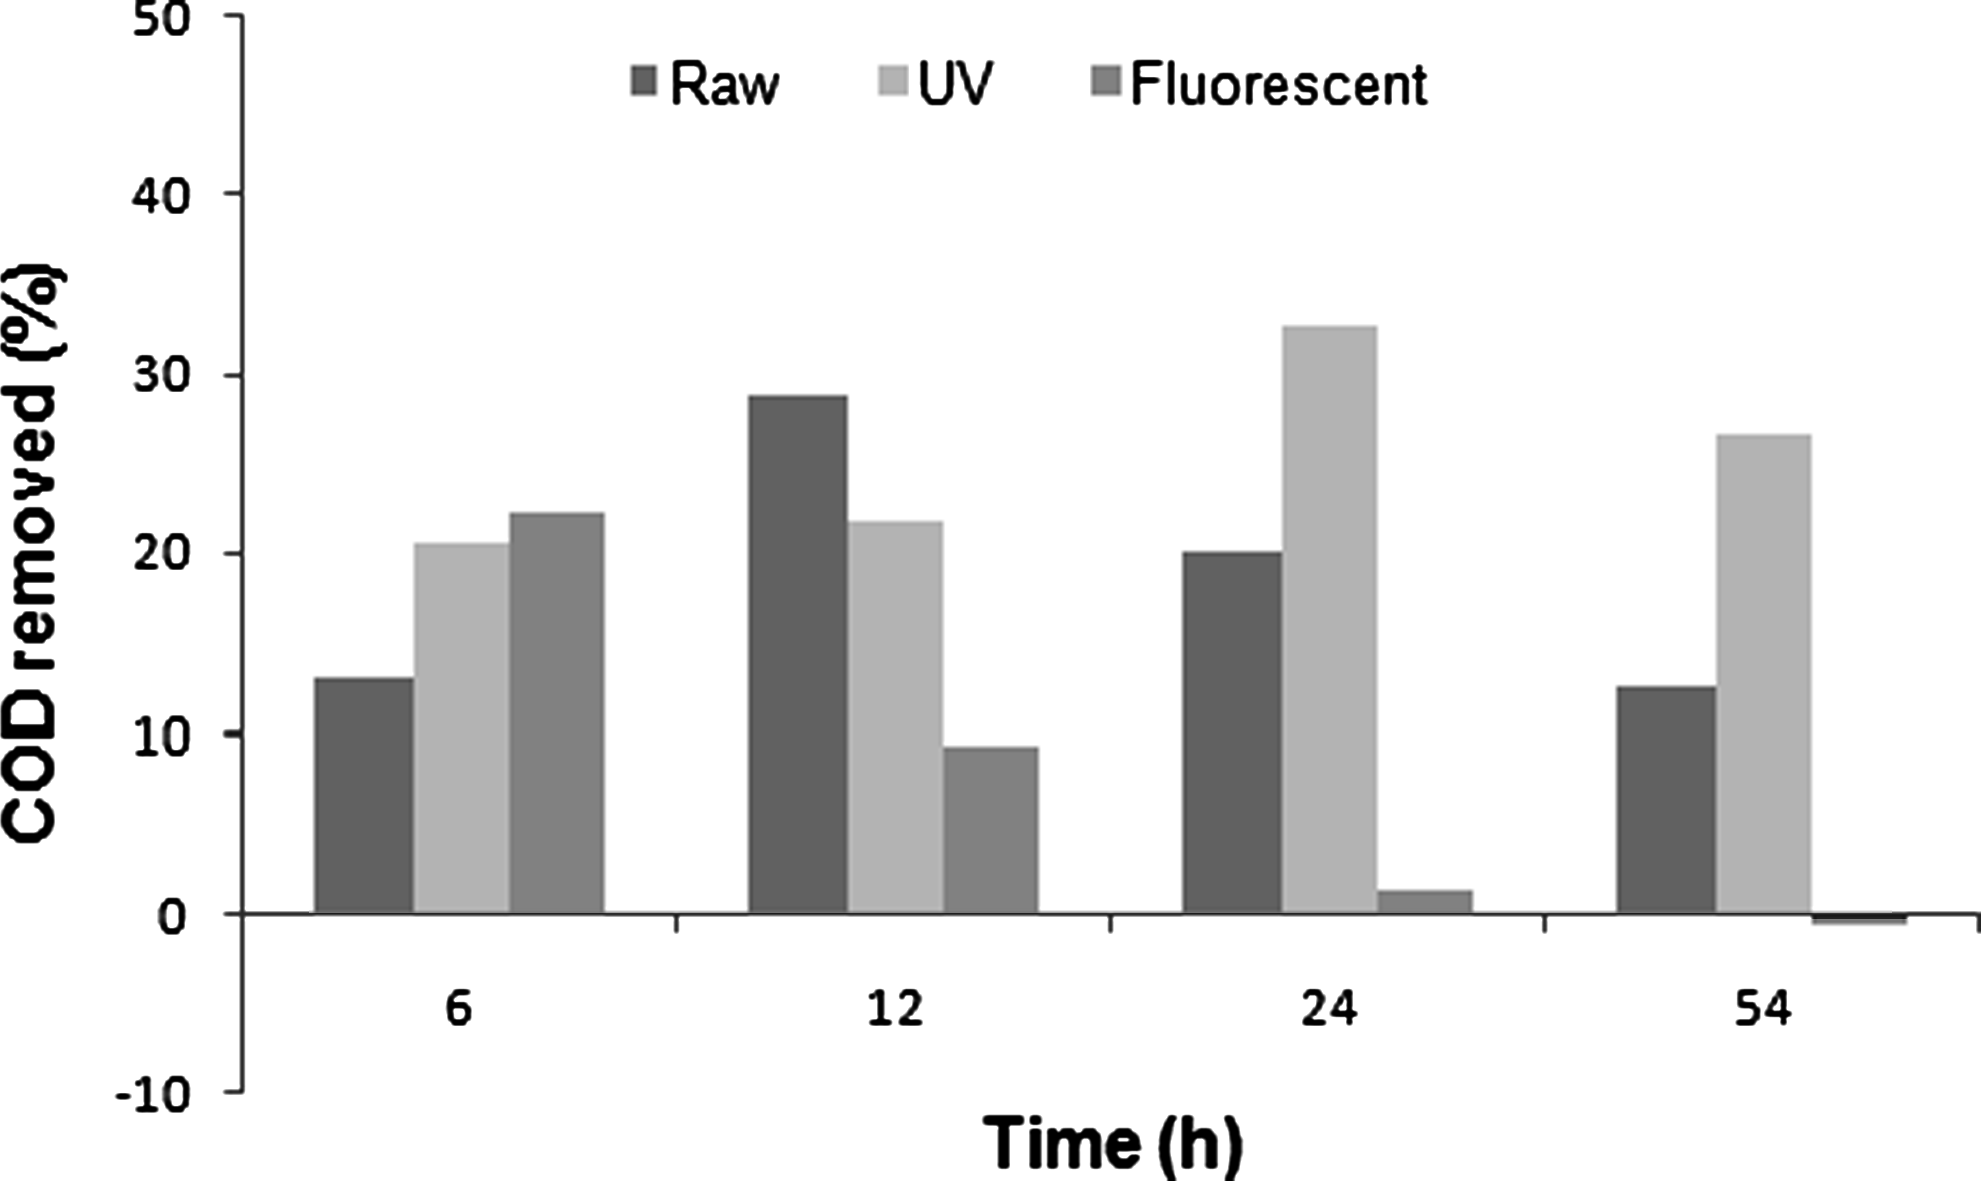
Aerobic biodegradability of raw and photocatalytically treated textile wastewater with encapsulated ferrites (140 mg/L) under ultraviolet (UV) and fluorescent lamps.
The reduction in COD removal observed from 24 to 54 h does not mean reduction of biodegradability, because this was probably related to the production of COD following the release of soluble microbial products into solution. Such soluble microbial product are produced as a result of cell lysis, which occurs in batch mode systems because of the shortage of nutrients and/or accumulation of toxic products toward the end of the incubation period. As one can see, a decrease in COD removal efficiency was observed with both untreated (raw) and treated (UV) effluents in the same incubation period.
As seen in Fig. 7, when the effluent from the activated sludge was photocatalytically treated, there was a significant color reduction in the 300–500 nm absorption region, especially when UV lamp was used. After 20 h of irradiation, the absorbances at 470 and 611 nm were reduced by 50% and 65%, respectively, when the UV lamp was used, whereas for the black and fluorescent lamps the reduction was 20% at the most in both wavelengths. This confirms the recalcitrant nature of the dyes present in the textile wastewater, agreeing with the fact that ∼70% of the dyes commercialized worldwide are azo type, which was found difficult to degrade with fluorescent and black lamps.
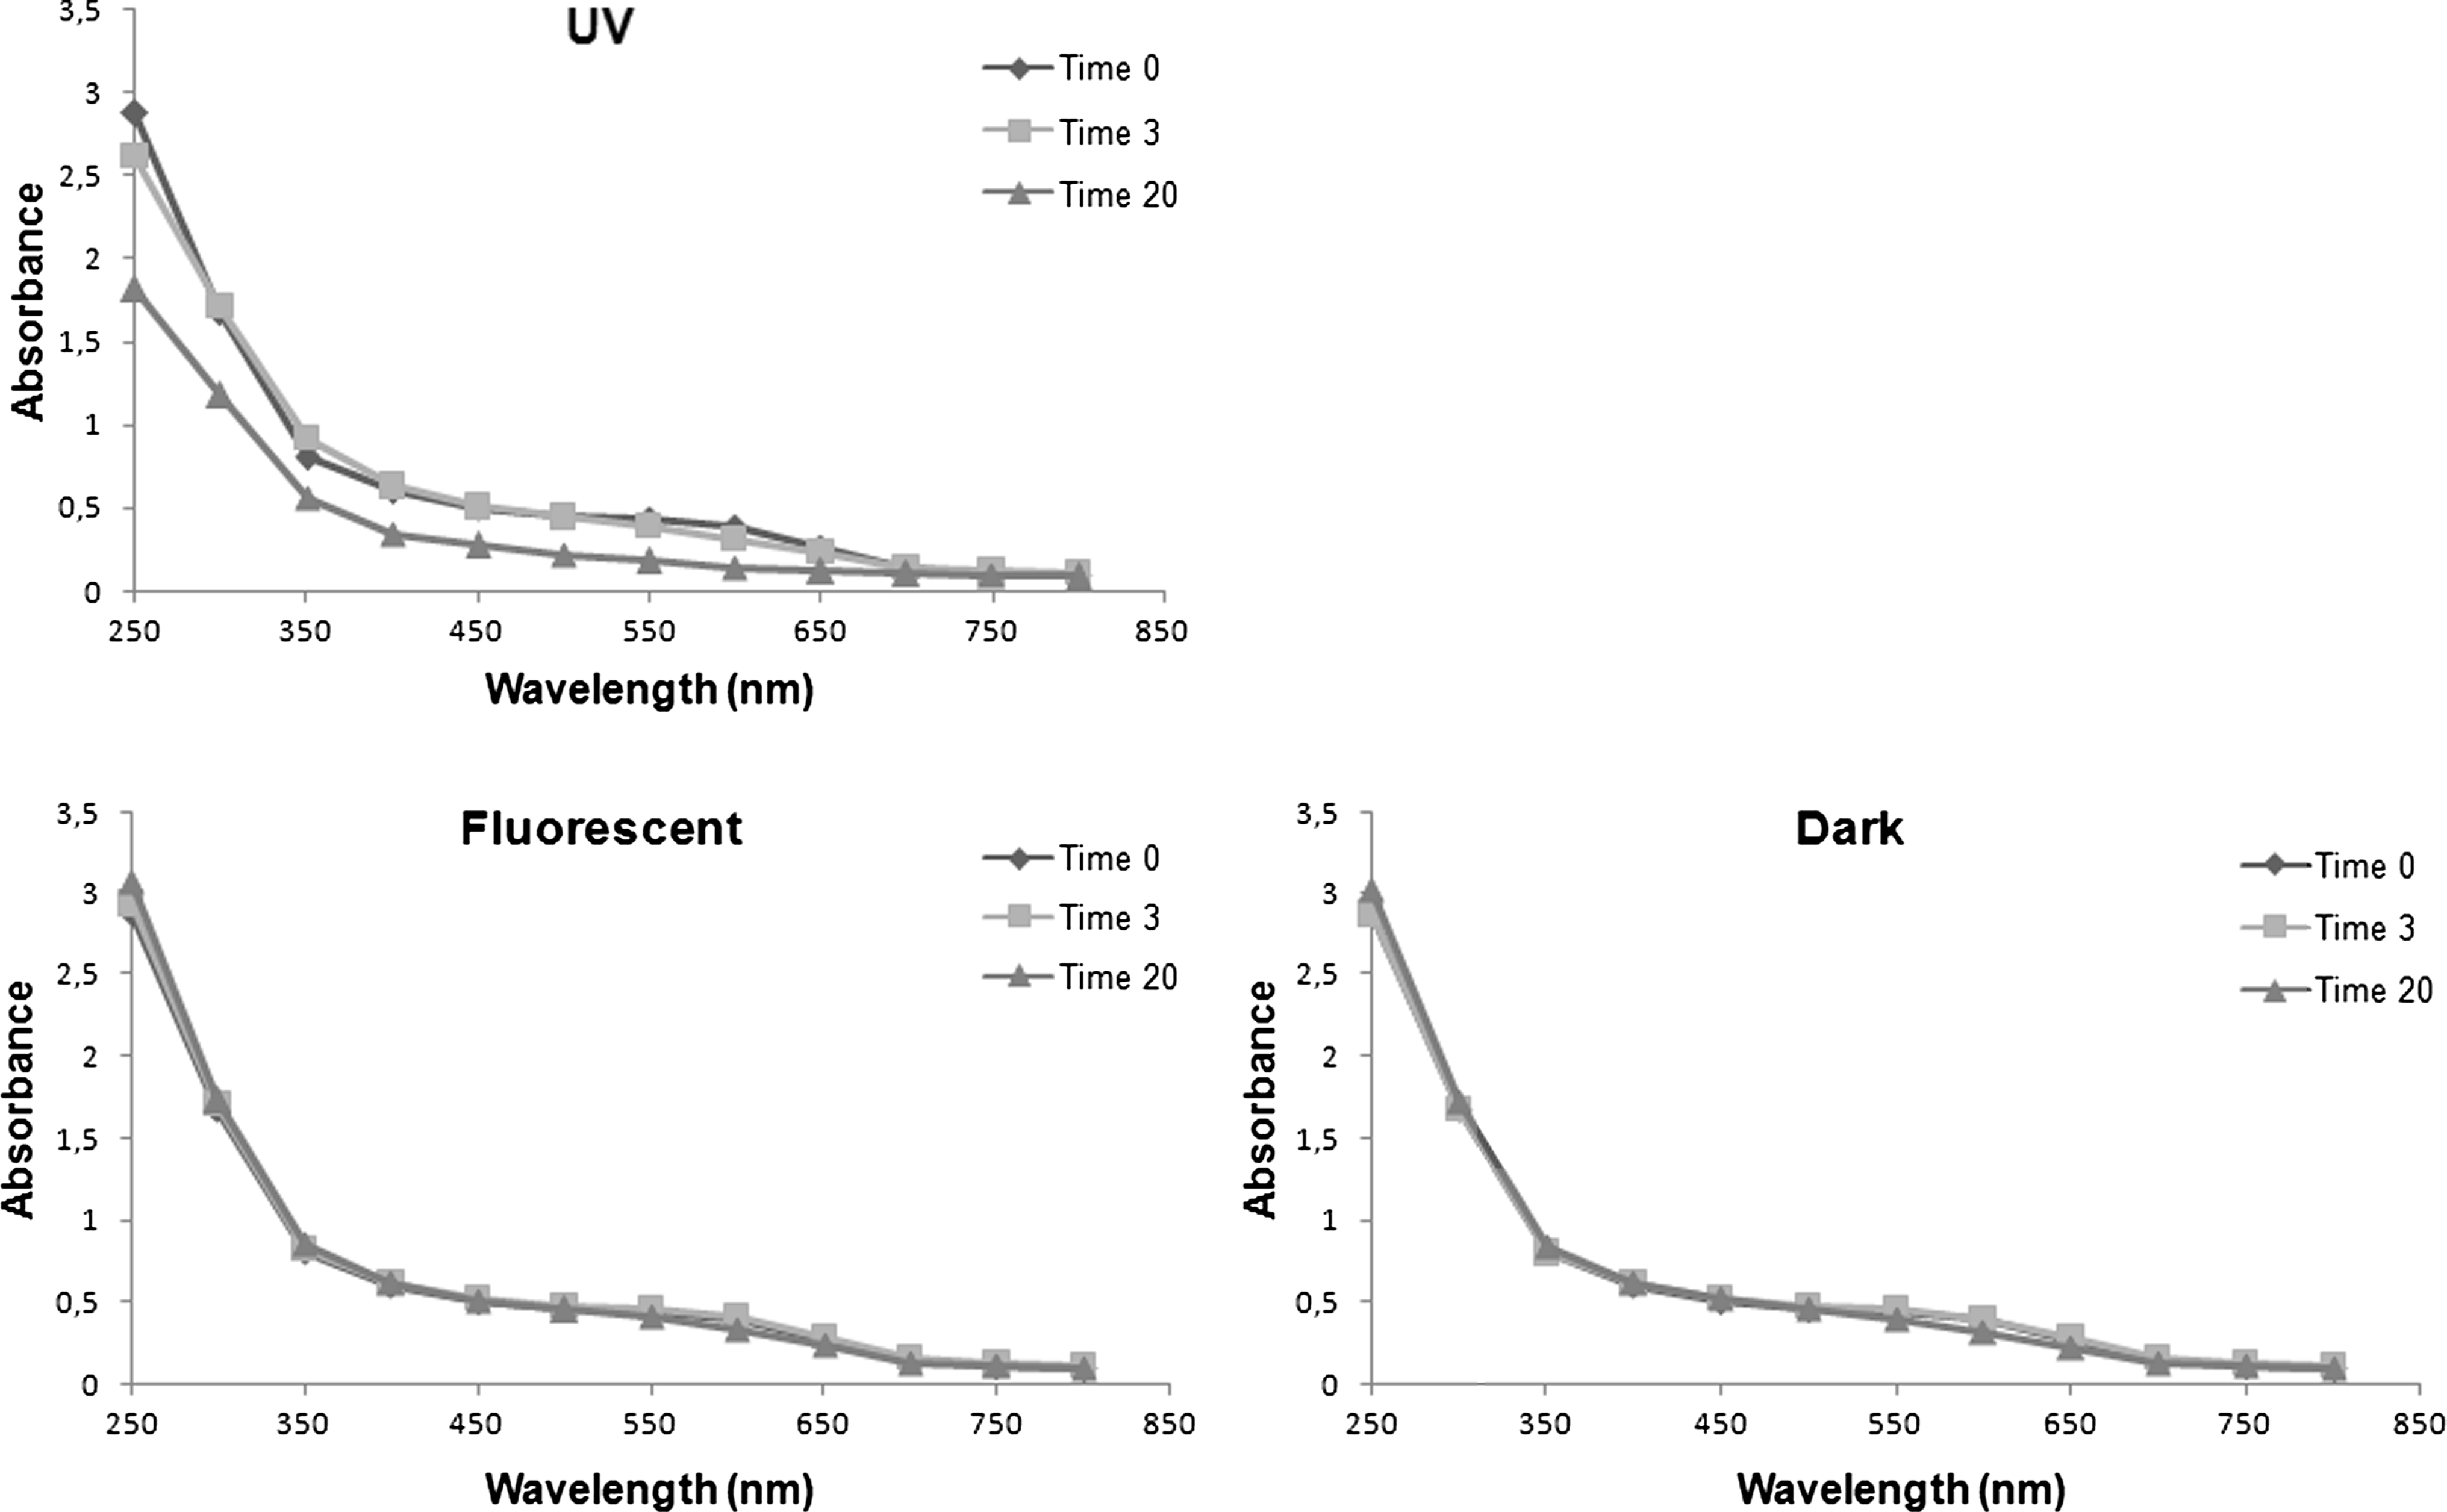
Photodegradation of biologically treated (activated sludge) textile effluent with encapsulated ferrites (140 mg/L) under different lamps.
Photocatalytic tests under continuous feeding
Figure 8 shows the results of experiments that assessed the influence of pH and HRT on the photodegradation of azo dye blue HFRL during its continuous feeding to the CSTR reactors. It can be seen that the use of fluorescent lamp, with or without encapsulated ferrites, did not result in significant color removal in both pH values tested when the HRT was 5 h, confirming the recalcitrant nature of the azo dye when compared with methylene blue (Lacerda 2010). However, in the presence of UV light, the observed removal efficiencies were ∼65% at pH 7 and ∼80% at pH 12 even when a relatively low contact time (HRT = 5 h) was used. It was also seen that the use of ferrites did not change the removal efficiency and this was probably due to the high energy dose used in the CSTRs combined to the fact that the mechanical mixing might have increased the dissolved oxygen in the bulk liquid, thereby enhancing the formation of oxidative radical species.
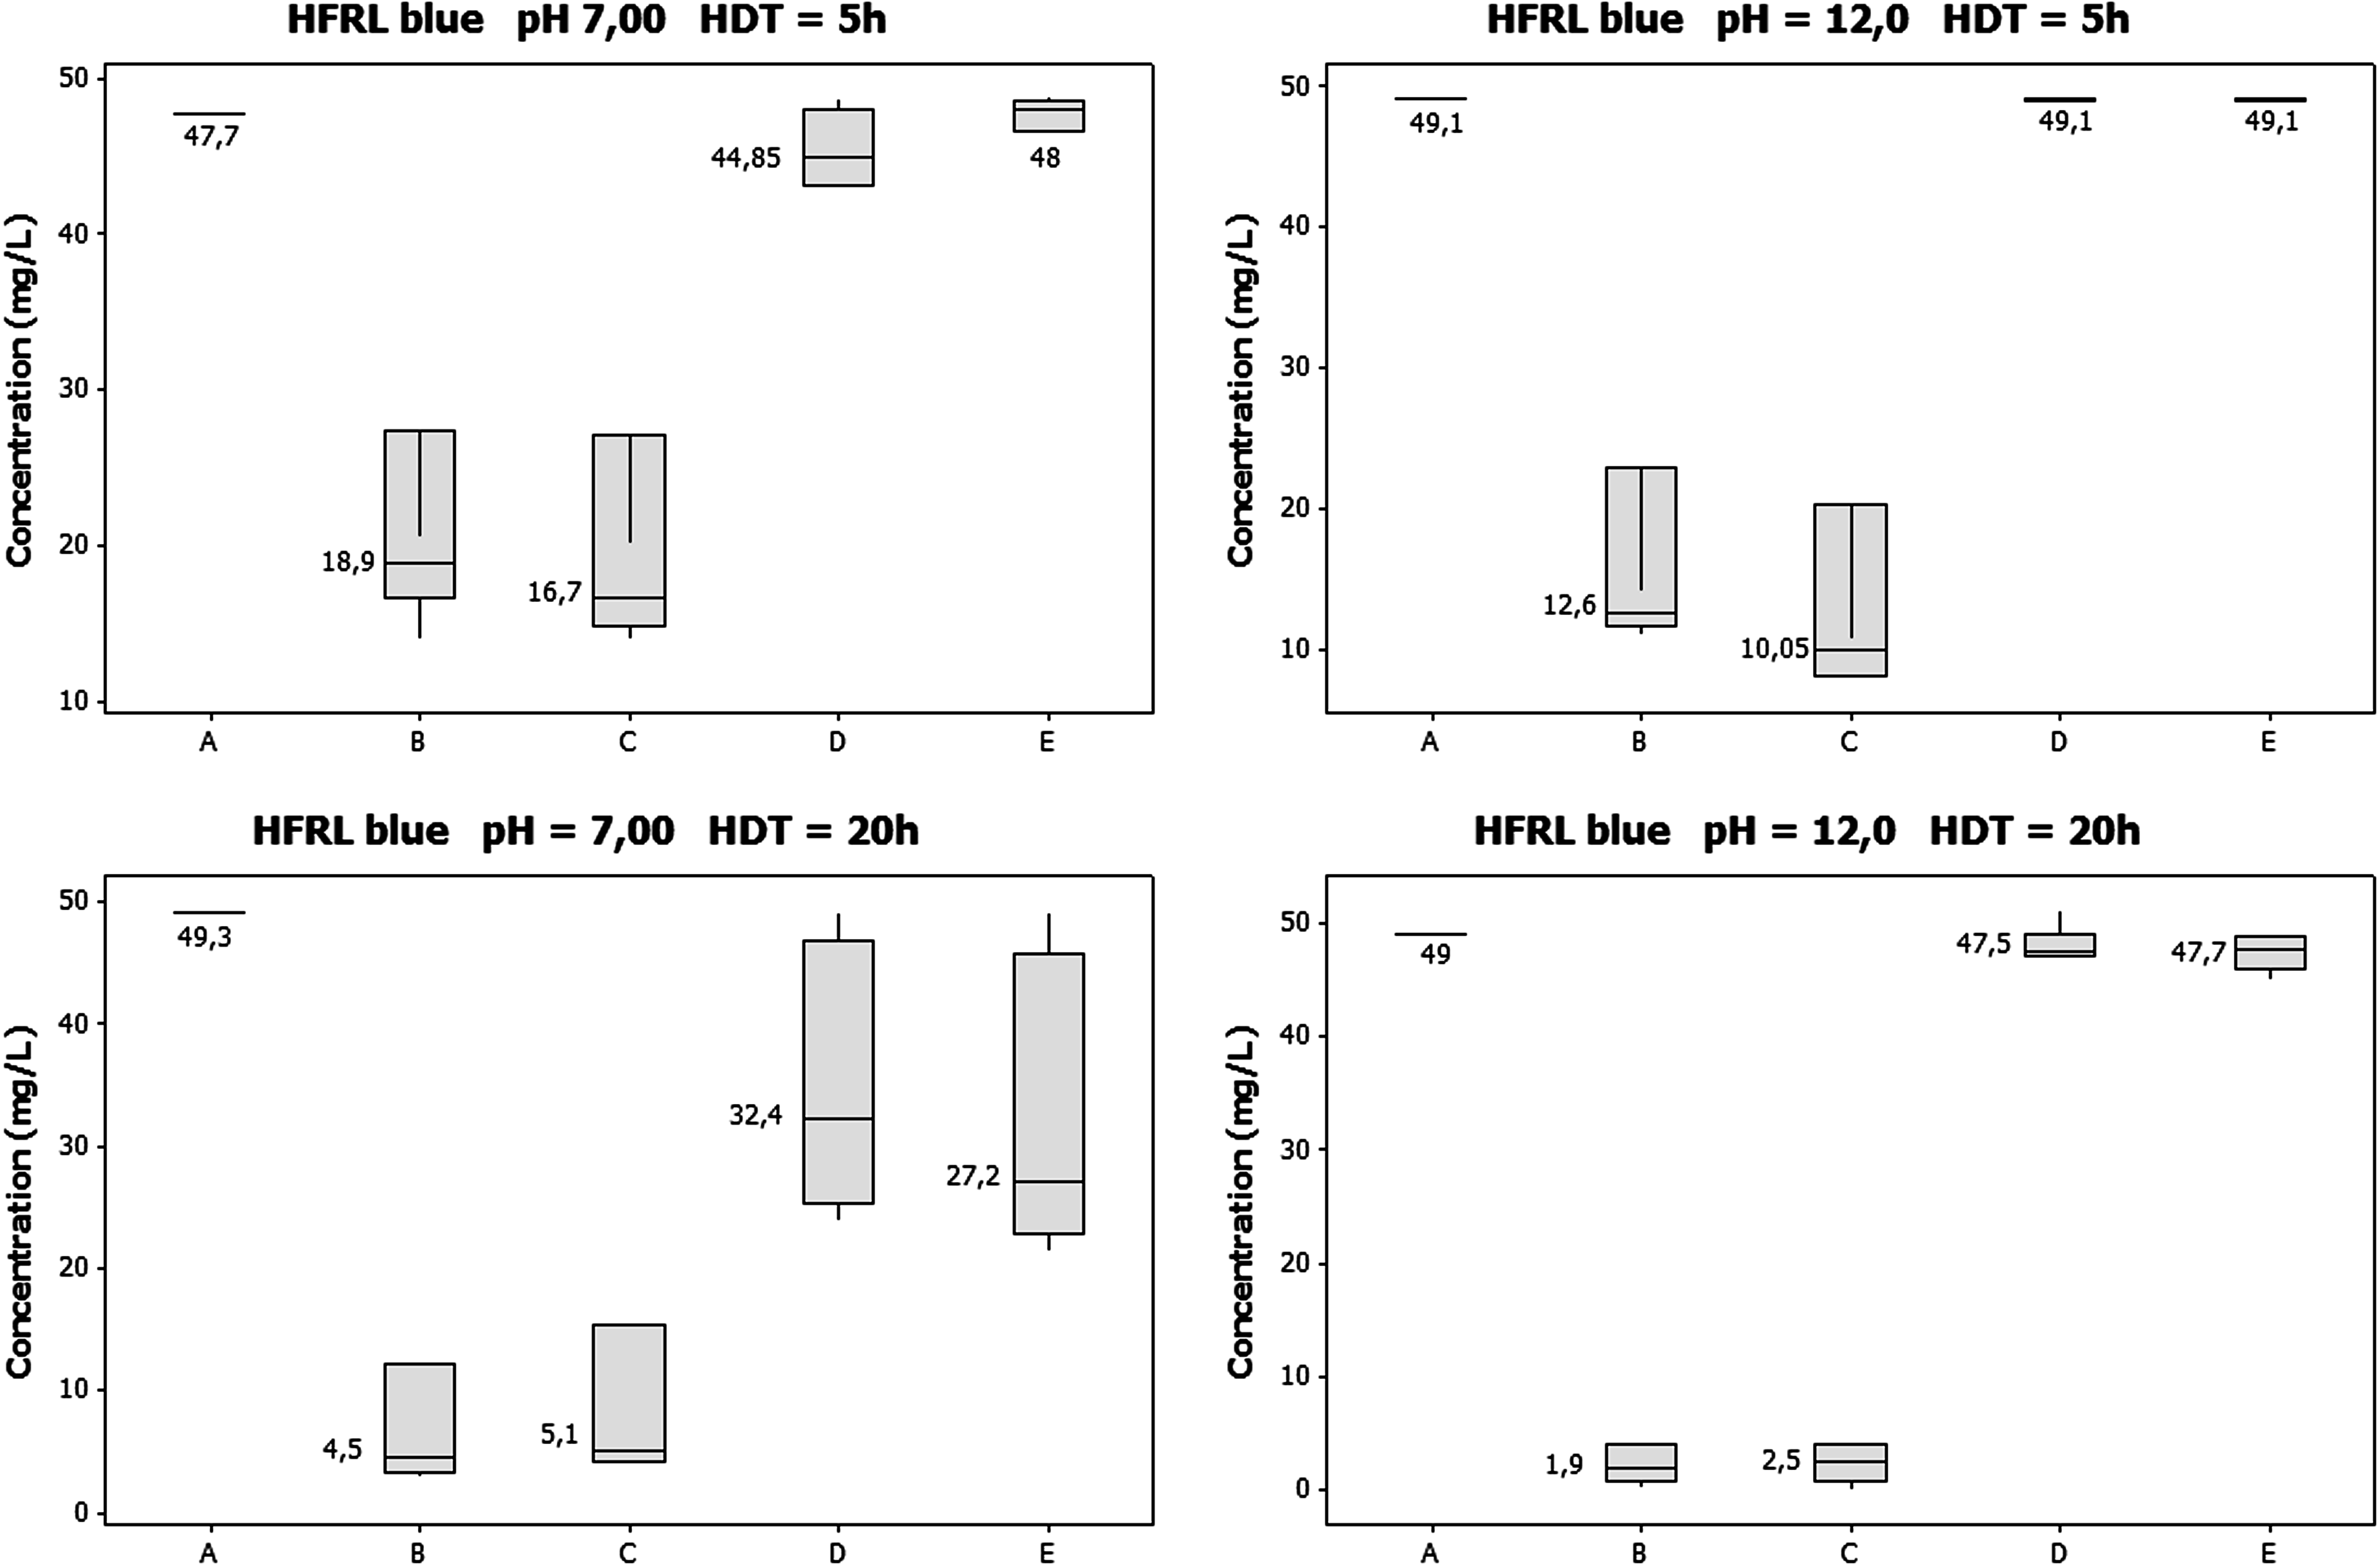
Photodegradation of azo dye blue HFRL under continuous feeding (HDT of 5 and 20 h) with UV and fluorescent lamps, in the absence and presence of encapsulated ferrites (140 mg/L), and TiO2. A, affluent; B, UV with CoFe2O4@TiO2; C, UV without catalyst; D, fluorescent with CoFe2O4@TiO2; E, fluorescent without catalyst.
By changing the HRT from 5 to 20 h resulted in an increase in the efficiency of color removal in all conditions tested, except when the fluorescent lamp was used to decolorize the HFRL blue solution that had pH 12. The results showed that the blue HFRL could be significantly degraded (efficiencies from 70% to 75%) with a low-energy lamp only when the pH was neutral and enough time of contact (20 h) was allowed. These results showed that, different from what was seen in the batch assays, the presence of encapsulated ferrites had little impact on the photodegradation of the blue HFRL.
The data gathered during the continuous feeding experiments using the textile effluent collected after the biological treatment (effluent from the secondary clarifier of the activated sludge process) are shown in Fig. 9. The results show that for all wavelength monitored, the color removal was higher when the UV lamp was used (49%–84% efficiency) when compared with the fluorescent lamp (12%–70% efficiency). It was also observed that color removal in the presence of TiO2 was lower (49%–77%) when compared with the encapsulated ferrite (62%–84%) or with the absence of catalyst (60%–82%). In addition, the results show that under UV light the presence of encapsulated ferrite did not affect color removal, confirming what was seen earlier for the experiments with the azo dye HFRL blue.
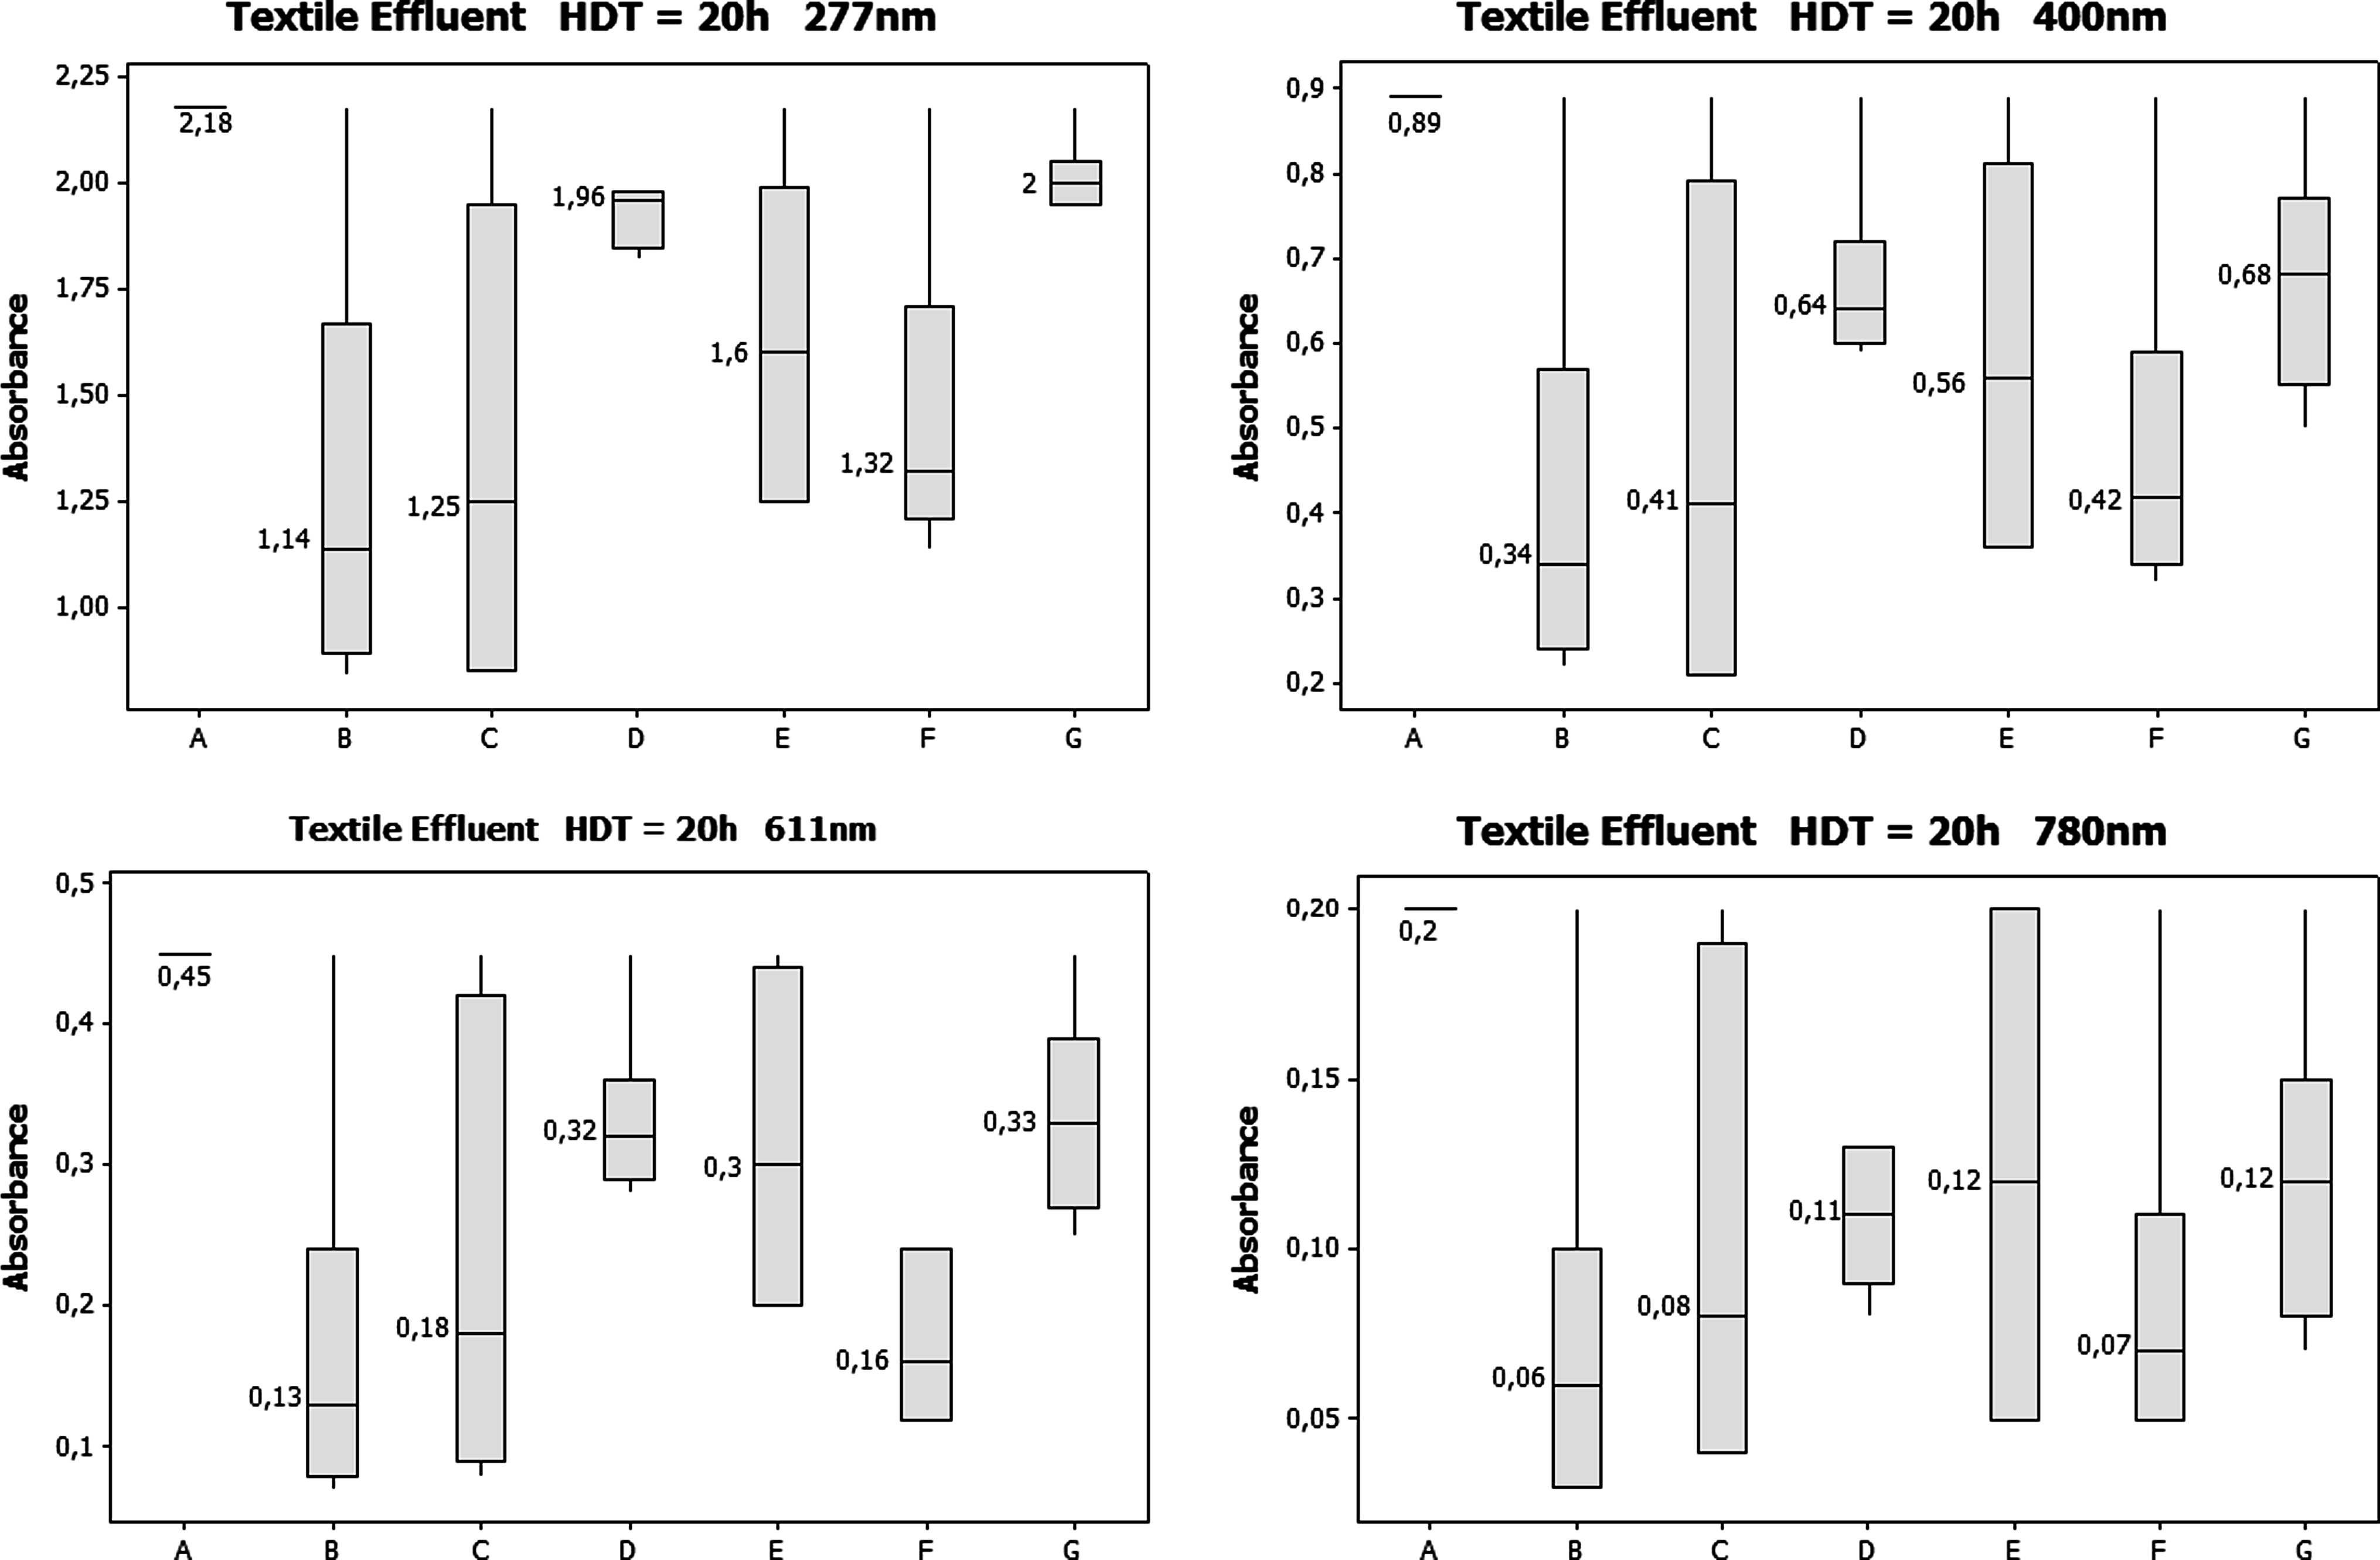
Photodegradation experiments with continuous feeding of biologically treated textile effluent in the absence and presence of catalysts (TiO2 or CoFe2O4@TiO2, both at 140 mg/L) with UV and fluorescent lamps at HRT of 20 h. A, affluent; B, UV with CoFe2O4@TiO2; C, UV without catalyst; D, fluorescent with CoFe2O4@TiO2; E, fluorescent without catalyst; F, UV with TiO2; G, fluorescent with TiO2.
When the fluorescent lamp was used, it was observed that, for all monitored wavelengths but 400 nm, the presence of encapsulated ferrites resulted in lower removal efficiency (12%–55%) when compared with TiO2 (22%–61%). In addition, it was also observed that in the absence of solid catalysts the color removal was higher (40%–70%), indicating that dye degradation might have occurred because of the enhanced dissolution of oxygen, which enhances the generation of hydroxyl radicals in solution.
Characterization of photocatalytically treated samples
Table 5 compares the removal efficiency obtained in this study with values reported in the literature. As the variable time of contact, dose of catalyst, and nominal lamp potency applied were different in these studies, it was decided to express the results as a normalized removal efficiency (NRE), calculated according to equation 2.
Ferrite encapsulated by TiO2 (CoFe2O4@TiO2).
TiO2 (Degussa P-25).
where RE is the removal efficiency, CC is the catalyst concentration, LPN is the nominal lamp potency, and Tc is the contact time.
It can be seen that the encapsulated ferrite used in this study rendered color NRE equivalent or higher than those presented in the literature when TiO2 was used to decolorize azo dye solutions or textile effluents. However, the color removal observed in the present study was not followed by mineralization of the organic constituents, as shown by the results presented in Table 6. Indeed data presented in Table 5 agree with that of Table 3 and show that despite color removal being observed, the COD values of raw samples were not statistically different from those submitted to photocatalysis. This implies that color removal might have happened by breakage of the chromophore system without conversion of the dye molecule into CO2 and H2O. The fact that photocatalysis was not effective in mineralizing the dye molecule might be due to the presence of competitive inorganic salts in the textile effluents, as discussed by Guillard et al. (2005).
These results confirm what was seen during the batch tests and imply that the color removal might be attained with a change in the molecule structure without its complete degradation. This means that photo-oxidation intermediates accumulated in the reactor, whose structures may depend upon the operational conditions of the photoreactor as implied by the mass spectra data (Fig. 10). The principal component analysis graph was derived from mass spectrometry analyses of photocatalytically treated azo dye solution under different conditions. It can be seen that the samples irradiated with the fluorescent light (D and E) resulted in a chemical profile quite distinct from that obtained when UV light was used (B and C), and that both were quite distinct from the chemical profile of the untreated azo dye solution (A). These results imply that the chemical intermediates from the photo-oxidation using UV lamp are different from those obtained with fluorescent lamp. In addition, it seems that the intermediates produced by direct UV photolysis (C) are similar to those produced by photocatalysis, that is, in the presence of the encapsulated ferrite (D). This indicates that the mechanism of dye degradation is similar in the absence and presence of catalyst, strengthening the hypothesis that the dye degradation occurred in bulk solution following the generation of hydroxyl radicals rather than via degeneration of the dye molecule onto the catalyst surface following the losing of its excited electrons to TiO2 conduction band.

Principal component analysis (PCA) obtained with mass spectrometry characterization (in the negative mode) of photocatalytically treated azo dye solution at 20 h HRT under different conditions. A, affluent; B, UV with CoFe2O4@TiO2; C, UV without catalyst; D, fluorescent with CoFe2O4@TiO2; E, fluorescent without catalyst.
Conclusions
The data presented in this article showed that the procedure of encapsulating iron–cobalt ferrites with TiO2 was effective, leading to the production of a catalyst with a magnetic core and photoactive surface. The photocatalytic tests carried out in batch mode with the azo dye blue HFRL and textile effluents showed that the presence of encapsulated ferrites enhanced color removal. Continuous feeding experiments with both raw and biologically treated (activated sludge) textile effluents confirmed that color removal increased in the presence of the encapsulated ferrites, resulting in NRE higher or equivalent to other literature studies that employed TiO2 as catalyst. Although significant COD removal during photocatalysis was not observed, it was verified that it enhanced the aerobic biodegradability of the textile effluent, probably by changing the azo dye molecule without mineralizing it. Further work is needed to identify the main photocatalysis byproducts as well as to investigate the operational conditions that favor azo dye mineralization.
Footnotes
Acknowledgments
The authors thank FAPEMIG (grant number: APQ 3171-06), CAPES, and CNPq for the financial support.
Author Disclosure Statement
No competing financial interests exist.