
Abstract
Abstract
Due to large amounts of wastewater generated by textile industry, studies on degradation and subsequent impact of these effluents are needed when they are released into water bodies. Since reactive dyes present higher degradation when treated by physical and chemical processes, a photoelectrolytic process was used. Ecotoxicological analysis of simulated textile effluents was conducted before and after treatment. Winogradsky columns were used, simulating a microecosystem where algae growth was examined. Results indicated that the photoelectrolytic process achieved satisfactory results in color degradation of the studied dye (Remazol red brilliant), but after 30min of treatment, even though the effluent became colorless, it reduced dramatically microalgae diversity. Although complete color removal (97%) was not observed, the effluent treated for 5 min did not affect microalgae growth in the same way as the effluent treated for 30 min. An optimum treatment time of 5 min was determined.
Introduction
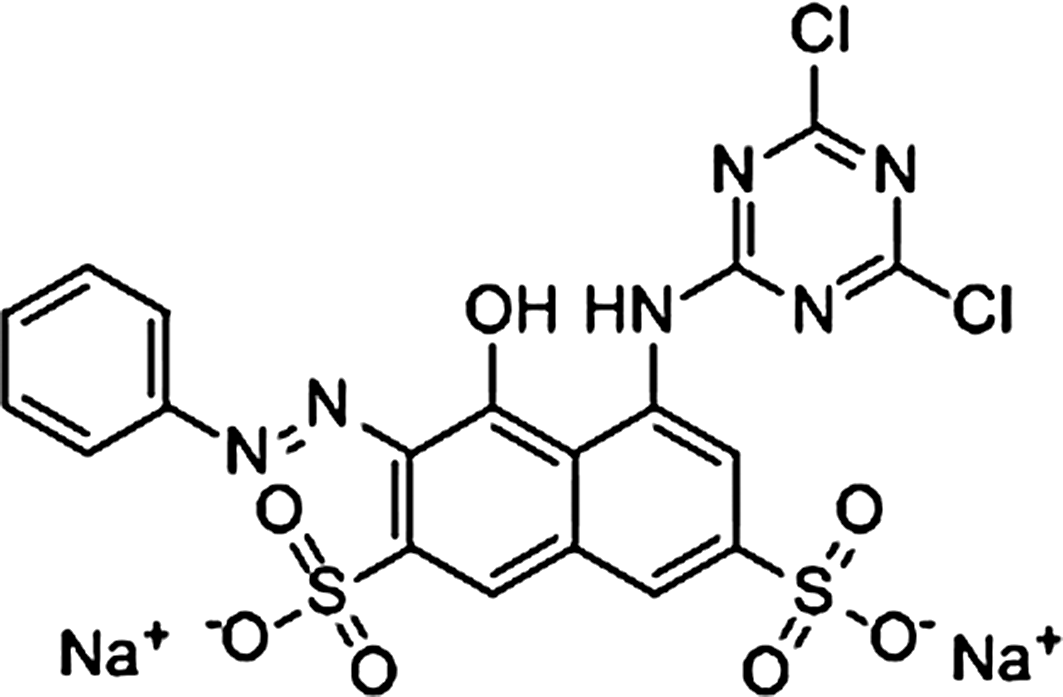
Remazol red brilliant molecule.
Since reactive dyes are hardly degraded by biological processes (Al-Degs et al., 2000; Araújo et al., 2006), physical-chemical processes are more appropriate in this situation. The photoelectrolytic process is successfully applied to treatment of effluents containing reactive dyes (Pelegrini et al., 1999; Araújo et al., 2006; Catanho et al., 2006). It is also efficient in the presence of organic matter (Ziolli and Jardim, 1998) and could even be used for sewage treatment (Cossu et al., 1998). However, despite color removal, the dye molecule might end up not being completely destroyed (Sauer et al., 2002), thus causing high toxicity after treatment (Sousa et al., 2011).
During electrolysis, pollutants can be degraded by direct electrolysis, as charges transferred on the anode surface are capable of destroying pollutants (Chiang et al., 1995). Moreover, they can be degraded by indirect electrolysis when a chemical compound is added by generating an oxidizing agent in solution (Chiang et al., 1997). In this case, an ultraviolet (UV) lamp accelerates reactions involved and optimizes the process by oxidation (Robinson et al., 2001). However, physical and chemical processes are able to either destroy the dye, or only transform it, so the dye molecule still persists in effluents in another form (Sauer et al., 2002).
Once the effluent is treated by the photolectrolytic process, it is necessary to measure its impact in the environment. One way is through Winogradsky columns. These columns are microecosystems inside a glass container, composed of soil (taken from river bottom), water, and nutrients. The Winogradsky column metodology is knowingly used to understand microbial communities (Ambler et al., 2001), population changes in biodegradation and bioremediation studies (Gutierrez et al., 2007), and ecotoxicology of polluted environments (O'Sullivan, 2003). Microalgae or phytoplankton distribution along the columns in the presence of different treated effluents can be observed though this method.
Algae is important organic matter producers in aquatic ecosystems (Klain and Lewis, 1995) and houses species from Plantae, Metazoa, and Bacteria (Brusca and Brusca, 2003; Bicudo and Menezes, 2006).
The objectives of the present article are the photoelectrolytic degradation of simulated textile effluent and the evaluation of ecotoxicity from the samples obtained in the Winogradsky columns' phytoplankton community.
Experimental Procedures
The experiments were performed in a photoelectrolytic system (Fig. 2) containing electrolytic reactor, stainless-steel chamber containing an ultraviolet lamp, flowmeter, PVC tank, valves, hydraulic pump, and tubing placed in a metal support. The electrolytic reactor is composed of a rectangular titanium anode coated with 70% TiO2/30% RuO2.
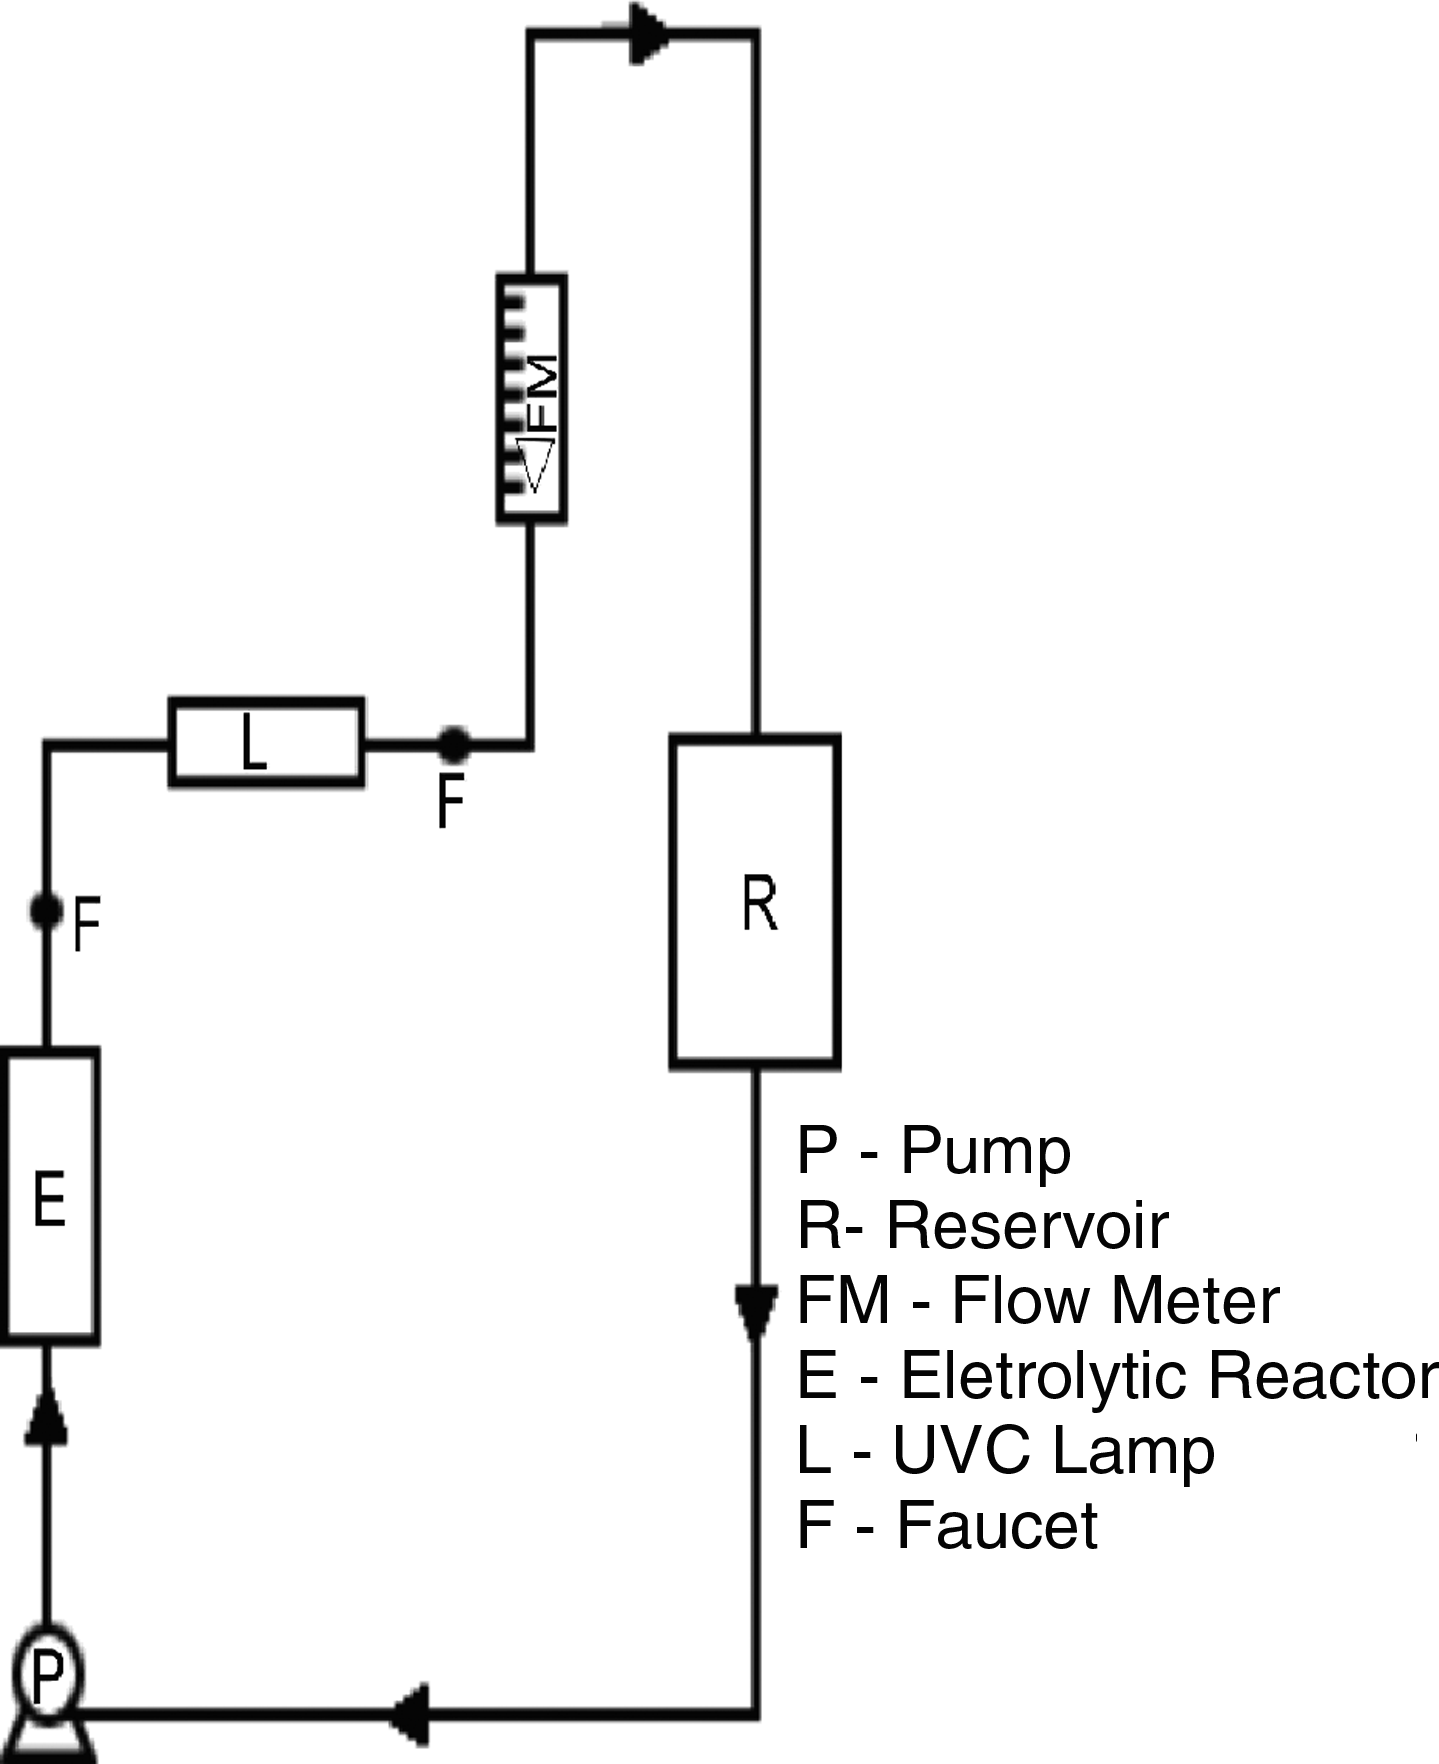
Scheme of photoelectrolytic system.
The system makes an indirect electrolysis of organic compounds in solution with sodium chloride as an oxidant agent (Deng and Englehardt, 2007). The UVC lamp (Ultraviolet C, from 280 nm to 100 nm) promotes photooxidation of those compounds, thus accelerating the degradation process. The effluent was put on reservoir, from where it was pumped, passing through an electrolytic reactor and a UVC lamp, in a clockwise cyclic system. After 3 min, the UVC lamp was turned off, but the electrolytic reactor was kept on until the end of the treatment, thus degrading the effluent.
The dye is commercially known as Remazol Red Brilliant (CI reactive red 21) and was produced by ShangHai Titanchem Ltd. Its chemical formula is C19H10Cl2N6Na2O7S2 and it is called disodium salt of 2,7-Naphthalenedisulfonic acid, 5-[(4,6-dichloro-1,3,5-triazin-2-yl)amino]-4-hydroxy-3-(phenylazo).
The simulated effluent was made by adding 40 g of sodium chloride (10,000 mg L-1) into a 4.00 L flask and 5.28 g of anhydrous sodium carbonate. Reagents were dissolved into 4 L of distilled water. Afterward, 0.8 g of dye powder was slowly added into the solution up to a final concentration of 200 mg L-1. This concentration is higher if compared with the photoelectrolytic degradation studies of Catanho et al. (2006) and Georgiou et al. (2002).Since real concentration used in the industry is variable and depends on the type of dye used and dilution, there is no standard concentration.
The prepared solution pH was about 10.5, so it was acidified with sulfuric acid 2 M to achieve pH around 3.5, because the titanium anode coated with 70% TiO2/30% RuO2 has a better efficiency in acid pH values due to the TiO2 surface charge (pzc is close to 6.8) according to Sauer et al. (2002). This simulated effluent was placed in the photoelectrolytic system and exposed to a continuous 3 A current. Samples were taken at predetermined times: 0 min (simulated effluent without treatment), 3 min, 5 min, 15 min, and 30 min. The UV-C light was turned on for 3 min at the beginning of the treatment. Samples were stored and maintained under refrigeration for later analysis of absorbance, and consequent degradation of cromophore groups, pH (Digimed DMPH-2), and conductibility. The o-toluidine reagent was used to measure chlorine in the samples 15 days after treatment.
The Winogradsky columns were made with 500 mL beakers from 100 g of soil collected from Ribeirão Claro (Rio Claro, Brazil) water treatment station input (DAAE, Rio Claro, Brazil), 50 mL of treated simulated effluent and 450 mL of water were also withdrawn from DAAE. All the columns contained sludge and water from the same place. They were also equally illuminated and enriched with nutrients. The sludge and water were removed from a water treatment station, so it was assumed that the place had appropriate conditions for phytoplankton development. For every 100 g of soil used in each Winogradsky column, the following nutrients were added, adapted from Anderson and Hairston (1999): Na2CO3 (0.20 g), Na2SO4 (4.50 g), K2HPO4 (0.50 g), (NH4) 2SO4 (0.50 g), and plain paper/cellulose (0.50 g). Four columns were made: one with water only (no simulated effluent) called control (C), one with the effluent without treatment (T0), one with treated effluent for 5 min (T5), and another with the effluent treated for 30 min (T30). An incandescent lamp (150 W) was placed behind the columns during the experiment, providing enough light for photosynthetic processes. Also, a paper sheet was placed blocking the top half of the column to evaluate the influence of light incidence on development of microorganisms by creating heterogeneity.
Modifications were observed within the columns during the experiment, such as algae development and color change. Only after 4 weeks, when the photosynthetic population was already stabilized, algae identification started. Observation was done using a microscope (400×), so identification was done by comparison and taxonomic key from Bicudo and Menezes (2006).
Algae samples were collected close to the column walls using a spatula. These samples were identified and conditioned in test tubes containing water and 70% ethanol and kept at a low temperature to prevent its degradation (Bicudo and Menezes, 2006). Biomass quantification was measured by observation before the algae samples were removed from the columns. Since the algae layer was largely removed for taxonomic identification, and irregularly distributed throughout the column walls, the withdrawal of samples for weighing was not possible.
Results
The process proved itself extremely successful in color removal from the solution. Chromophore groups' destruction can be shown by a concentration decrease from 200 to 0 mg L-1 and absorbance from 3.95 to 0 at a 541.5 nm wavelength, analyzed with a spectrophotometer. This can be explained by the fact that chloride is oxidized to chlorine/hypochlorite, which is responsible for increased efficiency of the electrolytic process. Chlorine reacts with dyes' unsaturated and chromophore groups. This reactive species derived from chlorine is responsible for organic oxidation and also oxidation of intermediate compounds present in the effluent and nitrogenous waste (Cossu et al., 1998). It was possible to detect chlorine presence in the 30 min sample, 15 days after the treatment, with a 5 ppm concentration.
It is worth mentioning that these results were obtained 1 day after the simulated effluent was treated, because there was intermediates formation in this solution after being irradiated by UV light. After 15 days, the stored samples had an even greater degradation with both total color removal and concentration decrease, especially the 5 min samples (Fig. 3).

Dye concentration after treatment.
There was a significant reduction in solution pH, and the final pH after 30 min of treatment was 6.5 the same day the effluent was treated, reaching up to 7.0 fifteen days later (Fig. 4).
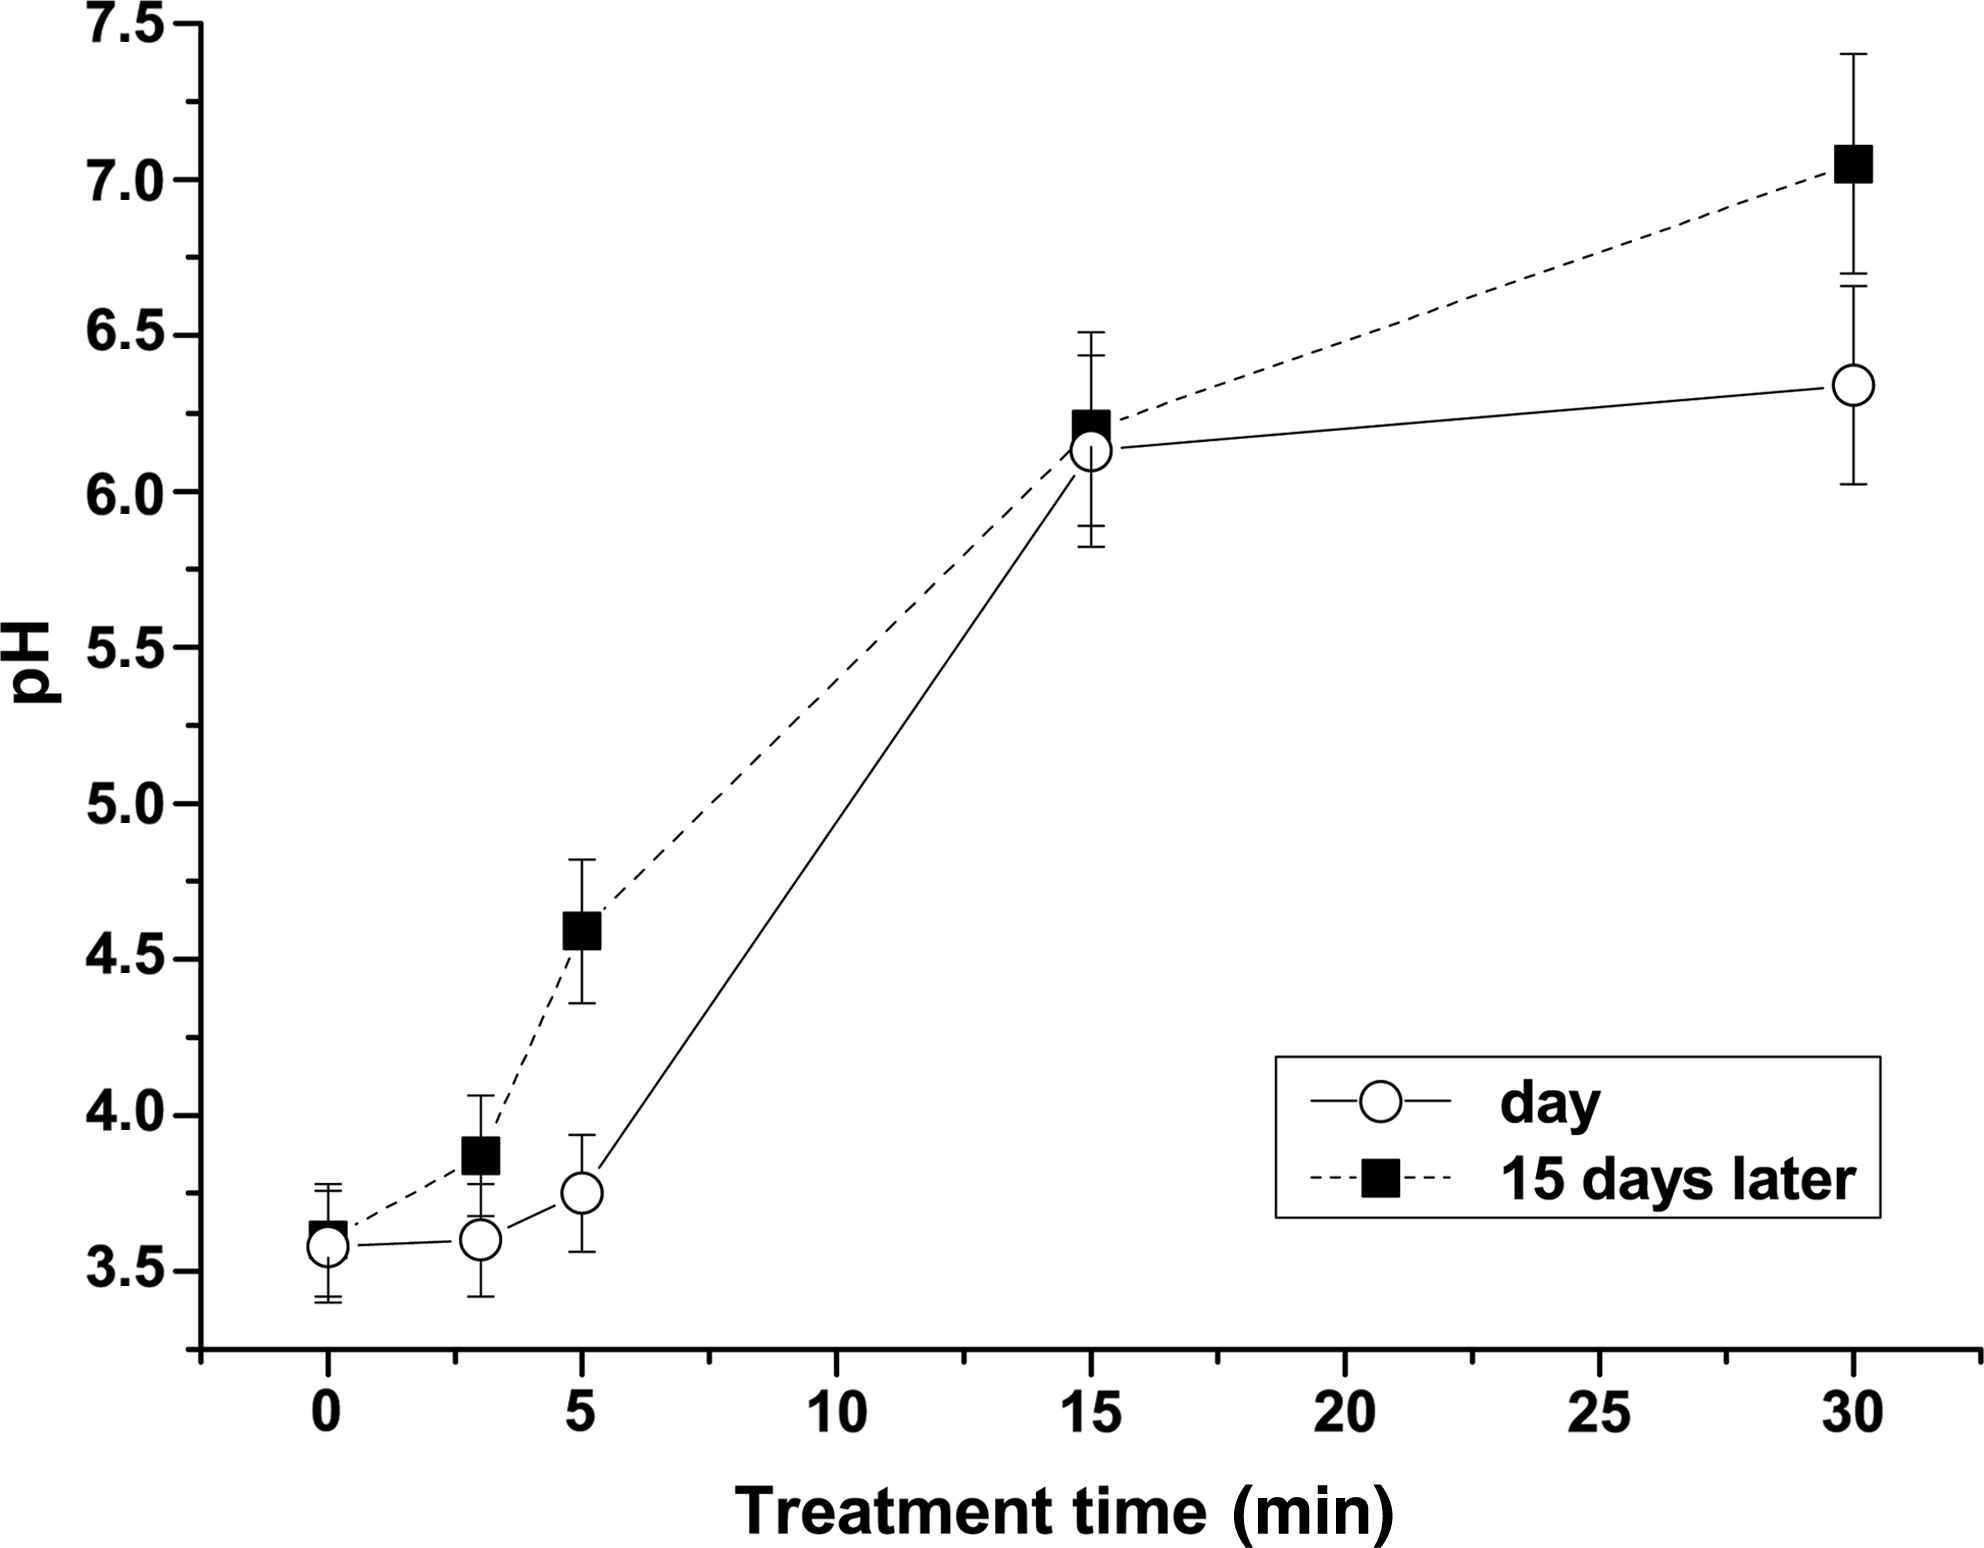
Effluent pH after treatment.
The treated solution conductivity (Fig. 5) remained at the same level (between 14.0 and 14.5 S m-1) until 15 min of treatment and then rose at 30 min (16.0 S m-1). This is due to an ions increase in solution due to dye molecules breaking and ionization. After 15 days, the conductivity decreased considerably, lying between 10.0 and 11.5 S m-1 (Fig. 5).

Effluent conductivity after treatment.
On the 4th day, algae began to appear in columns T0, T5, and C, in both walls and on top of the sediment. At the 7th day, there was a thin layer of algae present throughout the wall in columns C and T0, including behind the column; whereas T30 had not presented any algae on the walls, only a few on the top (inside the covered area).
At the 10th day, column C showed a layer of algae over the whole length and a turbidity increase. The column T0 presented algae layer thickening, especially at the bottom. There was gas evolution as an evidence of microbial activity. Also, it was observed that the solution became clearer at the column T0 bottom, indicating metabolic activity in the biodegradation of the dye. Column T30 showed little algae formation on the bottom and back.
At the 19th day, all columns presented algae layer on the back, very dense especially in column C, which showed formation of algae over the whole length. Only after the 22nd day, there was a considerable growth of algae in T30. Columns T5 and T0 showed a large release of gas (in the form of bubbles) and at the 28th day, the columns were already stable, so the samples were removed for analysis.
Columns C and T5 showed the greatest development of biomass, and column T30 showed the lowest, which is concentrated at the rear of the column (farther from the light), which was expected due to a higher concentration of chlorine in the 30 min effluent. Column T5 had a similar development to column C, which indicates a lower toxicity. The columns with smaller biomass presented this characteristic because of the toxic nature of effluent and also due to the fact that in more stressful environments, species with lower biomass are more abundant (Franceschini et al., 2010), which leads to a primary production loss.
The 0.500 L beakers used presented low heterogeneity, because the lamp lit up the entire length of the column almost equally, on top, middle, and bottom. Such a fact lead to a lower variation of species found between different parts of the column Table 1.
Top (T), middle (M), bottom (B) and back (Bc) in number of genres.
Discussion
Considering the economic aspects of photoelectrolytic treatment, the cost of a five minutes of photoelectrolysis (according to the price of industrial kW/h) in Brazil would be about $2.17 per cubic meter. Such value is not expensive for this type of residue. Therefore, the photoelectrolytic system can be applied as either the main treatment for textile effluent, or as a complementary treatment associated to the treatments already applied in the industry.
According to Reviers (2006), the large number of Bacillarophyceae in C and T0 means that water was not toxic, as these microalgae are the major primary producers in food chains and are also used as environmental bioindicators. The column T5, despite an apparently equal biomass compared with C, presented lower incidence of these algae (Bacillariophyceae).
Nostocaceae is very sensitive to pollution (Parra and Bicudo, 1995; Franceschini et al., 2010) and was only found in the control column and also at T0, which may mean that the effluent without treatment has lower toxicity before being treated (with the consequent production of chlorine and intermediate species). The absence of Nostocaceae in columns containing effluent which passed through photoelectrolytic treatment confirms the fact that despite the color removal, the dye molecule remained in effluent along with chlorine generated during electrolysis.
All columns containing photoelectrolitically treated effluent were slightly acid after treatment (pH 6.5 on the top and 7.0 in the middle and bottom). Column T0 (with effluent without any treatment) had a pH of 4.9 on the top, and 7 in the middle and bottom leading to a presence of Chlorococaceae at T0 and T30. The Chlorococaceae prefers slightly acidic aquatic environments, and such preference may explain the absence of Chlorococaceae in column C that was made with river water without treatment (Parra and Bicudo, 1995; Reviers, 2006).
According to Reis (1984), Chlorococaceae species are typically found in polluted and acid waters. Therefore, it was not found in column C, but only in T0 and T30. Its abstinence in column T5 despite its acidity can be explained, because a species growth depends not only on ecosystem's physical and chemical properties. Once each column has a different microbiota, a possible explanation for a better development of Chlorococaceae in polluted environments (T0 and T30) could be a competitive disadvantage between Chlorococaceae and clear water species (C and T5). It also relies on interactions and ecological relations too (Odum, 1971). Another factor that might indicate effluent toxicity in T30 is the absence of many families found in the other columns.
The Microcystaceae has a preference for environments with lower light incidence, as is column T0, which had a low light diffusion due to the dye, thus promoting algae appearance. However, these algae have also been found in columns C and T5. One possible explanation is that these algae have developed among other algae and not directly on the glass surface, so they would not receive direct lighting. On column T30 there was great light penetration due to the thin layer of algae, as the effluent contained large amounts of chlorine dissolved, so Microcystaceae was found just at the bottom of the column.
The Pseudoanabenaceae appeared in a large quantity on the back of the columns and were associated with Merismopediaceae and Synetochococcaceae, forming tangles of filaments in columns T0 and T30.
It is possible to admit that the presence of chlorine generated during treatment was more stressful to the phytoplankton than the effluent without any treatment, but if compared with column C, then all the other columns had their diversity affected negatively. Phormidaceae presence in column C indicated that the environment was less stressful (less toxicity, better light diffusion) than the others due to the ecological characteristics of these algae, which were more competitive in stable environments (Franceschini et al., 2010).
Summary
Photoelectrolytic treatment presented a successful color removal in simulated wastewater containing Remazol red brilliant dye, using little treatment time (5 min). Results of ecotoxicological tests using Winogradsky columns indicated that dye solution without any treatment affected the algae population less than the solution treated for 30 min. Also, in column containing solution treated for 5 min, the population was closer to the control column (C), even though presenting a 97% color removal. This meant that 5 min treatment offers lower toxicity if compared with the other samples and removes color satisfactorily. Therefore, 5 min treatment was considered the optimum photoelectrolytic treatment time for the dye.
Footnotes
Acknowledgments
The authors would like to thank PIBIC/CNPq, CAPES, and FAPESP for supporting this work.
Author Disclosure Statement
No competing financial interests exist.