




Abstract
Abstract
Glycine-β-cyclodextrin (G-β-CD) was synthesized by the reaction of β-CD with glycine in the presence of KOH and epichlorohydrin. G-β-CD–enhanced solubilization and desorption behavior of atrazine were investigated, and the feasibility of using G-β-CD in electrokinetic (EK) removal of atrazine from contaminated soil was evaluated for the first time. Bench-scale EK tests were conducted under a voltage gradient of 2.0 V cm−1 for 10 d, and deionized water, 0.05 M Na2CO3/NaHCO3 buffer solution, 0.05 M Na2CO3/NaHCO3 buffer solution containing 2 g/L G-β-CD and 0.05 M Na2CO3/NaHCO3 buffer solution containing 10 g/L G-β-CD were used as anodic flushing solutions, respectively. Results from solubilization experiments showed that the solubility of atrazine in 30 g/L of G-β-CD was enhanced about 4.2-fold. Desorption efficiency of atrazine in soil increased with increasing G-β-CD concentration. Experimental results from EK remediation tests showed that migration and removal of atrazine in soil were significantly affected by G-β-CD concentrations and cumulative electroosmotic flow. pH control is beneficial for migration and removal of atrazine. In a test with deionized water (E1), only about 4.4% of atrazine was removed from the soil near the anode, whereas 12% of atrazine was removed using the deionized water test with pH control (E2). When G-β-CD was added to anodic flushing solution, the 2 g/L and 10 g/L G-β-CD flushing solution showed approximately 33% and 40% removal, respectively. The EK process combined with G-β-CD flushing and pH buffering may be a good remediation alternative for hydrophobic organic contaminant removal from contaminated soil.
Introduction
Electrokinetic (EK) remediation is an emerging technology that can effectively remove soluble organic pollutants from low permeability soils (Acar and Alshawabkeh, 1993). However, the EK removal of hydrophobic organic chemicals (HOCs) from contaminated soils is rather difficult due to the poor dissolution and minimal desorption efficiency. Thus, various extracting agents have been used to enhance the desorption efficiency of HOCs (Boving et al., 2000).
Recently, cyclodextrins (CDs) have received increasing attention because of their forming inclusion complex with various guest molecules with suitable polarity and dimension. So, they have been proposed as an alternative agent to enhance water solubility of hydrophobic compounds (Ko et al., 1999). In addition, CDs present several advantages over solvents and nonionic surfactants such as their lower toxicity and their higher biodegradability (Martin, 2004; Fenyvesi et al., 2005). Cyclodextrins (CDs) are cyclic oligosaccharides made up of six to eight α-
In this work, a novel, modified β-CD, glycine-β-CD (G-β-CD) with high solubility was synthesized by the reaction of β-CD with glycine in the presence of KOH and epichlorohydrin. The G-β-CD–enhanced solubilization and desorption behavior of atrazine in soil were studied. On the base of it, the performance of G-β-CD on the enhancement of EK removal of atrazine from contaminated soils was evaluated. Various EK parameters, as well as the distribution of pH and residual atrazine in the soils, were measured. This research provided valuable information on the feasibility of using solubility-enhanced EK remediation as an effective in situ remediation method for removing HOCs from contaminated soils.
Materials and Methods
Materials
The β-CD was obtained from Seebio Biotechnology, Inc. and used without further purification. Atrazine was obtained from Changxing No.1 Chemical Co., Ltd. with a purity of 99%. Glycine was analytically pure, purchased from Jingchun Chemical Reagent Co. Epichlorohydrin was obtained from Fuchen Chemical Reagent Co. All other reagents and solvents used were of analytical reagent grade unless otherwise stated. The water used throughout the work was deionized by a Milli-Q Water Purification system.
Soil characteristics and preparation of contaminated soil
An uncontaminated natural soil was collected from Fuzhou City, China; the soil was air-dried and sieved to obtain particles less than 2 mm in all experiments. The soil has a pH of 5.80 and organic carbon content of 1.82%. The contaminated soil was prepared by dissolving an appropriate quantity of atrazine in hexane, and a known weight of soil was slowly added, with continuous mixing. This slurry was thoroughly mixed, and the solvent was allowed to evaporate slowly. The contaminated soils had a final concentration of 1.10 mg/kg of atrazine, and then the dry contaminated soil was transferred into a bottle and tumbled for about a week before the experiments.
Preparation of G-β-CD
Epichlorohydrin (10 g) was added dropwise to a solution of glycine (7.5 g) and potassium hydroxide (6.7 g) in 70 mL deionized water at 50°C, and β-CD (8.0 g) was subsequently added to the solution just mentioned. The mixture was reacted at 60°C for 1 h, and pH was adjusted to about 5.5 using sulfuric acid after the solution had been cooled to room temperature. Then, ethanol (280 mL, 95%) was added to the mixture. The mixture then became composed of two phases: the top layer, a solution of salt and other small molecule compounds in 80% ethanol; the bottom layer, a solution of G-β-CD in 80% ethanol. Methanol (350 mL) was added to the bottom layer, and a white cubic crystal was obtained, the white crystal was filtered and washed by ethanol, then put in a vacuum drying chamber at 60°C. The reaction scheme for the synthesis was shown in Fig. 1.
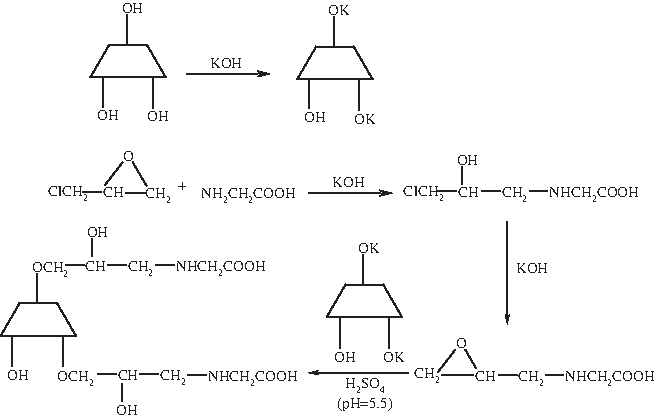
Reaction scheme for the synthesis of glycine-β-cyclodextrin (G-β-CD).
Solubilization experiments
For the solubility measurements, 10 mL of solution containing different CD concentrations were poured in 50 mL conical flasks with caps, and the solid atrazine was added in quantities in excess of the solubility limit. The conical flasks were equilibrated on a reciprocating shaker for 24 h at 25°C, and then the mixture solution was centrifuged at 3488 g for 30 min. The solubility of atrazine was determined by measuring the solution absorbance at 225 nm after being diluted with 50:50 methanol/water. The role of methanol is to decompose the CD inclusion complexes, thereby keeping the ultraviolet (UV) spectrum of atrazine unchanged (Wang and Brusseau, 1993).
Batch desorption experiments
The desorption experiments were performed in 50 mL conical flasks containing 0.1 g of atrzine contaminated soil and 10 mL of the G-β-CD solution with a concentration of 1 g/L. The conical flasks were equilibrated on a reciprocating shaker for 24 h at 25°C. After equilibration, the mixture solution was centrifuged at 3488 g for 30 min. Atrazine in aqueous solution was determined by HPLC (Shimadzu). The mobile phase was methanol/water mixture (70/30, v/v) at a flow rate of 1.0 mL min−1. The UV detector was set at 225 nm. Measurements were made in triplicate in each experiment with errors less than 5%.
EK remediation
The EK remediation test setup used in this study was shown in Fig. 2. The setup consisted of a cell, two electrode compartments (60 mL capacity), reservoirs, and a power supply. A plexiglas cylinder (internal diameter 5.0 cm×15 cm) was used as the EK cell. Perforated graphite ((internal diameter 5.0 cm×0.7 cm) was used as anode and cathode. Each electrode compartment contained a filter paper, a porous stone, and a perforated graphite electrode. Approximately 300 g of atrazine-contaminated soil was mixed with 200 mL of deionized water. The moist soil was then added into the EK cell in layers. A voltage gradient of 2.0 V/cm was applied in all tests. Parameters associated with each experiment were listed in Table 1.

Schematic diagram of electrokinetic remediation test setup.
G-β-CD, glycine-β-cyclodextrin; VDC, voltage direct current.
At the end of each test, the anode reservoir and the electrode assemblies were disconnected, and the soil specimen was extruded from the cell. The soil specimen was sectioned into five equal parts. Each part was weighed and preserved in a glass bottle and was used to analyze atrazine concentrations. In addition, pH of each soil section was also determined.
Results and Discussion
Solubilization of atrazine in CD solution
The solubilization effects of CD on atrazine are plotted in Fig. 3. The results show that the apparent aqueous solubilities of atrazine are linearly increased with increasing CD concentration. This phenomenon is attributed to the formation of 1:1 inclusion complexes (Ko et al., 1999). The linear relationship can be expressed as follows:

Solubilization curves of atrazine in
where St is aqueous-phase concentration of atrazine in the presence of CD, S0 is concentration of atrazine in the absence of CD, C0 represents the initial concentration of CD, and Kf is the stability constant of inclusion complexes for atrazine with CD, and it was used to evaluate solubilization capacity of CD for atrazine. As shown in Fig. 3, the stability constant of inclusion complex for atrazine with G-β-CD and β-CD is 0.11 and 0.060, respectively. Higher binding constant was found for atrazine with G-β-CD than with β-CD, which indicates that solubilization capacity of G-β-CD for atrazine is higher than that of β-CD for atrazine, and the solubility of atrazine in 30 g/L of G-β-CD was enhanced about 4.2-fold.
Desorption of atrazine in soil
Before the EK tests, batch equilibrium experiments were conducted to evaluate the effects of G-β-CD on the desorption of atrazine from contaminated soil. As shown in Fig. 4, the results showed that desorption efficiency of atrazine in soil increased with increasing G-β-CD concentration. When 2.0 g/L G-β-CD solution was used, the maximal atrazine desorption was obtained as about 67%. The low-polarity cavity of G-β-CD provided a capacity to increase the apparent solubility of atrazine in soil. Therefore, the desorption efficiency of G-β-CD for atrazine in soil can be improved by the increase of G-β-CD concentration.

Desorption efficiency of atrazine as a function of G-β-CD concentration. (pH=6.0 and T=25°C).
Variation of electric current and cumulative electroosmotic flow during EK process
During the EK process, the electric current was affected by the conductivity of soil pore solution, the composition of the solutions in anode and cathode compartments, and soil moisture (Yuan et al., 2006). The variation of electric current versus elapsed time was shown in Fig. 5a. The electric current value generally reached a peak at the start of testing, and the quantity of ions in the pore solution was greatest due to the dissolution of salts that were associated with the dry soil particles (Saichek and Reddy, 2003). As the ions electromigrated toward the electrodes, the current gradually declined. After approximately 216 h, a more stable or residual current value was reached. The initial current of all tests was different because of the different initial conditions.

Variation of
Comparing the results of the test with and without pH control, it can be observed that the tests (E2, E3, and E4) employing the 0.05 M Na2CO3/NaHCO3 solution commonly had higher current values, and this is most likely a result of the additional ions introduced by the Na2CO3/NaHCO3 electrolyte. When Na+ and CO32−/HCO3− ions were introduced, the CO32−/HCO3− neutralized some of the H+ ions generated at the anode by the electrolysis reaction; whereas Na+ ions electromigrated toward the cathode and increased the current. In addition, the current values of E3 and E4 were higher than those of E2; this was because more ions could be released into pore solution with the help of coordination interaction of G-β-CD containing amino and carboxyl groups (Meers et al., 2009).
The cumulative electroosmotic flow (EOF) was depicted in Fig. 5b. The flow behavior was dependent on the flushing solutions and elapsed time. For all tests, the cumulative EOF increased with increasing elapsed time. Within 240 h EK process, for the deionized water test (E1) without pH control, the maximum cumulative EOF was 250 mL; however, for tests with pH control, the maximum cumulative EOF of E2, E3, and E4 was 370, 480, and 565 mL, respectively. When compared with deionized water (E1), Na2CO3/NaHCO3 buffer solution (E2) significantly increased the cumulative EOF. It is because of this that the Na2CO3/NaHCO3 buffer solution leads to higher pH than deionized water. Higher pH leads to more negative ζ potential, resulting in the increase of the cumulative EOF (Acar and Alshawabkeh, 1993). Compared with the test with 10 g/L G-β-CD (E3), the higher cumulative EOF in the test with 2 g/L G-β-CD (E4) may be due to relatively higher dielectric constant and lower viscosity of 2 g/L G-β-CD solution. Similar results were also reported (Maturi and Reddy, 2006).
In addition, the electric current represents the transport of ions when the conductive medium has the same resistance. Higher electric current leads to faster ion transport, which results in faster transport of water by electroosmosis (Saichek and Reddy, 2003). Thus, the higher the electric current is, the higher the cumulative EOF is, and the order of the cumulative EOF is as follows: E4>E3>E2>E1.
Variation of soil pH during EK process
When voltage potential was applied to the EK cell, the electrolysis of water produces H+ at the anode and OH− at the cathode. Migration of two ion species toward the opposite electrode results in a high pH at the cathode and a low pH at the anode. For the test without pH control (E1), the H+ ions migrated through the soil all the way to the cathode region, which is evident because acidic pH values occurred along the length of the soil profiles. As shown in Fig. 6, the pH value in the soil was 3.7 near the anode and then gradually increased to 4.7 toward the cathode. However, the test conducted with pH control (E2) had somewhat higher pH values that ranged from 7.4 near the anode to 9.4 near the cathode, which indicates that Na2CO3/NaHCO3 had a larger potential to neutralize H+ produced on the anode. The pH of the tests with G-β-CD ranged from 7.5–7.7 near the anode region and from 9.5–9.8 near the cathode region. The pH in both tests (E3 and E4) was almost the same in the corresponding soil sections.
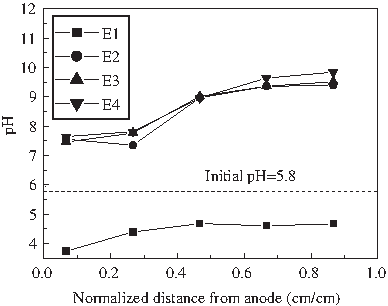
Distribution of pH in the soils.
EK removal of atrazine in soil
At the end of EK tests, the residual atrazine concentration profiles from anode to cathode were shown in Fig. 7. The deionized water test without pH control (E1) exhibited minimal atrazine migration. It was because of this that its movement by electroosmosis was rather difficult due to low solubility of atrazine in water. However, the deionized water test with pH control (E2) caused some contaminant mobilization. In my opinion, the Na2CO3/NaHCO3 buffer solution has no obvious solubilization for atrazine, but the cumulative EOF in test E2 was higher than that in test E1. Therefore, the strong flushing action through the small pore spaces was obtained in test E2, which resulted in the adsorbed atrazine particles being flushed and transferred toward the cathode because of the high cumulative EOF (Saichek and Reddy, 2003). When G-β-CD (E3, E4) was used, it was found that atrazine concentration increased gradually from anode to cathode. The values of C/C0 were below 1 in the region close to the anode, which implied that atrazine was partly removed from the soil; however, the values of C/C0 were above 1 in the region close to the cathode, which implied that atrazine was accumulated there. The maximum atrazine migration was observed in the test with 2 g/L G-β-CD solution (E4). The normalized concentration near the anode was 0.67, and it increased gradually to 1.30 in the soil near the cathode. This mobility may be due to partial solubizlization of atrazine and the increased soil-solution-contaminant interaction resulting from increased EOF. In the test with 10 g/L G-β-CD (E3), the normalized concentration of atrazine at the section near the anode was 0.60, and it increased gradually to 1.18 in the soil near the cathode. Compared with 2 g/L G-β-CD (E4), the 10 g/L GCD concentration was sufficient for the solubilization to occur, but mobilization remained minimal because of low EOF.
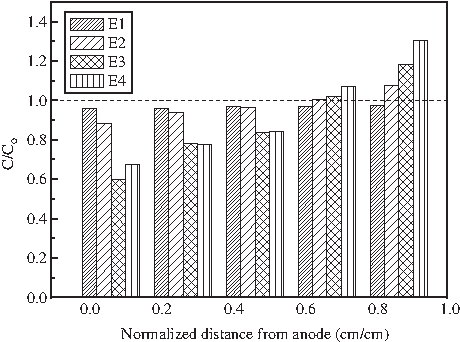
Distribution of atrazine in the soils.
At the end of each test, atrazine removal efficiency at a fixed location in the EK test was calculated from the total atrazine initial mass present in soils and the final mass in soils. For the deionized water test without pH control (E1), only about 4.4% of atrazine was removed from the soil near the anode; however, for the deionized water test with pH control (E2), the removal efficiency of atrazine was 12%. When G-β-CD was added to the flushing solution, for comparison, the 2 g/L and 10 g/L G-β-CD flushing solution showed approximately 33% and 40% removal for E4 and E1, respectively.
Conclusions
The G-β-CD has obvious solubilization for atrazine, and it could enhance desorption of atrazine in soil. Atrazine migration and removal from contaminated soils were significantly affected by G-β-CD concentrations and cumulative EOF. In a test with deionized water, little atrazine movement was observed; and only about 4.4% of atrazine was removed from contaminated soils. With G-β-CD and Na2CO3/NaHCO3 buffer solution, obvious movement of atrazine from anode to cathode across soils was observed during the EK process, particularly in the test with 10 g/L G-β-CD, nearly 40% of atrazine was removed. It was encouraging that sustained high EOF with G-β-CD solution was able to achieve great removal of atrazine from contaminated soils. The EK process combined with G-β-CD flushing and pH buffering may be a good remediation alternative for removing atrazine from contaminated soil.
Footnotes
Acknowledgments
This work was financed by the Natural Science Foundation of China (40861017, 50968001). The authors thank the anonymous reviewers for their comments.
Author Disclosure Statement
No competing financial interests exist.