




Abstract
Abstract
Recently, an increasing number of Taiwanese companies have engaged in economic, environmental, and social disclosures through sustainability reports to demonstrate social responsibility. However, the quality and the contents of information disclosure have yet to be translated into meaningful and comprehensive reports. This article proposed a framework to evaluate the quality and the contents of the voluntary information disclosure of sustainability reports in Taiwan. The proposed framework is based on the Global Reporting Initiative G3 Guideline, scorecard, and other award scoring systems that were converted into comprehensive scoring systems to evaluate 16 reports published by companies operating in Taiwan. In all, 44 indicators within 18 criteria were recognized through expert questionnaires and the fuzzy Delphi method. The fuzzy analytic hierarchy process was applied to determine the relative weightings of the 18 criteria, after which a multiple-criteria decision-making evaluation framework was launched for scoring sustainability reports. An illustrative example in the 2009 Taiwan Corporate Sustainability Reports Award is presented to demonstrate the process of choosing the best reports. Not only can the proposed model within country level assess the quality and the contents of sustainability reports, but also it can promote voluntary information disclosure in Taiwan.
Introduction
What is the trend in sustainability reporting? A survey conducted by Kolk (2003) on the Global Fortune 250 companies has shown that nonfinancial reporting has increased from 35% in 1998 to 45% in 2001. His study concluded that the largest, most visible multinationals continue to be very active in disclosing information on their environmental and social policies and/or performance. Lately, Context (2006) made an analysis of the top 100 companies from each region, namely, the United States, Europe, and the rest of the world, which showed that the number of companies making reports continues to grow. In addition, Palenberg et al. (2006) pointed out that the number of nonfinancial reporting published between 2000 and 2005 grew by only 18%, compared with a compound annual growth rate of 39% from 1992 to 2005 across various sectors and industries and in specific national contexts. According to the scenario of linear growth for key findings of their study, ∼4,100 companies will make nonfinancial reports in 2020, representing 11% of transnational corporations globally. According to KPMG (2008), nearly 80% of the Global Fortune 250 released corporate responsibility information, up from 50% in the 3 years since KPMG last conducted its survey in 2005. The rate of reporting among the 100 largest companies (N100) in 22 countries is 45% on average. Similarly, CorporateRegister (2010) has shown an increase in global sustainability reports from 26 in 1992 to expect around 4,000 in 2010. Further, the 2001 annual sustainability assessment of 996 companies (i.e., candidates for inclusion in the Dow Jones Sustainability Indexes [DJSI]) showed that approximately one-third of the companies disclosed environmental and social information covering their entire operations (Holliday et al., 2002). The number of companies engaging in nonfinancial reporting is steadily growing worldwide. Apparently, corporate sustainability reporting has increased considerably and is embraced as a corporate communication instrument, with the main aim of influencing public perception of a company and enhancing corporate image or reputation (Hooghiemstra, 2000; Daub, 2007), as well as a means of managing sustainability issues in a systematic manner (Park and Brorson, 2005).
Corporate social and environmental disclosure in developing countries is emerging, but has a relatively limited nonfinancial reporting awareness (Sobhani et al., 2009; Skouloudis et al., 2010). Likewise, Taiwan is probably not an advanced nation when it comes to information disclosure of corporate environmental and sustainability reports. Although an increasing number of companies in Taiwan publish voluntary environmental reports and of late in sustainability reports, the number of companies reporting remains insignificant compared with the total number of businesses operating in the world today. According to CorporateRegister (2010), 30 companies in Taiwan published nonfinancial reports on either social responsibility or sustainability from 2009 to 2010. There were 20 reports (67%) from the electronic industry that disclosed TBL information. Of the 20 reports from the electronic industry, only 5 reports (25%) were certified by a third party using both AA1000 Assurance Standard and Global Reporting Initiative (GRI) G3 standard, including AU Optronics Corporation, InnoLux Display Corporation, Pegatron Corporation, Taiwan Semiconductor Manufacturing Corporation, and United Microelectronics Corporation. Three companies were selected as members of DJSI, namely, AU Optronics Corporation, Taiwan Semiconductor Manufacturing Corporation, and United Microelectronics Corporation. As pointed out by Hedberg and Malmborg (2003), one incentive to corporate sustainability reporting is the DJSI, wherein companies appear according to their work on sustainability issues. In the case of electronic industry, the disclosure of sustainable information has begun to emerge in recent years. This is because the electronic industry plays a decisive role in the global information and communications technology industry (Hsu and Hu, 2009), but those firms are also suffering great pressure to information disclosure from stakeholders. Sustainability reporting therefore gives a clearer view of their proactive attitude.
As noted previously, the awareness and practices on sustainability reports in Taiwan remain at a very low level. Despite the adoption by most companies in Taiwan of the GRI Guidelines to conduct environmental or sustainability reports, their contents and quality are yet to be translated into meaningful and comprehensive reports. In light of these current limitations, the Taiwan Corporate Sustainability Reporting Award was launched by the Taiwan Institute for Sustainable Energy (TISE) in 2008 to encourage more companies to disclose sustainability information voluntarily and to improve the quality and the contents of sustainability reporting. The authors were commissioned to conduct the research project, the aim of which was to establish a framework for scoring environmental and sustainability reports as the basis for TISE to examine and score what constitutes “good” reports. Consequently, the objective of this study was to construct an appropriate evaluation framework for sustainability reports using the fuzzy Delphi method (FDM) and the fuzzy analytic hierarchy process (FAHP). The proposed framework has been applied to the 2009 Taiwan Corporate Sustainability Reports Award to promote practices and awareness on sustainability reports in Taiwan.
Literature Review
Scoring systems in corporate sustainability reporting
The main issues on the rising number of published sustainability reports are the quality and the contents of the reports. Several approaches for scoring sustainability reports have been proposed either by consultancy firms or by academic researchers (Skouloudis et al., 2009). These studies have pointed out that the rating system of corporate environmental and sustainability reports should concentrate on the breadth and the depth of the topics discussed and allows a convenient comparison between different reporting practices. These reports can also inform stakeholders in a simple but systematic manner about the efforts made by the reporting organizations.
Two forms have been recognized based on existing evaluative methodologies on corporate sustainability reporting. First, professional journals have annual reports from companies listed in stock exchange indices, and the resulting ranking becomes a strong sales argument for various business magazines (Daub, 2007). Considering the incentives for and the interest in promoting voluntary information disclosure in sustainability issues, the forms of awards for good environmental, social, and sustainability reports have increased (Daub, 2007). For example, the Association of Chartered Certified Accountants in Great Britain has been giving separate awards for the best environmental, social, and sustainability reports since 1991. Moreover, other regions have also launched various awards, such as the Sustainability Reporting Award in Germany, the Australasian Reporting Award, and the European Sustainability Reporting Award, among many others, to encourage more companies to voluntarily disclose information through sustainability reports. In the case of Taiwan, the giving of awards may also be able to help encourage firms to engage in the practice of sustainability reporting and improve the quality of information disclosure.
By considering the GRI Guidelines as the basis for establishing evaluation methodology for nonfinancial reports, Morhardt et al. (2002) converted the GRI 2002 and the ISO14031 guidelines into comprehensive scoring systems and then used them along with three existing scoring systems to evaluate the 1999 environmental and sustainability reports of the 40 largest global industrial companies. In addition, Morhardt et al. (2002) constructed a scoring system based on the first version of the GRI Guidelines (G1) to assess environmental reports. Similarly, Stratos (2005) proposed a scoring system to examine Canadian companies based on the GRI Guidelines consisting of 46 criteria within six major clusters. In the work of Clausen et al. (2005), a ranking of environmental reports was performed based on the former Institute for Ecological Economy Research rankings. This article then recognized 13 main criteria that contained environmental, social, and integrated requirements of sustainability reports. By considering the importance of the evaluation criteria, the authors multiplied the resulting value by a weighting factor and provided the main criterion's score. As later pointed out by Daub (2007), a new methodological approach that performs quantitative and qualitative analyses of corporate sustainability reporting in Switzerland, in terms of the GRI Sustainability Reporting Guidelines 2000, was presented. In his study, 33 individual criteria under four main categories were developed to overcome the weaknesses of other evaluation approaches. The most important difference among the methodological approaches is the criteria on performance indicator, which should be weighted with a factor of 2, which is a more substantial weighting. More recently, Skouloudis et al. (2010) developed a methodological system to evaluate the quality and the broadness of issues covered in Greek reports. It was based on the 2002 version of the GRI Sustainability Reporting Guidelines (G2). A numerical scoring system was devised for each of the 141 topics, as defined in part C of the GRI 2002 Guidelines. Each topic criterion was scored between 0 and 4 points, following the structure and the rationale of previous scoring systems.
Evidently, previous studies mostly adopted the GRI Guidelines as a basis for the evaluation methodology and then considered the important difference between assessment criteria. In view of the importance of objective weighting of the scoring criteria, Skouloudis et al. (2009) argued that a multiweighted scoring system requires a sound and scientifically justifiable rationale to rigorously define the relevance of individual topics and components that a TBL report should include. Although the evaluation systems proposed by Clausen et al. (2005), Stratos (2005), and Daub (2007) achieved a similar criteria-specific relative weighting, however, the important of each criterion using the multiple-criteria decision-making (MCDM) method is limited. As such, improvement of each criterion in sustainability reporting cannot be understood. To overcome the weakness of the aforementioned studies, an MCDM-based evaluation methodology is established in this study to determine the relative weight of each criterion. The methodology can clarify clearly the weakness of reports regarding each criterion and becomes a basis for firms to improve the quality of sustainability reporting.
Methodology
In this section, an evaluation framework for scoring corporate sustainability reports in Taiwan is constructed. The proposed methodology consists of three phases for scoring corporate environmental and sustainability reports in Taiwan. The first phase emphasizes the identification of criteria and the formulation of an assessment framework for nonfinancial reports based on literature review and interviews with experts. Then, the FDM technique is used to screen and fit the criteria as well as the indicators in this study. The second phase encompasses the computations involved in the FAHP and determines the relative importance of each criterion. Finally, an illustrative example from the 2009 Taiwan Corporate Sustainability Reporting Award is presented to demonstrate how good reports can be identified using the proposed method.
Fuzzy Delphi method
The Delphi method has been widely used and recognized in making predictions and in decision making since its launch in 1963 by Dalkey and Helmer at the RAND Corporation (Landeta, 2006). The Delphi method was conceived as a group technique that aims to obtain the most reliable consensus of a group of experts by means of a series of intensive questionnaires with controlled opinion feedback (Dalkey and Helmer, 1963). Despite its recognition as a valuable tool, it has some drawbacks. The tool is time consuming, and converging results through repetitive surveys is costly (Hwang and Lin, 1987; Ishikawa et al., 1993; Shen et al., 2010). Further, the problems of ambiguity and uncertainty still exist in the responses of experts (Hwang and Lin, 1987; Chang et al., 2000; Shen et al., 2010). To solve these defects, Murray et al. (1985) combined the concepts of the traditional Delphi method and the fuzzy set to alleviate the ambiguity of the Delphi method (Kuo and Chen, 2008). In addition, Kaufmann and Gupta (1988) proposed another more complete FDM procedure, in which the fuzzy set theory is used by asking participants to give a three-point estimate (pessimistic, moderate, and optimistic values). Triangular fuzzy numbers (TFNs) are then formed, and their means are computed. This study applied paired TFNs to locate three points in the extent of importance (i.e., minimum, medium, and maximum values) on a scale of 0–10 points. The same concept was adopted by Wei and Chang (2008) to calculate and depict these “group average” values. The paired TFNs were categorized into two, namely, the conservative TFN (CL, CM, CU) and the optimistic TFN (OL, OM, OU). The intersection of the fuzzy opinions of experts implies the convergence of consensus, as shown in Fig. 1. Finally, the geometric means of conservative, moderate, and optimistic values (Ci, ai, Oi) were computed to acquire the consensus values (Gi) of each item. In view of the advantages of FDM in evoking expert-group opinion, various studies (Kuo and Chen, 2008; Lee et al., 2010) have embraced the FDM in the construction of performance indicators or evaluation criteria. Some essential FDM steps are as follows (Wei and Chang, 2008; Lee et al., 2010):
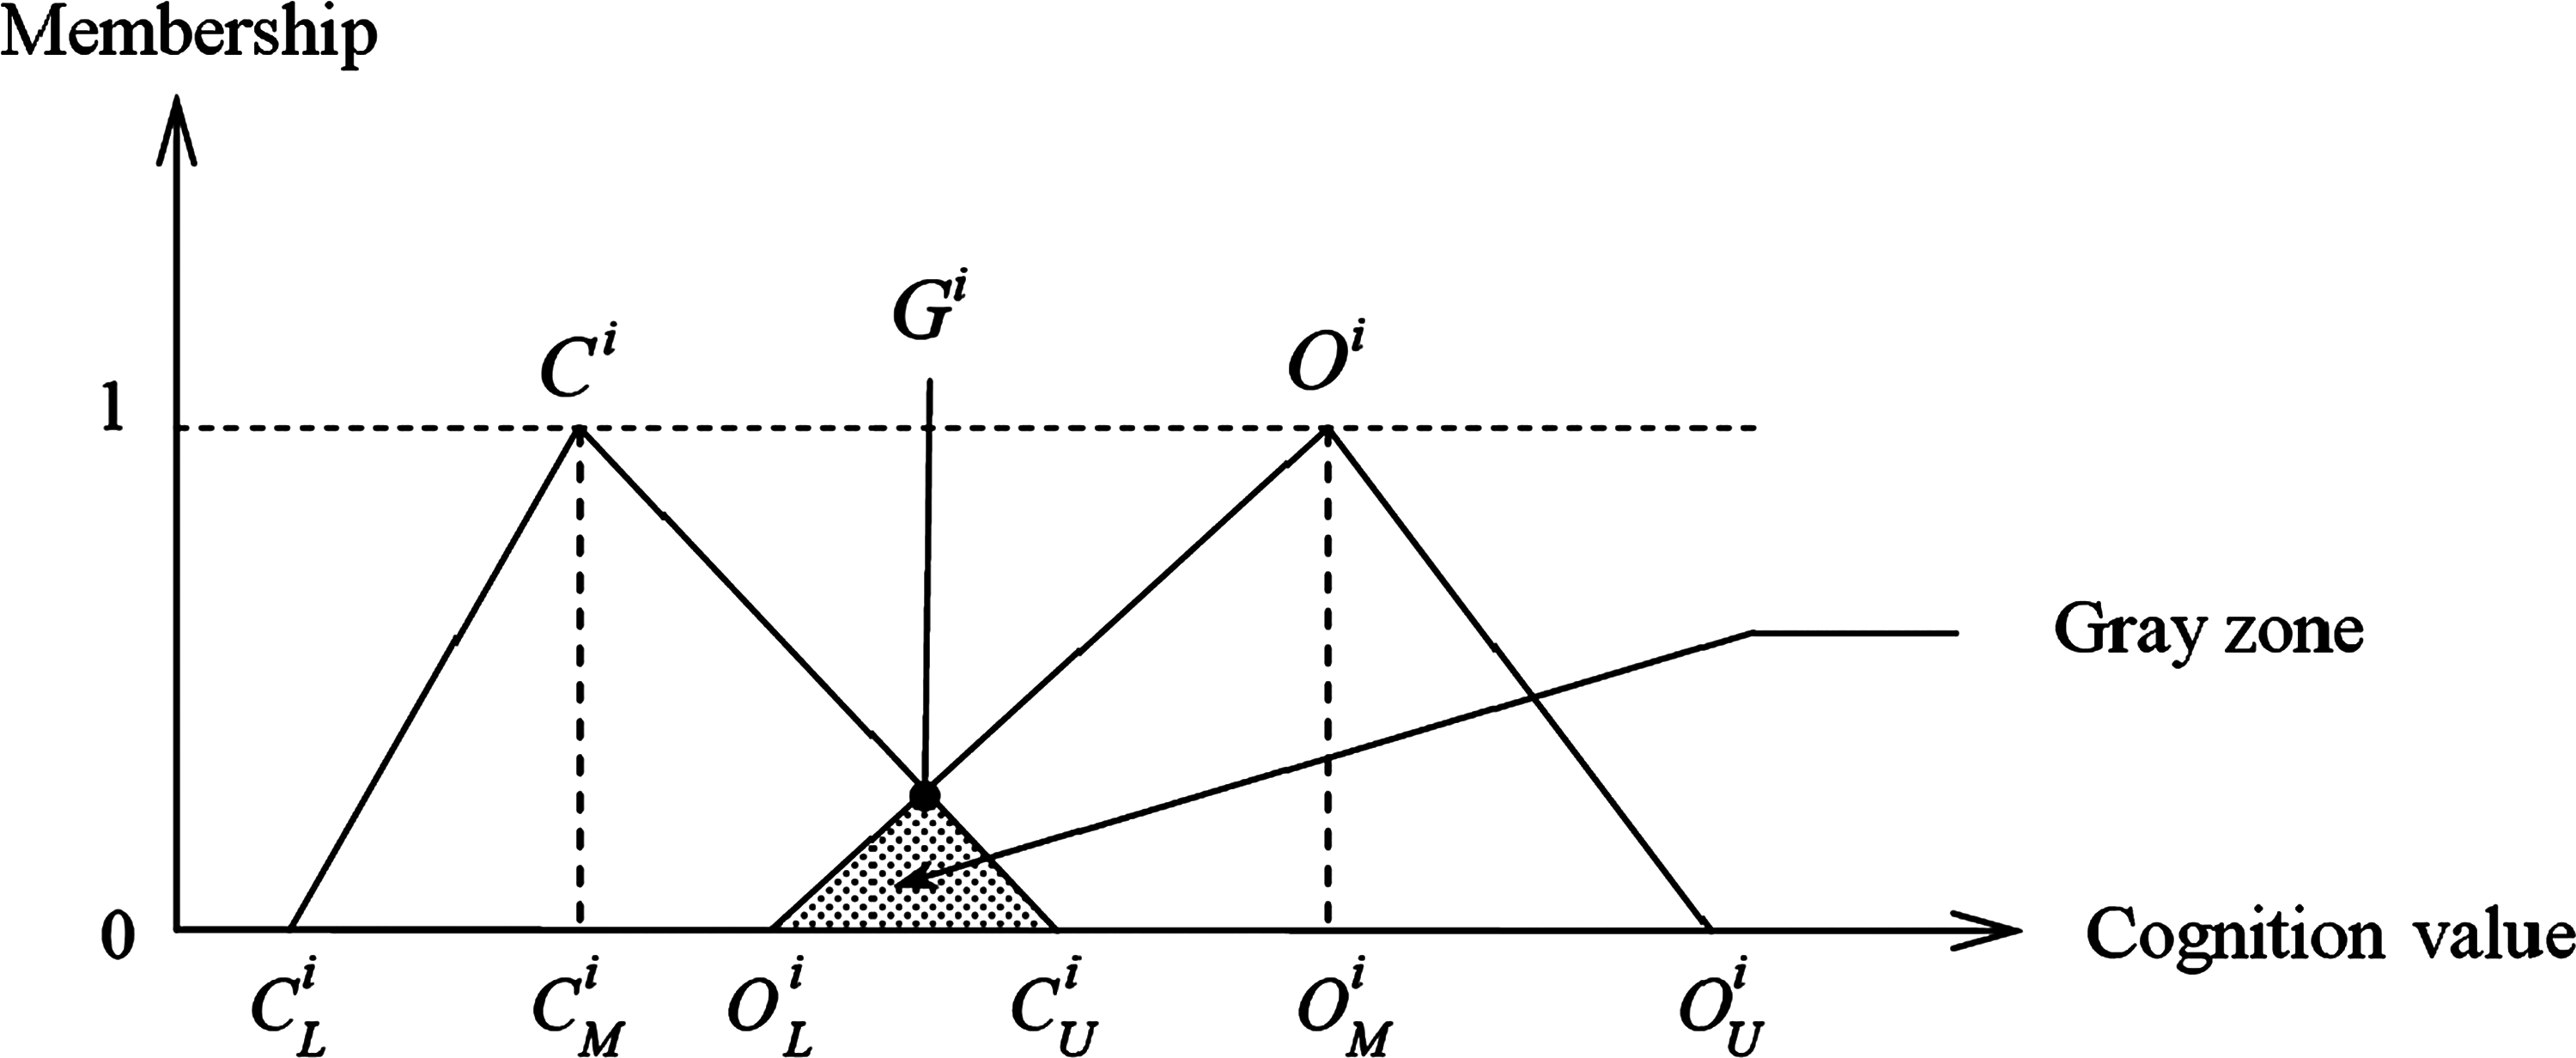
Triangular fuzzy numbers formed in the fuzzy Delphi method.
Step 1
Distribute the questionnaires and organize an appropriate panel group of experts to express their most conservative (minimum) and optimistic (maximum) values for each item in a range of 0 to 10.
Step 2
Gather the most conservative (minimum) and optimistic (maximum) values from each expert for each item, and compute the geometric mean of the expert group's opinions. A group average is calculated for the pessimistic (optimistic) index of subcriterion i, and the abnormal value, which is outside two standard deviations, is eliminated. The rest of the values, namely, the minimum (
Step 3
Determine two TFNs as the most conservative TFN
Step 4
Inspect whether the expert opinions are consistent or not and calculate the consensus significance value (Gi) for each item.
1. If the paired TFNs do not overlap (i.e.,
2. If the paired TFNs overlap (i.e.,
If the paired TFNs overlap (i.e.,
Fuzzy analytic hierarchy process
The analytic hierarchy process (AHP) introduced by Saaty (1980) shows the process of determining the priority of a set of alternatives and the relative importance of attributes in an MCDM problem (Saaty, 1980; Wei et al., 2005). The primary advantage of the AHP approach is the relative ease with which it handles multiple criteria and performs qualitative and quantitative data (Meade and Sarkis, 1998; Kahraman et al., 2004). However, AHP is frequently criticized for its inability to adequately accommodate the inherent uncertainty and imprecision associated with mapping decision-maker perceptions to extract number (Kwong and Bai, 2003; Chan and Kumar, 2007; Lee et al., 2008). It finds difficulty in responding to the preference of decision makers in assigning precise numerical values. To improve the AHP method and to determine the relative weight of criteria for risk assessment, this study applies the FAHP and uses TFNs to express the comparative judgments of decision makers. Some calculation steps are essential and are explained as follows:
Step 1: Establishing a hierarchical structure
Construct a hierarchical structure with decision elements. Decision makers are requested to make pairwise comparisons between decision alternatives and criteria using a nine-point scale. All matrices are developed, and all pairwise comparisons are obtained from each n decision maker.
Step 2: Calculating consistency
To ensure that the priority of elements is consistent, the maximum eigenvector or relative weights and λmax are calculated. Then, the consistency index (CI) for each matrix order n using equation (2) is computed. Based on CI and random index (RI), the consistency ratio (CR) is calculated using equation (3). The CI and the CR are defined as follows (Saaty, 1980):
where n is the number of items being compared in the matrix, λmax is the largest eigenvalue, and RI is a random CI obtained from a large number of simulation runs, and it varies upon the order of the matrix (Table 1).
RI, random index.
Source: Saaty, 1980.
Step 3: Constructing a fuzzy positive matrix
A decision maker transforms the score of a pairwise comparison into linguistic variables via the positive TFN listed in Table 2. The fuzzy positive reciprocal matrix (Buckley, 1985) can be defined as
where
Step 4: Calculating fuzzy weight values
According to the Lambda-Max method proposed by Csutora and Buckley (2001), the fuzzy weights of the hierarchy can be calculated. This process is described as follows:
• Let α=1 to obtain the positive matrix of the decision maker • Let α=0 to obtain the lower bound and the upper bound of the positive matrix of the decision makers, • To ensure the fuzziness of weight, two constants,
The lower bound (
• Aggregating
• Applying the geometric average to incorporate the opinions of decision makers, we have the following:
where
Case Study
The 2009 Taiwan Corporate Sustainability Reporting Award is presented here to examine the practicality of the proposed evaluation framework. A committee of 11 experts, who are familiar in the field of sustainability reporting, including two executives managers from the environmental and safety department of the manufacturing industry, three consulting experts in the field of corporate sustainability reports, four scholars in the field of corporate sustainability, and two officers of the Industrial Development Bureau of Taiwan, was formed to get each member's opinion. With a comprehensive review of literature and consultation with the committee, a draft of a proposed methodology was constructed.
Constructing an evaluation framework for corporate sustainability reports
Even if various evaluation methodologies, either in developed or developing countries, have already been launched, corporate sustainability report practices in Taiwan differ from other countries. Considering that the GRI Guidelines have been widely adopted in sustainability reports in Taiwan, we used the GRI G3 Guidelines as the main basis for constructing scoring systems. The GRI Guidelines have the broadest scope. They are also the most frequently used sets of guidelines (Lozano and Huisingh, 2010) and the best options available (Hussey et al., 2001; Morhardt et al., 2002; Lozano, 2006) for sustainability reporting. Moreover, the proposed framework is applied in the form of awards in 2009 Taiwan Corporate Sustainability Reports Award. There are other extant scoring systems that have been considered that include the scorecards of Deloitte Touche Tohmatsu (DTT) 2002 and Institute for Ecological Economy Research, the 2006 Global Reports assessment methodology from United Nations Environment Programme (UNEP)/AccountAbility, and the Association of Chartered Certified Accountants awards in evaluating the comprehensiveness of scoring systems.
To construct a scoring system based on the guidelines mentioned above, we systematically identified the scoring criteria and formulated a framework with three levels (Table 3). The first level consists of three dimensions, namely, strategy statement and report profile, management framework, and performance indicators in terms of GRI G3 Guidelines. In all, 20 criteria under these three dimensions make up the second level. The third level contains the indicators, which include 54 items.
Identifying the consistency of the evaluation framework
In line with the situation of sustainability reporting in Taiwan, a draft of the evaluation framework needs to be confirmed by experts. To identify the consistency of the evaluation criteria for scoring corporate sustainability reporting, 11 experts were invited to express their opinions. The initial 54 indicators were used as the basis for questionnaire development. The FDM technique was used to screen and fit the indicators for the purposes of this study. First, the expert group average was calculated for the conservative and the optimistic values of each measure i, and anything outside the two standard deviations was eliminated. Subsequently, the minimum (
Determining the relative weighting
Based on the opinions of the expert group, determining the relative weighting in this study was mainly focused on the dimensions and criteria because the third level of indicators was huge and complex. To determine the relative importance of the dimensions and criteria, a set of pairwise comparison matrices was translated into eigenvectors and then normalized to unify the results to acquire the vectors of priorities. The geometric mean was utilized to aggregate the pairwise comparisons for all the samples (Buckley, 1985). The normalized local and global weights of the dimensions and approaches were generated using the aforementioned procedure. The results suggested that the overall consistency of the judgments of the respondent fell within the acceptable ratio of 0.10.
Three sets of normalized weights that have been generated to determine the importance of dimensions and criteria are shown in Table 6. The second column shows the local weights with respect to the dimensions, whereas the fourth and fifth columns show the local and global weights of each criterion, respectively. The global weight of each criterion was calculated by multiplying the local weight of each criterion by the local weight of each dimension. Incorporating the analysis of FAHP evidence, we found that the local weights of each dimension demonstrate the “performance indicator” (0.435) as comprising the most important dimension for scoring sustainability reports, followed by “strategy statement and report profile” (0.350). On the other hand, “management framework” (0.215) was revealed to be the dimension with the least importance (Table 6). Moreover, the “sustainability strategy statement and commitment” (0.366), “commitments to stakeholders” (0.421), and “corporate social responsibility” (0.247) criteria were revealed to be the dimensions with the highest importance, followed by strategy statement and report profile, management framework, and performance indicator, respectively.
Local weight is derived from judgment with respect to a single criterion.
Global weight is derived from multiplication by the weight of the criteria.
Considering the global weights in Table 6, the 10 prioritized criteria for scoring corporate sustainability in Taiwan are in the following order: “sustainability strategy statement and commitment” (0.128), “corporate social responsibility” (0.107), “report boundary and data” (0.102), “commitments to stakeholders” (0.091), “accessibility and assurance” (0.083), “product responsibility” (0.069), “labor practices” (0.055), “compliance with regulations” (0.055), “human rights” (0.053), and “management signification influence” (0.049). Moreover, the resulting global weights also show that many of the 10 prioritized approaches comprise the dimension of performance indicator. The findings affirm the notion that the performance indicator plays a crucial role in scoring corporate sustainability reports.
Scoring sustainability reports in Taiwan
Finally, the evaluation framework contained 18 criteria that were broken down into three main dimensions. Note that one criterion consists of one or several indicators representing different aspects of the criteria. After 44 indicators are recognized using FDM, each indicator receives a score of between 0 and 4 points (Table 7). The end score of the assessment of the sustainability reports is calculated by multiplying the total score of the indicators under each criterion by the global weight of each criterion. Then, the total score of each expert for each sustainability report is added into the end score. Upon completion of all the assessments by the 14 experts, the companies are ranked according to the end score. By considering the broad and complex scope of sustainability reports, four experts in the economic dimension, five experts in the environmental dimension, and five experts in the social dimension were invited to organize a panel group for scoring sustainability reports.
The proposed framework for scoring corporate sustainability reports in Taiwan was used for selecting the best reports for the 2009 Taiwan Corporate Sustainability Reports Award. The purpose was not only to assess current practices of corporate sustainability reports, but also to promote and help improve sustainable information disclosure in Taiwan. Initially, 24 enterprises participated in the evaluation of the 2009 Taiwan Corporate Sustainability Reports Award. After primary election conducted by the TISE, 16 enterprises were recommended for evaluation by the 14 members of the panel of experts based on the selected evaluation criteria and indicators, because their total scores from the quality and the content of sustainability reporting were below the selected threshold or the information related to economic, environmental, and social dimension was short. Companies that wished to take part in this award had to show that their headquarters, main offices, or operations are in Taiwan. With respect to the scope of sustainability reports, the denomination of environmental; environment, health, and safety; social responsibility; sustainable development; and sustainability reports were all included in the selection for the 2009 Taiwan Corporate Sustainability Reports Award.
To understand the situation of sustainability reports in Taiwan, with respect to the aspects of report title, adopted guideline, and sector, as shown in Table 8, half of the published reports were taken from the electronic industry, including semiconductor, computer, optoelectronics, and electronic component enterprises. Of those, 11 reports used “social responsibility reporting” in its title, followed by “sustainability reporting” and “sustainable development reporting.” Almost all reports adopted the GRI G3 Guidelines in conducting and publishing nonfinancial reports in Taiwan. Evidently, the electronic industry in sustainability reports is a leading industry in Taiwan and adopts the GRI G3 Guidelines on information disclosure in accordance with the international trend in previous studies.
GRI, Global Reporting Initiative.
To evaluate the quality and the contents of sustainability reports, 16 reports were assessed under the proposed evaluation indicators from the 2009 Taiwan Corporate Sustainability Reports Award. Once the scores of the 44 indicators were calculated by multiplying the weight of the corresponding criteria, they were aggregated with the values of the 14 experts' opinions for each report. The results show that C9, with a score of 251.54, leads in this evaluation (Table 9). The overall ranking of the 16 reports has been assessed as C9>C1>C5>C16>C11>C3>C2>C8>C12>C4>C6>C13>C15>C14>C7>C10. Therefore, the best reports can be determined and used as a basis for the TISE in conferring the 2009 Taiwan Corporate Sustainability Reports Award.
Discussion
An evaluation framework for scoring corporate sustainability reports in the 2009 Taiwan Corporate Sustainability Reports Award, using the MCDM approach based on the GRI G3 Guidelines, was conducted in this study. By considering experts' opinions, FDM was applied to select the important criteria for evaluating sustainability reports in accordance with the current status of information disclosure in Taiwan. Compared with previous studies, it can obtain the most reliable consensus from a group of experts and develop a comprehensive evaluation network. An adequate number of criteria are required to reflect the difference between evaluation frameworks from each country interested in assessing its corporate sustainability reports.
By combining the AHP with the fuzzy set theory, the FAHP method was adopted in this study, which not only captures how human beings think logically but also focuses on the relative importance of the evaluation criteria for scoring corporate sustainability reports. By incorporating relative weight into the evaluation criteria, the relative importance weight of each criterion is calculated, which not only understands the difference in importance between each assessment criterion but also identifies what criteria should be given more stress in corporate sustainability reports so that more effort can be put in improving the quality of information disclosure. Moreover, by multiplying the total score of all the indicators under each criterion by the global weight of each criterion, a ranking of reports is presented. Compared with previous studies in the area of weighting for the evaluation criteria, it may have more objectivity.
Despite the proposed methodology used in this study was satisfactory, as noted previously, the framework mainly emphasized on the examination in terms of the inclusiveness of reports. The materiality and responsiveness of reports may need to be embraced in further research. Moreover, the evaluation framework was initially proposed under Taiwanese perspective on sustainability reports and may be limited in cross-country assessments. Regarding stakeholders' involvement in the evaluation procedures, the proposed methodology only focuses on specific stakeholders, such as academic, government, and nongovernmental organizations, from the experts' group. Other stakeholders were not included because their interest of transparency is still very low. This study focused primarily on the establishment of an evaluation methodology for sustainability reports. The assessment results of Taiwan's sustainability reports may be considered in future research.
Concluding Remarks
A GRI-based conceptual framework incorporating MCDM methodology in scoring corporate sustainability reports was presented. By identifying 44 indicators using FDM under 18 criteria, as well as by determining relative weights using FAHP, the proposed framework was applied to the 2009 Taiwan Corporate Sustainability Reports Award.
The main contribution of this article is the promotion of Taiwanese reports, not only for them to increase but also to do better in the coming years as well. Obviously, the number of sustainability reports participating in the Taiwan Corporate Sustainability Reports Award has increased from 16 in 2008 to 25 in 2010. Compared with previous investigations, the proposed method has the following contributions. First, a new model for scoring sustainability reports, with emphasis on the country level, has been developed. Such a framework has yet to be found in previous literature. Based on the illustrative example, this model shows its potential advantage in detecting high-quality reports in a systematic and effective way. Second, the incorporation of the FDM and the FAHP methodologies in assessing the quality and the contents of sustainability reports can hardly be found in previous studies. The proposed methodology may offer an insight on how TISE recognized the best sustainability reports in the 2009 Taiwan Sustainability Reports Award. The proposed model not only assesses the quality and the contents of sustainability reports but also promotes voluntary information disclosure in Taiwan.
Although the results obtained from this study are satisfactory, the proposed framework can still be improved. Practices on voluntary information disclosure in sustainability reports, third-party assurance, and incorporation of materiality analysis have emerged to bridge the crucial credibility gap and achieve effective communication. Therefore, considerations in the evaluation framework to improve the applicability of the proposed model may entail further research. To accomplish the trend of information disclosure in sustainability reports, the proposed framework needs to be modified regularly to help improve information disclosure in Taiwan. Further, the weights of the criteria determined in this study were based on the FAHP technique. However, for a more independent result, the analytic network process from the AHP principle is suggested because the analytic network process can capture the interdependencies between the criteria under consideration, thus allowing for more systemic analysis and comprehension.
Footnotes
Acknowledgment
The authors thank the Taiwan Institute for Sustainable Energy for financially supporting this research.
Author Disclosure Statement
No competing financial interests exist.
| Indicators | Description |
|---|---|
| Statement from the most senior decision maker | Statement from the most senior decision maker of the organization (e.g., Chief Executive Officer (CEO), chair, or equivalent senior position) about the relevance of sustainability to the organization and its strategy. |
| Key impacts, risks, and opportunities on sustainability | The reporting organization should provide two concise narrative sections on key impacts, risks, and opportunities. |
| Operational structure of the organization | Operational structure of the organization, including main divisions, operating companies, subsidiaries, and joint ventures. |
| Primary brands, products, and/or market services | The reporting organization should indicate the nature of its role in providing these products and services, and the degree to which it utilizes outsourcing. |
| Limitations on scope or boundary | The organization shall decide which entities (such as subsidiaries and joint venture organizations) whose performance will be reported while defining the report's content. |
| Data measurement techniques | Indexes and other information in the report are produced, such as the setting of benchmark year, measurement unit, and methods applied. |
| External assurance | Policy and current practice with regard to seeking external assurance for the report. |
| Comparability | Issues and information in the report shall be carefully chosen and organized while the format of the report should be consistent. |
| Management statement and framework | Governance structure of the organization, including committees under the highest governance body responsible for specific tasks, such as setting strategy or organizational oversight. |
| Linkage between compensation for members and organizational performance | Linkage between compensation for members of the highest governance body, senior managers, and executives (including departure arrangements), and the organization's performance (including social and environmental performance). |
| Mission and values statements, codes of conduct, and performance estimate principles | Internally developed statements of mission or values, codes of conduct, and principles relevant to economic, environmental, and social performance and the status of their implementation. |
| Compliance with internationally agreed standards, codes of conduct, and principles | Procedures of the highest governance body for overseeing the organization's identification and management of economic, environmental, and social performance, including relevant risks and opportunities, and adherence or compliance with internationally agreed standards, codes of conduct, and principles. |
| Employees to provide recommendations or direction to the organization | Mechanisms for employees to provide recommendations or direction to the highest governance body. |
| Stakeholders to provide recommendations or direction to the organization | Mechanisms for stakeholders and employees to provide recommendations or direction to the highest governance body. |
| Externally charters, principles, or other initiatives to subscribes or endorses | Memberships in associations (such as industry associations) and/or national/international advocacy organizations in which the organization |
| Financial performance | The economic sustainability focuses on the economic status of the organization and its stakeholders and a summary of the impact of local, national, and global economic system. |
| Business revenues, operating costs, and payments | Direct economic value generated and distributed, including revenues, operating costs, employee compensation, donations and other community investments, retained earnings, and payments to capital providers and governments. |
| Investments risks | Financial implications and other risks and opportunities for the organization's activities because of climate change. |
| Social investments | Coverage of the organization's defined benefit plan obligations |
| Personnel pay compared with local minimum wage at significant locations of operation | Range of ratios of standard entry level wage compared with local minimum wage at significant locations of operation. |
| Market presence | Policy, practices, and proportion of spending on locally based suppliers at significant locations of operation. |
| Indirect economic impacts | Development and impact of infrastructure investments and services provided primarily for public benefit through commercial, in kind, or pro bono engagement. |
| Energy use | Direct energy consumption by primary energy source. |
| Water use and releases | Total water withdrawal by source; water sources significantly affected by withdrawal of water; percentage and total volume of water recycled and reused. |
| Waste and pollution | Weight of transported, imported, exported, or treated waste deemed hazardous under the terms of the Basel Convention Annex I, II, III, and VIII and percentage of transported waste shipped internationally. |
| Air emissions or transportation emissions | Total direct and indirect greenhouse gas emissions by weight and NO, SO, and other significant air emissions by type and weight. |
| Green material | Percentage of materials used that are recycled input materials. |
| Product and service impacts | Initiatives to mitigate environmental impacts of products and services, and extent of impact mitigation. |
| Environmental laws compliance | Monetary value of significant fines and total number of nonmonetary sanctions for noncompliance with environmental laws and regulations. |
| Environmental protection expenditure | Total environmental protection expenditures and investments by type. |
| Investment and procurement practices | Percentage and total number of significant investment agreements that include human rights clauses or that have undergone human rights screening. |
| Nondiscrimination | Total number of incidents of discrimination and actions taken, including actions that the organization has adopted. |
| Labor and collective bargaining agreements | Operations identified in which the right to exercise freedom of association and collective bargaining may be at significant risk, and actions taken to support these rights. |
| Child labor | Operations identified as having significant risk for incidents of child labor, and measures taken to contribute to the elimination of child labor. |
| Forced and compulsory labor | Operations identified as having significant risk for incidents of forced or compulsory labor, and measures to contribute to the elimination of forced or compulsory labor. |
| Security practices | Percentage of security personnel trained in the organization's policies or procedures concerning aspects of human rights that are relevant to operations. |
| Community social impact and development | Nature, scope, and effectiveness of any programs and practices that manage the impacts of operations on communities, include entering, operating, and exiting. |
| Diversity and equal opportunity | Composition of governance bodies and breakdown of employees per category according to gender, age group, minority group membership, and other indicators of diversity. |
| Management relations and protection | The practice of freedom of association by the labor unions, settlement of negotiation with laborers, guarantee programs of the enterprise for the laborers, etc. |
| Health and safety | Percentage of total workforce represented in formal joint management—worker health and safety committees that help monitor and advise on occupational health and safety programs. |
| Personnel performance management, training and development | Average hours of training per year per employee by employee category. |
| Product and service impacts | Type of product and service information required by procedures and percentage of significant products and services subject to such information requirements. |
| Social responsibility | Programs to ensure conformity with laws, standards, and voluntary conventions on marketing (including advertisement, promotion, and sponsorship). |
Source: GRI. (2006). G3 Sustainability Reporting Guidelines (Amsterdam).