
Abstract
Abstract
This study provides the spatial, annual, and seasonal variations and the related human health risk assessment of PM10 in the ambient air of Yangtze River Delta Region (YRDR). Daily average PM10 concentrations of the 25 cities in this region in the previous 5 years (2005–2009) ranged from 52.8 to 112.1 μg/m3. PM10 levels showed a decreasing trend for the major cities in the YRDR during this period. PM10 mass was highest in winter (110.5 μg/m3), followed by spring (95.9 μg/m3) and summer (85.5 μg/m3), with lowest concentration in autumn (78.2 μg/m3). For the potential health risk analysis, the residents were divided into four age categories, namely, infants, children (1 year), children (8–10 years), and adults. The analysis took into account age-specific breathing rates, body weights for different age categories. Risk analyses showed that the potential health risks due to respiratory disease were highest for all age categories in Xuzhou, followed by Yancheng, Hangzhou, and Nanjing, and the citizens in Zhoushan had the lowest health risks. The new information about the relationship between health risks and air pollution in YRDR may have implications for local environmental and social policies.
Introduction
The Yangtze River Delta Region (YRDR), one of the fastest developing regions, is located in the eastern part of China and consists of Shanghai municipality, Jiangsu province, and Zhejiang province (Fig. 1). The YRDR has a total population of 147.2 million and covers an area of 211,440 km2. The Gross Domestic Product (GDP) of this region is 1055.9 billion US dollars in 2009, which accounted for more than one fifth of the country (Table 1). In this study, 25 cities in this region were included, and the locations of the cities were shown in Table 1. Although the YRDR constitutes only 2.2% of the area of China, the emissions of sulfur dioxide (SO2), nitrogen oxides (NOx), and fine particulate matter (aerodynamic diameter ≤2.5 μm [PM2.5]) accounted for 12%, 15%, and 12%, respectively, of total emissions in China in 2006, which increased by 36%, 55%, and 14%, respectively, from 2001 to 2006 (Zhang et al., 2009; Zhou et al., 2010). Satellite data showed that aerosol concentrations [both fine (radius <0.5 μm) and coarse modes (radius >0.5 μm)] are higher in eastern China than in the eastern United States (Tie et al., 2006).
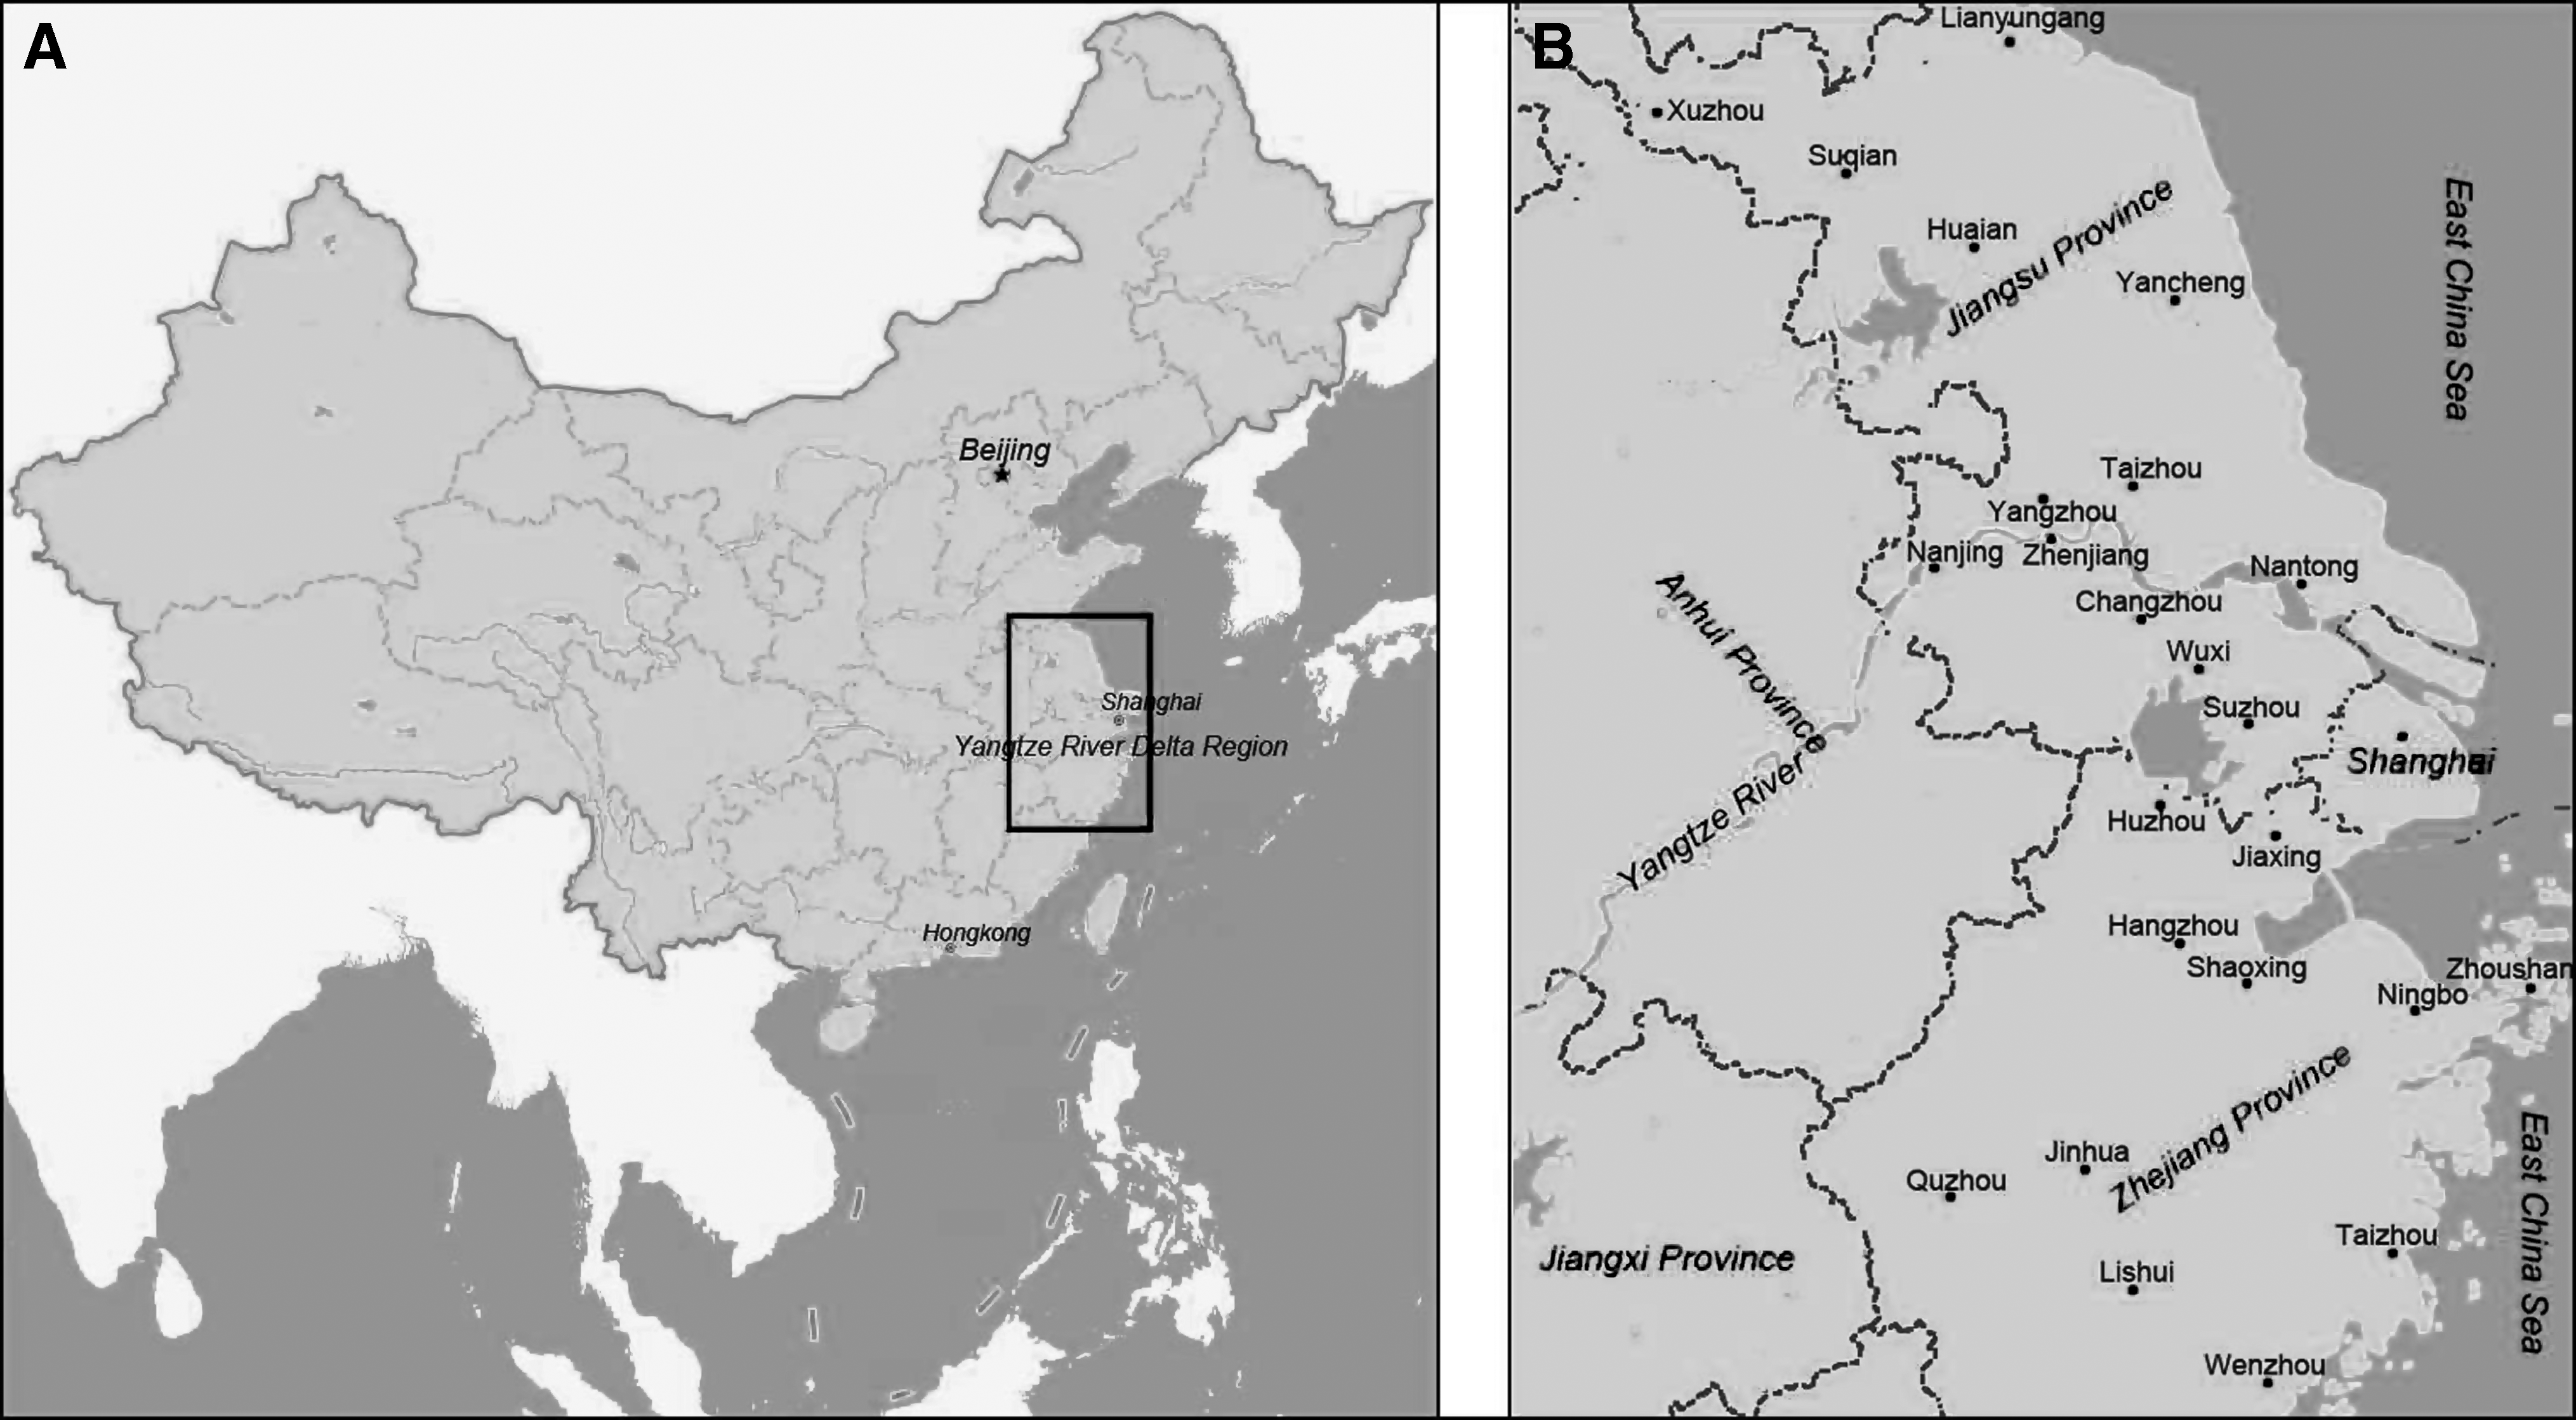
Location of the Yangtze River Delta Region (YRDR) in China
GDP, Gross Domestic Product; YRDR, Yangtze River Delta Region.
High levels of particulate matter have been linked to a number of significant health problems. Numerous studies worldwide during the past 10–20 years have confirmed that both long- and short-term exposure to particulate matters contribute to both mortality and morbidity (Venners et al., 2003; Dockery, 2009; Xie et al., 2011). Several studies have evaluated the health benefits of air pollution control in Shanghai. Kan et al. (2008) investigated the effects of outdoor air pollution on daily mortality in Shanghai. The results showed that PM10, SO2, NO2, and O3 increased cardiovascular mortality, and the pollution effects were even more evident in the cool season and among women, the elderly, and low-educational residents. Similar studies have been conducted in other parts of China. Hou et al. (2010) made an evaluation of resident exposure to respirable particulate matter and health economic loss in Beijing during Beijing 2008 Olympic Games. Xie et al. (2011) measured concentrations of PM10 and PM2.5 at 16 monitoring stations in Pearl River Delta and evaluated the human health impact of exposure to the airborne particulate matter in the region. Wang and Mauzerall (2006) quantified the total health damages from PM due to anthropogenic emissions from Zaozhuang, Shangdong Province.
Nevertheless, most of these studies were carried out through the epidemiological approach, which studied the health outcomes such as hospital admissions, disease rates, mortality, and potential mechanisms of biological effects. To our best knowledge, a few studies have studied the spatial, annual, and seasonal variations and the related human health risks of exposure to particulate matters for the residents in this region. Thus, the objectives of this study are to investigate the exposure and health risks of particulate matter in the ambient air through a risk-based approach, and to attempt to provide new information about the relationship between health risks and particulate air pollution in the YRDR, which may have implications for environmental and social policies.
Materials and Methods
Air pollution index and PM10 data
The air pollution index (API) reporting system in China is quite similar to the Air Quality Index of the AIRNow system in the United States (www.airnow.gov). Currently, only three pollutants are cited to the notification of API in China, which include PM10, SO2, and NO2. Ministry of Environmental Protection of China (MEP) is responsible for measuring the levels of the air pollutants. The API for each city, which is reported daily, converts the concentrations of the pollutants of interest into a dimensionless number from 0 to 500. To make it easier to understand, the API is divided into five categories by using a numerical index to describe the level of air pollution and the associated health concerns. These categories, air quality management recommendations, and the relationship between the concentrations of pollutants and the APIs can be found in Zhang et al. (2003), Chu et al. (2008), and Qu et al. (2010).
The study was initiated in January 2005 and continued until December 2009. We made use of 43,234 daily API records to estimate the concentrations of PM10 from the years 2005 to 2009. The results were then used to study the spatial, seasonal, and inter-annual variability of PM10 and to evaluate the related human health risks.
According to the MEP, for the days when API ≥50, the API was reported as well as the principal pollutant. From 2005 to 2009, PM10 was reported as the principal pollutant on 97.5% of the days. For the days when API <50, which accounted for 16.9% of the API records, the air quality was classified as “clean.” The principal pollutant was not reported. To calculate the PM10 concentrations when API <50, PM10 was considered the principal pollutant. It is worth noting that the approximation did introduce some uncertainty in the analysis, but considering that the particulate was the main pollutant in this region, the impact of this uncertainty should be quite limited.
For the days when PM10 was the principal pollutant, daily PM10 concentrations could be calculated from the following equation:
wherein C is the concentration of PM10; API is the API reported; APIlow and APIhigh represent API grading limits that are lower and larger than corresponding API; Chigh and Clow are the PM10 concentrations corresponding to APIhigh and APIlow (Qu et al., 2010), respectively. The method for calculating PM10 concentrations from APIs has been described and validated in detail by Zhang et al. (2003) and Qu et al. (2010).
Health risks assessment
The assessment of health risks of the population associated with inhalation exposure of PM10 was based on the estimated dose rates and the lowest observed adverse effect levels (LOAELs).
The health risks assessment is age specific. The population is divided into four age-specific categories, namely, new born, children (1 year), children (8–10 years), and adults. The dose rate for PM10 has been estimated through the following expression (Pandey et al., 2005; Kalaiarasan et al., 2009):
wherein D is the age-specific dose rate (μg/kg); BR is age-specific breathing rate (L/min); BW is age-specific body weight (kg); C (t) is the concentration of PM10 (μg/m3); and OF (t) is occupancy factor (percentage of population likely to be in the building at a given interval of time). Here, we assume the pollutant concentrations inside and outside of the buildings to be equal. Thus, OF (t) equals to 1.
LOAELs are defined as the lowest tested doses of pollutants that have been reported to cause harmful (adverse) health effects on people or animals. LOAELs for PM10 were taken from Cerna et al. (1998) as average of morbidity values.
Thus, the health risks have been defined by using the following equation (Kalaiarasan et al., 2009; Castro et al., 2011):
If the dose rate exceeds LOAEL, then there may be concern for potential health risk of residents associated with inhalation exposure of PM. Health risk (HR) is dimensionless and useful for making relative comparisons.
Results and Discussions
PM10 concentrations of the 25 cities in the YRDR
Average concentrations and spatial variations of PM10
The average PM10 concentrations of the 25 cities in the YRDR from 2005 to 2009 ranged from 52.8 to 112.1 μg/m3 (Fig. 2). The PM10 concentrations of all the 25 cities exceed the WHO guideline (20 μg/m3) and the national ambient air quality standard Grade I (50 μg/m3; GB3095-1996), and 8 cities exceed the national ambient air quality standard Grade II (100 μg/m3; GB3095-1996). Nanjing, Xuzhou, Yancheng, and Hangzhou had 109, 111, 119, and 115 days with daily PM10 ≥200 μg/m3(10 times the WHO guideline value) from 2005 to 2009.

Daily average PM10 concentrations of the 25 cities in the YRDR (2005–2009).
Moreover, the average concentrations of PM10 in Nanjing (107.3 μg/m3), Xuzhou (112.1 μg/m3), Yancheng (107.8 μg/m3), and Hangzhou (108.2 μg/m3) were higher than the other cities in the YRDR, indicating that the central and western part of the YRDR is characterized by high regional-scale particulate pollution levels. Fast developing industry, transportation, and construction in the Jiangsu province and northern part of the Zhejiang province had led to high emissions of PM10 and other pollutants, whereas the southern part of the Zhejiang province developed relatively slow. Moreover, on the occasions of high pollution episodes, particularly in winter and spring, the dominant wind is from a northerly direction and carries pollutants from north to south. Jiangsu province and northern part of Zhejiang province suffered from the pollution that had been transported from the north, especially when there were dust storms in northern China (Li et al., 2011).
The PM10 concentrations in the YRDR were similar to those reported for other populated regions of China, such as Beijing (142 μg/m3, Chan and Yao, 2008) and Guangzhou (73 μg/m3, Wan et al., 2011), but were substantially higher than those reported for big cities in Europe and North America, such as Dublin (18 μg/m3, Environmental Protection Agency Ireland, 2007) and Baltimore (21.8 μg/m3, McCormack et al., 2008). The PM10 levels were also at the higher end when compared with those in selected big cities in Asia, such as Tokyo, Japan (29 μg/m3, Tokyo Metropolitan Government Bureau of General Affairs, 2007). A recent study by Gao et al. (2010) revealed that the annual average PM10 concentration of Shanghai in 2008 was 110.0 μg/m3. It is also reported that the annual PM10 mass concentrations in Hangzhou were in the range of 46.7–270.8 μg/m3, with an annual average of 119.2 μg/m3 (Cao et al., 2009b).
Annual variations of PM10
The PM10 concentrations of Shanghai, Nanjing (capital city of Jiangsu province), and Hangzhou (capital city of Zhejiang province) decreased from 87.3, 112.1, and 112.1 μg/m3 in 2006 to 80.9, 100.6, and 97.6 μg/m3 in 2009, respectively (Fig. 3). PM10 concentrations decreased by 1.2, 2.3, and 2.9 μg/m3 per year for the three cities, whereas in the same period, they experienced rapid economic growth, with an average annual GDP growth of 12.9%, 14.6%, and 14.7%, respectively. Other cities showed similar annual variations of PM10. Taking Suzhou as an example (Fig. 3), PM10 concentration decreased from 101.3 μg/m3 in 2006 to 89.3 μg/m3 in 2009, whereas the city experienced an average annual GDP growth of 16.4% in the same period. The negative trend of PM10 concentrations in the major cities of YRDR during 2005–2009 suggested the government's efforts to reduce pollution, although the PM10 levels were still very high when compared with those big cities in Europe and North America. These efforts included reducing stationary emissions (eliminating some small coal fired power plants, and managing heavy pollution industries), substituting natural gas for coal, controlling mobile source emission from vehicles, improving road conditions, and increasing urban vegetative cover (Chan and Yao, 2008; Fang et al., 2009; Qu et al., 2010).
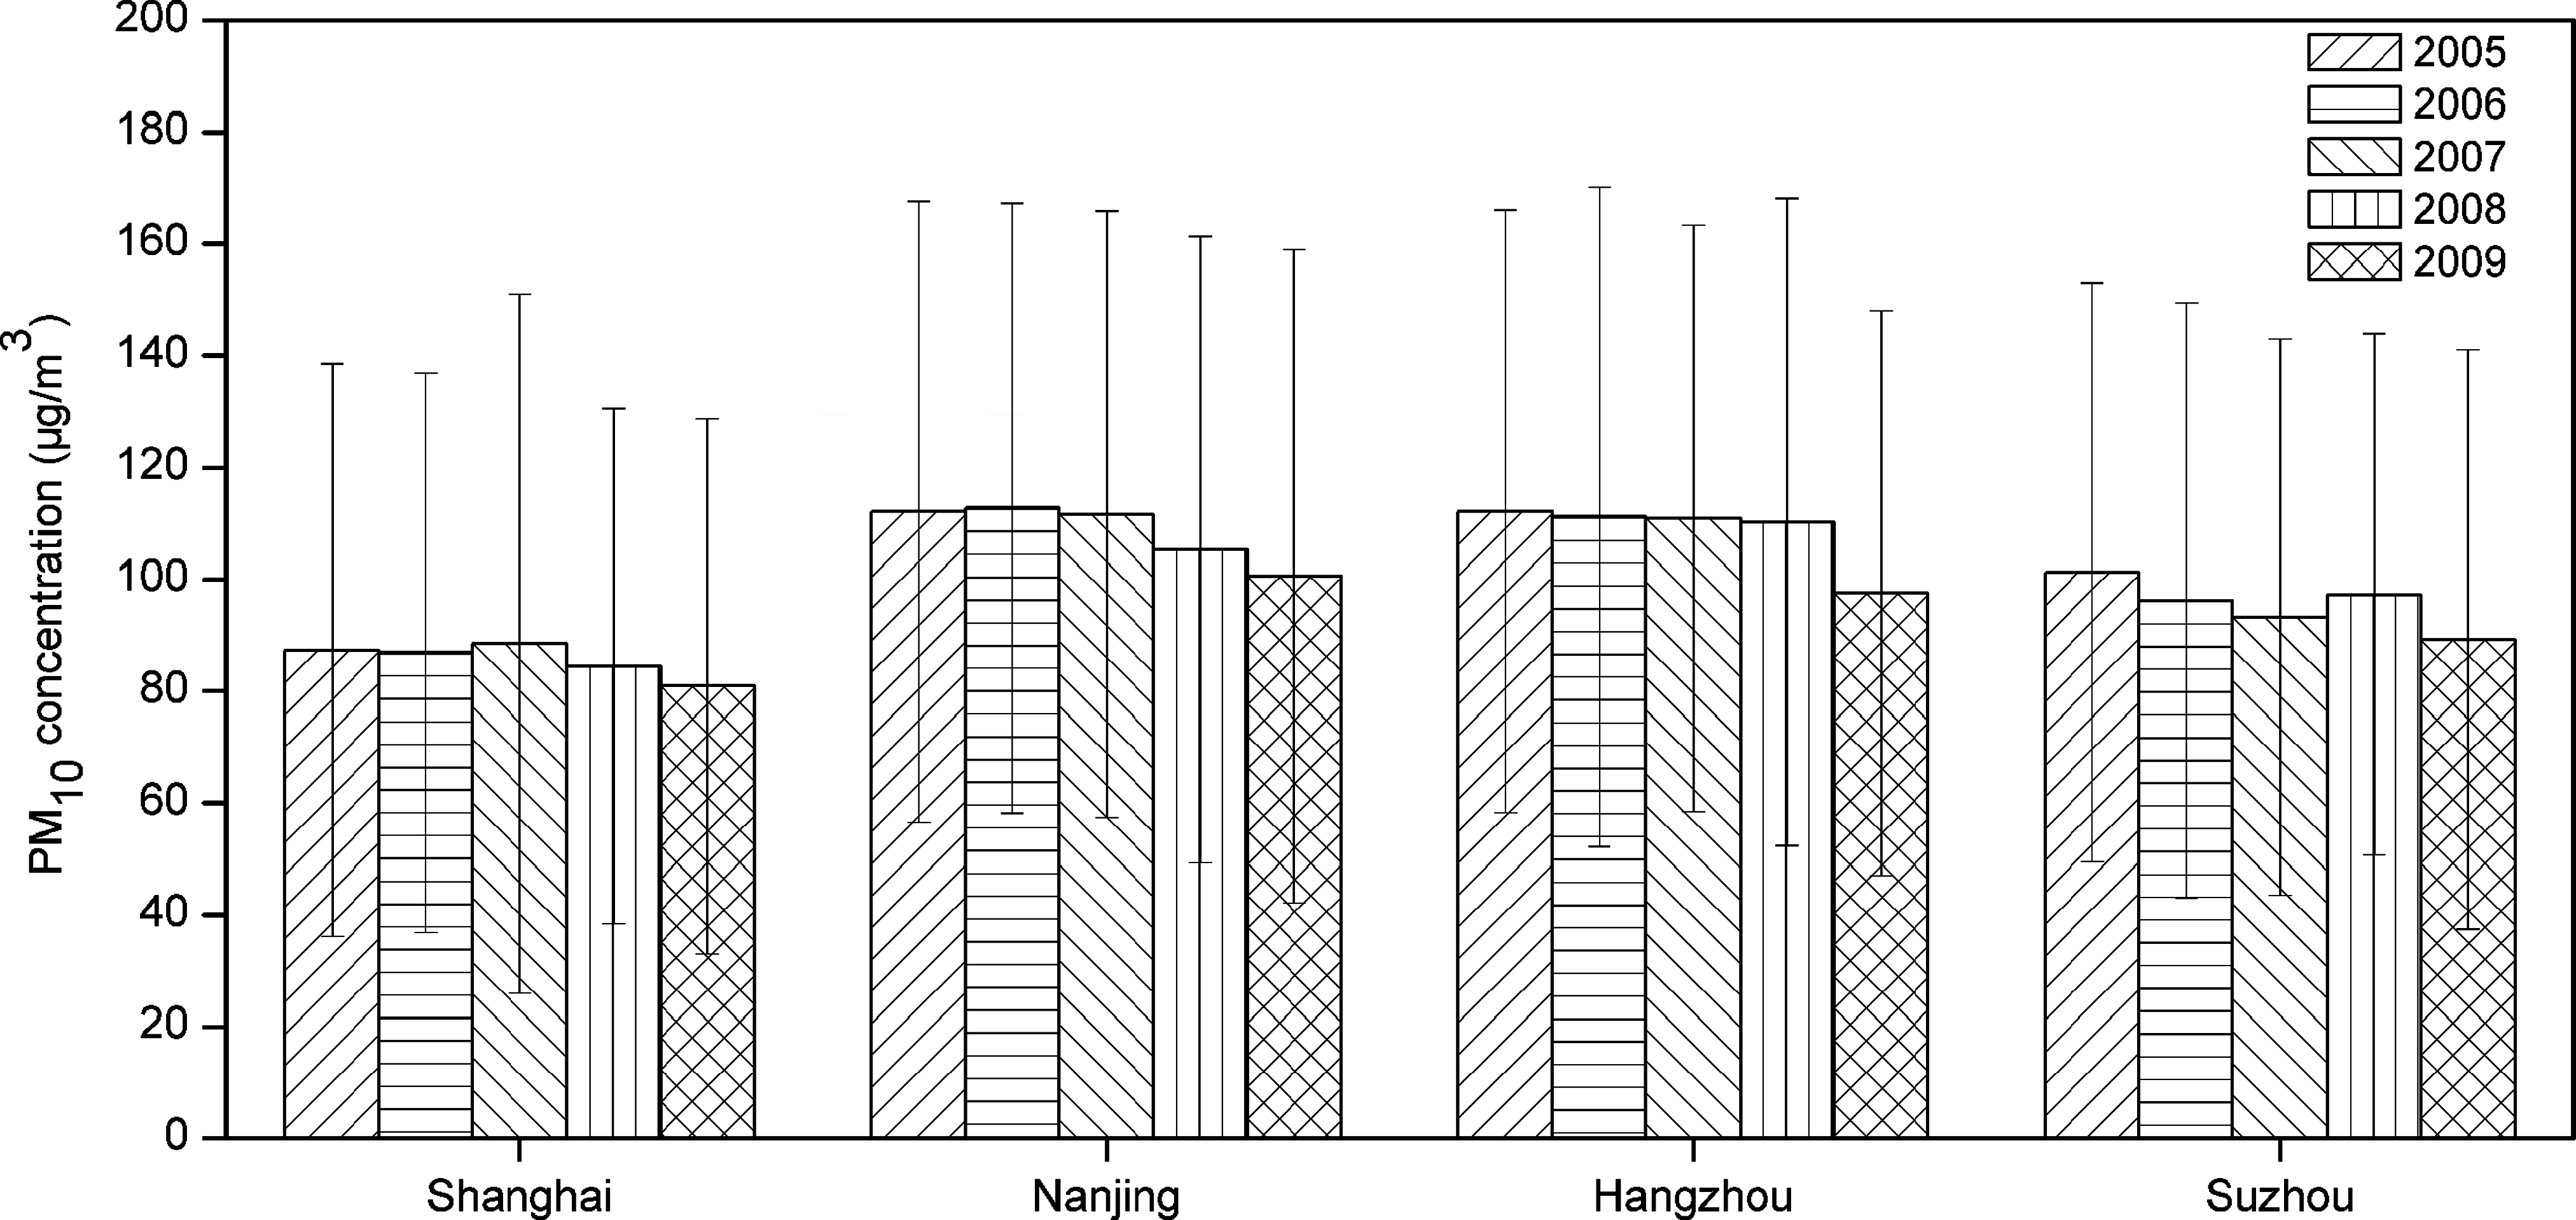
Annual variations of PM10 Shanghai, Nanjin, Hangzhou, and Suzhou.
Seasonal variations of PM10
Seasonal variations of PM10 are shown in Fig. 4. PM10 mass was highest in winter in the YRDR (110.5 μg/m3), followed by spring (95.9 μg/m3) and summer (85.5 μg/m3), with lowest concentrations in autumn (78.2 μg/m3). Among the 25 cities, the highest PM10 concentrations were 133.6 μg/m3 in Hangzhou for winter period, 122.8 μg/m3 in Xuzhou for spring, 113.0 μg/m3 in Yancheng for summer, and 95.2 μg/m3 in Suqian for autumn (Fig. 4). The relatively high PM10 level in Hangzhou could be attributed to both natural and anthropogenic sources. Hangzhou is one of the most massively industrialized and urbanized regions in South China. The atmospheric structure of this city is relatively stable, and temperature inversion often occurs in late autumn and winter. The increases in motor vehicles, urban construction, heating installation, and industrial combustion also contribute to the increase of PM10 levels (Cao et al., 2009b). Xuzhou, Suqian, and Yancheng, which are located in the northwestern and middle parts of Jiangsu Province of China, have established many different industries, such as mining, metallurgy, electric power, and engineering. Nearly 90% of energy that sustains these industries comes from coal combustion (Huang et al., 2009). High PM10 concentrations in winter in the YRDR may be due to the combustion of fossil fuels for domestic heating and more frequent occurrences of stagnant weather and intensive temperature inversion during the colder months. These could result in the accumulation of atmospheric particles and lead to high PM levels (Xia, et al., 2006; Chan and Yao, 2008). High PM10 concentrations in spring were probably due to dust events. Zhoushan is the cleanest city among the 25 cities in the YRDR. Zhoushan is situated along the coast of the East China Sea (Fig. 1). Fishery is the most important industry for this city, with less industrial pollution. In general, PM10 concentrations tend to be higher in the middle and northern part of the YRDR in winter and spring, which could result in higher health risks for the local residents in these periods.
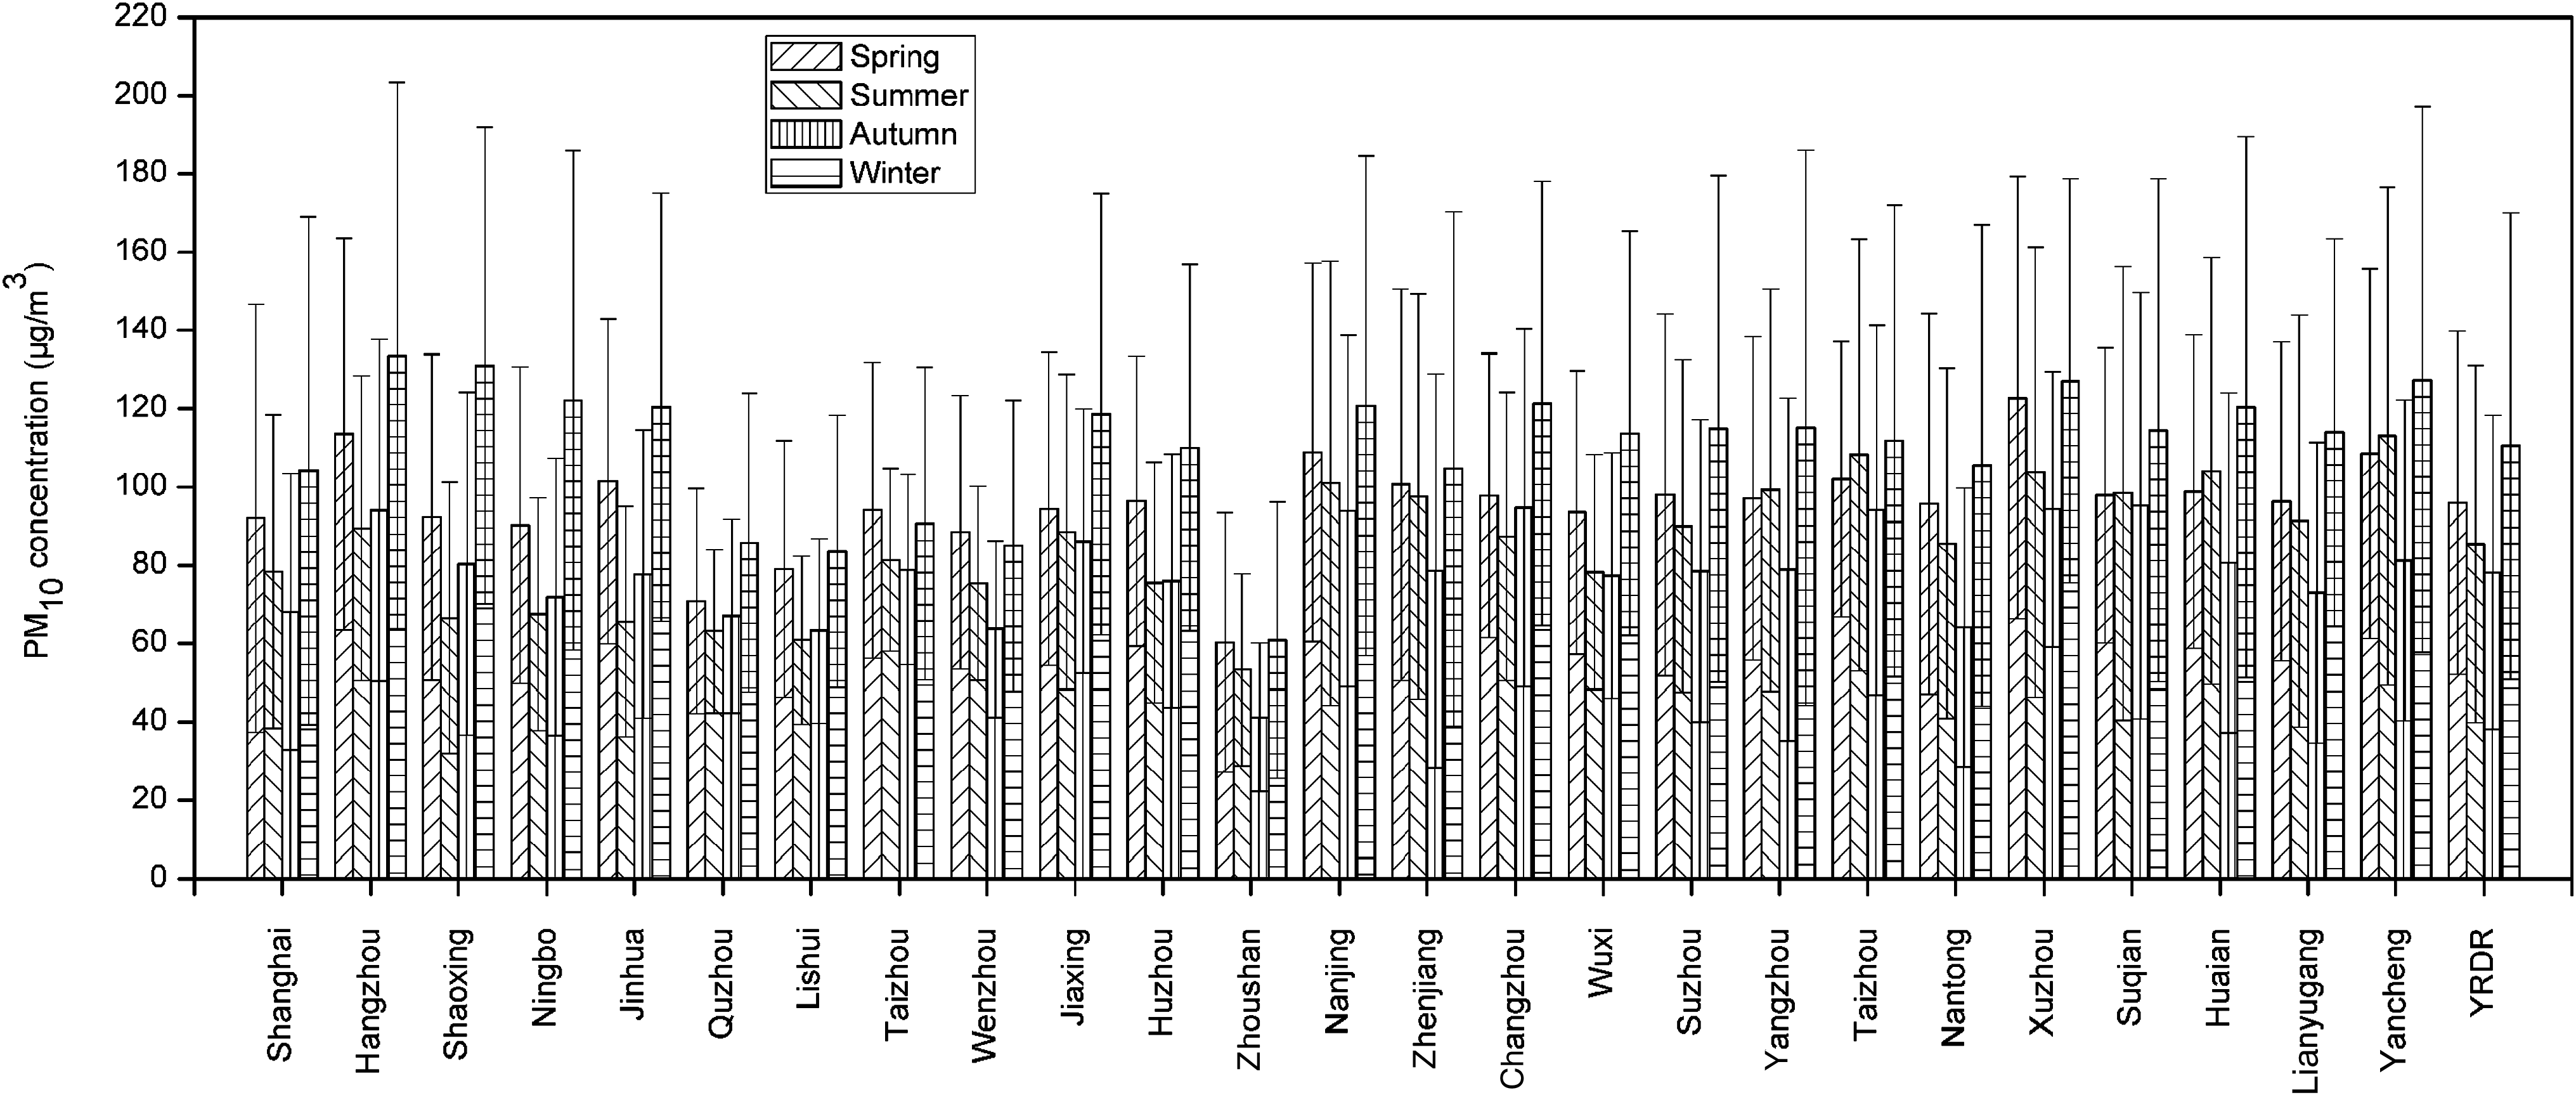
Seasonal variations of PM10 in the 25 cities of YRDR.
Assessment of health risks associated with PM10 in the YRDR
Dose rates and HR values for four age groups for the 25 cities in the YRDR are shown in Table 2. The analysis shows that the potential health risks to respiratory disease were highest for all age categories in Xuzhou, followed by Yancheng, Hangzhou, and Nanjing, and the citizens in Zhoushan have the lowest health risks. The HR values indicate that the citizens in Xuzhou, Yancheng, Hangzhou, and Nanjing had 2.11, 2.04, 2.04, and 2.02 times more risk in terms of developing respiratory diseases when compared with residents living in Zhoushan for all age categories. The HR values are not likely to decrease, as the PM10 population in YRDR remains at the same level in recent years. It has been found that high PM10 levels were associated with increased hospital outpatients and emergency room visits in the YRDR. A series of epidemiological studies on air pollution and health effects ranging from mortality, morbidity to functional changes have been conducted in this region. In Shanghai, a 10 μg/m3 increase in concentrations of PM10 corresponded to a 0.11% increase of outpatient visits, 0.01% increase of emergency room visits (Cao et al., 2009a), and 0.23% increase of cardiovascular hospital admission (Chen et al., 2010). The results also showed that ambient PM10 had acute and chronic effects on mortality, morbidity, clinical symptoms, lung function changes, and so on. Coal has been and is still the major source of energy in the YRDR, constituting about 75% of all energy sources; consequently, air pollution in the region predominantly derives from coal smoke, with PM10 and SO2 levels (Chen et al., 2004). However, with the rapid increase in the number of motor vehicles in recent years, ambient air pollution in large cities in the YRDR has changed from the conventional coal combustion type to the mixed coal combustion/motor vehicle emission type. The level of vehicle emission control technology, one of the most important aspects that affect the vehicle emission level, is much lower than that in developed countries (Zhang et al., 2008). Accordingly, vehicle emission factors of NOx and CO in China are very high. Thus, high PM10, SO2, NO2, and CO levels could have combination adverse health effects on the residents in the YRDR.
HR, health risk.
Limitations, uncertainties, and assumptions
Particles with different sizes deposit in different sections of the human respiratory system and have various effects on human health. Fine particles such as PM2.5 have been found to be more strongly related to adverse health effects than particles that are not size fractionated, such as total suspended particulates and PM10. Unfortunately, PM2.5 measurements by municipal environmental protection bureaus have not become routine throughout China, and historical PM2.5 data are not available for most of the cities in the YRDR. PM2.5 concentrations can be approximately estimated based on the observed PM2.5/PM10 ratio. In China, this ratio ranged from 0.32 to 0.83 (Wei et al., 2001; Huang et al., 2002; Wang et al., 2009). This ratio can represent the relative content of the fine fraction (PM2.5) in PM10. The main reason for the difference of the ratio is the meteorological, geographical, and topographic characteristics for cities in different areas of China. Therefore, directly applying the PM2.5/PM10 ratio to estimate the PM2.5 concentrations of the 25 cities in the YRDR will pose significant difficulties and uncertainties.
The estimation of health risks in this study was based on the outdoor air pollution. However, people spend ∼90% of their time indoors (Monn, 2001). Theoretically, the indoor level depends on the outdoor level, the air exchange rate, the penetration factor, the decay rate, the emission due to indoor sources, and indoor volume. Thus, the estimation of indoor PM10 levels is done with great difficulty. Therefore, we focus on the health risks for the residents when staying outdoors, and the estimation of health risks based on the indoor PM10 levels in the YRDR still remains to be further investigated. Despite the limitations and uncertainties, our study may provide new information on air-pollution-related health effects in the YRDR, which may have reference significance for the other parts of China.
Conclusion
This study provides the assessment of the exposure and health risks of PM10 in the ambient air in YRDR. The daily average PM10 concentrations in the previous 5 years (2005–2009) of the 25 cities in the YRDR ranged from 52.8 to 112.1 μg/m3. The annual PM10 concentrations in the YRDR decreased, which indicated an overall improvement of the air quality in this region. PM10 mass was highest in winter, followed by spring and summer, with lowest concentrations in autumn. The risk analysis shows that the potential health risks to respiratory disease are highest for all age categories in Xuzhou, followed by Yancheng, Hangzhou, and Nanjing.
Footnotes
Acknowledgments
The authors wish to thank the reviewers of this article for their thoughtful suggestions and valuable insights. This work was financially supported by National Natural Science Foundation of China (No. 21177087) and the Shanghai Environmental Protection Bureau (SEPB) (No. 09-26).
Author Disclosure Statement
No competing financial interests exist.