




Abstract
Abstract
Water content measurement of municipal solid waste (MSW) is critical to water balance analysis of landfill, leachate collection and recirculation, and acceleration of MSW degradation. Time domain reflectometry (TDR) is commonly applied to soils for the measurement of water content. Application of TDR methods for moisture measurement in MSW is difficult, because MSW is a heterogeneous and highly conductive material. This study investigated the application of TDR surface reflection method for the determination of apparent dielectric constant and water content of MSW. A series of experiments were conducted to study the dielectric properties of MSW and its main components such as paper, plastic, and organics. Results indicate that the effect of waste material type seems to be negligible on the measurement of water content. TDR technique can effectively measure the intrinsic water of organics in the absence of significant bound water effects. Results of dielectric constant by surface reflection method gave similar accuracy as the conventional travel time analysis for waste materials with low electrical conductivities. In addition, surface reflection method provides higher accuracy for waste materials with high electrical conductivities than travel time analysis. This research provides experimental basis for the use of TDR surface reflection method in landfills.
Introduction
Electromagnetic (EM) techniques, including time domain reflectometry (TDR) (Li and Zeiss, 2001; Staub et al., 2010) and time domain transmissivity (TDT) (Masbruch and Ferré, 2003), correlate propagation time of EM wave with the dielectric constant of test media. Sensors are relatively inexpensive, and automated measurement is possible. However, the test results are affected by changes in electrical conductivity. TDT measures the time of propagation for an EM wave along a given length of a transmission line in a medium. TDR is a technique based on the EM properties of soil-air-water mixtures, which allows for in situ soil water content measurements and is relatively fast, convenient, accurate, and nonradioactive. It has been widely accepted as a reliable technology for the measurement of water content in soils (Topp et al., 1982a, 1982b). However, in situ moisture measurement with TDR in MSW materials is very difficult because of the heterogeneity of the solid waste materials and the leachate present in waste materials (Li and Zeiss, 2001). The high electrical conductivity of the leachate in landfill makes travel time analysis to be challenging, if not impossible, due to significant energy attenuation. Moreover, the travel time of EM wave increases with increasing electrical conductivity of pore water (Hook et al., 2004), which results in the overestimation of water content. Insulating the TDR probes with a dielectric coating is an effective way to reduce the energy attenuation (Ferré et al., 1996; Li and Zeiss, 2001; Persson et al., 2004; Staub et al., 2010). However, coated probes will not measure the average water content for conditions of axially varying water contents along the probes because of the dependence of the sensitivity on the soil water content (Ferré et al., 1996). It also results in the reduced sensitivity and the loss of information of the electrical conductivity (Chen et al., 2009). In addition, the abrasion and peeling off of the coating are problems during field application. Recently, TDR surface reflection methods were developed for the measurement of dielectric constant in highly conductive soils (Chen et al., 2007, 2009). The dielectric constant can be determined with reasonable accuracy from the surface reflection coefficient at the junction of the air gap and the test sample even for soils with high electrical conductivities, where the conventional travel time analysis fails. However, there is no published report of the application of TDR surface reflection method on water content measurement of waste materials.
This study explores the accuracy and feasibility of the surface reflection method applied in measuring water content of MSW. The relationships between dielectric constant (Ka) and volumetric water content (θ) of MSW materials are to be determined and compared with present relationships used in soil and MSW.
Background of TDR Measurement for Water Content
TDR is an EM technique that measures the travel time of a fast rise step voltage pulse traveling along a transmission line. Figure 1 shows the principle of TDR measurement, including the step pulse generator, data acquisition system, coaxial cable, and measurement probe. The step pulse propagates along the coaxial cable and probe as EM wave. The multiple reflections at the interfaces of impedance mismatches are recorded by the data acquisition system. The dielectric constant and the electrical conductivity (Ec) are calculated from the recorded signal, which can be used to acquire the water content and the conductivity of the test medium.
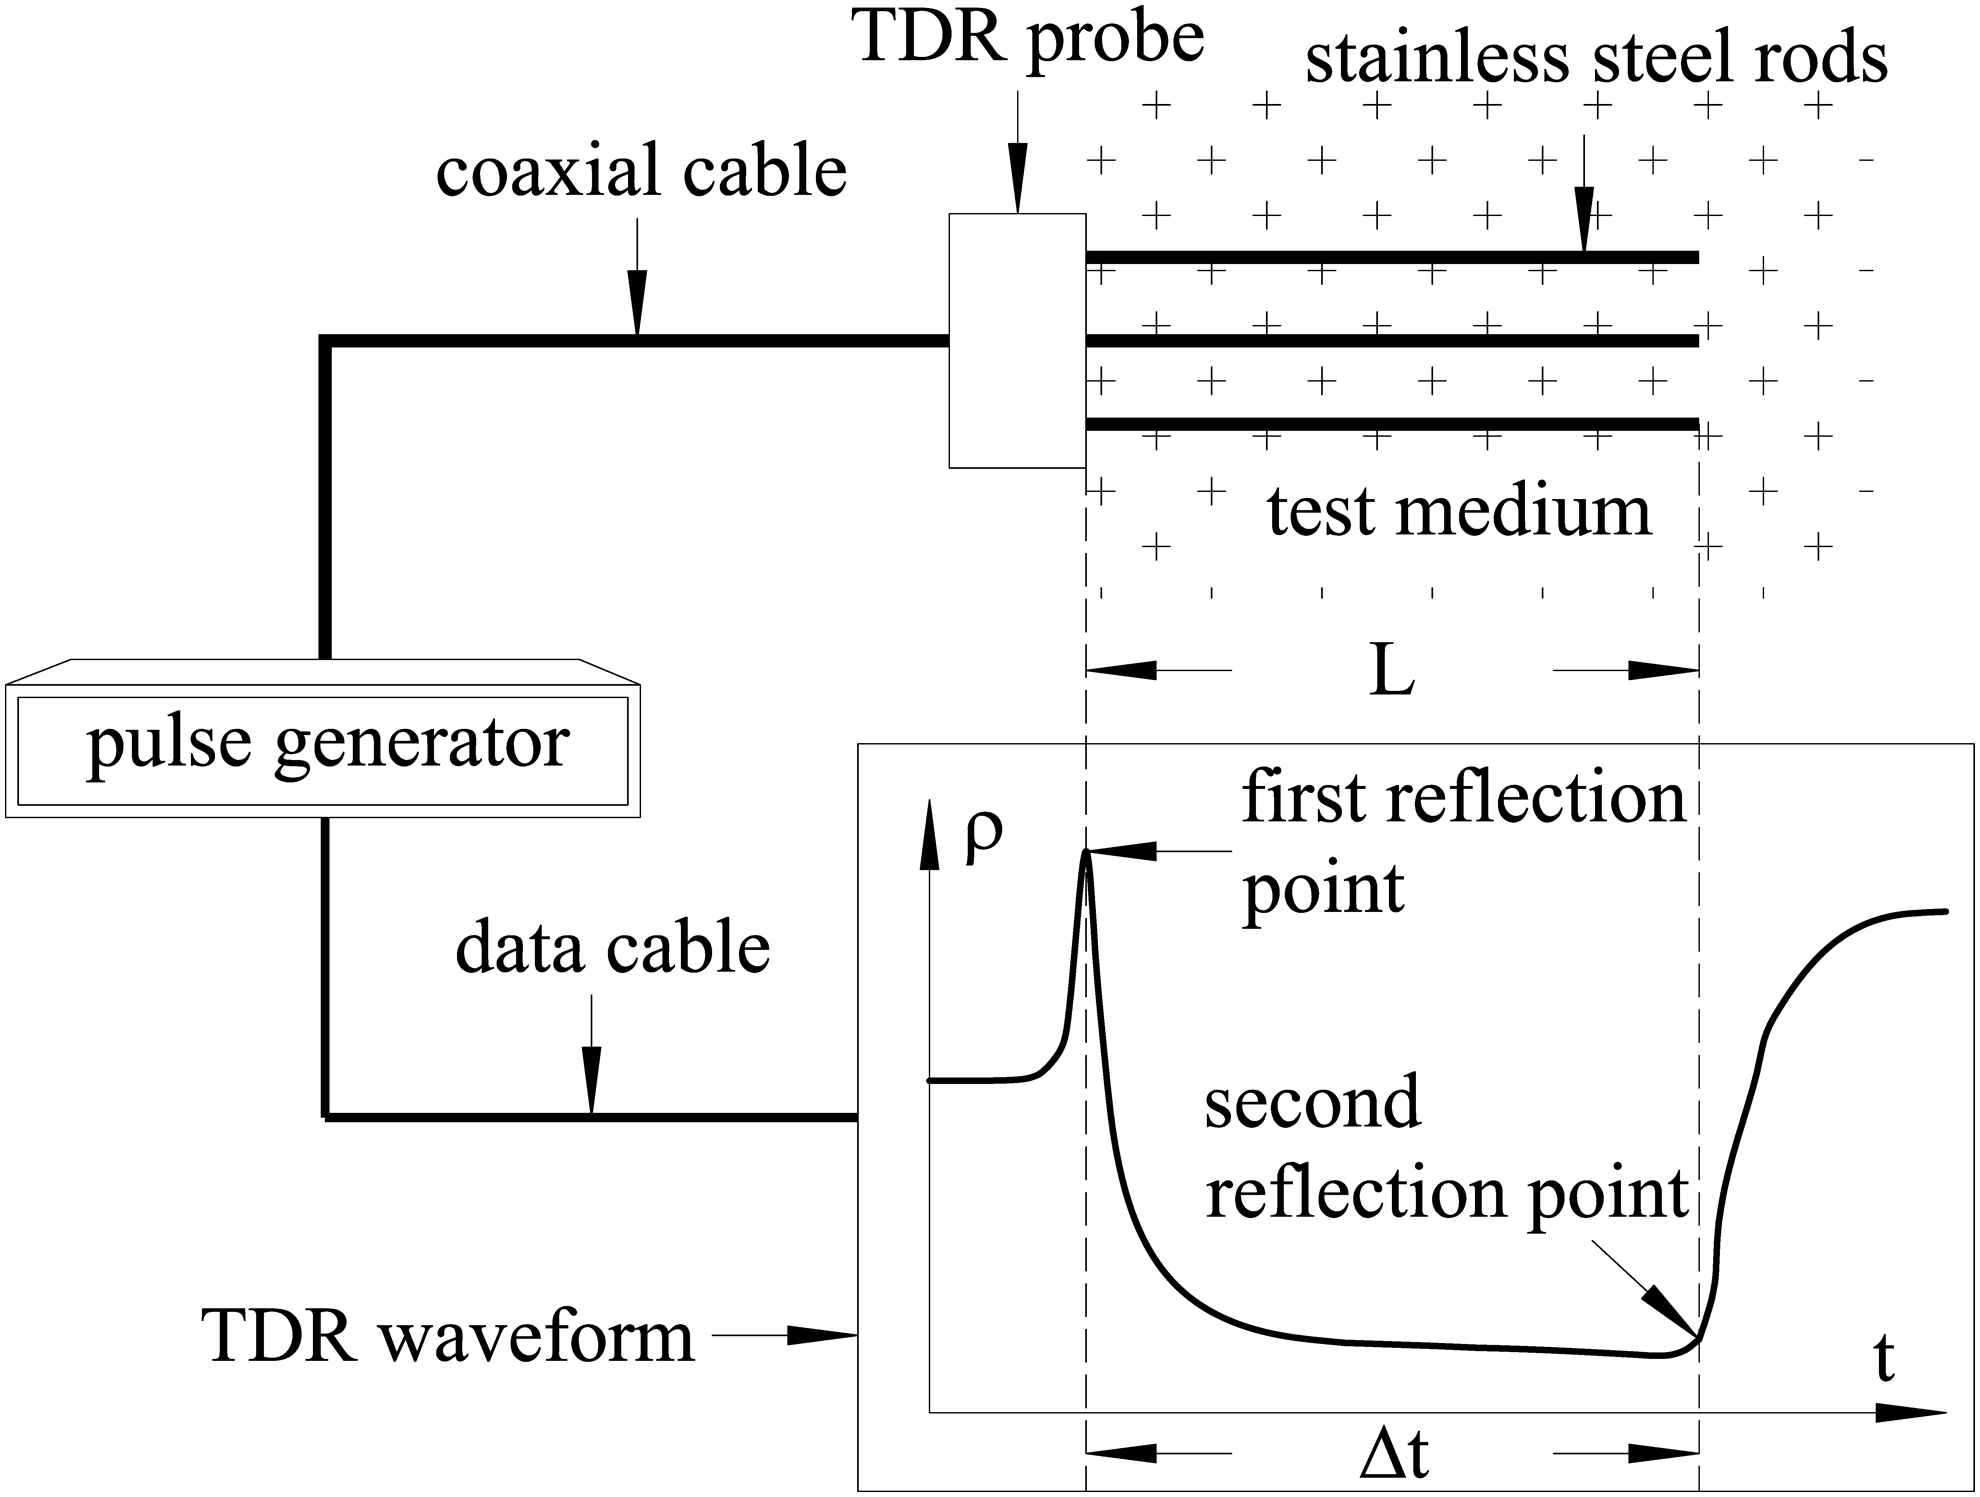
Principle of time domain reflectometry (TDR) measurement.
Apparatus of TDR
The TDR system used in this article include TDR100® tester, coaxial head, mold probe, and extension rods. Signal processing and acquisition was done with TDR100 tester from Campbell Scientific and its associated software PC-TDR®. The coaxial head sits on the cylindrical mold probe, which is formed by a cylindrical metal mold as the outer conductor and a metallic rod as the inner conductor. The mold is similar to a standard compaction mold but with a nonmetallic end plate. In order to separate the EM wave reflections at coaxial head and the surface of test sample, four 300 mm long extension rods were used to increase the length of air gap. The schematic diagram of the system is given in Fig. 2. When using travel time method, the coaxial head sits on the mold probe directly. To use surface reflection method, the extension rods are added between coaxial head and mold probe to increase the length of air gap. Figure 3 shows the TDR waveform measured in deionized water with and without the extension rods.
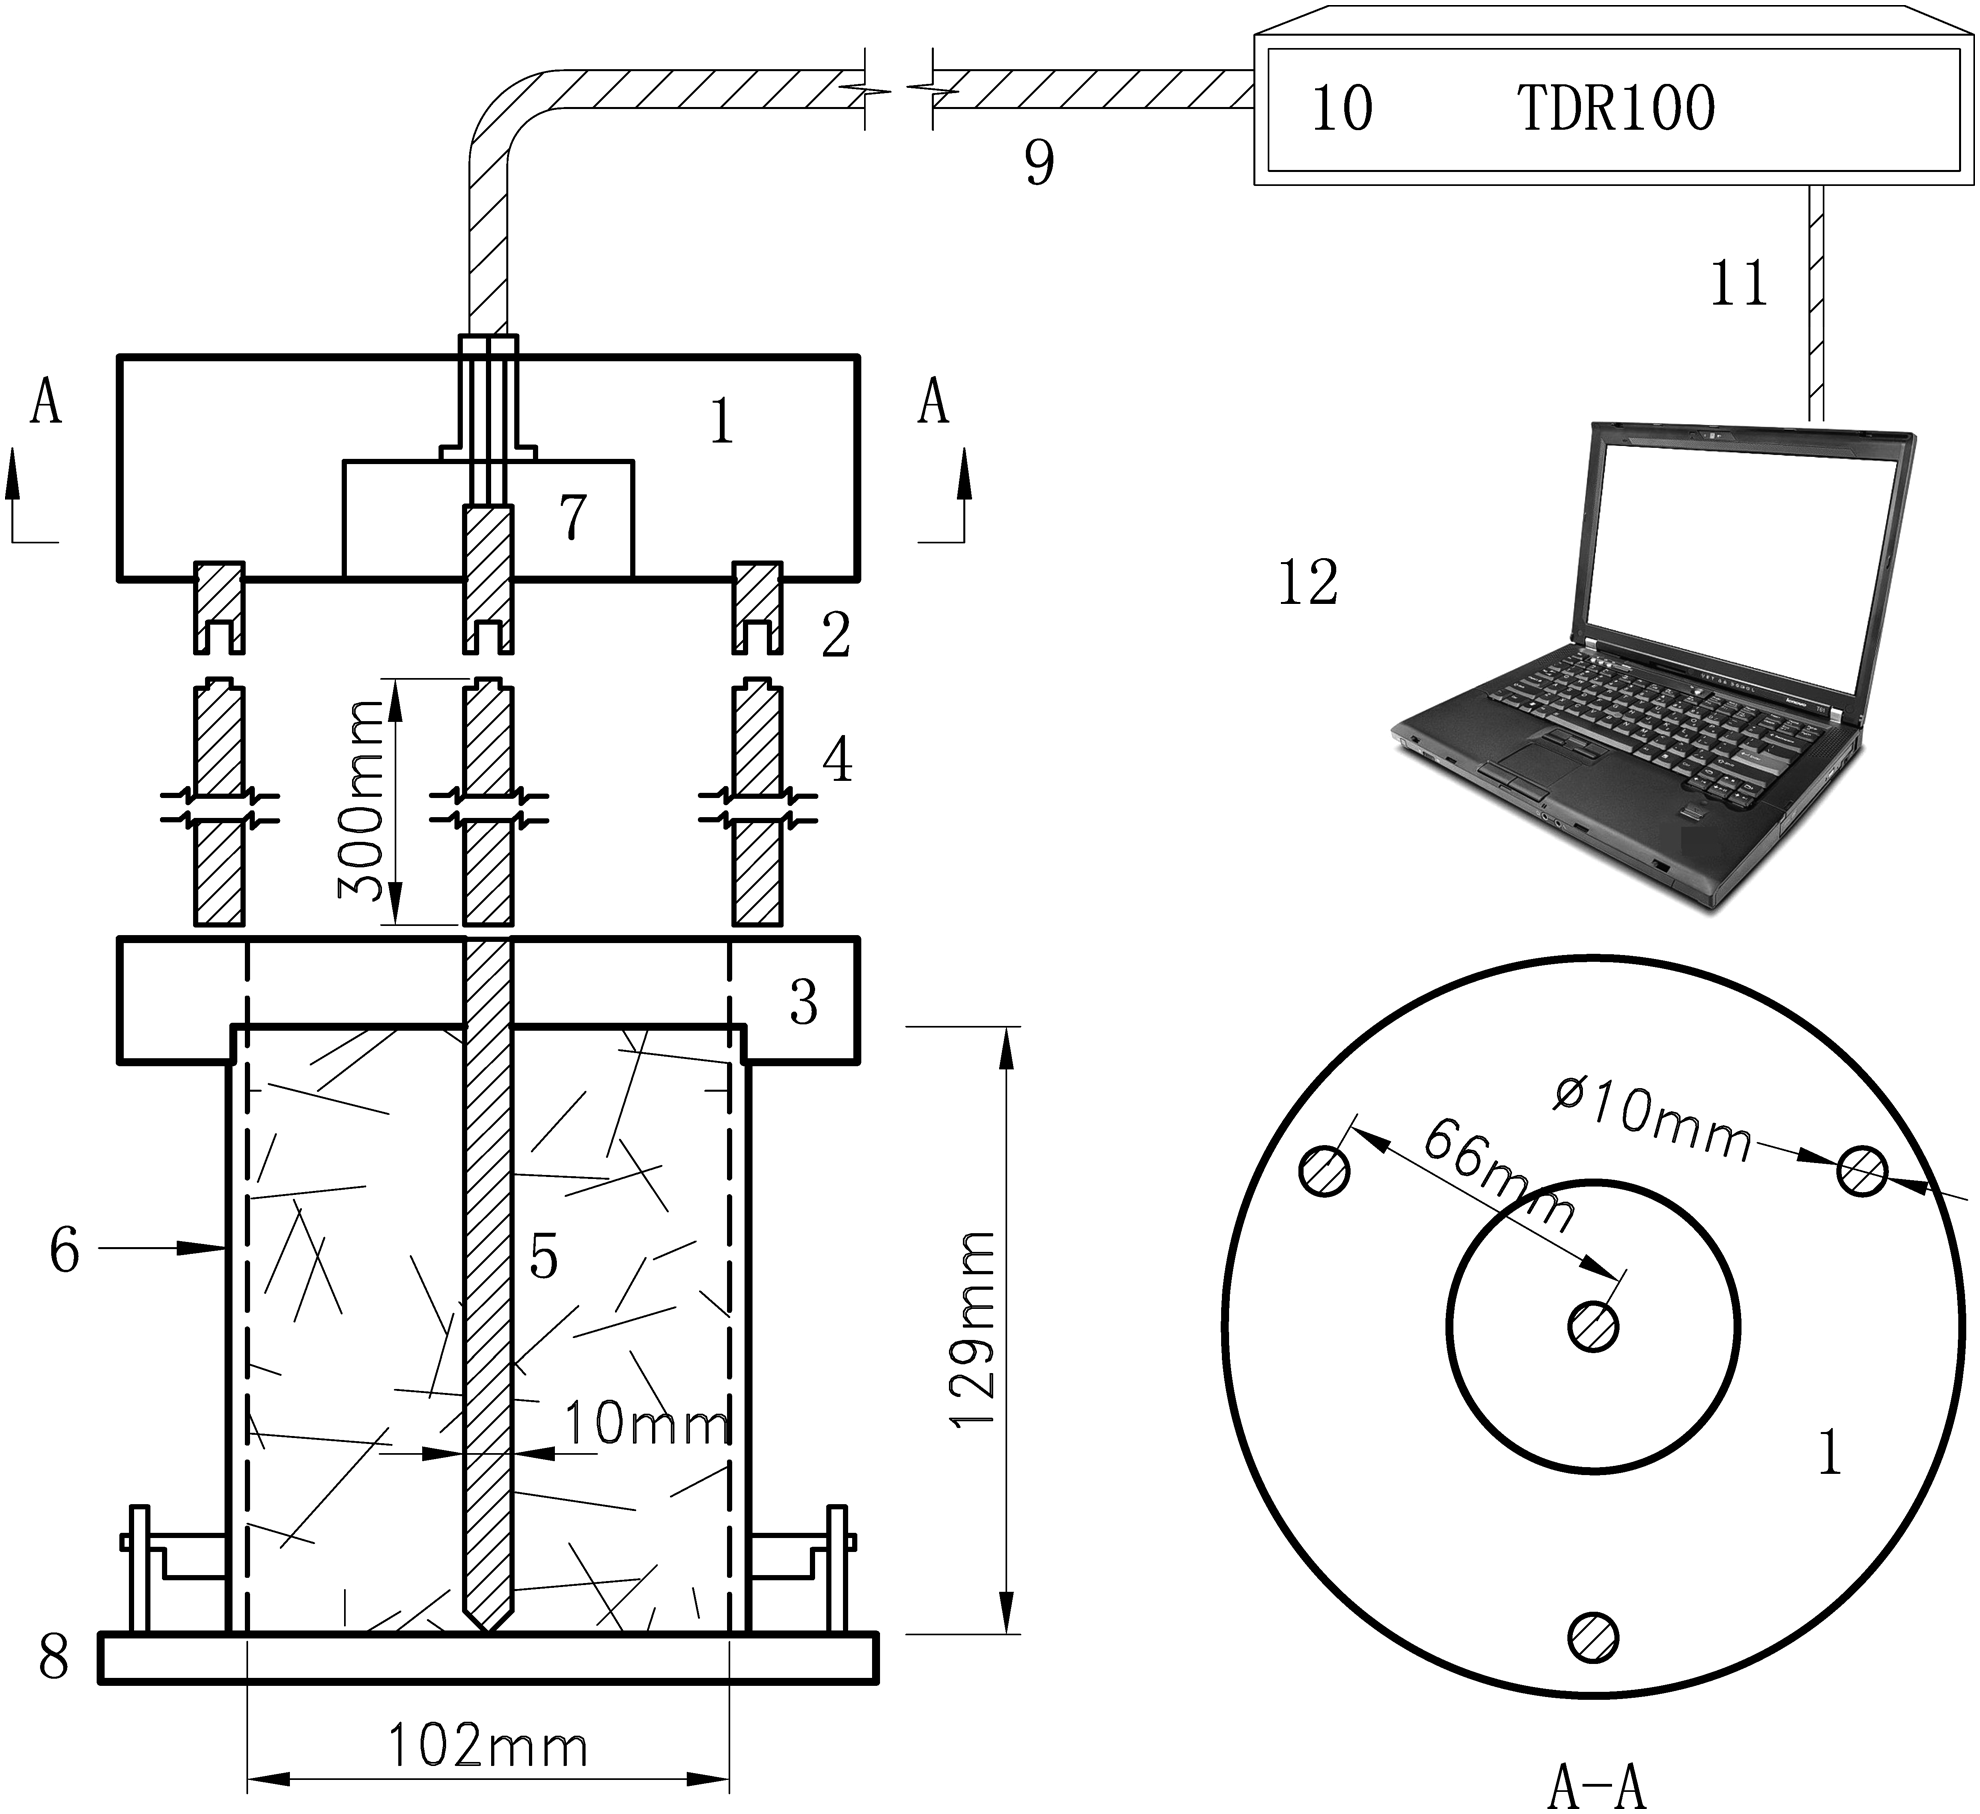
TDR system. 1, coaxial head; 2, studs; 3, stainless ring; 4, extension rods; 5, center rod; 6, metal mold; 7, Delrin as insulating material in coaxial head; 8, Delrin as base of mold; 9, coaxial cable; 10, TDR100 pulse generator; 11, data cable; 12, computer.
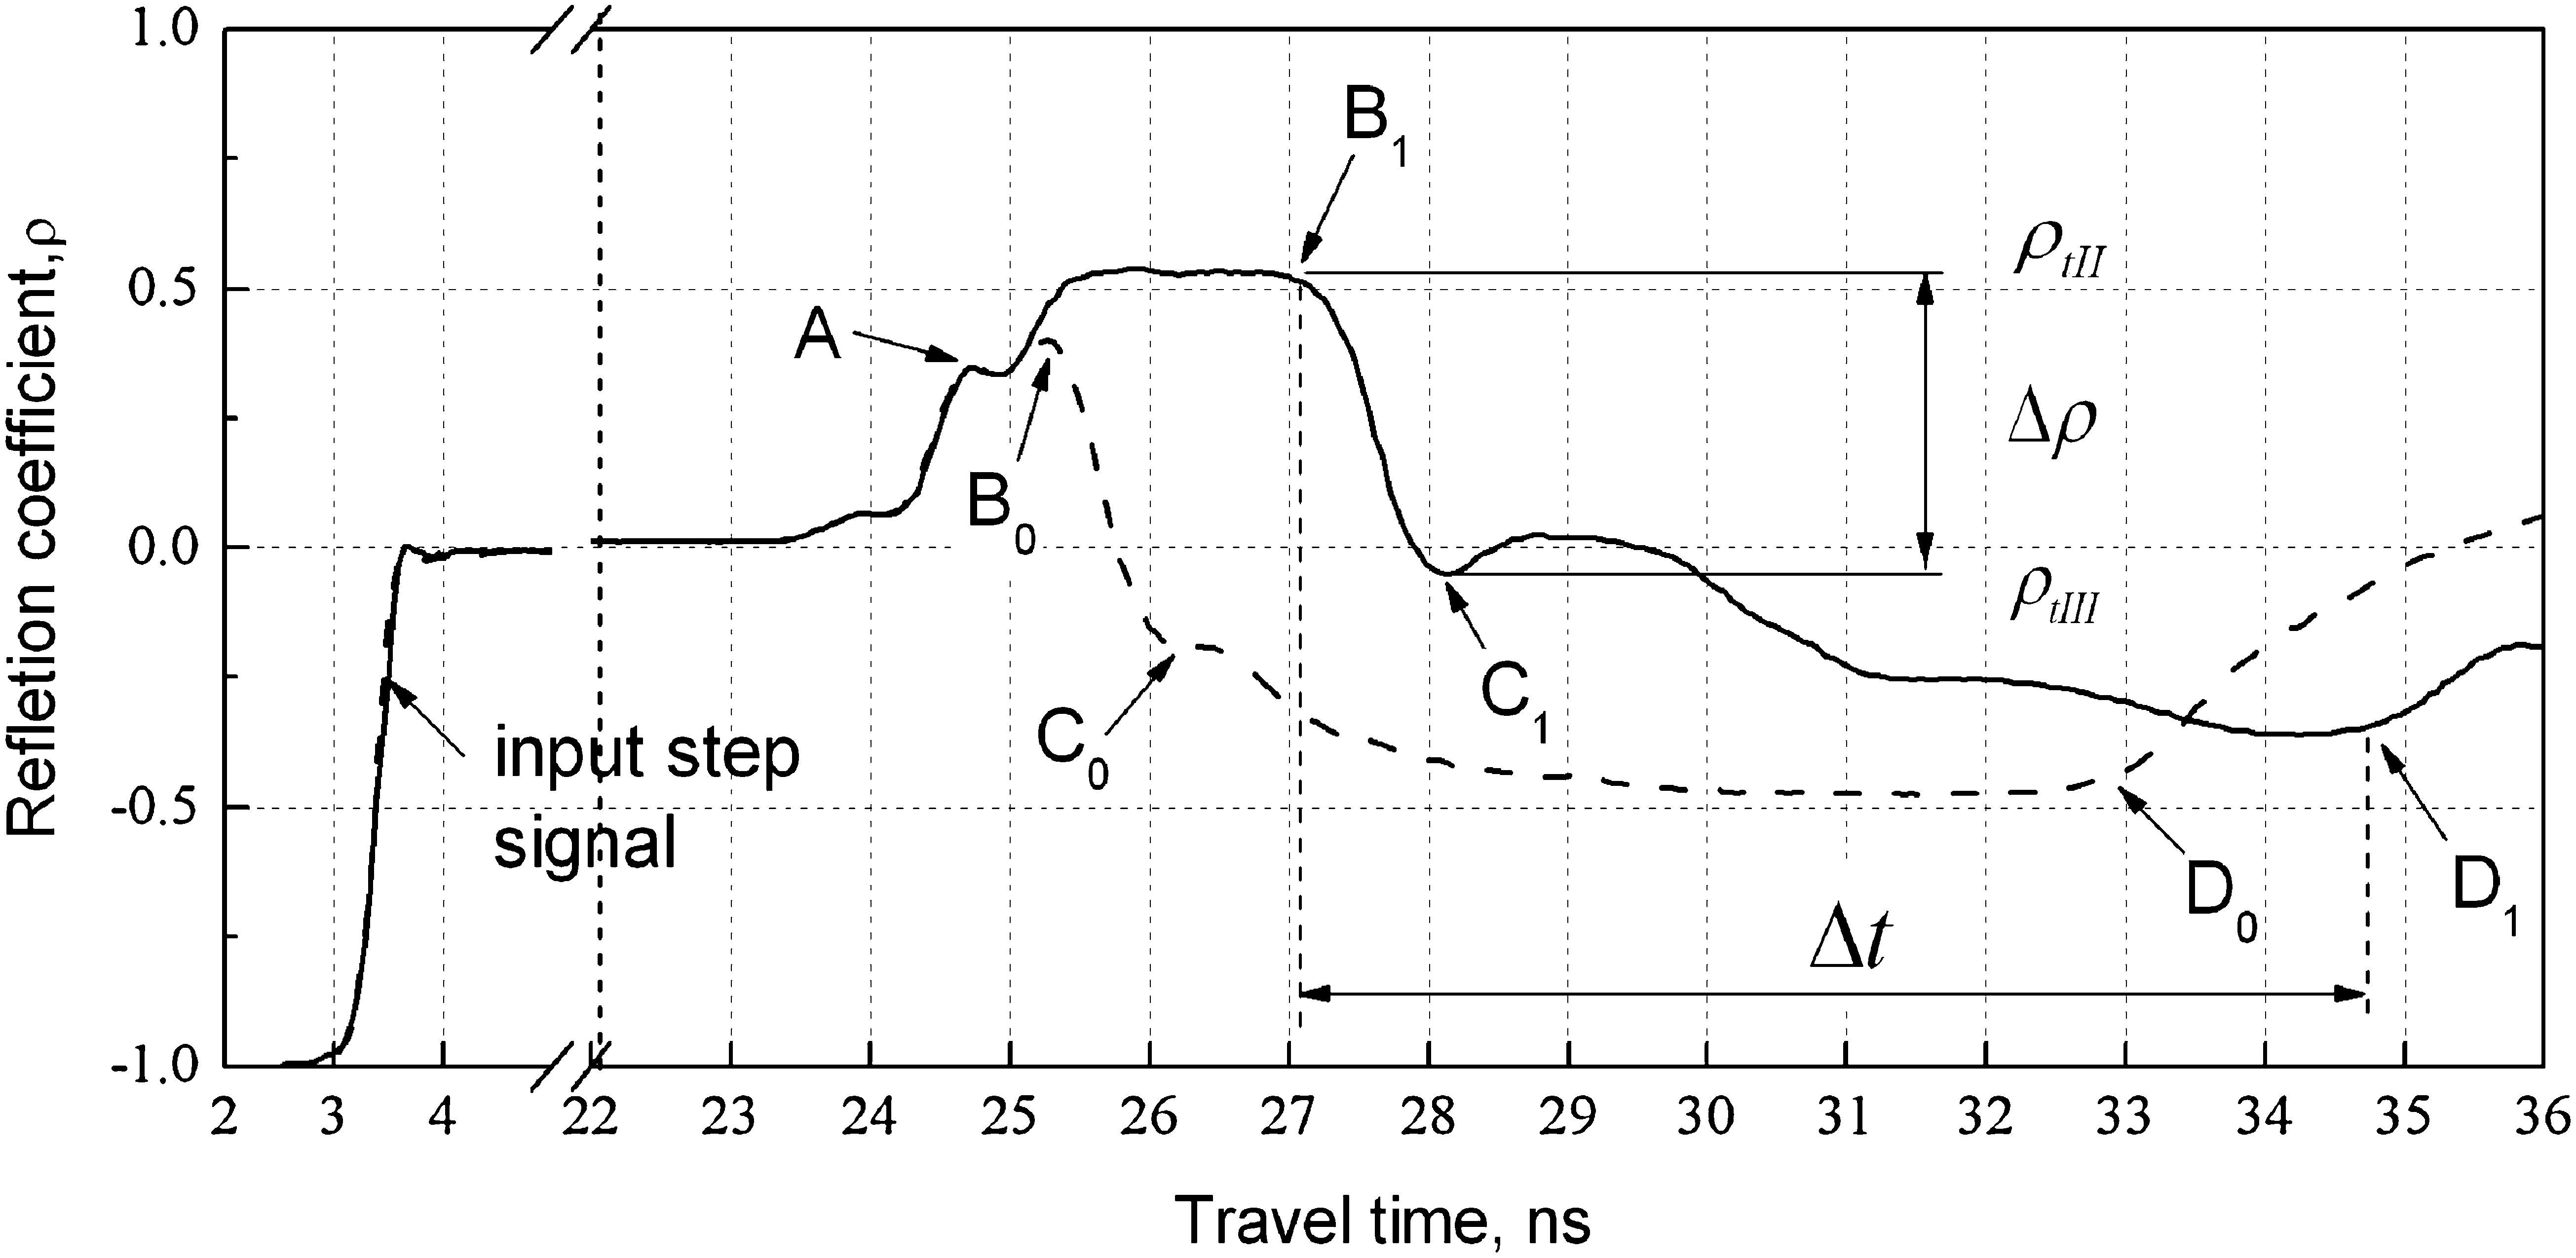
TDR waveform measured in deionized water using the probe with extension rods (348 mm air gap, solid line) and without extension rods (48 mm air gap, dashed line). A, reflection at coaxial head and cable interface; B, start of reflection at interface of the air gap and test sample; C, end of the reflection at interface of air gap and test sample; D, first reflection from probe end. Subscript: 0, travel time method without extension rods; 1, surface reflection method with extension rods.
Travel time method for the measurement of apparent dielectric constant
The travel time method measures the propagation velocity of EM wave in medium, which is related to the apparent dielectric constant Ka of medium filled between the inner and outer conductor of the probe, and can be expressed as
where v is the velocity of EM wave in test medium; L is the effective probe length in test medium, which can be calibrated using deionized water as the test medium; Δt is the two-way travel time along the probe (time from B to D in Fig. 3); and c is the velocity of EM wave in free space (c=2.298×10⁸ m/s). The Ka of test medium is then
Surface reflection method for the measurement of apparent dielectric constant
The surface reflection method makes use of information in the EM wave reflection at the soil surface. The length of a standard probe specified in ASTM D 6780 was extended with four 300-mm extension rods. The relationship between the reflection coefficient at the soil surface and the Ka of the soil was established theoretically by Chen et al. (2009). Therefore, the Ka of the soil can be estimated from the surface reflection coefficients. Results indicate that the dielectric constant can be determined with reasonable accuracy with this new method even for soils with high electrical conductivities, whereas the conventional travel time analysis fails due to significant signal attenuation.
Chen et al. (2007) stated that the small Step C in Fig. 3 is the end of the reflection at the soil surface, and the difference of the reflection coefficients between B and C depends on the dielectric constant of the soil in the mold. The apparent dielectric constant obtained by surface reflection method can be expressed as (Chen et al., 2009)
where Δρ=ρtII−ρtIII, which depends on the dielectric constant of the material in the mold. ρtII and ρtIII are reflection coefficients at point B and C, respectively. k and ψ are probe constants associated with the probe's material and geometry, which can be obtained by calibration experiment.
Unlike soils, the electrical conductivity of waste materials in landfills is extremely high. Equation (3) provides satisfactory accuracy in measuring water content of soils when Ec<500 mS/m. For MSW, Equation (3) should be revised, taking into account the considerably high Ec (2000 mS/m or more) of leachate commonly encountered in landfills. To investigate the effect of the pore fluid's extremely high conductivity on Δρ, solutions with different calcium chloride (CaCl2) concentrations (Ec range from 16 to 2000 mS/m) were measured with the surface reflection method (see Fig. 4). The electrical conductivities of the solutions were measured using an Ec tester. As the Ec of the solution increases, the Δρ=ρtII−ρtIII also increases. The change of Δρ (defined as Δρec) can be fitted by
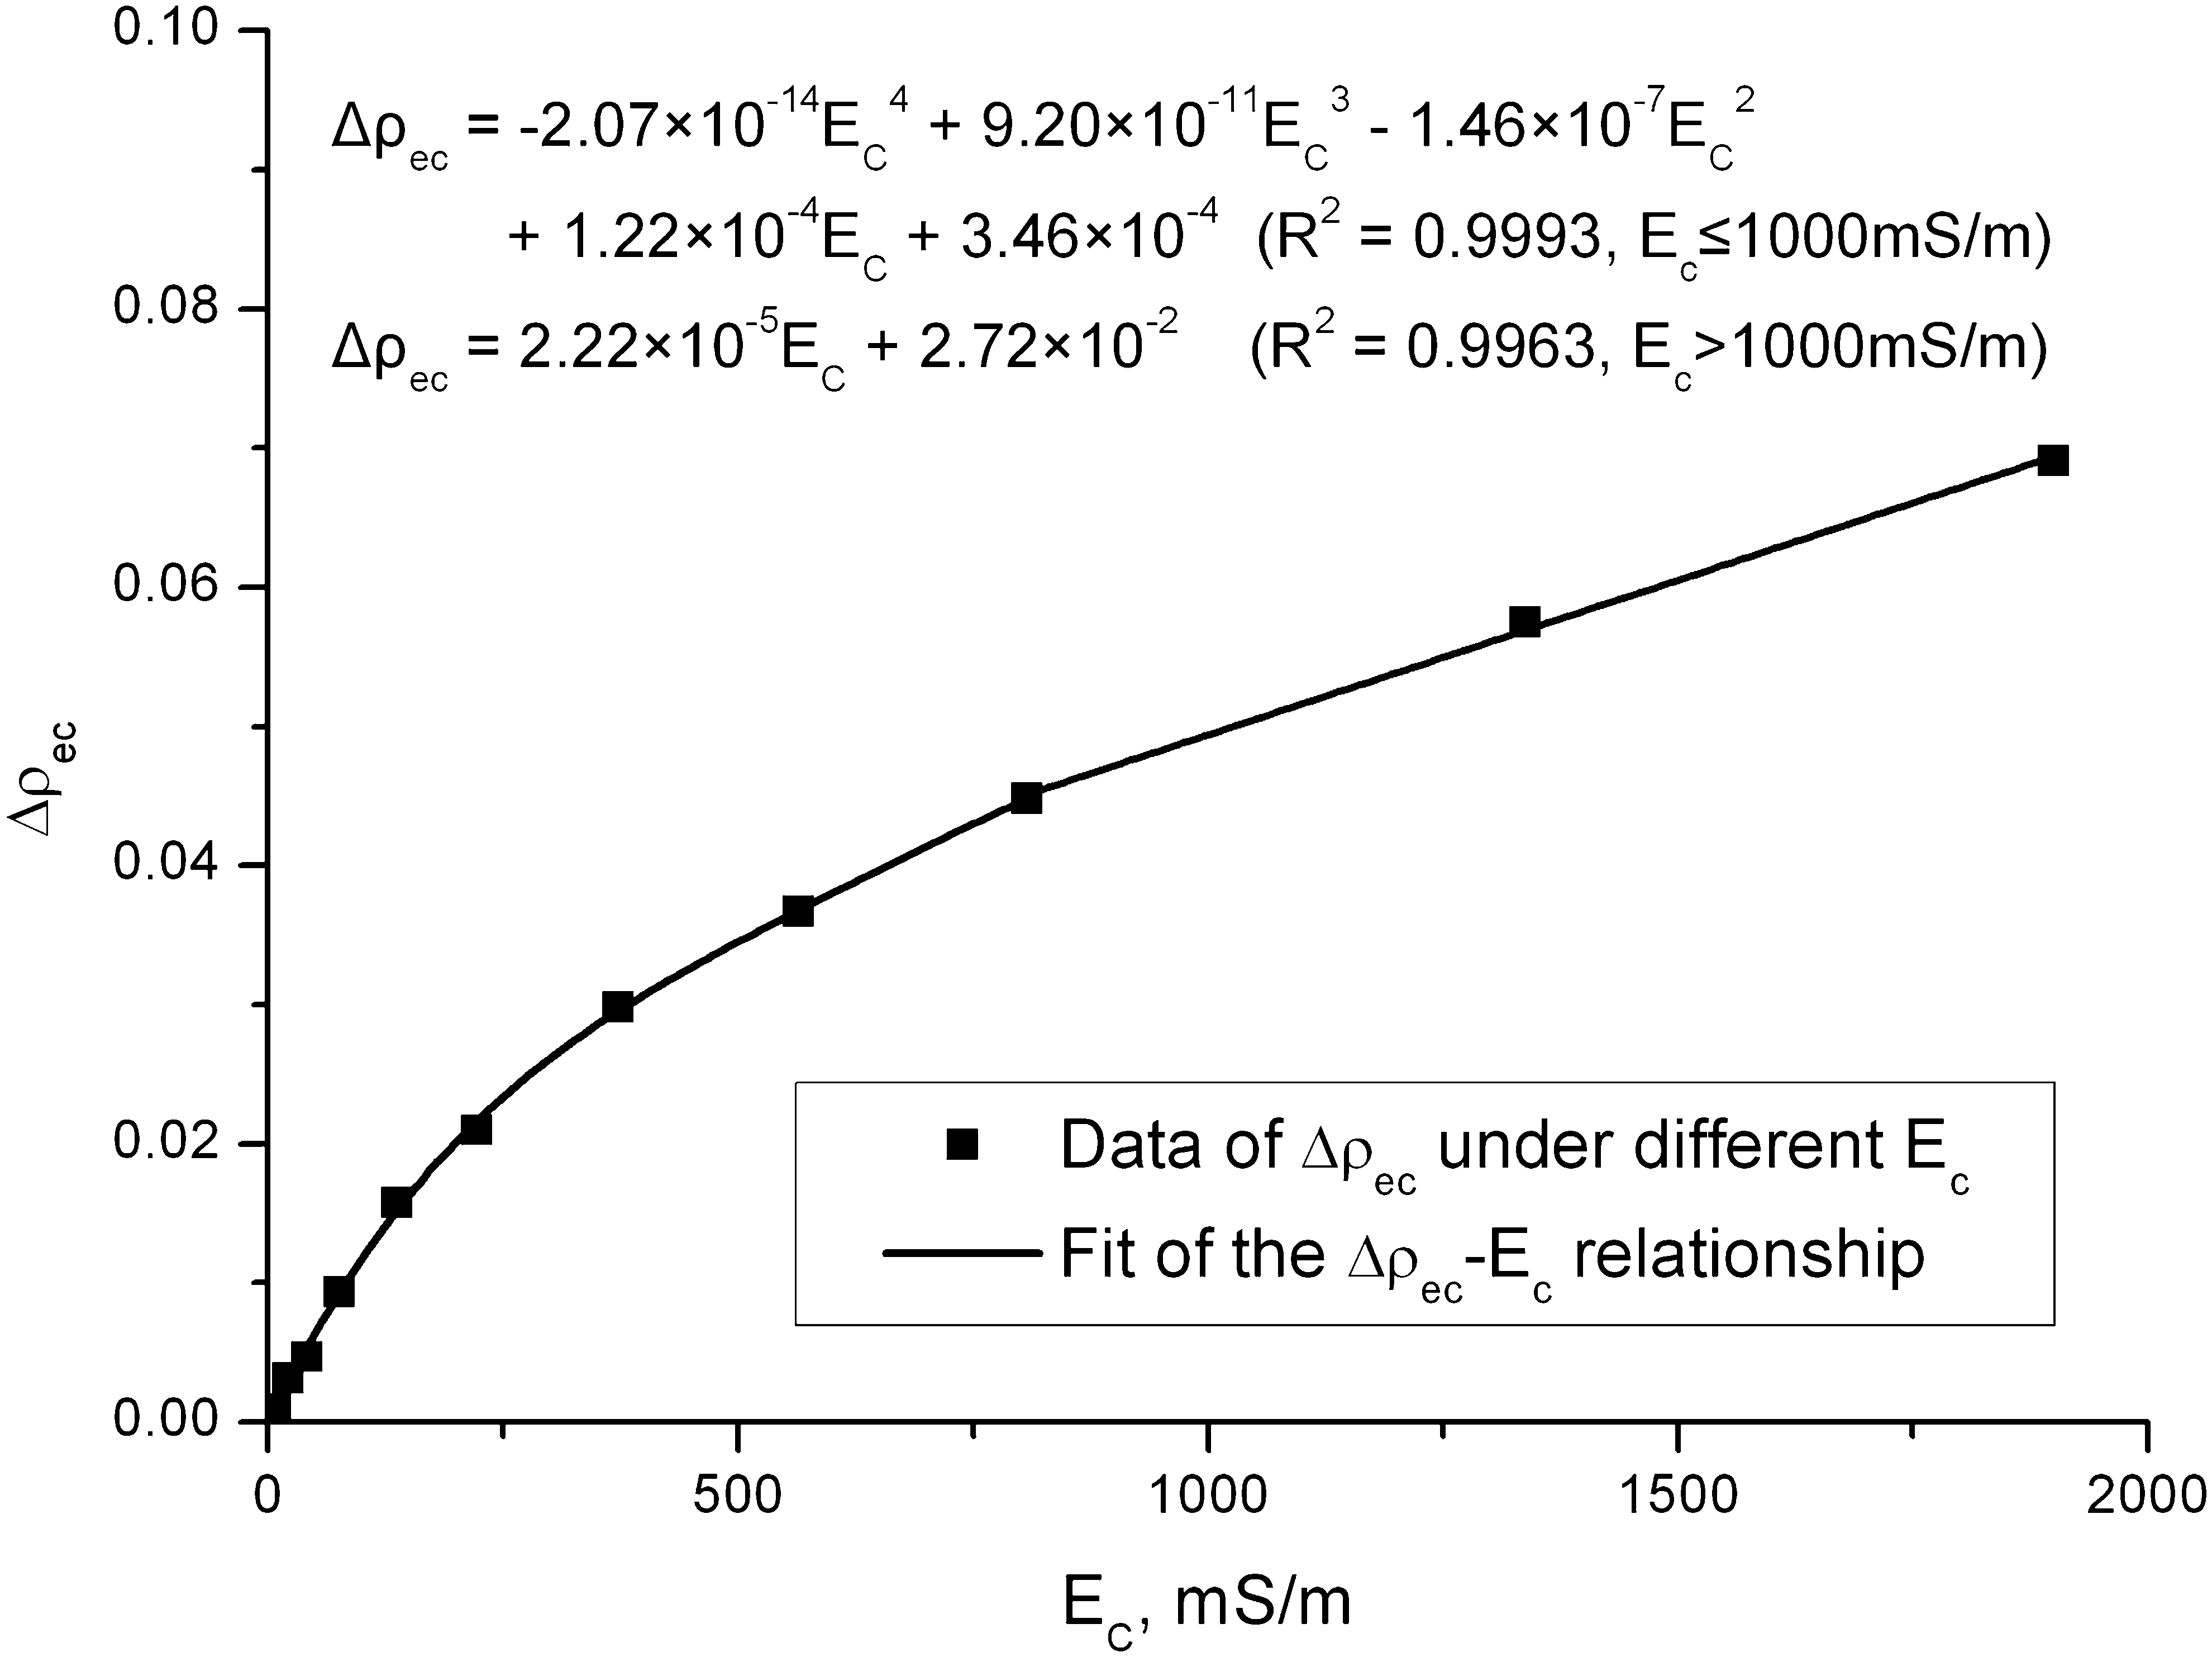
Influence of Ec on surface reflection of water.
Then, Equation (3) can be rewritten for the influence of Ec on Δρ, which leads to
Relationship between apparent dielectric constant and volumetric water content
The apparent dielectric constant of test sample can be uniquely correlated with the volumetric water content because of the significant differences between the dielectric properties of water and other materials (see Table 1). The dielectric constants of waste materials are within the same range as soils (e.g., 3.0 for dry paper, 2.1–2.6 for plastic, 2.3–4.0 for rubber, and 2.0–4.0 for dry wood). The relationship between Ka and θ of soils has been studied by many researchers. Whalley (1993) suggests that Ka is related to the dielectric constants of air (Ko), water (Kw), and solid matter (Ks) by
where fo, fw, and fs are the volume fractions of air, water, and solid matter, respectively. Rearranging Equation (6), substituting test sample properties for fo, fw, and fs yields:
where n is the porosity of test sample. Topp et al. (1980) proposed an empirical polynomial equation to correlate Ka with θ:
Equation (8) has been confirmed by a variety of researchers and is quite broadly applicable for soils (Topp and Reynolds, 1998). However, the application of this model is limited when applying it to MSW. Then, different calibration equations have been proposed for converting measured Ka values into θ for MSW (Li and Zeiss, 2001; Masbruch and Ferré, 2003).
Materials and Methods
MSW and its components
The compositions of MSW in urban China are given in Table 2, which indicate that the main components are putrescible organics of animal or plant origin, paper, plastic, and soil. In this study, experiments were conducted on paper, plastic, and organics such as leaves and watermelon peel. Experiments of soils by surface reflection method had been carried out by Chen et al. (2009). Furthermore, the EM properties of mixtures of waste materials were also studied.
The waste materials were shredded before the test, and the densities of paper, plastic, leaves, and watermelon peel samples were 0.17, 0.12, 0.27, and 0.59 g/cm3, respectively. The corresponding total porosities were 0.78, 0.87, 0.94, and 0.95. Then, on the basis of the representative composition in Table 2, MSW samples were prepared in the laboratory for an experiment with the porosity of 0.90 (see Table 3).
The pore water is also an important component that should be considered. In landfill, the Ec of leachate can reach 2000 mS/m or more, which is much higher than the Ec of pore water generally encountered in common soils. The influences of high Ec should be accounted for in the determination of water content with TDR. The dielectric behavior of the leachate is very close to that of salt water, despite the former's suspended solids, chemical composition, and biological constitution (Staub et al., 2010). Therefore, salt water was preferred for all the tests with MSW to simulate a highly conductive leachate. For each type of waste material, a highly conductive fluid (CaCl2 solution, Ec= 2000 ms/m) and deionized water (Ec=16 ms/m) were used as pore water, respectively.
Experiment methods
Before the test, each waste material was air dried except organics. To investigate the relationship between Ka and θ, predetermined volumes of CaCl2 solution or deionized water was sprinkled on waste materials, which were then mixed well to ensure a homogeneous distribution of water. Then, the mixture was sealed in a plastic bag for 24 h. Afterward, the sample was packed into the mold with a metallic rod located at the middle of the mold. For each type of waste material, samples infiltrated with deionized water were measured using the coaxial head without the extension rods, and those infiltrated with salt water were measured using the coaxial head with the extension rods. Finally, water content of the test sample was determined by the oven-dry method.
When the pore water is deionized water, the relationship between Ka and θ of test sample can be studied by the travel time method. If the pore water is CaCl2 solution, the sample's electrical conductivity increases with increasing water content, which was also verified by Ferré et al. (1998). The reflection waveform was attenuated rapidly as the sample's Ec increases, which prevents the measurement of a TDR waveform interpretable by travel time analysis. However, the reflection coefficient at the junction of the air gap and the test sample could still be determined clearly by surface reflection method under high electrical conductivity. Then, the Ka of the test sample can be calculated by Equation (5). The category and number of test samples are shown in Table 4.
MSW, municipal solid waste.
Results and Discussion
Ka-θ relationships for paper, plastic, and organics
The results of volumetric water content and measured dielectric constant were plotted for tested materials (see Fig. 5) with deionized water and CaCl2 solution as the pore water, respectively. Examination of Fig. 5 indicates that for waste materials with different values of Ec, two methods give similar results. Moreover, the surface reflection method still works satisfactorily for situations where the conventional travel time method fails due to weak or nonexistent second reflection. Further, unlike the method that insulates the TDR probes with a dielectric coating, the surface reflection method measures directly the dielectric constant of waste materials, not affected by the dielectric properties of the coating. Besides, the electrical conductivity can still be acquired by surface reflection method.
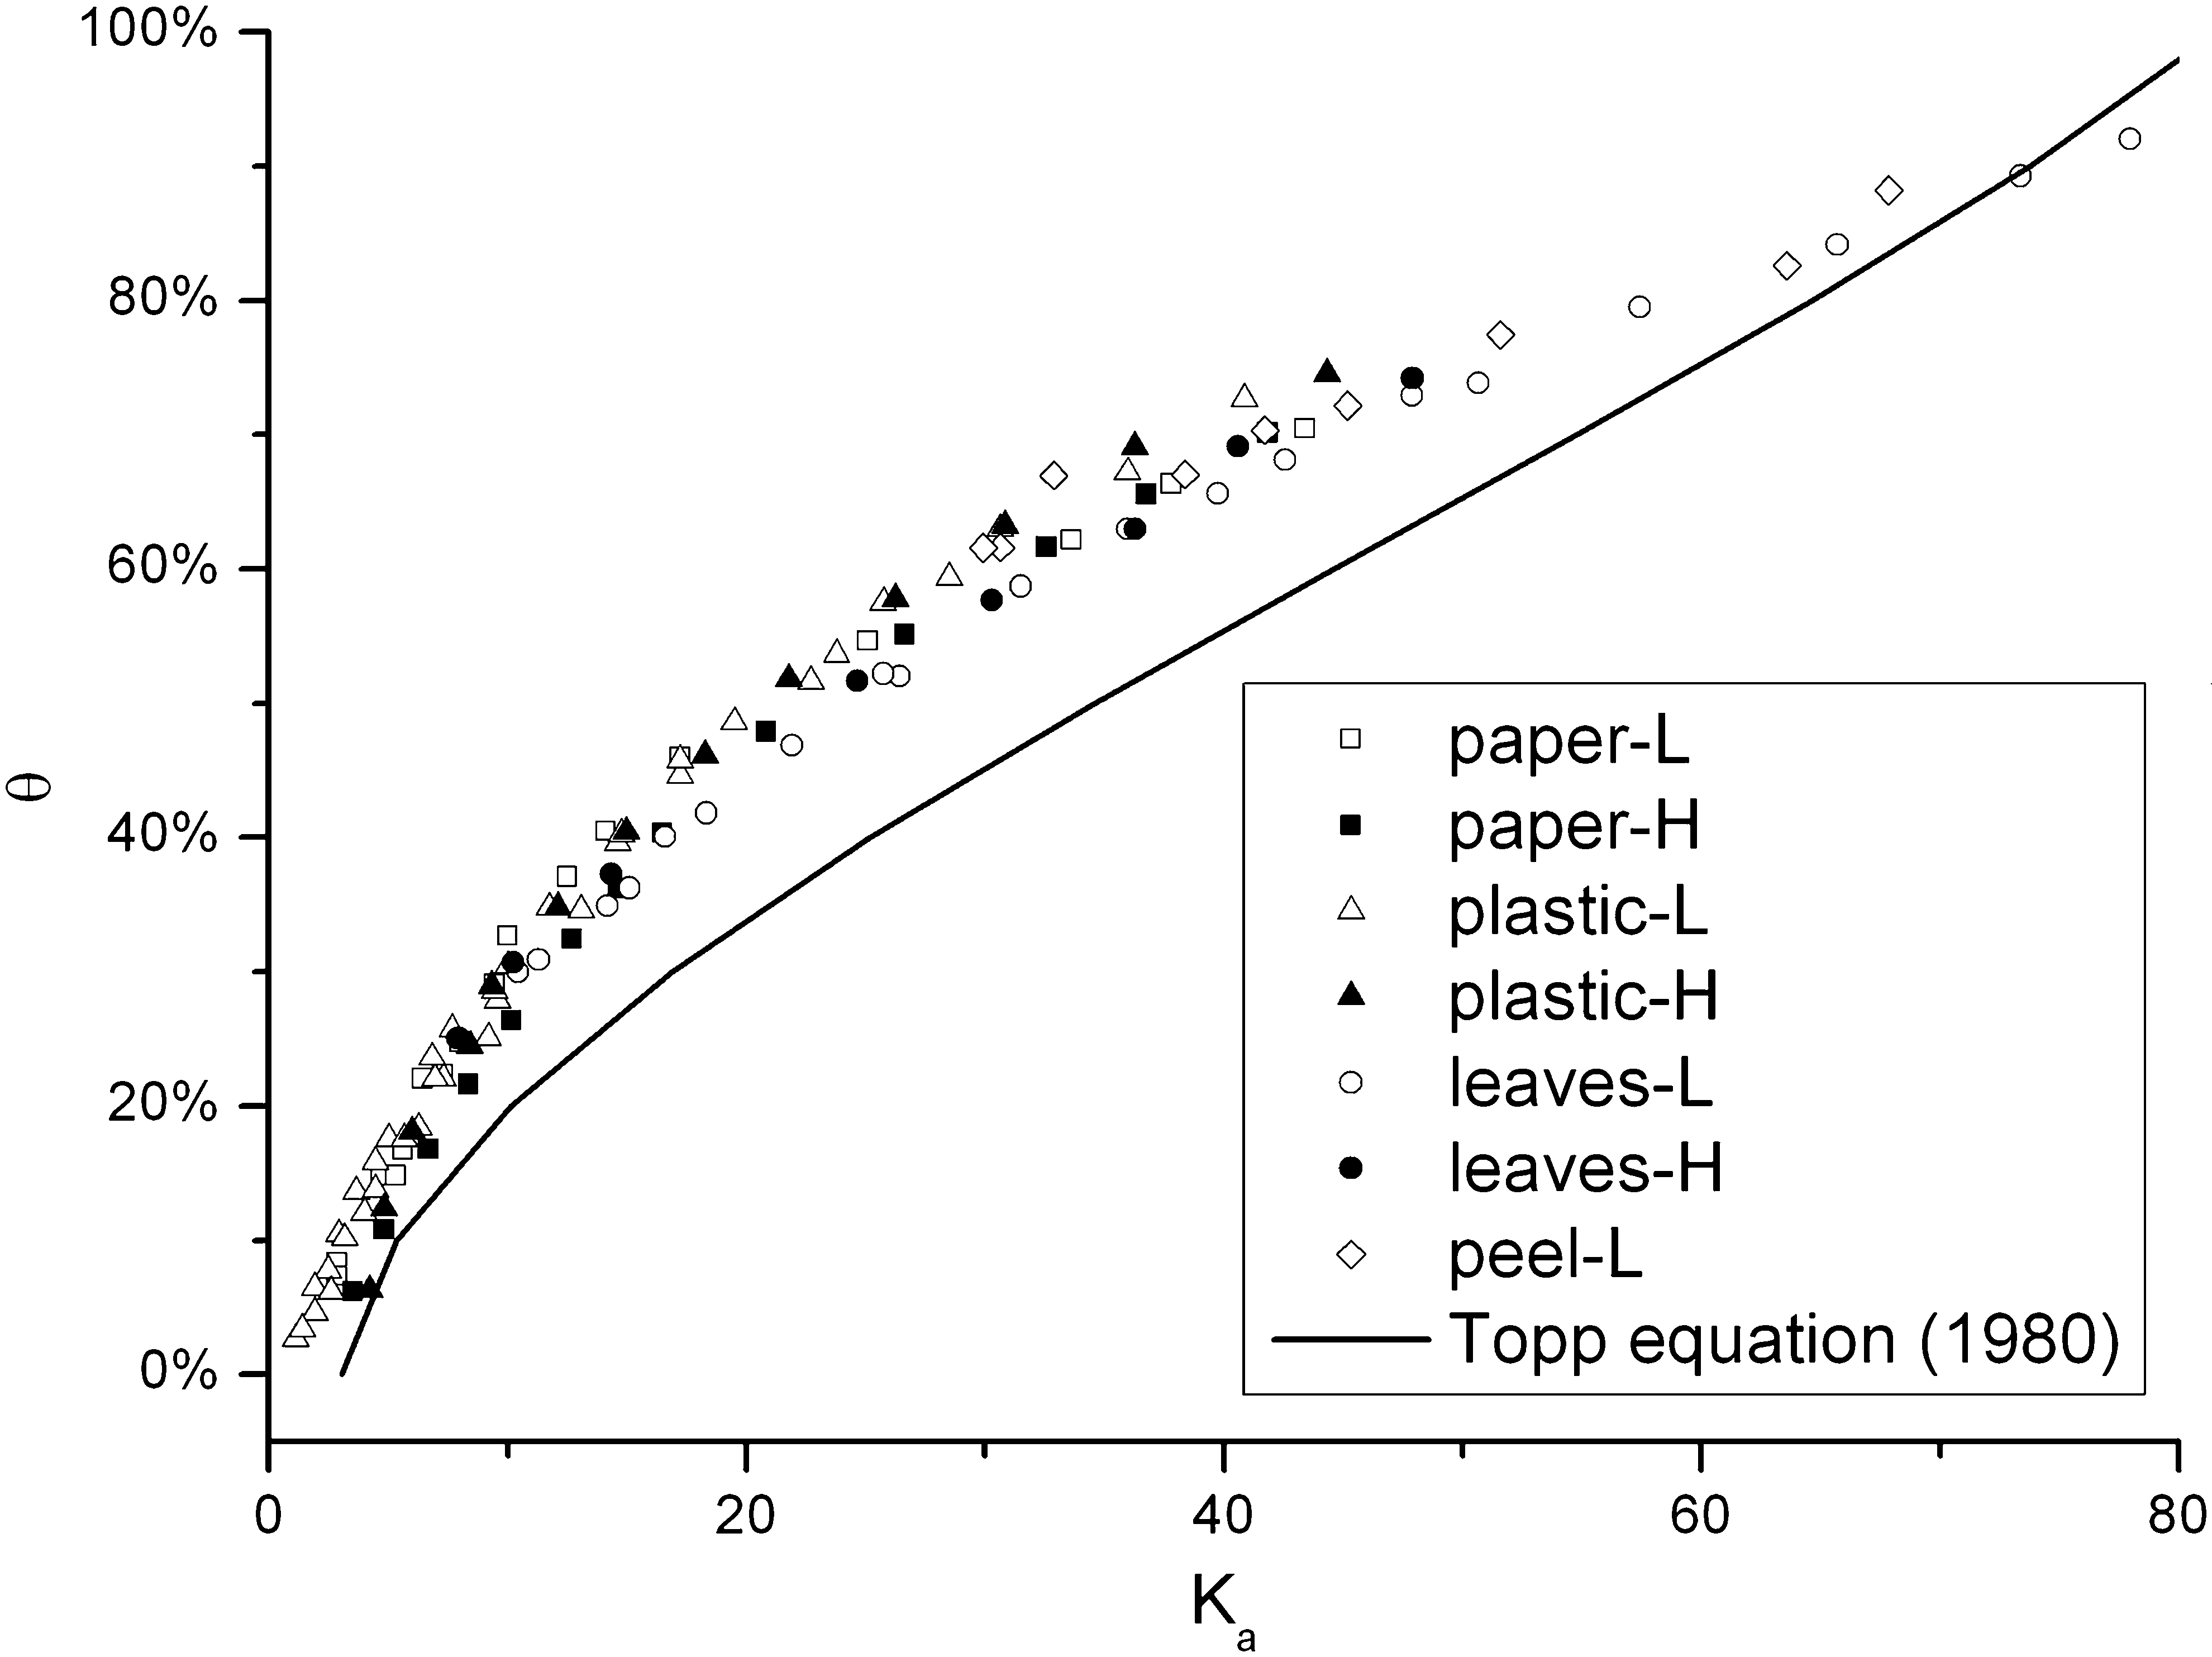
Measured relationship between dielectric constant and water content for major MSW components. Suffixes: -L, test sample was infiltrated with deionized water (Ec=16 mS/m); -H, test sample was infiltrated with salt water (Ec=2000 mS/m). MSW, municipal solid waste.
For each waste material, the best-fit calibration curve was determined. The calibration coefficients (based on the three-order polynomial equation) and the R2 values are shown in Table 5. The overall results show R2 values >0.99 for all regressions performed on the calibration experiments, which indicates significant fits for all waste materials. The model proposed by Topp et al. (1980) was also included for comparison purpose. From Fig. 5, apart from water content and porosity, the effect of waste material type (different materials and their combinations) on dielectric constant seems to be negligible, which is consistent with the conclusion proposed by Li and Zeiss (2001).
It also indicates that the curve of Topp's equation is not equally in accordance with our measurements. The porosity of MSW is larger, and the contribution of the solid phase on dielectric constant is less compared with soils. Therefore, the dielectric constant of MSW is smaller than that of soil at the same volumetric water content, which can also be explained by Equation (7). So, the data points of waste materials are located above the curve of Topp's equation. However, with the increasing of volumetric water content (greater than 60%), the sample tends to be saturated, and the proportion of air is reduced significantly. The test results are consistent with the curve of Topp's equation. Therefore, the porosity has influences on measured Ka.
From Fig. 5, the oven-dry experiments showed that the intrinsic water of organics, for example, the leaves or watermelon peel, accounts for 95 percent of the total mass of organics. The Ka of a plant is a mixture of free water, bound water, and plant dry matter (Burke et al., 2005). Therefore, before being mixed with any water, the Ka of leaves or watermelon peel is much higher than paper and plastic. The corresponding initial θ of leaves and peel are 25.1% and 61.6%, respectively. As a result, the TDR technique can measure water content in organics in the absence of significant bound water effects.
Figure 6 shows the square root of the dielectric constant as a function of the volumetric water content for different waste materials. The data of Topp's equation and the linear relationship proposed by Ferré et al. (1996) that are suitable for soils have been added for comparison. For each material, the best-fit calibration linear equation was determined, and the coefficients and R2 values (>0.97) are listed in Table 6. A calibration formed using all the data of MSW components gave a global calibration with a slope and intercept of 0.1219 and −0.0974, respectively, with an R2 of 0.9872. The slope of the calibration equation is consistent with the value of 0.1181 determined by Ferré et al. (1996), but the intercept is smaller due to the large porosity of waste materials compared with soils. The highly linear relationship suggests that a two-point calibration could be performed using waste samples collected in landfill, which greatly simplifies the calibration procedure than the three-order polynomial equation.

Measured relationship between square root of dielectric constant and water content for major MSW components.
The Ka-θ relationship for MSW
In addition, the relationship between Ka and θ of MSW is shown in Figs. 7 and 8. The results indicate that the dielectric property of MSW is similar to that of each component, and the water content plays a decisive role in the dielectric constant of MSW. The relationship between Ka and θ of MSW can be expressed by Equation (9). According to Fig. 8, it can be concluded that the equation provides good fit (R2=0.9985), and the fitting parameters are consistent with that of the square-root regression in Fig. 6.

Measured relationship between dielectric constant and water content for MSW.

Measured relationship between square root of dielectric constant and water content for MSW.
Comparison with some existing results
The comparison of the test results of this article with existing results is shown in Fig. 9. The local porosity in waste samples varies by the type of material and compaction. The higher the porosity of the sample, the lower the volume of solids per unit of total volume, and, therefore, the less the influence and contribution of the solid phase and its characteristics on the bulk dielectric constant will be resulted (Li and Zeiss, 2001). In dry state, the dielectric constant of MSW sample is close to 1 due to the major contribution of air. However, the dielectric constant of the soil sample is close to 3–5 under the same dry state because of the dominant contribution of soil particle under lower porosity.
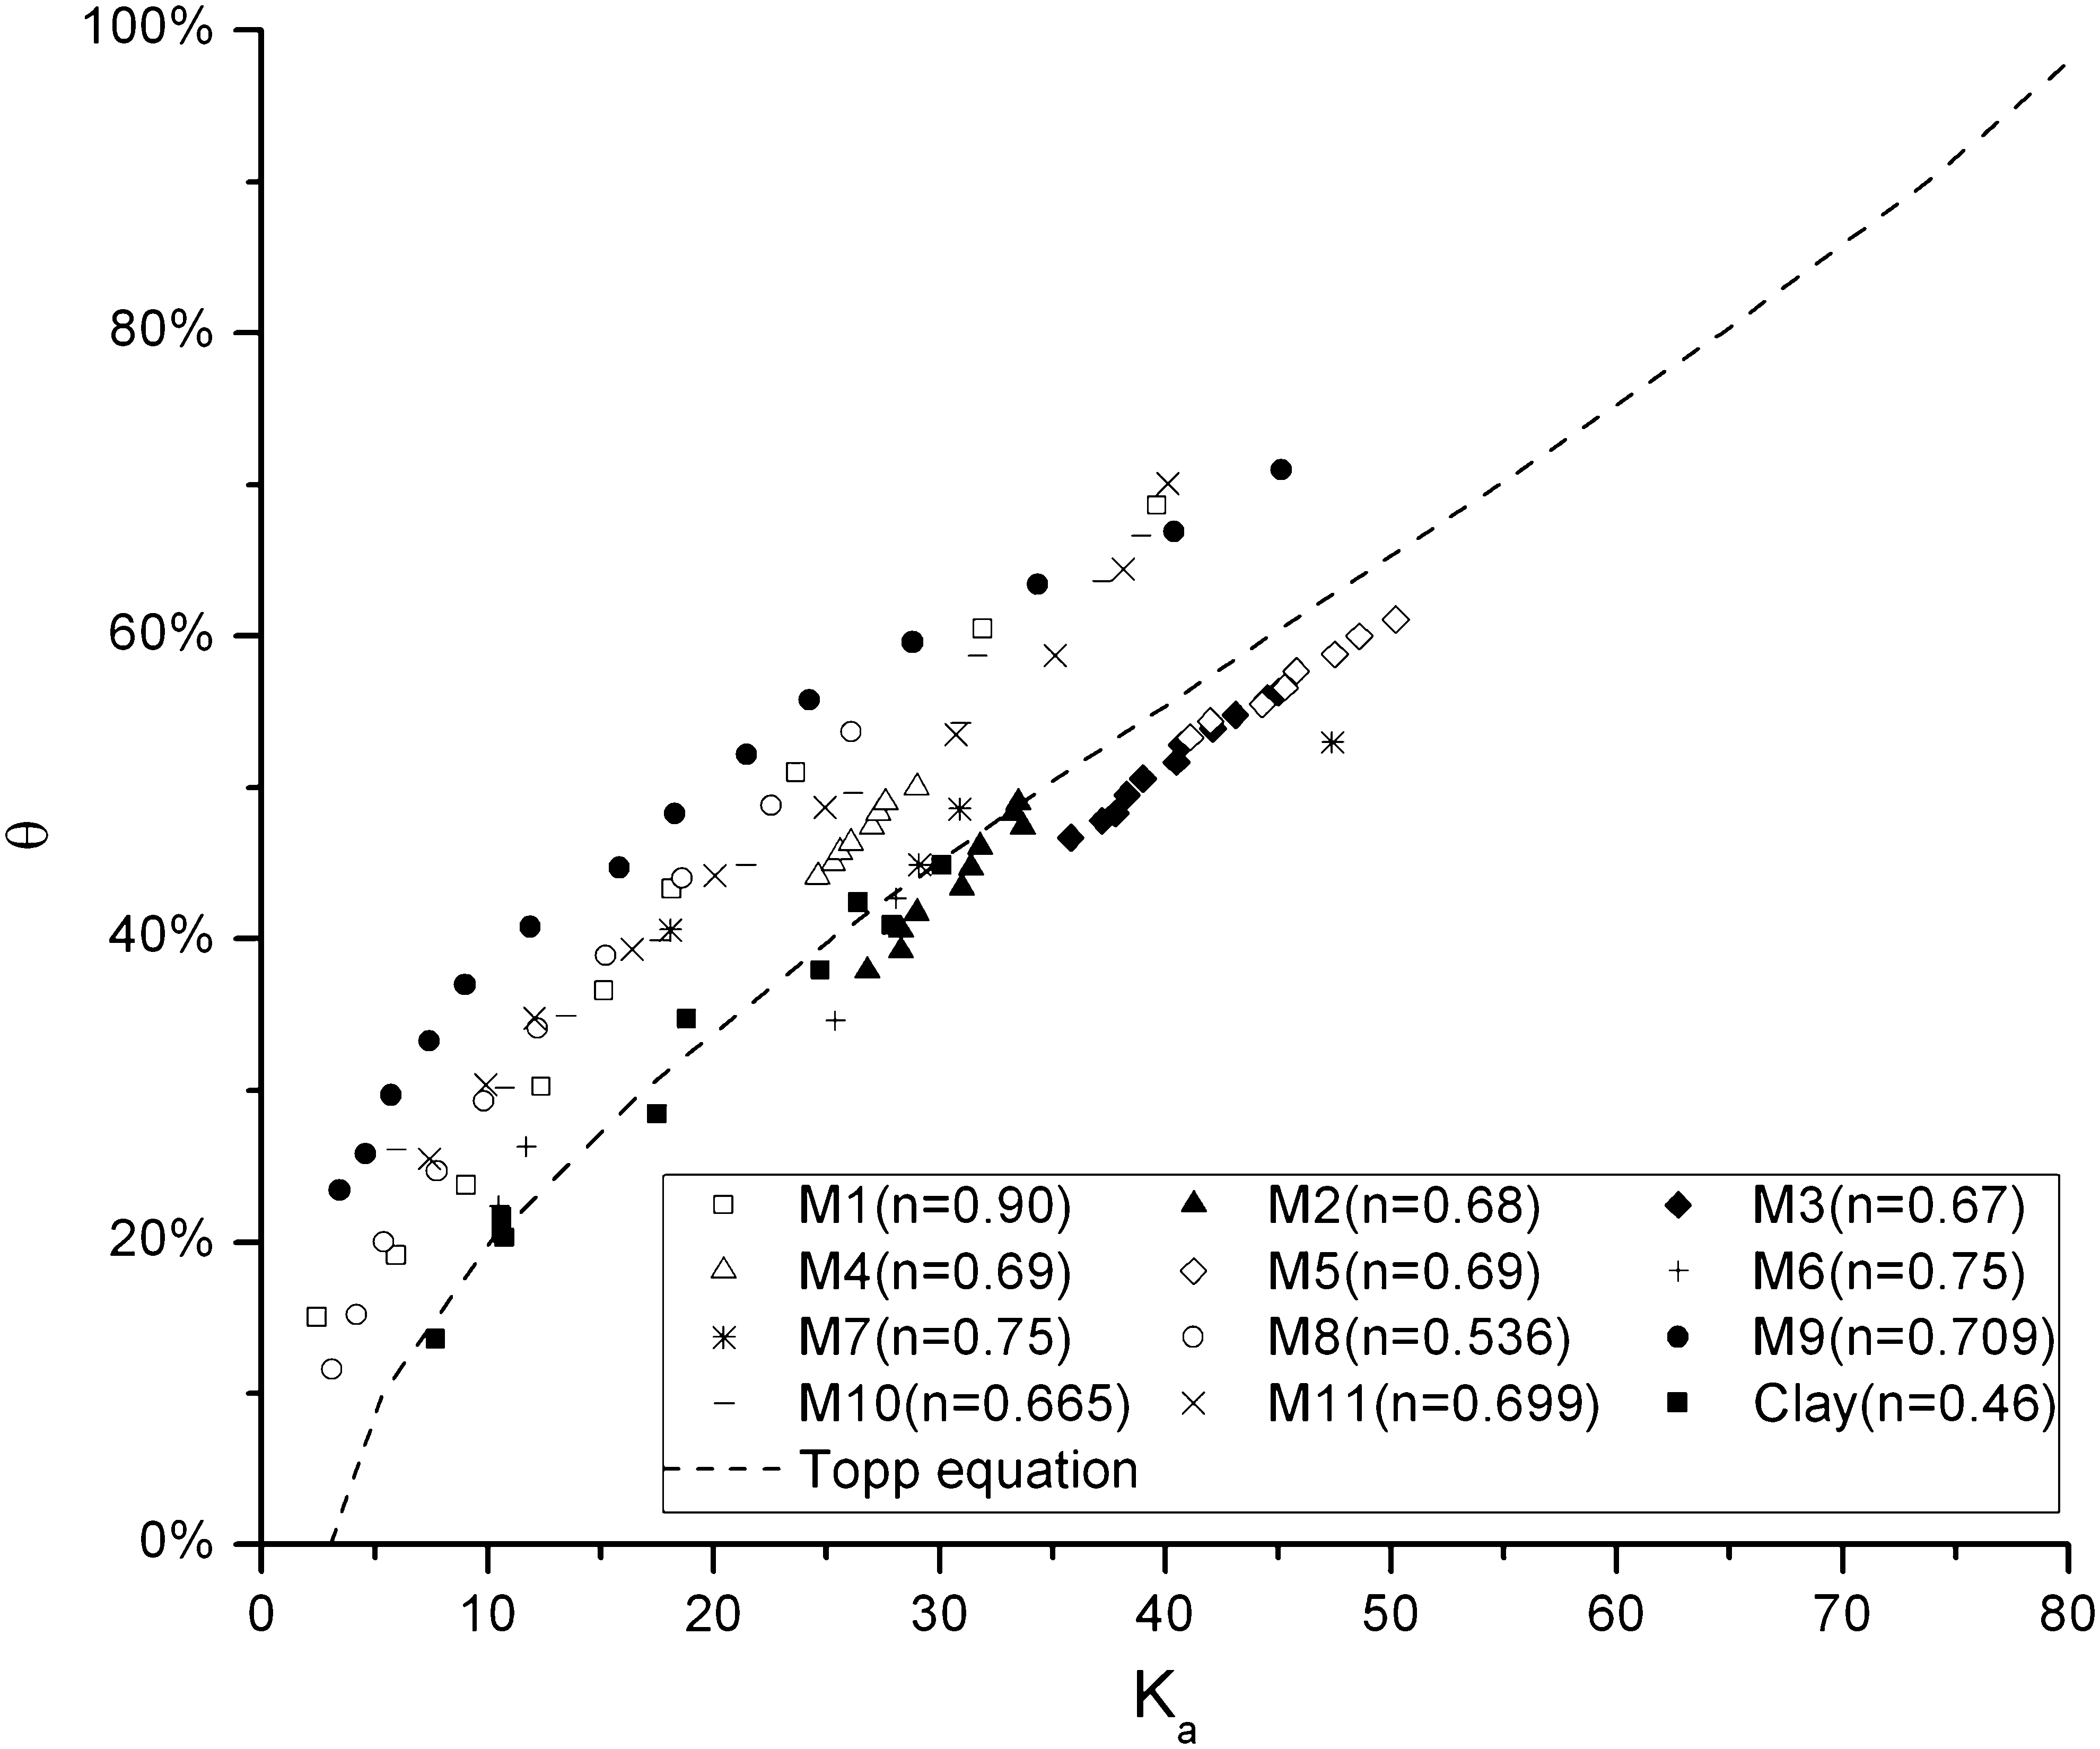
It indicates that the results of clay agree well with the curve of Topp's equation. However, all the data of waste materials by surface reflection method, Masbruch and Ferré (2003), and Staub et al. (2010) are almost located above the curve of Topp's equation. The reason is that the porosity of waste materials is larger than that of soil. Parts of the data points of Staub et al. (2010) are located below the curve of Topp's equation.
Summary and Conclusions
A new method for measuring water content of MSW by using TDR with the surface reflection coefficients was presented. The relationships between the dielectric constant of MSW and its components and the water content were investigated. Major conclusions from this investigation are
1. Apart from porosity, the effect of waste material type seems to be negligible on the measurement of water content. The highly linear relationship between Ka0.5 and θ for waste materials suggests that a two-point calibration could be performed using waste samples collected in the field, thus greatly simplifying the calibration procedure. Moreover, the TDR technique can measure the intrinsic water of organics in the absence of significant bound water effects. Based on our experimental results, the TDR technology could be used for measuring the dielectric constant of MSW and the in situ water content in landfill. 2. The results of dielectric constant by surface reflection method gave similar accuracy as the conventional travel time method for waste materials with low electrical conductivities. However, surface reflection method provides higher accuracy for waste materials with high electrical conductivities, while travel time method fails on uncoated probes. 3. The results presented in this article illustrate the successful use of TDR surface reflection method in the measurement of water content of MSW and provide experimental basis for in situ application of TDR in landfills.
Footnotes
Acknowledgments
The authors wish to thank National Basic Research Program of China (research grant: 2007CB714001) and the Program for New Century Excellent Talents in University (NCET) for financial support (NCET-08-0491).
Author Disclosure Statement
No competing financial interests exist.