
Abstract
Abstract
A mixed microbial culture isolated from wastewater of a refinery was tested for its potential in degrading phenol during its growth phase. Phenol was used as the sole carbon source, and its degradation was studied in batch mode. The mixed culture was able to completely degrade various concentrations of phenol (100–1,000 mg L−1). Phenol at low concentrations (100–200 mg L−1) had no inhibitory effect on the growth; however, for phenol concentration exceeding 200 mg L−1, the organism showed an initial lag phase of 48 h. A maximum observed specific growth rate of 0.39 h−1 was obtained at 200 mg L−1 concentration of phenol in the growth medium. The specific growth rate was fitted to the kinetic models of Haldane, Han Levenspeil, Aiba, Yano, and Edward models. The kinetic constants obtained from the Haldane model were μmax=3.47 h–1, KS=984.32 mg L−1, KI=463.56 mg L−1. Scanning electron and high-resolution microscopic images showed that Streptococci sp. was the predominant species.
Introduction
Aerobic biological methods are preferred to the anerobic methods for the treatment of phenol wastewater. Aerobic microorganisms are more efficient for degrading toxic compounds, because they grow faster than anerobes and usually transform organic compounds into inorganic compounds (CO2, H2O) (Sarfaraz et al., 2004). Mixed culture means that several kinds of microorganisms are cultured simultaneously (Kim et al., 2002). The activated sludge is considered a natural mixed microbial consortium and appears as a more attractive solution because of its various advantages (Melo et al., 2005). Most of the studies reported till date on phenol degradation by various strains are either for a low concentration range of phenol (Monteiro et al., 2000) or for only a single initial concentration of phenol (Alcocer et al., 2007). In the present study, higher concentrations of phenol were successfully degraded by the bacteria isolated from the wastewaters of the refinery plant located in Guwahati. On the basis of the literature survey, we have studied phenol biodegradation over a wide range of pH and temperature. Degradation kinetics is an essential and mandatory input for the design of any biological reactor where microbial degradation is carried out (Alcocer et al., 2007). Knowledge of the biodegradation kinetic constants of toxic substances is very important for both the prediction of their fate and the design of process equipment.
The objective of the present work was to study the kinetics of microbial growth during phenol degradation in batch mode. The inhibition models found in the literature were applied to the experimental data to predict the kinetic parameters. The effects of physical parameters such as pH, initial phenol concentration on biodegradation were also studied.
Materials and Methods
Chemicals
Phenol, dextrose, and other inorganic salts used in preparation of growth media were of analytical grade (Merck; 99%). The chemicals used for phenol analysis are ammonium hydroxide (Merck; 25%), potassium isocyanide (Merck; 99%), and 4-amino antipyrene (National Chemical; 99%).
Microorganisms and culture conditions
An indigenous mixed microbial culture, potent to degrade phenolic compounds, was isolated and enriched from wastewater samples from Indian Oil Corporation Limited, Guwahati, India. On the basis of the scanning electron microscopic (SEM) morphological study, it was observed that the mixed microbial culture resembled Streptomyces sp. The culture was initially grown in a 250-mL Erlenmeyer flask containing 100 mL of mineral salt medium (MSM) having the composition: (NH4)2SO4 230 mg L−1, CaCl2 8.0 mg L−1, FeCl3 1.0 mg L−1, MnSO4·H2O 100 mg L−1, MgSO4·7H2O 100 mg L−1, K2HPO4 500 mg L−1, KH2PO4 250 mg L−1, and glucose 2 g L−1 (Saravanan et al., 2008). Glucose at 2 g L−1 was used as the substrate for the control culture. The pH values in the culture media were initially adjusted to 7.0 by using 1N NaOH. The media were sterilized without the phenol at 120°C at 15 Psi pressure. Phenol was sterilized by UV treatment and was added just before inoculation.
Batch biodegradation experiments
Before the batch degradation study, the organism was adapted to the environment containing phenol in the growth media. All batch biodegradation experiments in this study were conducted in 250-mL Erlenmeyer flasks containing 100 mL of sterile MSM with different initial concentrations of phenol ranging from 100 to 1000 mg L−1. Ten percent of the acclimatized culture was used as inoculum, and the flasks were incubated at 37°C at 150 rpm in an incubator shaker (Daihan LabTech Co. Ltd.; Model LSI-3016R). During the experiments, a sample volume of exactly 5 mL was withdrawn at regular time intervals until complete degradation of the substrate. Control experiments without phenol were also simultaneously carried out to compare the growth of the mixed microbial consortium with the presence of phenol. Experiments were also performed without adding the culture to check the abiotic removal of phenol, and it was found to be negligible.
Optimization of temperature, pH, and initial phenol concentration
Optimum temperature, medium pH, and phenol concentration were found out for the growth of the microorganism. Each experiment was carried out in batch mode in 250-mL Erlenmeyer flasks containing 100-mL mineral media with agitation condition (150 rpm) (Kumaran and Pachuri, 1997; Arutchelvan et al., 2006; Saravanan et al., 2008). First, the experiments were carried out at different temperatures ranging from 30°C to 37°C, with initial phenol concentration of 500 mg L−1 and pH 7 under agitated condition to find out the optimum temperature for the growth of the microbe. Experiments were also conducted to study the optimum pH of the biodegradation process. Each of the experiments was carried out for 3–4 days for biodegradation or until the residual concentration of the phenol in the flask was found to be undetectable. Samples were withdrawn at regular intervals of time, centrifuged, and supernatants were analyzed for the residual phenol concentration. Each experiment was carried out thrice, and the average values of the percentage phenol degradation were reported.
Analytical procedure
Cell density in the samples was estimated using a UV-Vis spectrophotometer (Perkin Elmer, Lamda 35) by measuring its absorbance (optical density [OD]) at 600 nm wavelength. Then, OD600 was converted to dry cell weight by a calibration curve, which was obtained by plotting dry weight of biomass per milliliter against OD600. Phenol concentration was measured by the standard methods using 4 amino antipyrine (APHA and AWHA, 1994).
Scanning electron microscope analysis
The morphological study of the isolated culture was identified by using a scanning electron microscope (LEO 1430VP; Oxford). Five milliliters of the broth was taken from the flask containing 1000 mg L−1 of phenol and centrifuged at 1000 rpm. The supernatant was mixed with phosphate buffer to maintain a pH 6. Twenty micro liters of the sample just mentioned were fixed on to the sample holder and then washed with different concentrations of alcohol ranging from 10% to 90%. The sample was dried at 37°C over night. The sample was coated with gold to build up electric charge on the spot.
Kinetic modeling and substrate inhibition
In acclimatized condition, the mixed microbial consortium consumed phenol at a constant rate, which can be explained by Monod's model (Saravanan et al., 2008). The specific growth rate of a cell in a batch system, μ (h–1), is defined as
where X is the cell concentration in either g L−1 (dry basis) or in absorbance unit at 600 nm (OD).
The Monod model does not consider the inhibitory effect of phenol on the growth rate The Haldane model [Eq. (2)] was tried here, due to its wide applicability for representing the growth kinetics of inhibitory substrates (Banerjee and Ghoshal, 2010).
where μ and μmax are the specific growth and the maximum specific growth rate obtained (h−1), respectively. KS and KI are saturation constant and inhibition constant (mg L−1), respectively.
Four other models were also studied to calculate the kinetic parameters (μmax, KS, and KI) for substrate inhibition as follows.
Aiba model
where Ks (mg L−1) is the saturation constant, KI (mg L−1) is the inhibition constant, which is the measure of the toxicity of the phenol on the growth rate.
Yano model
where S, S0 are the initial and final phenol concentration mg L−1.
Webb model
where S, S0 are the initial and final phenol concentration mg L−1, Ks (mg L−1) is the saturation constant, and KI (mg L−1) is the inhibition constant.
Hans Levenspeil model
where S is the initial substrate concentration (mg L−1), Sm is the criticl inhibitor concentration mg L−1, and KS, KI are saturation constant and inhibition coefficient (mg L−1). n and m of Hans Levenspiel model are empirical constants.
Results and Discussion
Identification of the mixed microbial consortium
The SEM and high-resolution images of the mixed microbial culture showed that the organism was spherical in shape (Fig. 1). Earlier works have reported the identification of the organism on the basis of SEM images (Saravanan et al., 2008). The organism was further characterized to be gram positive. From the SEM images, it was observed that the organisms were present in a bead-like chain, which is the characteristic feature of the Streptococci sp (Pelczar et al., 2008).

Scanning electron and high-resolution microscopic images of the mixed microbial culture.
Acclimatization of the microorganism
For gradual acclimatization of the microorganism to the phenol-containing medium, 5 mL of lag-phase culture was added to 100 mL of the MSM spiked with 25 mg L−1 of phenol. The viability of the culture was checked by dilution plating (Bandyopadhyay et al., 1998). Again, 10% of the broth spiked with 25 mg L−1 of phenol was transferred to MSM containing 50 mg L−1 of phenol. The acclimatization was continued for a maximum phenol concentration of 1,000 mg L−1 (Fig. 2). The organism was adjusted to a higher concentration of phenol following the procedure just described.
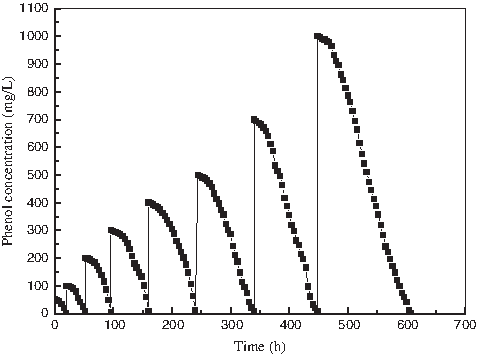
Phenol acclimatization profile at pH 7 and 37°C.
Effect of physical parameters on phenol biodegradation
The growth of the organism was analyzed at regular intervals. A maximum specific growth rate of 0.39 h−1 was obtained with 200 mg L−1 initial phenol concentration. It was observed that the biomass concentration was found to increase with time (Fig. 3). The increasing trend in the biomass with time was a clear indication of the substrate utilization by the mixed microbial culture. It was evident that the organism showed an extended lag phase for phenol concentrations exceeding 200 mg L−1. From Fig. 3, it was observed that the phenol concentration, between 100 and 200 mg L−1, hardly had any inhibitory effect on the microorganism.
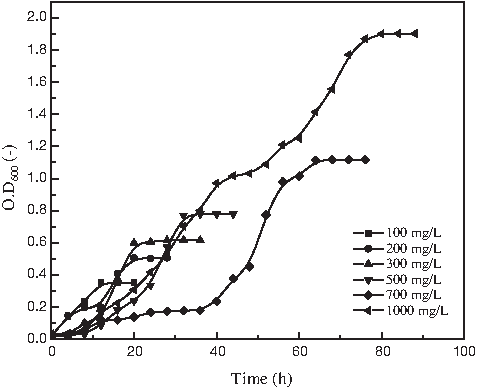
Biomass profile during the phenol consumption at pH 7 and 37°C.
There was no lag phase during its growth with the initial phenol concentration ranging from 100 and 200 mg L−1. Phenol concentration more than 700 mg L−1 had an initial lag of 48 h on the growth of the microbes. The lag may be due to the adaptation of the mixed microbes toward excess quantity of substrate in the growth medium. When comparing the degradation rate, it was found that lower concentration was not degraded as fast as in the case of concentrations more than 200 mg L−1, but the degradation was almost linear with time till the complete consumption of phenol. The higher degradation rate obtained with the initial concentration of phenol more than 200 mg L−1 was due to dependency on growth. Similar kind of results have been reported by Banerjee and Ghoshal (2010). Mixed microbial cultures utilized 1,000 mg L−1 in 88 h duration. The trend obtained with the biomass was a clear representation of Monod growth curve. Phenol was a good substrate for the growth of the mixed microbial culture, and the experimental results indicated that phenol never inhibited the growth the organism for all the concentrations studied.
Figure 4 showed the time profile of phenol degradation by the indigenous mixed culture. It is clear from the profile that the time taken by the mixed culture to degrade phenol was dependent on its initial concentration. The organism degraded concentration ranging up to 300 mg L−1 in less than 40 h without showing any inhibitory effect. It was clear from Fig. 4 that when the concentration of phenol in the growth media was further increased, the degradation rate was found to decrease.
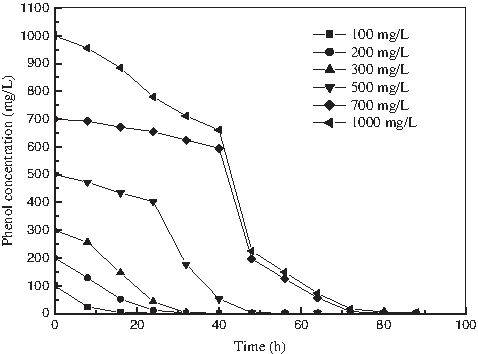
Biodegradation rate of phenol by mixed microbial culture at pH 7 and 37°C.
The pH of the solution is an important parameter in any wastewater treatment process. It can be seen that a maximum of 84.36% of phenol removal was obtained with pH 7 (Fig. 5). This may be attributed to the fact that the phenol degradation is a growth dependant process. Increase in pH inhibited the growth of the mixed microbial consortium, which had a direct effect on its substrate uptake capacity. The pH of the media plays a significant role in the growth of the microbes. Since the pH was varied, the growth was affected, which had a role in the degradation of the substrate. It can be seen from Fig. 5 that there is a decrease in percentage uptake of phenol for the medium pH exceeding 7 and below 6.
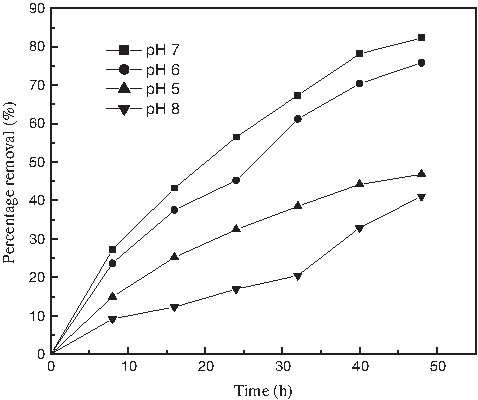
Effect of pH on the biodegradation of phenol by mixed microbial culture at 37°C.
The temperature of the medium was varied between 30°C and 37°C range, and it was found that a slight change in the temperature around 2°C had a drastic effect on the biodegradation (Fig. 6). This was due to the fact that the organism was acclimatized to a specific temperature and pH under increasing load of phenol for an extended period of time. The substrate uptake is dependent on the temperature of the medium. Experiments showed that 37°C was the optimum temperature for phenol degradation by this mixed microbial consortium.
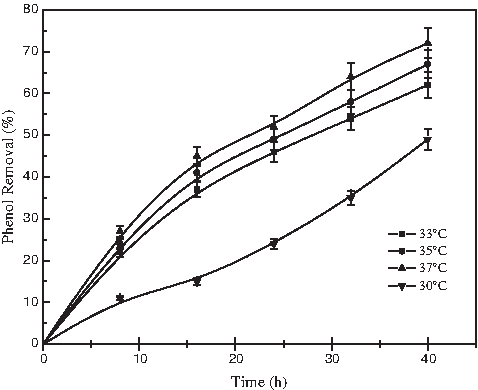
Effect of temperature on the biodegradation of phenol by mixed microbial culture at pH 7.
Growth kinetics
The microbial growth can be represented by a simple Monod equation,
where μ and μmax are specific growth rate and maximum specific growth rate (h−1), respectively, and KS is the saturation constant (mg L−1).
The experimental data on specific growth rate obtained at various initial phenol concentrations were used for estimating the kinetic parameters for all the models studied. However, the Monod equation becomes unsatisfactory for explaining inhibitory growth of microorganisms at higher substrate concentrations (Saravanan et al., 2008).
Modeling the specific growth rate and the specific degradation rate
The presence of phenol in the growth medium had an inhibitory effect on the growth and the specific degradation rate as indicated in Fig. 7. The specific degradation rate was calculated from the equation (8) as given below,
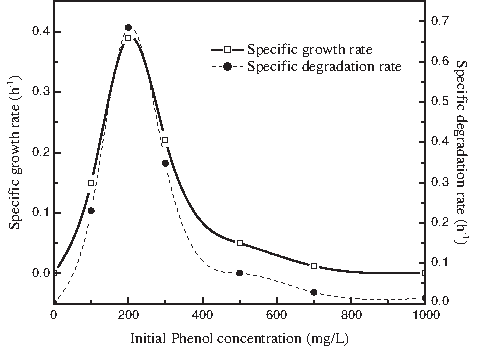
Comparison of specific growth rate and specific degradation rate on different initial phenol concentrations at pH 7 and 37°C.
where S is phenol concentration (mg L−1), q is the specific degradation rate (h−1).
The specific growth rate of the organism was found to decrease from 0.39 to 0.01 h−1 for concentration more than 200 mg L−1. The decrease in the specific growth rate is a clear indication of the substrate inhibition as reported by other authors (Saravanan et al., 2008). The decrease in the specific growth rate for phenol concentration more than 200 mg L−1 was due to the substrate inhibition of phenol (Fig. 8). Haldane model and Han Levenspeil model were the best suitable models to study the substrate inhibition by phenol on this mixed microbial consortium.
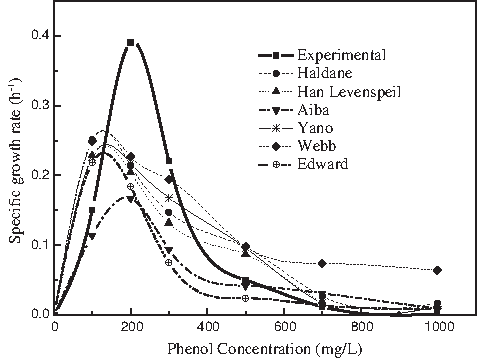
Experimental and predicted specific growth rate at different phenol concentrations.
As discussed earlier, increase in phenol concentration in the growth medium increased the lag phase of the organism, which attributed to the decrease in the specific degradation rate. Various substrate inhibition models were studied to predict inhibition of growth rate. The values of the biokinetic parameters with the models studied were reported in Table 1.
SD, standard deviation.
The Han Levenspiel model fitted well for the specific growth rate, as the KS value obtained was found to be in a close range to the experimental KS value of 35.42 mg L−1. All other models studied predicted a very high KS value. The difference in the specific growth rate values between the experimental μmax and the model prediction was due to the fact that the models were originally derived from different microorganisms and different substrates (Arutchelvan et al., 2006). The coefficient of determination (R2) was calculated for each model (Table 1). It can be inferred from the R2 value (0.987) and the standard deviation average (0.0739) that the Han Levenspeil is the most consistent model for predicting the growth rate. The Webb model also shows similar KS (142.56 mg L−1) and R2 (0.984) values. The Haldane model was widely studied by most of the researchers, as the model was the first of the kind to predict the substrate inhibition. The comparison of the kinetic parameters obtained with the Haldane model with that of literature is given in Table 2. The higher value of inhibition constant (KI=463.56) obtained using the Haldane model was higher than the values reported in the literature. The higher value of the inhibition constant (KI) signified the suitability of the Haldane model. The Haldane model exactly predicted that the mixed microbial consortium could tolerate a higher concentration of phenol up to 1000 mg L−1. All the models adopted in this study have generally been used to describe substrate inhibition on growth of a microbial culture. Therefore, it was more likely that these models fitted the experimental data obtained in the study reasonably well.
Conclusion
A mixed culture of microorganism isolated from refinery wastewater degraded phenol up to a maximum concentration of 1000 mg L−1 in MSM. The optimum growth temperature and pH were found to be 37°C and 7, respectively. The mixed microbial culture predominantly consisted of Streptococci sp. Various kinetic models were tested to calculate the biokinetic parameters of substrate inhibition, and the Haldane model was found to represent the experimental data best. The biokinetic parameters obtained with predictions of growth rate by using the Haldane model were μmax=0.147 h−1, Ks=984.32 mg L−1, and KI=463.56 mg L−1. The parameters just mentioned are essential for the design and simulation of batch and continuous reactors for the treatment of phenolic wastewater. The potential of this mixed microbial consortium toward the degradation of higher concentration phenol can be utilized for the treatment of industrial effluent containing higher concentrations of phenol.
Footnotes
Author Disclosure Statement
The authors declare that no competing financial interests exist.