
Abstract
Abstract
This article provides the methane yield of municipal solid waste (MSW) and its main constituents using the biochemical methane potential (BMP) test. Methane yield of kitchen waste (KW), paper waste (PW), and garden waste (GW) were 357 (±24.7), 147 (±17.1), and 114 (±0.6) mL CH4/g VS, respectively. The hydrolysis constant in the first order kinetic model was 0.25, 0.095, and 0.121 d−1 for KW, PW, and GW, respectively. Effect of the inoculum to substrate (I/S) ratio in the BMP test of MSW was investigated. Methane yields of 297.4 (±18.6), 293.5 (±33.9), and 378.2 (±10.3) mL CH4/g VS were found at I/S ratios of 1.4, 7.2, and 12.9, respectively, whereas the hydrolysis constants were 0.112, 0.151, and 0.221 d−1. A new method based on the production of soluble chemical oxygen demand (SCOD) while selectively inhibiting methanogenesis has been used to determine the hydrolysis constant (0.25 d−1) according to its true definition, which is the conversion of particulate COD to SCOD, showing that the method based on methane evolution can underestimate the actual value when hydrolysis is not the rate-limiting step.
Introduction
Several researchers (Eastman and Ferguson, 1981; Vavilin et al., 1996) have shown that, in the case of particulate substrates, the hydrolytic step is the rate-limiting one. It has been suggested that this is mainly due to steric hindrance of the activity of hydrolysing enzymes by nondegradable polymers (Mudrack and Kunst, 1986). In some systems involving degradation of solids, the stages of acetogenesis and methanogenesis could be the rate-limiting steps instead of hydrolysis. In such cases, the rate of methane formation is not strictly dependent on the hydrolysis rate (Vavilin et al., 2008).
Eastman and Ferguson (1981) proposed that the hydrolytic step obeys first-order kinetics with respect to the remaining concentration of degradable particulate chemical oxygen demand (COD). The first-order hydrolysis function is an empirical expression that reflects the cumulative effects of the many sub-processes. Previous work on the hydrolysis constant of municipal solid waste (MSW) showed that the value ranges between 0.01 and 0.4 d−1 (Vavilin et al., 2008).
Conventional techniques for assessing the hydrolysis constant in a batch reactor involve the analysis of dissolved COD and VFAs in addition to methane production. For instance, O'Sullivan et al. (2007) measured methane, hydrogen, and VFAs and converted these values into COD equivalents in order to express the extent of solubilization. Methane evolution is often used to determine the hydrolysis constant, but the value will be underestimated if intermediary compounds such as VFAs or hydrogen build up, resulting in a delay of methanogenesis (Veeken and Hamelers, 1999). Soluble chemical oxygen demand (SCOD) has been used previously to study the solubilization kinetics of waste activated sludge at various pHs and temperature under alkaline conditions (Vlyssides and Karlis, 2004). It was also reported that the cumulative SCOD curve rose before the cumulative methane curve, suggesting that intermediates formed during the hydrolysis step were possibly toxic to the methanogenic population (Neves et al., 2006). The wide range of values for the hydrolysis constant could be related to the method used. Therefore, the aim of this study was to determine the hydrolysis constant during the anaerobic digestion of the MSW with various methods and also explore the main factors affecting its determination.
Materials and Methods
Municipal solid waste
The MSW used in this study consisted of 16.2% kitchen waste (KW), 6.2% garden waste (GW), and 77.5% paper waste (PW) on a dry basis. It was blended to reduce the particle size and to enable homogeneous samples to be taken. Details regarding the preparation and physicochemical properties of MSW, collection, and storage of the waste components can be found elsewhere (Trzcinski and Stuckey, 2009).
Biochemical methane potential
Biochemical methane potential (BMP) tests were carried out in duplicate on KW, GW, PW, and MSW according to Owen et al. (1979) at an inoculum to substrate (I/S) ratio of 2.1 (on a volatile solids basis). A known mass of each waste was introduced into serum bottles such that ∼2 g COD/L was obtained, and the bottles were incubated in an orbital shaker at 35°C. The biogas volumes were regularly measured using a wetted glass syringe and reported at atmospheric pressure and a temperature of 20°C. The composition of gas was determined using a Shimadzu GC-TCD fitted with a Porapak N column (1500 mm ×6.35 mm). Two blanks containing the inoculum and the biomedium were run in parallel, and the methane produced was subtracted from the methane produced in the bottles containing the samples. The cumulative methane yield was calculated as follows:
where Mt is the cumulative methane yield at time t (mL CH4/g VS), Vt is the volume of biogas or methane measured at time t (mL), %CH4,t is the methane percentage at time t, Vh is the headspace volume (mL), and Bt is the average of the cumulative methane production in the blanks (mL CH4). The difference between all the data sets from BMP tests were statistically analyzed using a t-test in Microsoft Excel 2007.
Effect of the inoculum
A BMP test was carried out on the MSW to determine the influence of the inoculum on the hydrolysis constant. One inoculum was taken from a lab-scale anaerobic bioreactor fed with the same MSW as described above (Inoculum A). The other inoculum tested (Inoculum B) was taken from a large-scale anaerobic digester treating sewage sludge (Mogden). In order to compare the two inocula, their volatile suspended solids (VSS) content was adjusted to 0.5 g VSS/L with the anaerobic biomedium defined by Owen et al. (1979) that contains NaHCO3 to buffer the pH. The BMP test was conducted in duplicate at an I/S ratio of 0.25, and control bottles containing no MSW were run in parallel.
Effect of the I/S ratio
The BMP test was carried out using different volumes of inoculum (10, 50, or 90 mL) in 165 mL bottles (65 mL of headspace) containing 200 mg of MSW on a dry basis (170 mg volatile solids) in order to investigate the effects of different I/S ratios (1.4, 7.2, and 12.9 g VSinoculum/g VSsubstrate). The final volume was adjusted to 100 mL with the anaerobic biomedium defined by Owen et al. (1979) containing macro- and micronutrients, and sodium bicarbonate to buffer the pH. Each I/S ratio tested was run in triplicate and a triplicate blank was run to control the methane yield due to cell lysis for each of the amounts of inoculum tested in the absence of MSW.
Determination of the hydrolysis constant based on methane production
The first-order model was used for the determination of the hydrolysis constant during the anaerobic digestion of MSW (Pavlostathis and Giraldo-Gomez, 1991; Veeken and Hamelers, 1999). Thus, the production of methane is assumed to follow:
where Y is the cumulative methane yield at time t, and Ymax is the ultimate methane yield.
The lag-phase before the start of methane production was determined using the Gompertz equation (Lay et al., 1997; Nopharatana et al., 2007):
where M is the cumulative methane production (mL), P is the methane production potential (mL), Rm the maximum methane production rate (mL/d), λ is the duration of the lag phase (d), and t is the duration of the assay in which cumulative methane production M is calculated (d). The parameters P, λ, and Rm were estimated by applying a least squares fit of the above equation to the experimental data set.
Determination of the hydrolysis constant based on SCOD production
In order to study hydrolysis based on the evolution of SCOD concentration in the supernatant, methanogenesis was selectively inhibited by adding sodium bromoethanesulfonate (BES, 98%; Sigma-Aldrich) so that a final concentration of 10−5 M of BES was obtained in the 100 mL bottle (Smith, 1983). BES was shown to inhibit both acetate and hydrogen-utilizing methanogens, without affecting acidogens (Hickey et al., 1987). Other chemicals such as formaldehyde, chloroform, and trichloroacetic acid have also been shown to have the same effect; however, the two latter can be lost by volatilization and can also affect the metabolism of acetogens (Hickey et al., 1987). The experiment was carried out in triplicate, and the measurement of SCOD was also carried out in triplicate as described in Standard Methods (APHA, 1999). Samples for SCOD were filtered through 0.45 μm filter before analysis so that biomass growth was excluded from the COD measurement. The value for kh in Equation 1 was estimated by plotting
Results and Discussion
BMP of the MSW and its components
Figure 1 shows the cumulative methane production of MSW and its components, and Table 1 lists the experimental results and the Gompertz coefficients. The lag phase, λ, was significantly shorter for KW (5.8 days) and MSW (4.5 days) than for PW (18.4 days) and GW (17.5 days). GW was slowly biodegraded due to its high lignin content, which is not degradable under anaerobic conditions. The anaerobic digestion of the organic substrate can sometimes, but not always, display a lag phase, which is a necessary period for adaptation and initiating bacterial multiplication, and a rapid decomposition phase when bacterial growth is the highest (Lopes et al., 2004). The lag phase period is mainly influenced by the initial concentration of microorganisms, substances stimulating the growth of bacteria, and acclimatisation of the inoculum to the substrate (Lay et al., 1997). The hydrolysis constants were 0.091, 0.25, 0.095, and 0.121 d−1 for MSW, KW, PW, and GW, respectively. Despite having a shorter lag-phase than GW the degradation of MSW was represented by a hydrolysis constant similar to that of GW. This may be due to preferential adsorption of exo-enzymes onto the lignin fibres of PW and GW, while some methane was produced due the degradable compounds in KW. Due to the complex nature of MSW a period of adaptation was required. The results show that the hydrolysis constant depends greatly on the relative proportion of each constituent.

BMP test on KW, PW, GW, and MSW. The line shows the best fit to the data points using the Gompertz equation. Error bars show the standard deviation. BMP, biochemical methane potential; KW, kitchen waste; PW, paper waste; GW, garden waste; MSW, municipal solid waste.
Biodegradability based on COD content.
BMP, biochemical methane potential; MSW, municipal solid waste; COD, chemical oxygen demand; KW, kitchen waste; GW, garden waste; PW, paper waste.
Effect of the inoculum
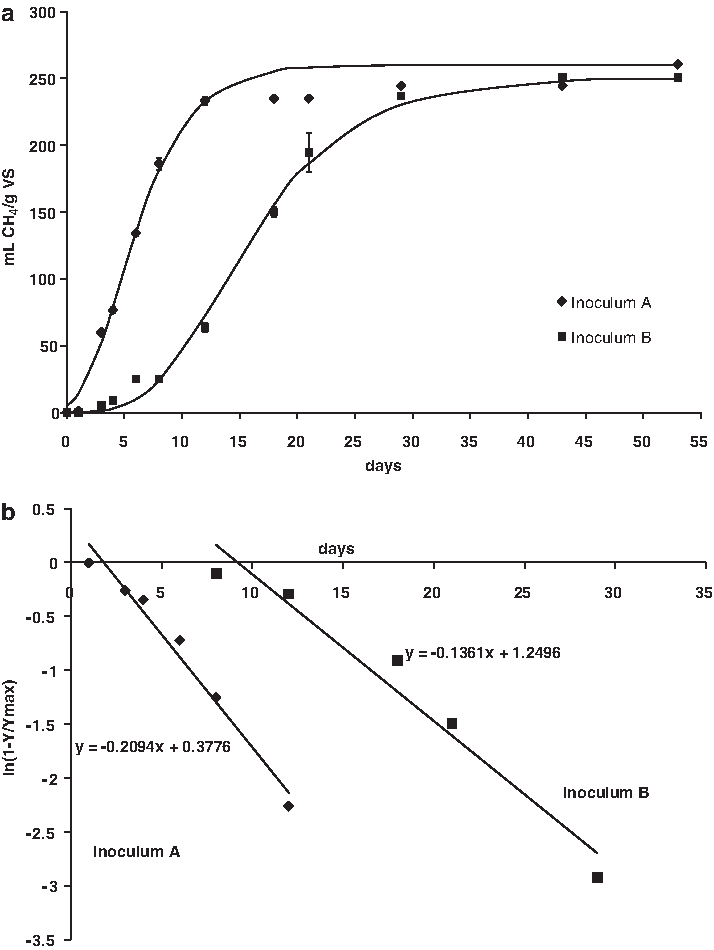
Figure 2 shows the effect of the inoculum used in the BMP test of MSW. When an inoculum previously fed with MSW (Inoculum A) was used a significantly greater methane production rate was found compared to an anaerobic inoculum treating sewage sludge (Inoculum B). Although the ultimate methane yields were close, the one obtained with Inoculum A was significantly greater at a 95% confidence level (α=0.05). The lag phases were 1.2 and 7.1 days for Inoculum A and B, respectively, while the hydrolysis constants were found to be 0.209 and 0.136 d−1 for Inoculum A and B, respectively, showing that the choice of the inoculum will have a significant impact on the hydrolysis constant.
Effect of the I/S ratio
Figure 3 shows the cumulative methane potential at different I/S ratios and the Gompertz equation fitted to the data points. Various researchers have investigated the BMP of organic solid waste at I/S ratios up to 2–3, but no studies at higher I/S ratios were found. The initial methane production rate was significantly greater with increasing I/S ratio. The ultimate methane yields at I/S ratios of 1.4 and 7.2 were similar with values of 297.4 (±18.6) and 293.5 (±33.9) mL CH4/g VS, respectively, but the one at an I/S ratio of 12.9 was significantly higher at 378.2 (±10.3) mL CH4/g VS. The respective methane percentages in the biogas were 38.4% (±0.5%), 43.8% (±0.5%), and 49.2% (±0.3%). A greater number of acetate and hydrogen-utilizing methanogens at high I/S ratios could possibly explain the higher initial rate of methane production and the higher methane content in the biogas throughout the BMP test. The hydrolysis constant at I/S ratios of 1.4, 7.2, and 12.9 were 0.112, 0.151, and 0.221 d−1, respectively.
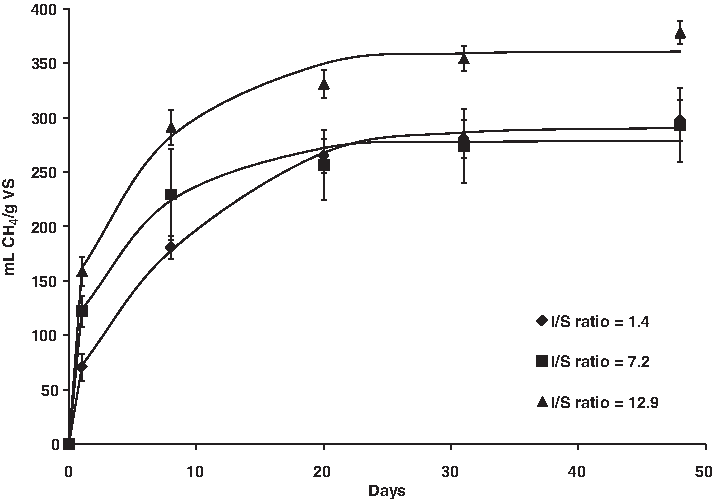
Effect of I/S ratio on the BMP test of MSW. The line shows the best fit to data points using the Gompertz equation. Error bars show standard deviation. I/S, inoculum to substrate.
These results provide evidence that high I/S ratios can result in higher methane yields and hydrolysis constants. This could be due to a higher number of fermentative bacteria introduced into the test bottle resulting in an enhanced hydrolysis of solids. This is in line with O'Sullivan et al. (2007), who stated that the number of cells in the anaerobic digester had a greater impact on the hydrolysis rate than the microbial community, media, and other environmental factors.
Hydrolysis constant based on SCOD evolution
In this section the hydrolysis constant during MSW degradation was determined from the evolution of SCOD instead of methane production. To follow the accumulation of SCOD the conversion of acetate and hydrogen to methane was inhibited by BES. Regular analysis of the headspace gas confirmed that BES inhibition worked well, and the slight increase in methane (0.5% to 2% over 50 days) was negligible on the COD balance. The pH remained in the range 6.4–6.7 throughout the experiment.
As Fig. 4 shows, the SCOD increased more rapidly than methane production due to the enzymatic activity of hydrolytic bacteria and the conversion of monomers to VFAs by acidogens, which is consistent with the work of Neves et al. (2006). After 10 days the curve reached a plateau meaning that the residual particulate COD was recalcitrant. The difference between the two curves indicates the fraction of SCOD that is recalcitrant and cannot be fermented to methane. Approximately 63.5% (±1.7) of the COD fed was solubilized by hydrolyzing bacteria.

Comparison of the fraction of the total COD converted into SCOD (by inhibiting methanogenesis using bromoethanesulfonate) or to methane (expressed as COD). The error bars show the standard deviation. For methane, error bars were smaller than the marker. COD, chemical oxygen demand; SCOD, soluble chemical oxygen demand.
The effect of BES is to rapidly increase the headspace hydrogen, resulting in a complete inhibition of methanogenesis. For instance, Hickey et al. (1987) used 5 mM BES during the anaerobic digestion of waste activated sludge and observed a 250 ppm H2 partial pressure after 10 h followed by a build up of acetic, propionic and butyric acids. Although hydrogen was not measured in this study, it quickly inhibited methanogens without inhibiting acidogens and acetogens resulting in an accumulation of SCOD in the form of VFAs. This can easily occur even at low concentrations of hydrogen, and therefore the loss of H2 will be negligible in the COD balance as shown by Veeken and Hamelers (1999), who used a higher COD loading than in this work. It is also possible that a fraction of the H2 will come from the biodegradation of BES itself rather than from the substrate.
When attempting to determine the hydrolysis constant using methane production, a delay is observed due to temporary VFAs or hydrogen build-up, a lack of syntrophic association, or the slow kinetics of propionate oxidation as demonstrated by Trzcinski and Stuckey (2009) using the same MSW. Methane production rate can be used to determine the hydrolysis constant when there are no delays, in other words when the hydrolysis is the rate-limiting step (Vavilin et al., 2008). It has been shown that hydrolysis can be inhibited by the accumulation of amino acids, sugars, and VFAs (Vavilin et al., 2008). However, this is unlikely in the present study as the SCOD accumulated to 1.4 g/L due to the low initial total COD loading of 2.21 g/L, which is close to the initial COD loading recommended by Owen et al. (1979) for methane production.
This new method is based on the selective inhibition of one step of anaerobic digestion (methanogenesis), so that only one analysis (SCOD) is sufficient to determine the hydrolysis constant, which is particularly useful if no GC is available in the laboratory for methane and/or VFAs analysis, and hence this approach considerably simplifies analytical requirements. Moreover, the traditional measurement of methane production for calculation of the hydrolysis constant can be underestimated due to inhibition of methanogens or by a lack of syntrophic associations, that is, when acetogenesis or methanogenesis is the rate-limiting step. In this novel method, factors affecting methanogenesis are not relevant since it is selectively inhibited, and therefore the calculation of the hydrolysis constant is based on the truest definition of hydrolysis which is the conversion of particulate COD to SCOD consisting of sugars, alcohols, and VFAs.
Using this new approach the hydrolysis constant was found to be 0.252 d−1, which is greater than the value found by measuring methane production, and these results are compiled in Table 2 with data from previous work. It appears that the hydrolysis constant obtained by SCOD evolution was the highest, and this value is achieved when an acclimatised inoculum is used (Inoculum A) and when a high I/S ratio is used for the BMP test. These two characteristics will minimize the potential inhibition caused by acid build up or by an imbalance between the various trophic groups. Veeken and Hamelers (1999) highlighted the fact that methane production can only represent the hydrolysis rate when there is no accumulation of intermediary products, which is achieved by using an acclimatized inoculum at a proper I/S ratio in a buffered medium. When accumulation of VFAs or hydrogen is suspected, the method based on SCOD should be used to avoid underestimating the hydrolysis constant.
I/S, inoculum to substrate; n.a., not available.
Conclusions
The methane yields of MSW and its constituents were determined using the BMP test. The relative composition of MSW and the inoculum used for the BMP test was found to greatly affect the hydrolysis constant. The methane yield and hydrolysis constant were found to increase with increasing I/S ratios: at an I/S ratio of 12.9, a methane yield of 378 mL CH4/g VS and a hydrolysis constant of 0.22 d−1 were found.
A new approach based on the true definition of hydrolysis has been used to determine the hydrolysis constant (0.25 d−1). Methanogenesis was selectively inhibited while the evolution of SCOD was measured. Using methane instead of SCOD production can lead to underestimation of the hydrolysis constant in the first-order kinetic model when there is inhibition due to VFAs and H2 build up, which can be the case in a poorly buffered medium or at low I/S ratios.
Footnotes
Acknowledgment
The authors are grateful to the Department of Environment, Food and Rural Affairs (DEFRA), in the United Kingdom for their sponsorship of this research.
Authors Disclosure Statement
The authors declare that no competing financial conflicts exist.