
Abstract
Abstract
Soil samples were collected over a year-long period along a background–urban–rural transect in Delhi, India for the analysis of polycyclic aromatic hydrocarbons (PAHs), black carbon (BC), and total organic carbon (TOC) in five grain size fractions, x, in μm of 0≤x<53 (I), 53≤x<250 (II), 250≤x<500 (III), 500≤x<2000 (IV), and their sum (total: T). Maximum concentrations of PAH, BC, and TOC were observed in the smallest fraction (I) comprising silt and clay, irrespective of site or season. Results of the molecular diagnostic ratios and principal component analysis (PCA) identified coal, wood, biomass burning, and vehicular emissions as major sources of PAHs at all the three sites, while BC/TOC ratios pointed toward biomass combustion as the chief source of carbonaceous species. This work presents the first such rural-urban transect study considering PAH, BC, and TOC in soil.
Introduction
The environmental movement of PAHs proceeds across varied environmental reservoirs in a series of short steps (repeated cycles of volatilization followed by atmospheric transport and deposition) commonly termed the “grasshopper effect” or “cold condensation” (Ping et al., 2007). This property allows their transport over long distances from the original source. It has been estimated that more than 90% of the total environmental burden of PAHs reside in surface soils (Wild and Jones, 1995). Black carbon (BC) has attracted considerable interest from environmental chemists because of its enhanced sorption capacity for some hydrophobic organic compounds (e.g., at least 10–100 times) relative to amorphous organic matter (AOM).
We focused on three key components of PAH chemistry in the soil environment. First, the distribution of PAHs, BC, and total organic carbon (TOC) in size-segregated soil was evaluated to help explore an interaction between soil grain size and pollutant fractionation. Second, the relationship between PAHs and carbonaceous species in soil layer was investigated as the controlling factor of PAH pollution cycling. Third, a transect across background-rural-urban boundaries was made to assess the presence of spatial gradients in relation to local source strengths. This work can thus be represented as the first effort to concurrently measure the distribution of PAH, BC, and TOC in soil along the rural-urban transect in India.
Methodology
New Delhi, the capital of India, is also one of the most polluted cities in the country. The vehicular population in Delhi has increased dramatically from 2.3 million in 1975 to 6.1 million in 2009 (Transport Dept, 2009). Around 129,000 small-scale industries, 28 authorized industrial estates, and several unofficial industrial areas operate within the city (Delhi Govt, 2006). Increasing, industry, vehicles and three power plants, namely: Badarpur (coal-based 720 MW), Rajghat (coal-based 135 MW), and Indraprastha (coal-based 277 MW and gas-based 180 MW), have been identified as the major sources of pollution in the city.
The air in Delhi is dry for most of the year, with very low relative humidity from April to June and markedly high humidity in July and August, when weather conditions are oppressive. Except during the monsoon months (July to mid-September), winds are predominantly from a northwesterly direction. In the monsoon months, easterly and southeasterly winds are more common (Agarwal et al., 2009).
The locations of our soil sampling sites are given in Fig. 1. The chosen transect was ∼35 km long and ran from north-northwest to south-southeast. This transect was selected so as to consider the effect of the predominant wind direction in Delhi, that is, northwest-southeast. The three sites chosen for soil sampling can be considered to represent three different land-use patterns: background (BG), rural (RR), and urban (UB) areas. Detailed descriptions of analytical methods and quality assurance for all target PAHs are given below (Tables 1–4).
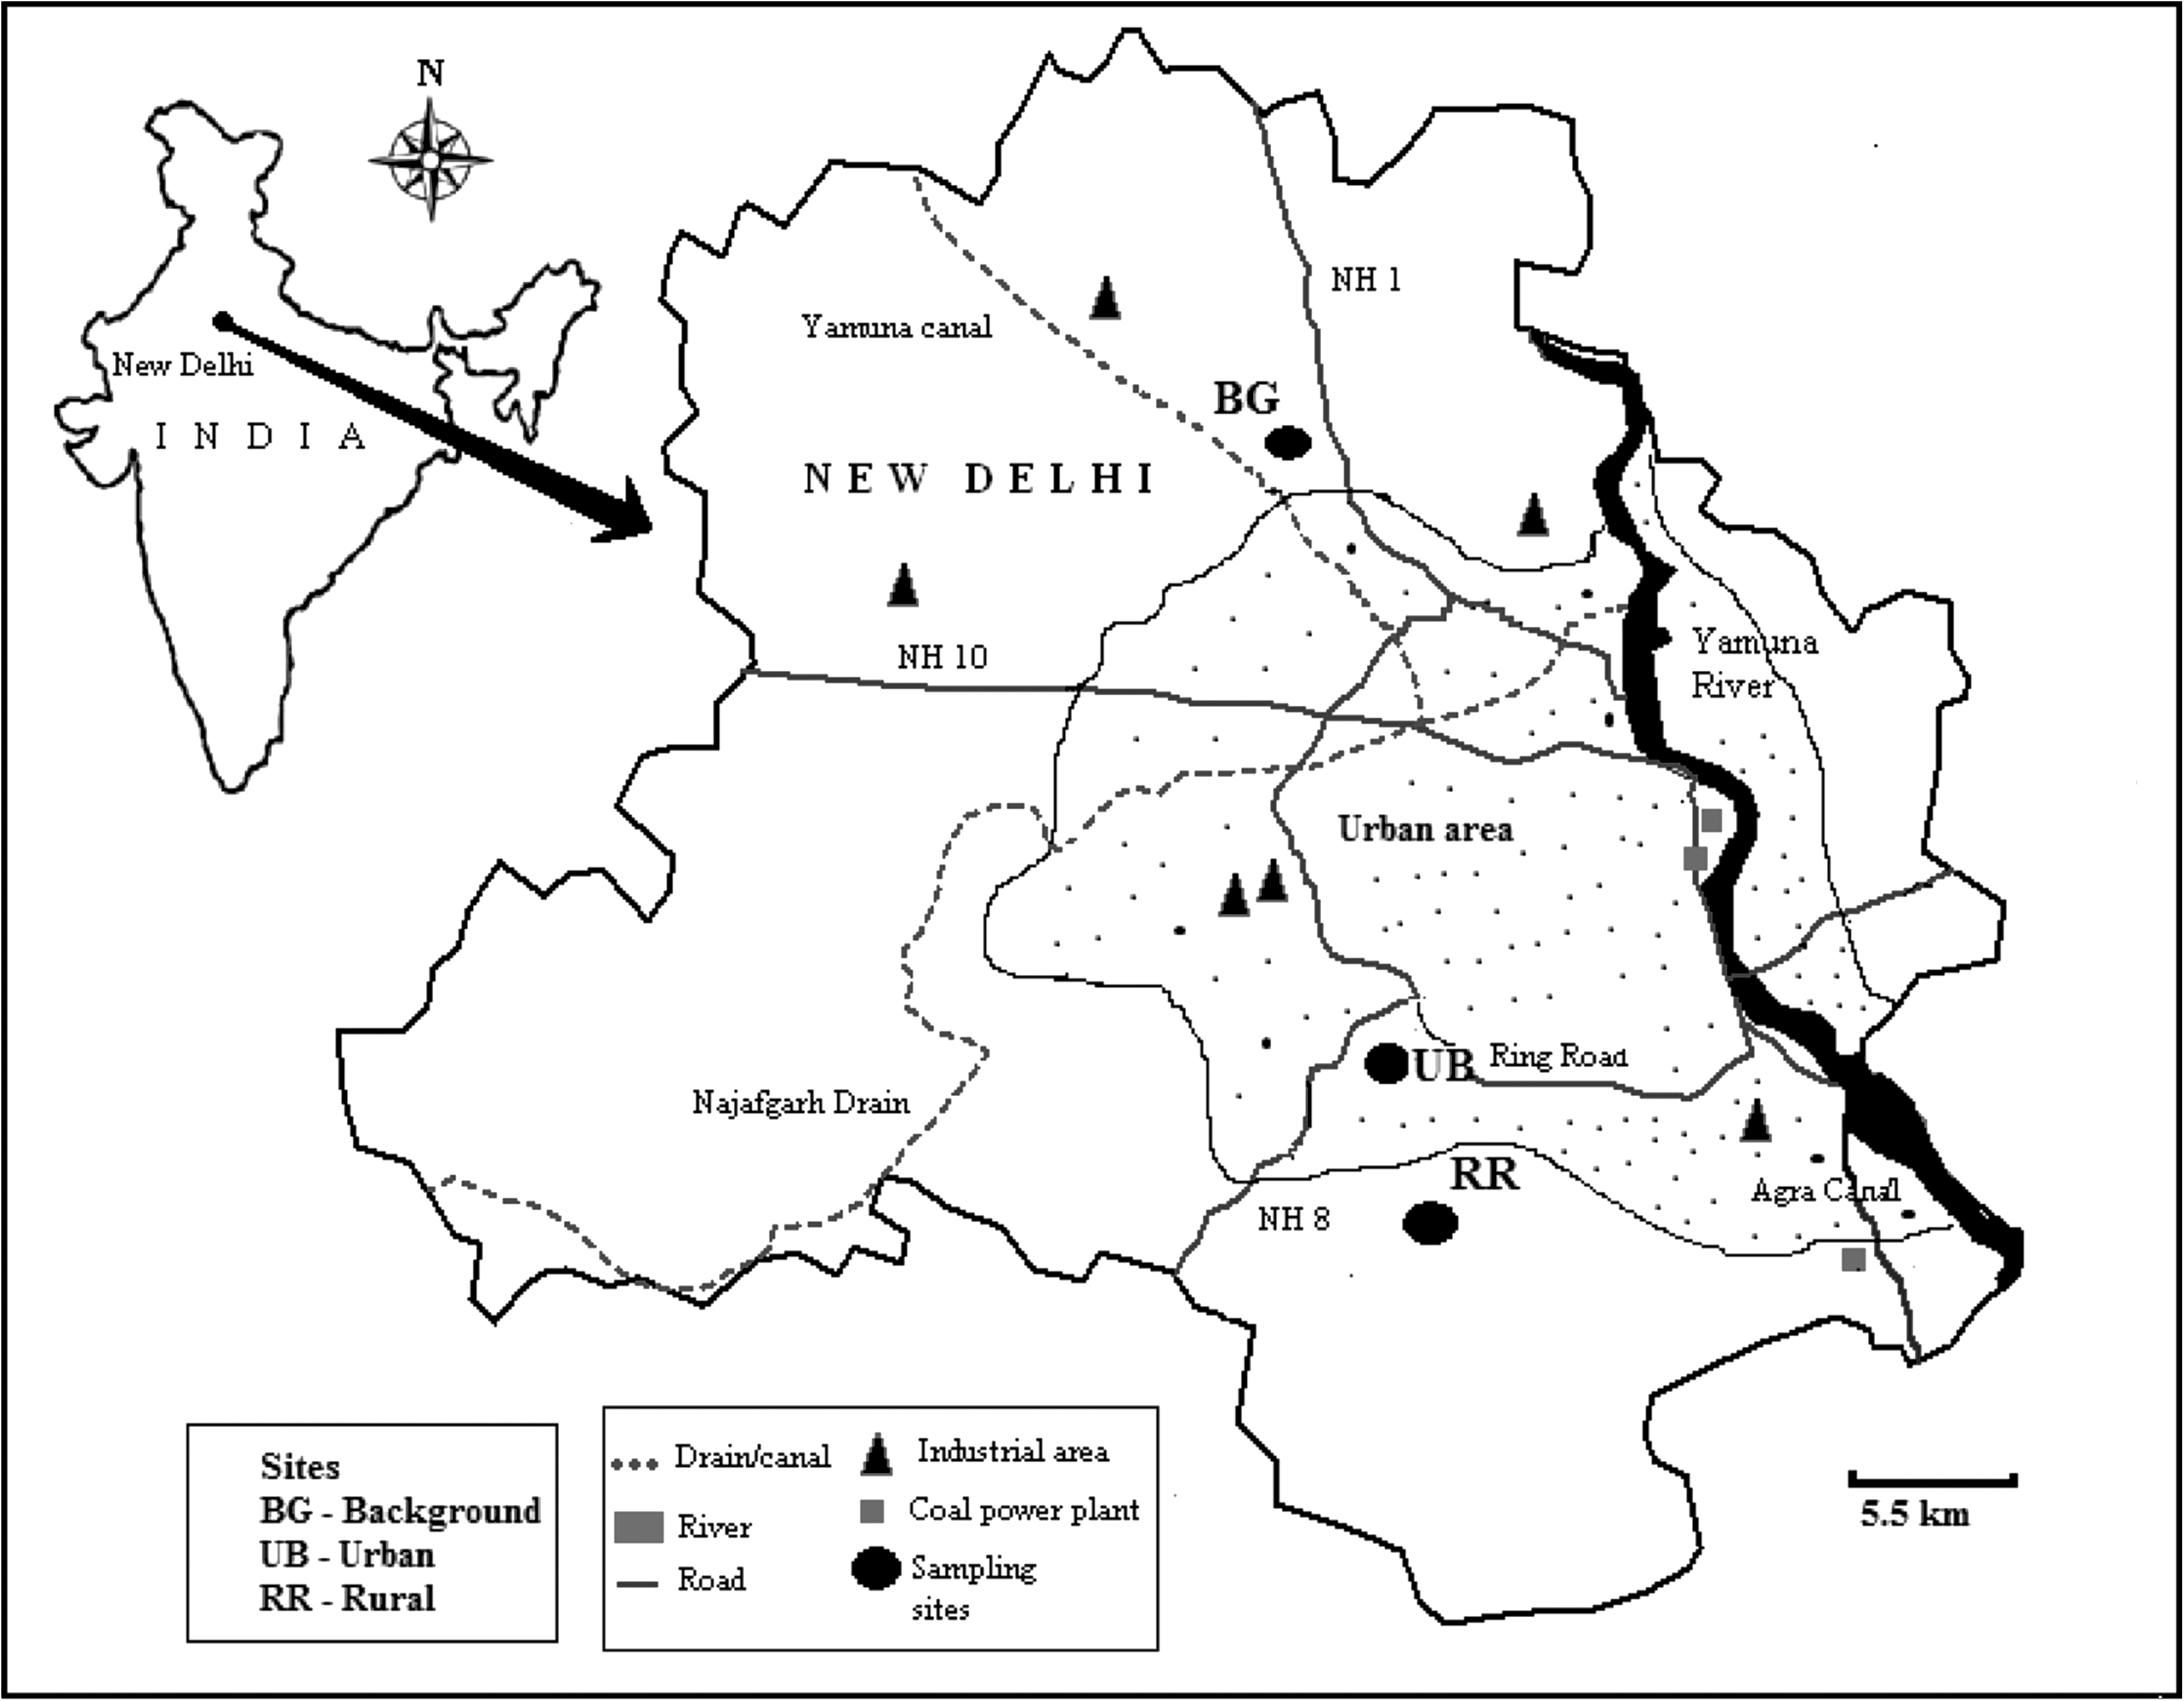
Three soil sampling sites along the background–urban–rural transect in Delhi, India.
PAH, polycyclic aromatic hydrocarbon; abbr., abbreviation; MW, molecular weight (in g/mol).
Measurements were made three times during the whole study period at each soil fraction: I, 0≤x<53 μm; II, 53≤x<250 μm; III, 250≤x<500 μm; IV, 500≤x<2000 μm; total (T), 0≤x<2000 μm. Units: PAH concentrations in μg/kg; BC and TOC concentrations in mg/g.
BGP, ICP, and DBA were not detected at the BG site.
LPAH, sum of low-MW PAHs (order 1–6); HPAH, sum of high–MW PAHs (order 7–16).
Measurements were made three times during the whole study period at each soil fraction: I, 0≤x<53 μm; II, 53≤x<250 μm; III, 250≤x<500 μm; IV, 500≤x<2000 μm; T, 0≤x<2000 μm. Units: PAH concentrations in μg/kg; BC and TOC concentrations in mg/g.
Measurements were made three times during the whole study period at each soil fraction: I, 0≤x<53 μm; II, 53≤x<250 μm; III, 250≤x<500 μm; IV, 500≤x<2000 μm; T, 0≤x<2000 μm. Units: PAH concentrations in μg/kg; BC and TOC concentrations in mg/g.
Results and Discussion
To evaluate the relative relationship between different PAH behaviors, our data were examined individually and in groups. For instance, the following three terms were also used: total PAH (TPAH: sum of all individual PAH), low–molecular weight PAH (LPAH: sum of 2–3 ring PAHs), and high–molecular weight PAH (HPAH: sum of 4–6 ring PAHs).
General status of PAH pollution in soil and their spatial variation
The annual average PAH concentrations at three different sites (BG, RR, and UB) are described for each soil fraction in Tables 2–4. The variations in different soil fractions in the three study sites are shown in Fig. 2. In all cases, the maximum PAH concentration was observed in the smallest grain size fraction comprising of clay and silt (fraction I). An increase in PAH concentrations with decreasing particle size (from sand to clay) has been reported from many studies (Ghosh et al., 2000; Krauss and Wilcke, 2002). Silt-bound soil organic matter (SOM) generally displays a higher aromaticity than sand and clay sized particles, reflecting the high affinity of silt-sized separates for PAHs (Müller et al., 2000; Amellal et al., 2001).

Variation of individual polycyclic aromatic hydrocarbons (PAHs) in different soil fractions at the three sampling sites (BG, RR, and UB). T, total.
It is possible to infer that PAHs in macro-porous fractions are more prone to volatilization or degradation relative to micro-porous fractions. Further, silt could supply much more colloidal matter than sand, which would facilitate their build-up through mobilization (Villholth, 1999). If one assumes that the composition of soil is fairly constant between 0 and 5 cm, then the partitioning of PAHs observed in Delhi soils can be considered to be a function of particle size rather than the depth of soil layer.
The mean TPAH concentration at the BG site varied from 511 to 694 μg/kg (Table 2). The PAH pattern at BG site was dominated by LPAH (>70% of TPAHs; Fig. 3). This finding suggests that the BG site, being upwind of the city, is less significantly affected by anthropogenic emission. Among the individual PAHs, naphthalene (NAP) showed the maximum concentration, followed by acenaphthylene (ACN) and acenaphthene (ACL; Fig. 4). These compounds are known to arise due to wood combustion-related sources (Fang et al., 2004). These observations along with low TPAH levels at our BG site represent typical PAH pollution characteristics of a BG site.
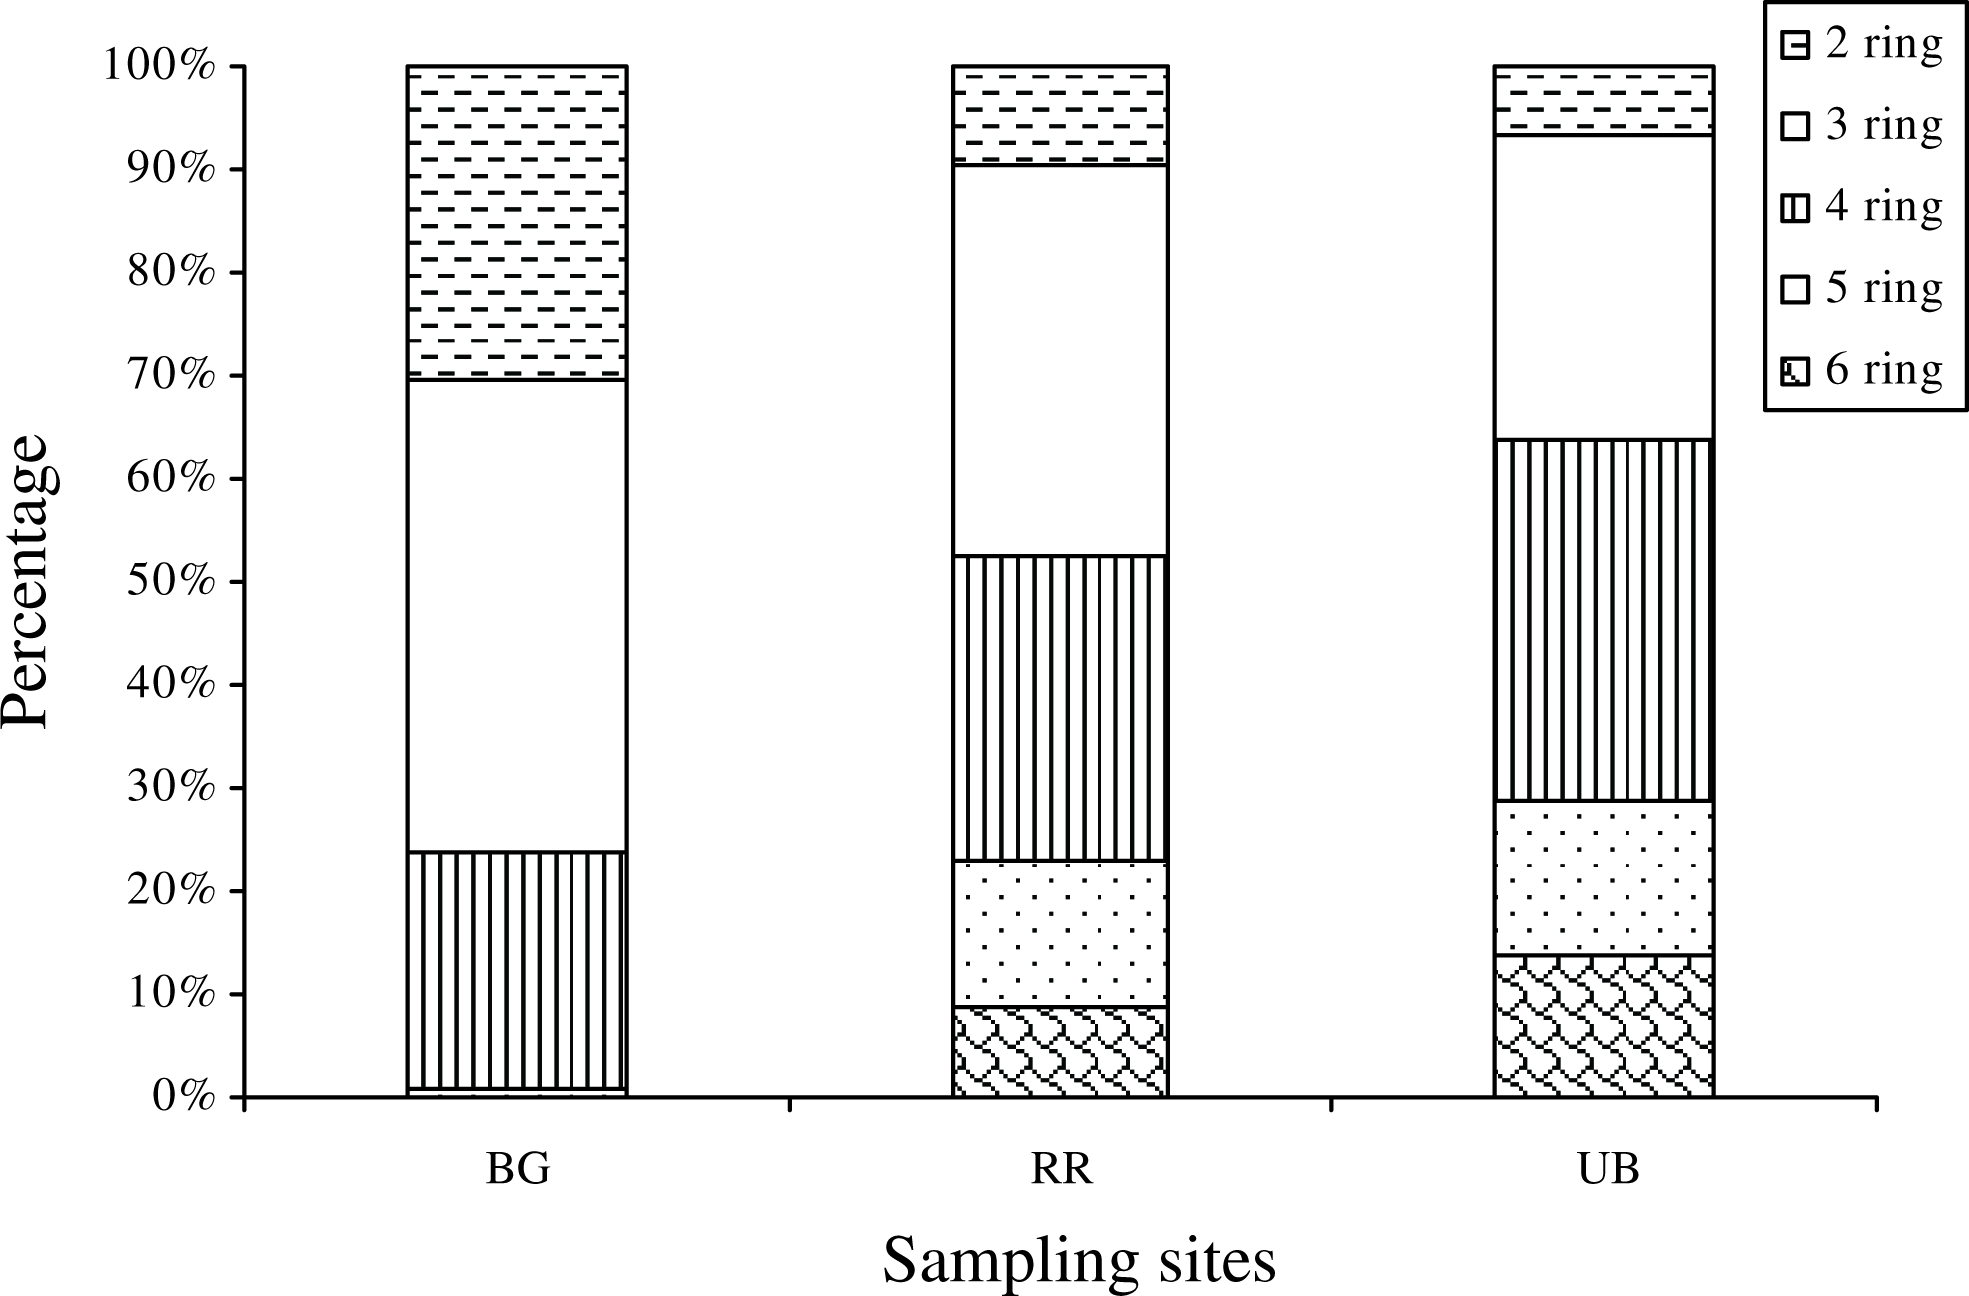
Relative composition of PAHs (with different rings from 2 to 6) measured from total (T) soil fraction between three study sites.
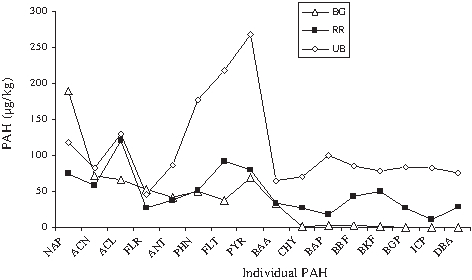
Individual PAH composition in total (T) soil fraction at the three sampling sites.
The mean TPAH values at the RR site varied from 647 to 1142 μg/kg (Table 3) between the different soil fractions. PAH concentrations were dominated by ACL followed by NAP and ACN (Fig. 4). Three-ring PAHs constituted the largest fraction, ∼40% of TPAHs, while six-ring counterparts contributed the smallest fraction: <5% (Fig. 3). High concentrations of LPAH (e.g., NAP and ACL) are commonly considered a marker of low temperature biomass combustion (Cai et al., 2007; Agarwal et al., 2009) and residential wood combustion (Fang et al., 2004). This abundance of LPAH could also have originated from fresh liquid fuel spills and vapor emissions from frequent farming activities, for example, ploughing. In agricultural soil collected from the Palam and Najafgarh areas in the south-west Delhi, Agarwal et al. (2009) observed notably higher TPAH values (1590 and 1320 μg/kg) relative to the present study.
The mean TPAH concentration at the UB site varied between 991 and 2241 μg/kg across the various fractions (Table 4). The PAH concentration pattern at the UB site was dominated by four-ring PAHs such as pyrene (PYR), fluoranthene (FLT), and phenanthrene (PHN; Fig. 4). These three PAHs are commonly considered tracers of vehicular emissions (Khalili et al., 1995; Garcia-Alonso et al., 2003; Fang et al., 2004; Wan et al., 2006); their predominance could be due to the extensive deposition of particles produced from fossil fuel combustion, primarily from vehicular emissions (Kogut et al., 2006; Aichner et al., 2007; Jiang et al., 2009). Along the chosen transect, concentrations of PAHs, BC, and TOC followed the expected trend of UB > RR > BG (Fig. 5). As the BG site was chosen to be upwind of the city, it showed the lowest impact of anthropogenic sources. The UB site, on the other hand, was characterized by the mixed effects of vehicular and coal combustion sources, which are typical in UB centers of Asian countries. The RR site showed more complicated patterns than the other two study sites with five significant source types. Apart from local emissions due to agricultural practices and domestic sources, RR seems to be a receptor for PAHs transported over long distances (e.g., from UB areas). In particular, the PAHs with a vehicular origin detected at the RR site could have originated from nearby UB zones. Because the location of the RR site is downwind of the city, a concentration gradient of pollutants (such as PAHs) may exist along the transect between the city and the RR site.
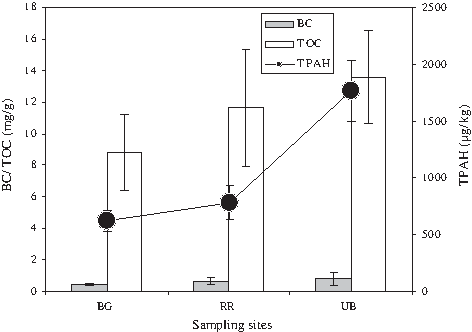
Variation in total PAH (TPAH), black carbon, and total organic carbon levels along the background–rural–urban transect.
TPAH concentration at UB was around two times higher than RR, although they are located relatively close to each other (∼7 km apart). This suggests that the differences were not only determined by nearby sources but also by volatilization and/or conversion of PAHs during the mobilization of particles from soil or in air. In addition, soil PAH profiles also varied between different sites. This was probably an indication that different source profiles will have affected those sites. Further, as the distance from the source varies, this is likely to result in a change of the PAH profile during transport (Oliveira et al., 2007). Therefore, the transect chosen in this study allows assessment of (i) the relative location of source and receptor sites with respect to the prevailing wind direction and (ii) the proximity of these sites to point and diffuse sources.
Seasonal variations in study sites
The seasonal variation of total PAHs at all the study sites was characterized in most soil fractions by the highest concentrations being observed during winter (Fig. 6), while the lowest during summer. Analysis of variance (ANOVA) provides a statistical test of whether or not the means of several groups are significantly different, and therefore generalizes the t-test to more than two groups. Two-factor ANOVA, showed that the TPAH values at all three sites are significantly different over the three seasons at the 95% confidence level.
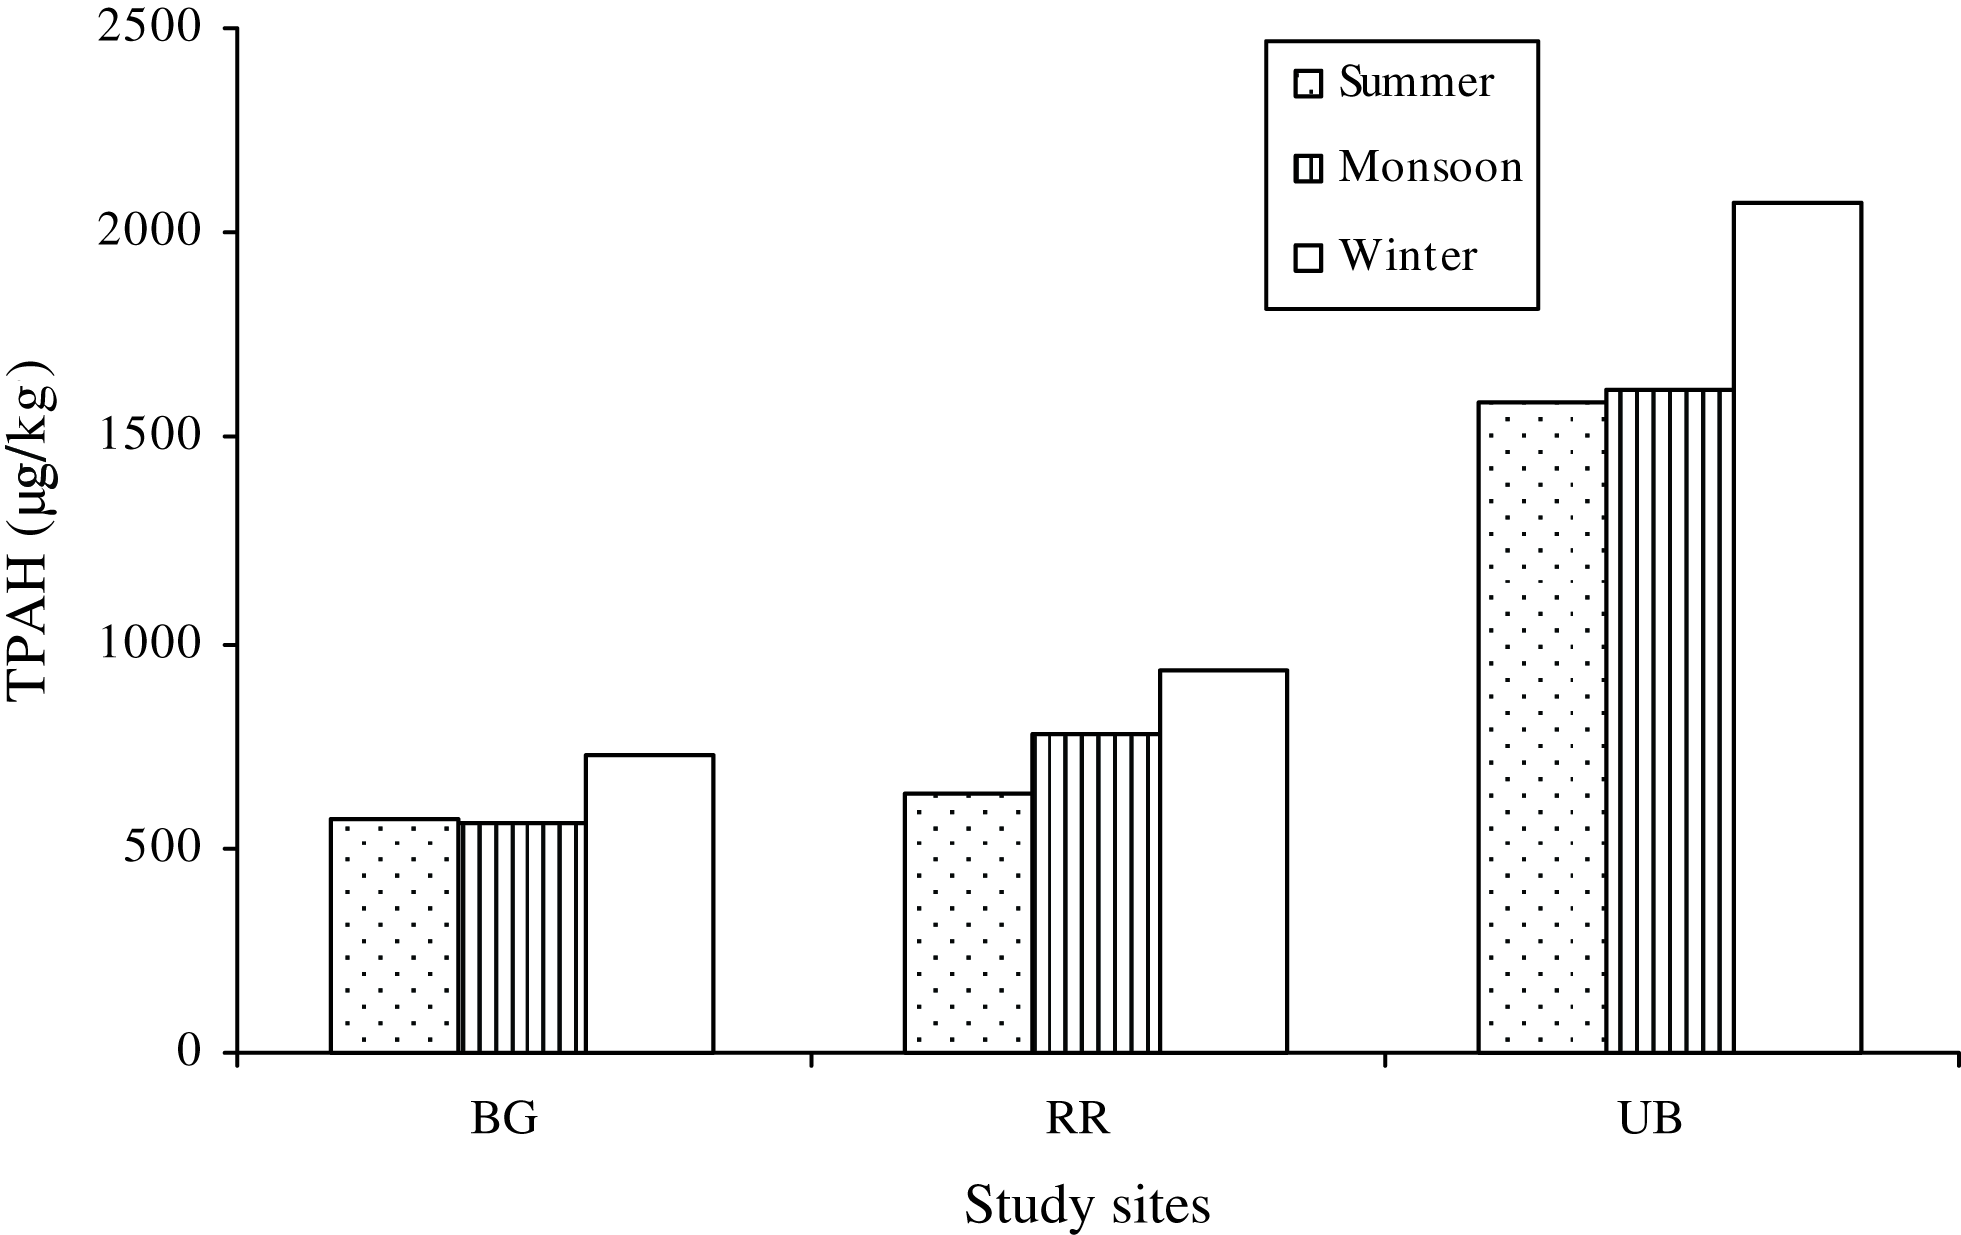
Seasonal variation of TPAH in total (T) soil fraction at the three sites.
The winter concentration at all the three sites is ∼25% higher than in summer. This is consistent with other reported studies (Oliveira et al., 2007; Tremolada et al., 2009). Low temperatures during winter suppress the volatilization of PAH, while also promoting their condensation and deposition. As such, cold conditions can help increase the capacity of soil to retain PAHs (Tremolada et al., 2009). In contrast, volatilization, degradation, and uptake of PAH (into biota) can occur more rapidly during the summer, which can reduce the levels at which they are present (Kiss et al., 2001).
Carcinogenic potencies and benzo(a)pyrene equivalent concentration
The United States Environmental Protection Agency (USEPA) has classified seven PAHs (benzo(a)anthracene [BAA], chrysene [CHY], benzo(a)pyrene [BAP], benzo(b)fluoranthene [BBF], benzo(k)fluoranthene [BKF], indeno[1,2,3-cd]pyrene [ICP], and dibenz(a,h)anthracene [DBA]) as probable human carcinogens (USEPA, 2002). Carcinogenic potency exposure can be assessed by calculating a BAP-equivalent concentration (BAPeq). The BAPeq for all individual species was calculated as follows:
where Ci and TEFi are the concentration and the corresponding toxic equivalent factor (TEF) value (relative to a TEF value of 1 for BAP), respectively, of each PAH measured, i. The list of TEFs compiled by Tsai et al. (2004) was used.
At the three sites, the sum of all carcinogenic PAH concentrations (in all soil fractions) was calculated to be, in descending order: UB (340–671 μg/kg) > RR (194–311 μg/kg) > BG (33–57 μg/kg). The highest concentrations of BAP, BAPeq, and the seven carcinogenic PAH were observed at UB, while the lowest was seen at BG. Relatively enhanced vehicular emissions and fuel use at the UB site may have contributed to such a pattern (∼11 times higher than the BG value).
Distributions of BC and TOC
The mean BC levels measured in the T fraction at BG, RR, and UB averaged 0.47±0.09, 0.64±0.17, and 0.82±0.35 mg/g, respectively (Tables 2–4). Two-factor ANOVA showed significant differences in BC concentrations between the three sites and between the different size fractions at the 95% confidence interval. Similar BC levels have been previously reported from various sites including UB soils of Xian, China (0.39–0.90 mg/g; Han et al., 2009), surface sediments of Danshui River, Taiwan (0.4–1.9 mg/g; Hung et al., 2007), and Kaifeng and Linchuan, China (0.5 and 0.8 mg/g; Liu et al., 2008). In contrast, moderately enhanced BC concentrations (mg/g) were also observed at Shenyang (3.2) and Suzhou, China (3.4; Liu et al., 2008); grasslands and woodland soils in the UK and Norway (average of 1.27; Nam et al., 2008); and UB soils of Drammen, Norway (5.1; Brändli et al., 2008).
The maximum BC levels found in the finest fraction I, regardless of the site, suggest that silt and clay are the governing factors for its soil enrichment (Skjemstad et al., 1999a, b; Glaser et al., 2000). It was also hypothesized that BC particles are crushed as a result of land cultivation and are therefore recovered in the fine fraction (Rodionov et al., 2006). BC concentrations at all our sites (for most of the soil fractions) corresponded to ∼3%–6% of TOC, which is in agreement with other studies (Cornelissen et al., 2005). Its content at the RR site can be mainly attributed to biomass burning (agricultural wastes). On the other hand, fossil fuel combustion (automobile exhausts) has been identified as the major source of BC, especially common UB sites (Hansen et al., 2000). At all the sites, a similar seasonality in BC concentrations was observed (winter > monsoon > summer). Increased fuel combustion coupled with suppressed volatilization/degradation are expected to be the main reasons for higher BC levels in winter (Hitzenberger et al., 1996). Conversely, enhanced volatilization and/or microbial degradation can lead to low BC accumulation during summer (Forbes et al., 2006).
The averaged TOC levels (mg/g) in the bulk fraction T also exhibited a systematic increase across the transect: 8.82±2.15 (BG; Table 2), 11.62±4.22 (RR; Table 3), and 13.58±3.47 (UB; Table 4). The patterns of TOC concentrations were also analyzed with respect to other variables, for example, across different sites and soil fractions. Two-factor ANOVA, confirmed that differences in TOC levels between the three sites and between the soil fractions were significant at the 95% confidence level. As expected, TOC concentration was the highest in the clay and silt fraction of the soils; this is comparable to the studies of McGrath and Zhang (2003) and Zhao et al. (2005).
The BC/TOC ratio can be used as an index for establishing the impact of different emission sources. The relatively low mean BC/TOC ratios in this study (in the range of 0.05 for BG and RR, and 0.06 for UB) suggest that the predominant source of carbonaceous material is likely to be biomass burning (He and Zhang, 2009).
Correlation analyses
All possible combinations of Pearson correlation regression analysis between TPAH, BC, and TOC at all three sites are shown in Supplementary Fig. S1 and Supplementary Table S1. The correlation analyses for all the sites showed some autocorrelation of TPAH with individual PAHs, because TPAH represents the sum of all PAHs. However, this correlation does not affect the overall outcome of the results.
Significant correlations were observed consistently between TPAH and BC, suggesting similar sources of PAHs and BC at all study sites. At RR, TPAH showed a stronger correlation with TOC (r2=0.85; p<0.01) than with BC (r2=0.72; p<0.01). This suggests that the PAH distribution at RR is more important in explaining the TOC variations, rather than those of BC. In comparison, the pattern was reversed at BG and UB, reflecting that PAH distributions in this location are probably influenced more by BC than by TOC.
Source apportionment by diagnostic ratios and principal component analysis
The concentration ratios of different PAHs can be used to interpret their possible sources. In this study, the average anthracene (ANT)/(ANT+PHN) varied from 0.31 to 0.41 at the sites, while the average BAA/(BAA+CHY) ratios were 0.94 (BG), 0.53 (RR), and 0.51 (UB). This suggests that combustion is the primary source of PAHs. The average ICP/(ICP+benzo(ghi)perylene [BGP]) ratio was 0.34 at the RR site and 0.49 at the UB site, which is indicative of diesel source (Saarnio et al., 2008). FLT/(FLT+PYR) ratios of 0.33 at the BG site suggest the possible role of petrogenic input, while the value of 0.43 for the UB site again implies diesel combustion. Likewise, the highest value of 0.52 at the RR site suggests the importance of grass, wood, coal, or biomass combustion as a significant source (Yunker et al., 2002; Tang et al., 2005). BBF/BKF ratios at the BG, RR, and UB sites, were 1.57, 1.13, and 1.08 respectively, suggesting the combined effects of automobiles and wood combustion sources (Dickhut et al., 2000). A BAP/BGP ratio of 0.70 at RR site suggests vehicular emission, while 1.24 at UB site suggests coal combustion. Overall, biomass burning, coal combustion, and vehicular emissions seem to be the key PAH sources in the study areas.
Principal component analysis (PCA) enables transformation of the original set of variables into a smaller set of linear combinations that can account for most of the variance of the original data set (Ho et al., 2002). Factors were identified using Varimax rotation with Kaiser Normalization. Principal components taken to be significant were those displaying Eigen values >1.
As presented in Table 5, 96.1% of the variance at the BG site was explained by three factors. The first factor, describing 61.9% of total variance, was heavily weighted toward a number of lighter PAHs produced in vegetation fires (Freeman and Cattell, 1990) and released during biomass combustion (Jenkins et al., 1996; Golobocanin et al., 2004). Hence, the first factor probably represents biomass burning. The second factor (19.6%) had high loadings of ACN, FLT, PYR, BAA, BBF, and BAP-markers of wood combustion (Duval and Friedlander, 1981; Zuo et al., 2007). The third factor (14.7%) showed high loadings of ANT and PYR, which are generally indicative of coal combustion origin.
Loadings >0.5 are shown in bold.
—, not computed.
At the RR site, 87.9% of the total variance was explained by five factors. The first factor (21%) showed high loadings of PHN, ANT, FLT, PYR, BAA, BKF, and TPAH-markers of coal combustion (Larsen and Baker, 2003). The second factor (20.3%) weighed in BBF, BKF, BAP, BC, and TOC, which suggests the possible role of wood combustion. The third factor (19.6%) showed high loadings of NAP, ACN, ACL, BAP, IP, and TPAH, which suggests the effect of biomass combustion sources (Golobocanin et al., 2004; Zhang et al., 2006). The fourth (18.9%) showed high loadings of FLR, PHN, FLT, BGP, and TPAH, indicative of vehicular emissions (Guo et al., 2003). The fifth factor (8.12%) had high loadings of BAA, CHY, and BBF, suggesting the role of domestic fuel combustion (Karar and Gupta, 2007; Hong et al., 2007).
At the UB site, the majority of the variance (89.5%) was explained by three factors. The first factor (35.9%) was heavily weighted toward NAP, ANT, BAA, CHY, BBF, BKF, BAP, DBA, BGP, ICP, and TPAH, all of which are indicators of vehicular emission (Rogge et al., 1993; Khalili et al., 1995; Omar et al., 2002). The second factor (34.9%) was predominately weighed in PAHs that are markers of coal combustion (Jiang et al., 2009) and vehicular emissions (Akyüz and Cabuk, 2008). The third factor (18.7%) had high loading factors for FLT, PYR, BC, and TOC, which clearly represent coal combustion.
Conclusions
PAH concentrations in size-fractionated soil samples were collected along a 35 km transect in Delhi across three seasons at BG, RR, and UB sites. Detailed analysis of these concentrations indicated that the maximum PAH loadings consistently occur in the smallest grain size fraction (clay and silt), irrespective of the site and season. This observation confirms that grain size can play a crucial role in PAH partitioning in soil layers. Likewise, loadings of BC and TOC were also the highest in the same soil fractions. The seasonality of PAH, BC, and TOC concentrations showed very similar properties, with the maximum concentrations found in winter, followed by the monsoon season, with summer exhibiting the lowest levels. Concentrations of carcinogenic PAHs at the UB site were ∼11 times those at the BG site. The results of diagnostic ratio and PCA consistently indicate biomass burning and coal combustion as the major PAH sources at the BG site, while the vehicular emissions and coal combustion are important sources at the UB site. The results of PCA at RR site suggested the role of a number of different sources. Similarly, BC/TOC ratios also indicated biomass burning as the chief source of carbonaceous species at the study sites. In line with general expectations, PAH concentrations in soils decreased in the order UB>RR>BG. Based on this study, we can conclude that both BC and TOC are important geosorbents for PAHs. Both of these geosorbents can be harnessed for sequestering PAHs by limiting their transport and/or retarding their bioavailability.
Footnotes
Acknowledgment
One of the authors (S.R.) would like to thank the University Grants Commission of India for providing the Rajiv Gandhi National Fellowship during the research period, and Dean, SES for providing CIF facilities. The corresponding author also acknowledges the National Research Foundation of Korea (NRF) grant funded by the Korean MEST (No. 2010–0007876).
Disclosure Statement
No competing financial interests exist.
References
Supplementary Material
Please find the following supplemental material available below.
For Open Access articles published under a Creative Commons License, all supplemental material carries the same license as the article it is associated with.
For non-Open Access articles published, all supplemental material carries a non-exclusive license, and permission requests for re-use of supplemental material or any part of supplemental material shall be sent directly to the copyright owner as specified in the copyright notice associated with the article.