
Abstract
Abstract
The purpose of this study was to collect experimental data and develop a mathematical model describing the equilibrium phase distribution of a common organic chemical, trichloroethylene (TCE), among cyclodextrin (CD), water, and granular-activated carbon (GAC). Batch tests and a modified linear regression model were applied to assess the partitioning behavior in this multiphase (CD pseudophase–water–GAC) system. Results showed that CD lowers TCE availability for dissolution in water and adsorption to GAC, demonstrated by reduced TCE partitioning to GAC with increasing CD concentration. Presence of CD does not significantly affect the distribution of TCE between water and GAC. Rescaled Freundlich adsorption isotherms for the GAC–water (CD-free) and GAC–CD solution systems were not significantly different and overlapping normalized isotherms were observed. This is an important indicator that the distribution of TCE within the dissolved and GAC phase is independent of the presence of CD. It further indicates that the distribution within CD–water–GAC systems can be aptly described by standard TCE Freundlich isotherms for water–GAC dual-phase systems and water–CD partitioning coefficients. A linear relationship between the logarithms of apparent Freundlich isotherm coefficients and solubility enhancement factors (R2=0.99) was verified theoretically and experimentally. This study provides important information to optimize the design, assess the performance of GAC treatment systems containing CD solutions, and possibly aid in prediction the lifetime of GAC in a full-scale operation.
Introduction
While those pilot studies demonstrated the feasibility of removing contaminants from postflushing CD solutions, they did not quantitatively investigate the phase distribution behavior of chemicals in air-stripping systems and GAC treatment beds. Such information is necessary to go beyond the trial-and-error testing of treatments and to develop models that can accurately forecast the performance of systems. In short, the phase distribution of chemicals in relevant multiphase systems must be studied in greater depth in order for development of more cost-effective alternatives for aquifer remediation with CD flushing. The chemical partitioning behavior in air–water (Gossett, 1987) and air–water–CD systems (Kashiyama and Boving, 2004; Gao et al., 2009), which is important for air-stripper design, has been investigated by a number of researchers, and there are, to our knowledge, no published studies of CD-influenced partitioning behavior in CD–water–GAC systems. Hence, there is an unmet need to evaluate the interaction between chemical and GAC in the presence of CD.
The partitioning behavior of chemicals in dual-phase (water–GAC) system is normally described through adsorption isotherms, which can be modeled by the Linear, Freundlich, and Langmuir equations (Giles et al., 1974; Tchobanoglous et al., 2004; Limousin et al., 2007). Extensive studies have been done to determine the adsorption behavior of taste and odor compounds (Gillogly et al., 1998; Cook et al., 2001), organic (Karanfil and Kilduff, 1999; Pelekani and Snoeyink, 1999) and inorganic contaminants (Brasquet et al., 2002; Wilson et al., 2006) in GAC–water systems. The addition of CD to the aqueous phase, however, introduces a third phase, causing a reduction in the amount of chemicals in the water phase because CD's hydrophobic cavity provides a more stable environment for chemicals than water does (Shirin et al., 2003). In addition, several studies have shown that the presence of solubilizing agent (SA) (e.g., surfactant or CD) reduces the aqueous activity and thereby the driving force for the partitioning of chemicals into gas or solid phase (Tucker and Christian, 1985; Underwood et al., 1995; Cheng and Sabatini, 2007). Mathematical models describing the partitioning behavior of chemicals in air–water–SA system normally treat the CD cavity/micelle as a pseudophase (Vane and Giroux, 2000; Shimotori and Arnold, 2003; Lantz et al., 2005; Gao et al., 2009) or treat the association of chemical-CD as an equilibrium action (Wang and Brusseau, 1993; Connors, 1997; Kashiyama and Boving, 2004).
In this study, the effects of CD on the partitioning behavior of a common chlorinated solvent trichloroethylene (TCE) on a GAC (Norit C Gran) in a three-phase system was evaluated using the pseudophase approach over a range of hydroxypropyl-β-CD concentrations (HPβCD). To our knowledge, this is the first data set on CD pseudophase–water–GAC partitioning yet assembled for this organic pollutant. We have applied a robust experimental design and statistical data analysis method for the acquisition and explanation of partitioning behavior in multiphase system. The objectives of this study were to (1) obtain quantitative descriptions of the effects of CD concentration of TCE absorption behavior on GAC, (2) to determine TCE equilibrium distribution in multiphase system (CD–water–GAC) as a function of CD concentration, (3) to further investigate the potential correlations between apparent Freundlich adsorption coefficients and the CD solubility enhancement factors. This study provides important information to optimize the design, assess the performance of GAC treatment systems containing CD solutions, and possibly aid in predicting the lifetime of GAC in a full-scale operation. It may also be possible to use the equilibrium adsorption coefficients over a range of CD concentrations as a reference parameter to conduct a dynamic column study for the purpose of investigation of contaminant transport in porous media.
Experimental Protocols
Chemicals
TCE was purchased from Sigma-Aldrich (>99.5% purity). HPβCD (degree of substitution=4.98, average MW 1424 g/mol) was donated by Cargill and used as received (purity wt./wt.: moisture content 5.0%; unmodified CD <0.1%; propylene glycol 0.4%; ash 2.0%; HPβCD 92.6%). NORIT C GRAN (Norit Americas, Inc.) is a chemically activated granular carbon produced by a phosphoric acid activation process applied to coal and used in the food, chemical, and pharmaceutical industries.
Effect of CD on TCE equilibrium phase distribution
Aqueous CD solutions with concentrations of 0, 20, 50, and 100 g/L were prepared by addition of CD powder to the high-purity water. TCE solution (54.32 mg/L) was prepared by dissolving pure TCE into the different CD solutions. For the batch adsorption isotherm experiments, weighed activated carbon aliquots were placed in seven amber bottles that were subsequently completely filled with TCE-CD solutions with the solid/liquid ratios of 1:20, 1:40, 1:70, 1:90, 1:140, 1:200, 1:280 g/mL. All the bottles were capped immediately using PTFE-faced silicon septa to create headspace-free conditions. Continuous mixing was providing during the adsorption experimental period with a constant agitation speed of 250 rpm through a rotary shaker (Model: LE “Big Bill”; Sybron Thermolyne). A preliminary experiment demonstrated that after 5 days of mixing, the remaining concentration of TCE in aqueous solution changed by <0.1%, which is considered to represent equilibrium adsorption. In this study, a mixing time of 7 days was employed to ensure that equilibrium was achieved. Longer contact times were not used due to concerns regarding GAC particle destruction (Limousin et al., 2007).
At the end of the 7-day equilibration period, mixing was halted and suspended GAC particles were allowed to quiescently settle for 1 h. Supernatant (2 mL) was then transferred into amber vials via a glass, gas-tight syringe. Vials were sealed immediately after subsampling and placed in a Gas Chromatograph (GC) autosampler rack. Analyses were performed using an Agilent 6890 GC fitted with a HP-5MS column using a static headspace technology described in previous study (Gao et al., 2009) and the TCE concentration in aqueous phase was determined from external calibration standard method. One advantage of the static headspace technique is that it does not require direct injection of liquid sample to GC-MS and therefore the presence of CD and the potential trace GAC residue in the liquid phase would not be expected to influence results and would not cause damages to the analytical equipment. Control samples were conducted using the same procedures to monitor the nonsorption losses and the results showed that the nonsorption losses were <0.1%.
Data analysis
Traditional and apparent Freundlich isotherms
For systems containing only water and GAC (Fig. 1A), the phase partitioning of TCE, phase A, is described by the traditional Freundlich isotherm [Eq. (1)], a relationship between the adsorbed concentration CAS (phase S, mg/g) in the GAC and the solute concentration CA2 (phase 2, mg/L) remaining in water (Tchobanoglous et al., 2004).
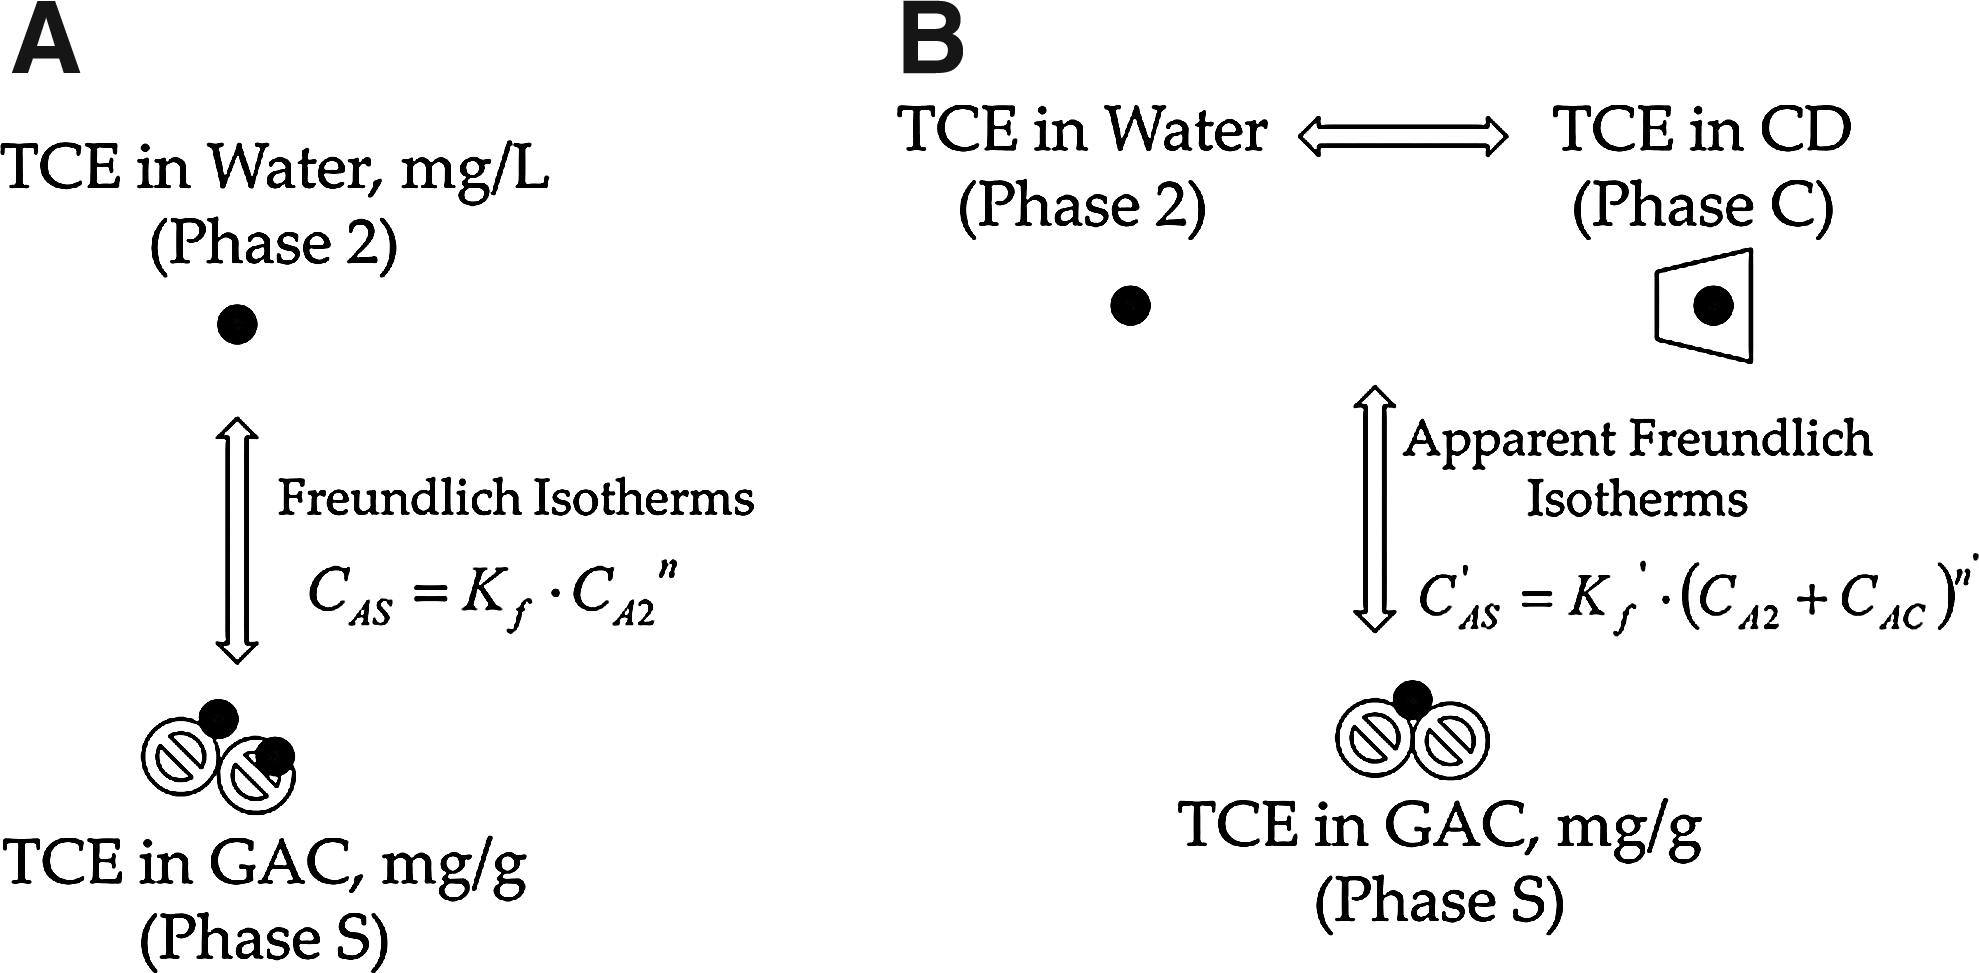
Scheme of TCE partitioning behavior among phases without
where Kf is the conventional Freundlich adsorption coefficient that indicates the adsorption ability and n is a constant indicative of adsorption affinity (Weber and DiGiano, 1996; McElroy, 2005). In systems that contain CD (Fig. 1B), an apparent Freundlich isotherm between the TCE concentration in the GAC phase and remaining concentration in the aqueous CD solution is employed [Eq. (2)]. A term is added to the water concentration (CA2) of Equation (1) to account for the chemical present in the aqueous solution that is associated with CD cavities (
where
To describe the TCE mass distribution in each phase (CD pseudophase, water, and GAC), the partition coefficient that describes the ratio of the CD-associated and water-solubilized TCE concentrations,
where
Modified statistical model on adsorption coefficients
A modified linear regression model was built to evaluate the significance of adsorption coefficients under different CD concentrations. A natural log-transform was imposed to convert the power relationship (
where ln CAS and ln CA2 are values of dependent and independent variables, β0,1,2,3,4,5,6,7 are regression parameters, L1,2,3 are dummy variables served as the indicator of the lnKf values of the individual isotherms, and I1,2,3 are interaction items served as the indicator of the n values.
Correlation between
\documentclass{aastex}\usepackage{amsbsy}\usepackage{amsfonts}\usepackage{amssymb}\usepackage{bm}\usepackage{mathrsfs}\usepackage{pifont}\usepackage{stmaryrd}\usepackage{textcomp}\usepackage{portland, xspace}\usepackage{amsmath, amsxtra}\pagestyle{empty}\DeclareMathSizes{10}{9}{7}{6}\begin{document}
$$K_f^{ \prime}$$
\end{document}
and E
An empirical relationship between the Freundlich adsorption coefficient,
where A and B are constants. In systems containing CD, aqueous solubility of chemicals, S, can be estimated by (McCray et al., 2000):
where E is solubility enhancement factor and Sw is the aqueous solubility. Substitution of Equation (8) in (7) produces an overall correlation [Eq. (9)].
For a specific chemical, Sw is a constant; therefore, Equation (9) can be rearranged and a linear relationship between ln
where M is a constant that can be determined by plotting
Results and Discussion
Mass distribution of TCE in multiphase system
The total TCE quantity present in the liquid phase (

TCE mass distribution in CD–water–GAC system with solid:liquid ratio of 1:280—water phase (), CD ( ), and GAC (
 ). CD, cyclodextrin; GAC, granular-activated carbon.
Effect of CD concentration on apparent Freundlich isotherms
The apparent Freundlich isotherm was determined by first measuring the total concentration of chemical remaining in the aqueous phase (
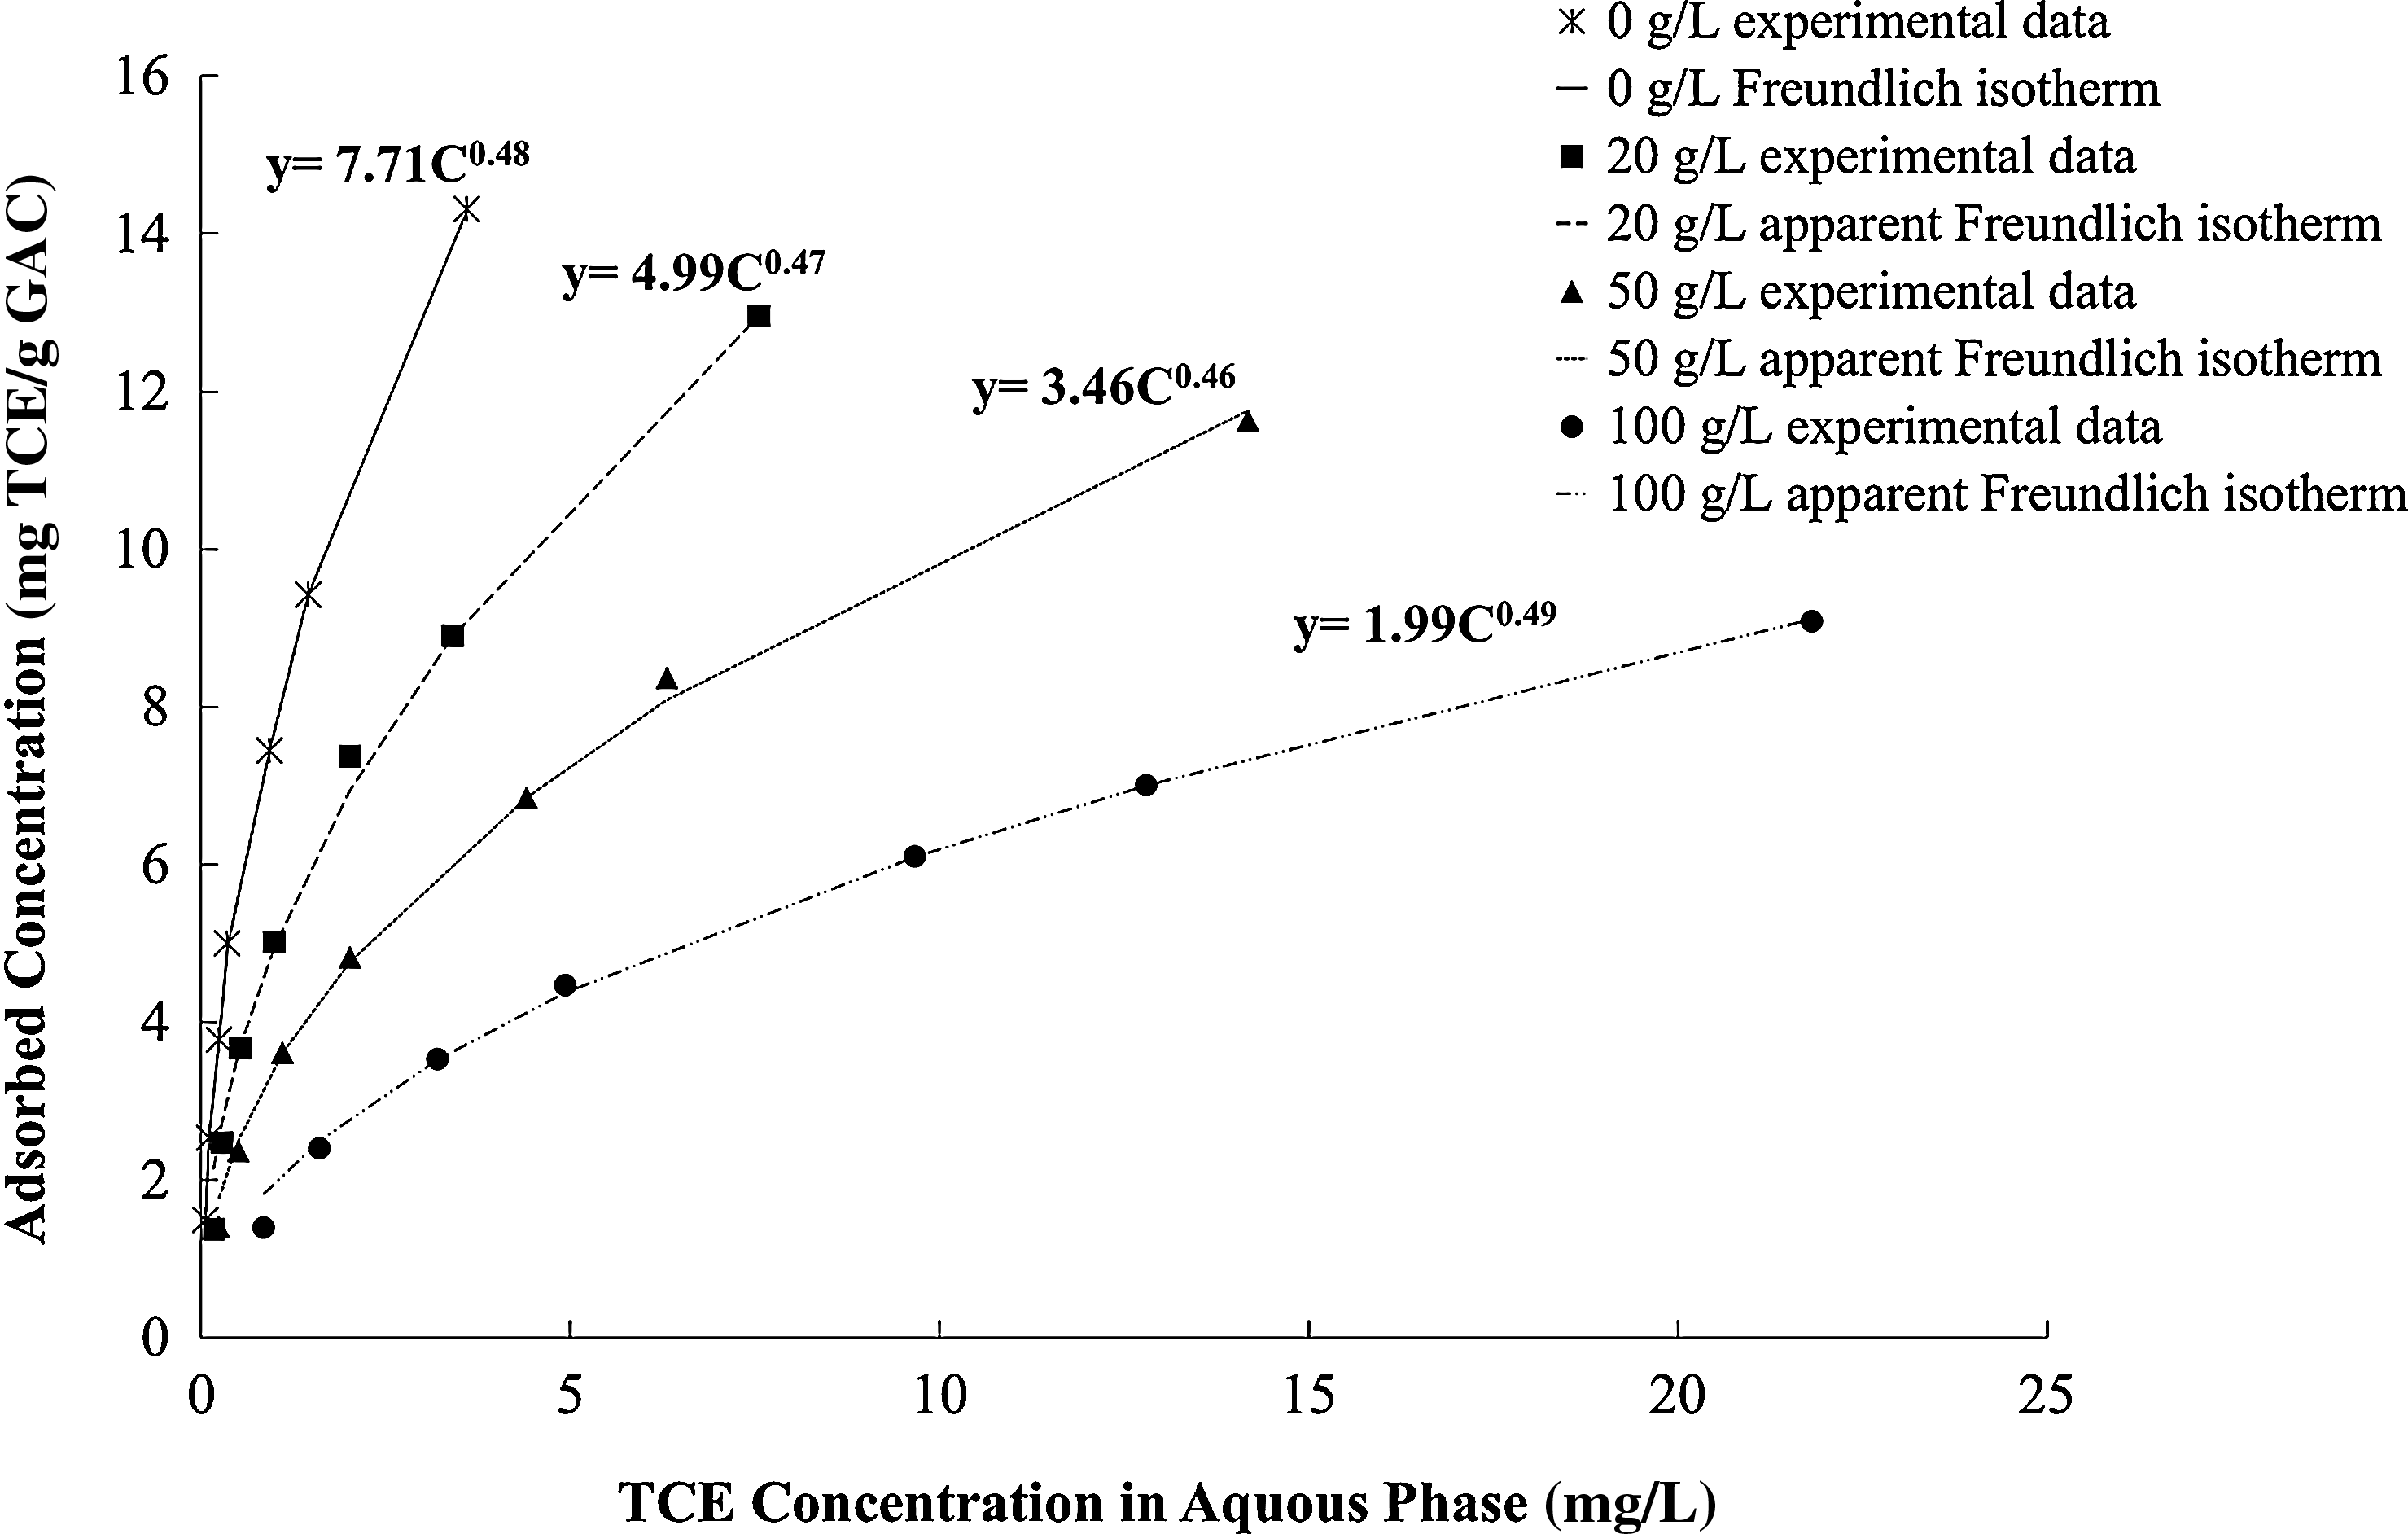
Effect of CD concentrations on TCE apparent Freundlich isotherm: no CD (×, ———), 20 g/L CD (■, –––), 50 g/L CD (▲, - - - - -), and 100 g/L CD (●, -·-·-·). Discrete dots are experimental data and the lines are shown for isotherm references.
CD, cyclodextrin.
Rescaled Freundlich isotherm and significance analysis
The rescaled Freundlich isotherms for 20, 50, and 100 g/L CD solutions were obtained from nonlinear regression of
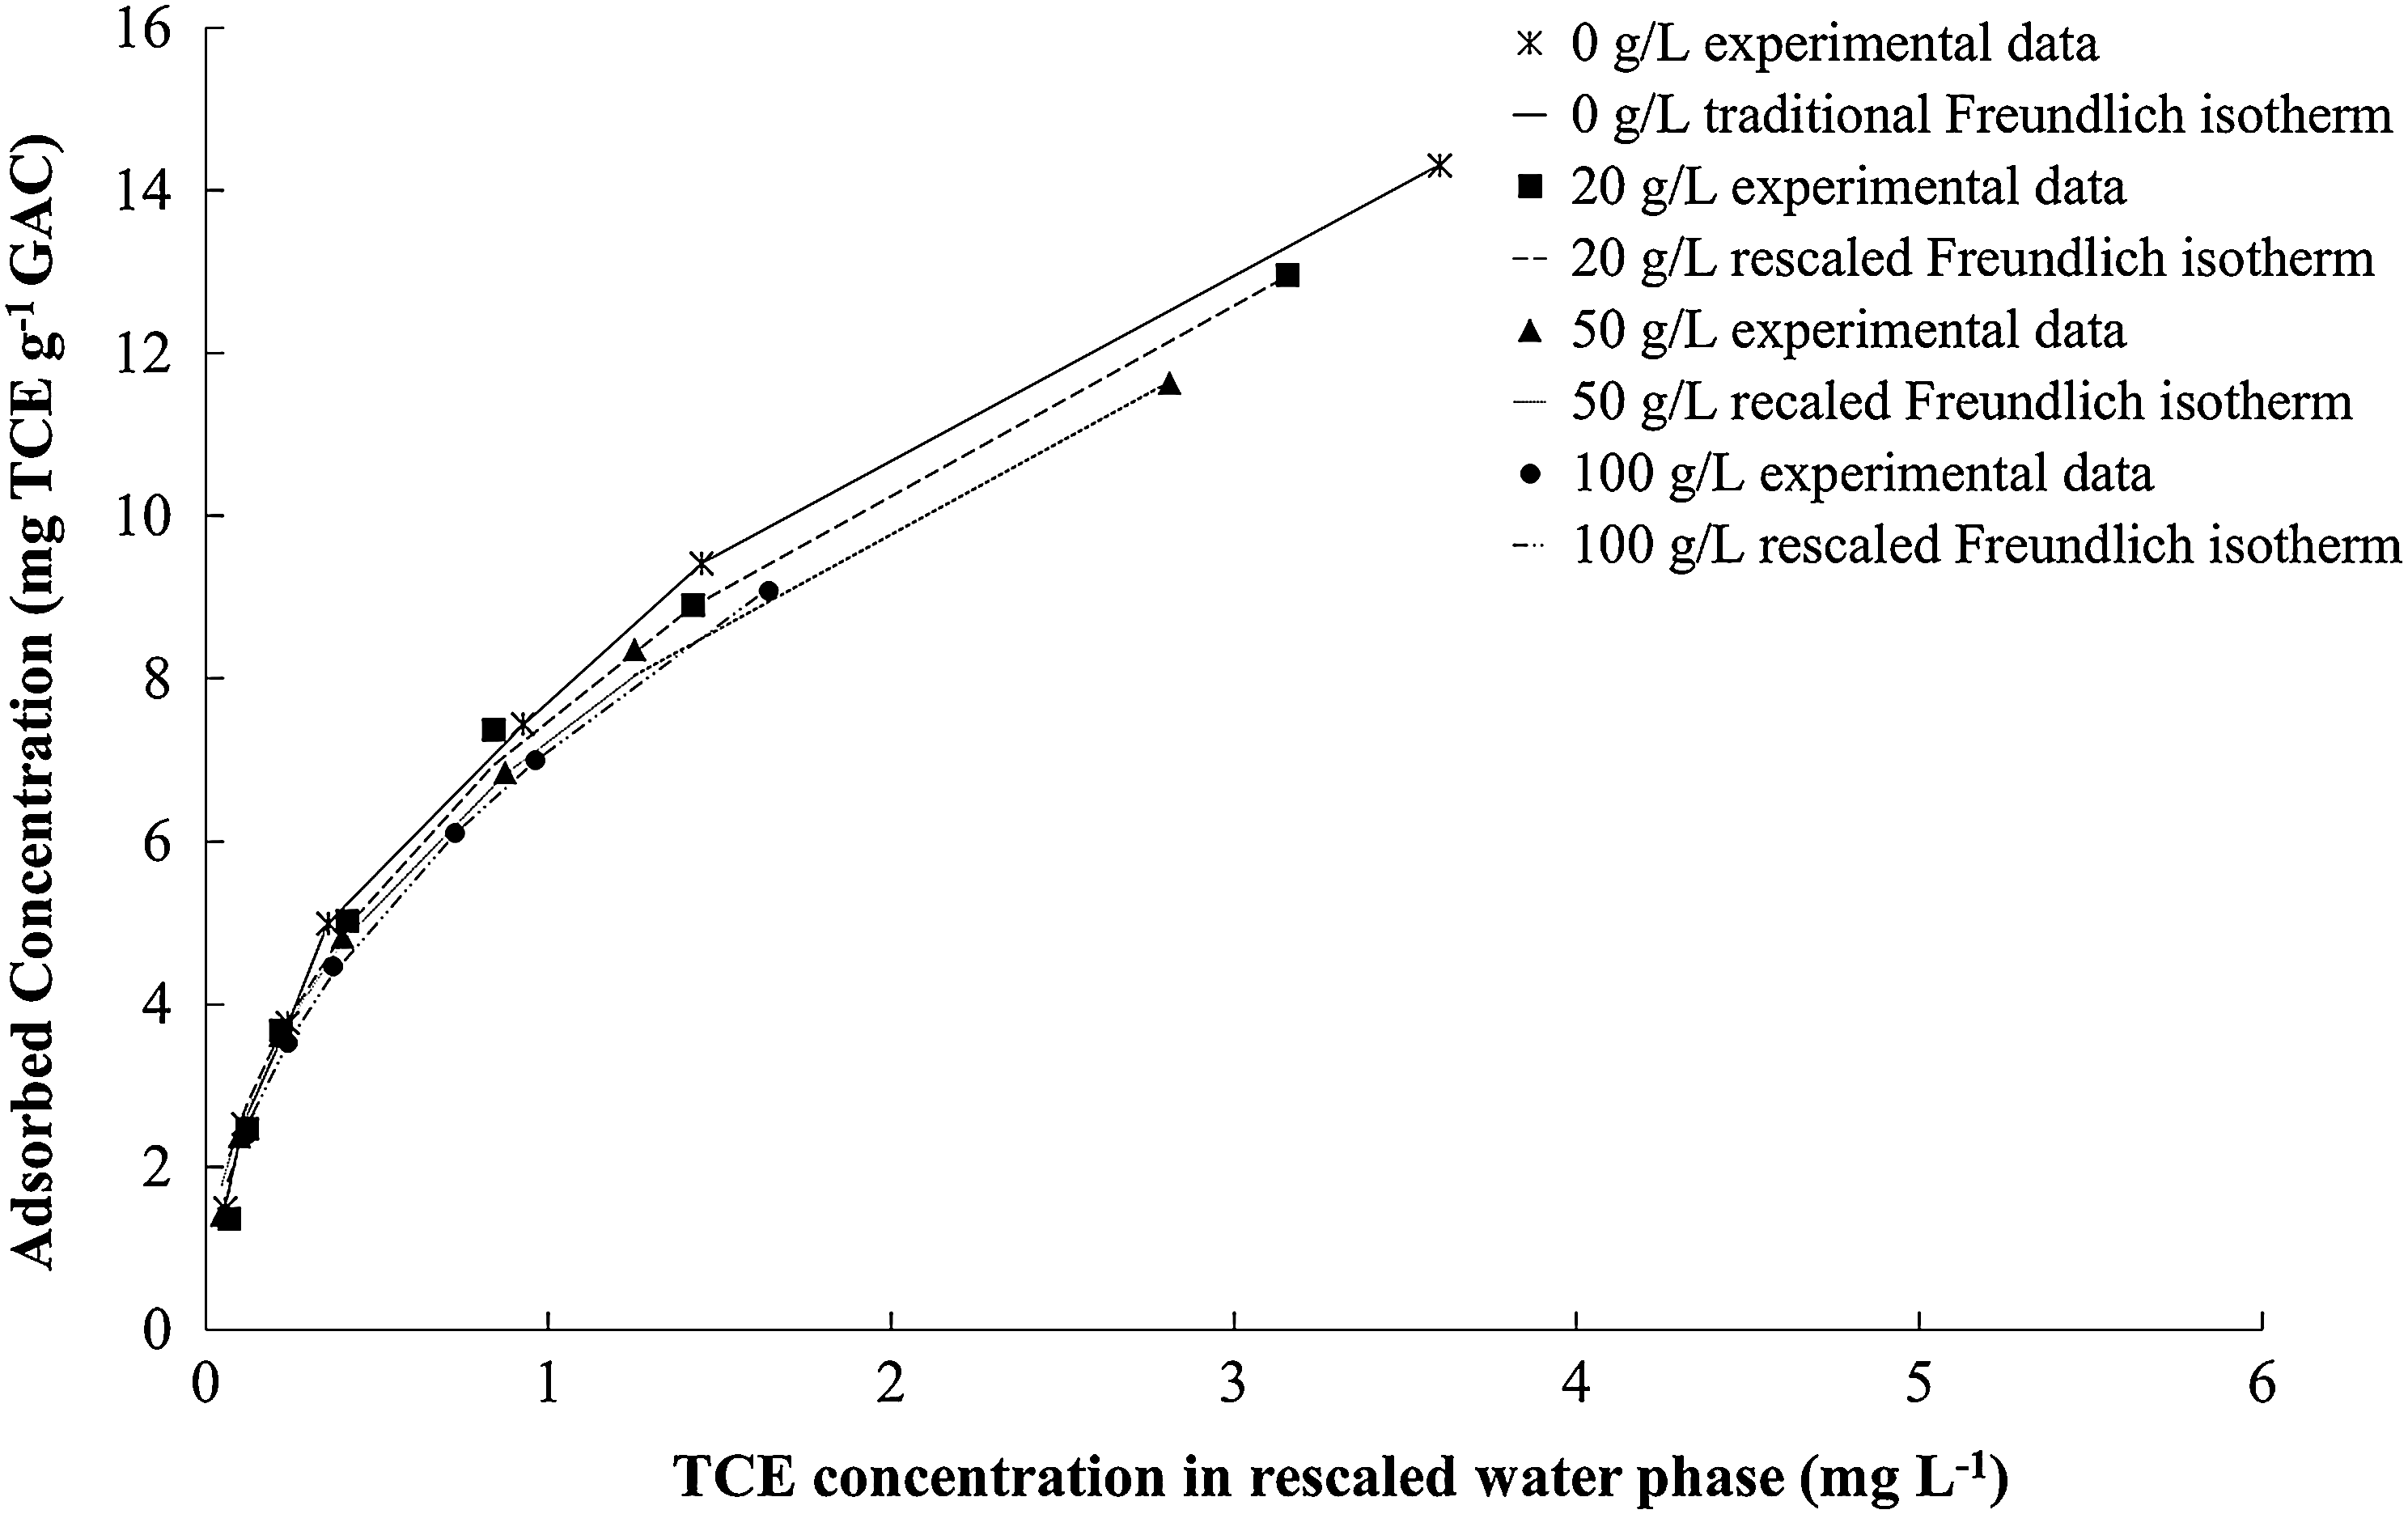
Comparison of rescaled and CD-free Freundlich isotherms in CD concentrations: no CD (× , ———), 20 g/L CD (■, –––), 50 g/L CD (▲, - - - - -), and 100 g/L CD (●, -·-·-). Discrete dots are experimental data and the lines are shown for isotherm references.
Correlation between
\documentclass{aastex}\usepackage{amsbsy}\usepackage{amsfonts}\usepackage{amssymb}\usepackage{bm}\usepackage{mathrsfs}\usepackage{pifont}\usepackage{stmaryrd}\usepackage{textcomp}\usepackage{portland, xspace}\usepackage{amsmath, amsxtra}\pagestyle{empty}\DeclareMathSizes{10}{9}{7}{6}\begin{document}
$$K_f^{ \prime}$$
\end{document}
and E
The plot of apparent Freundlich adsorption coefficient,

Correlation of apparent Freundlich coefficients with solubility enhancement factors
Summary
The purpose of this study was to collect experimental data and develop a mathematical model for the equilibrium phase distribution between CD, water, and GAC of a common organic chemical, TCE. The key findings of this study can be summarized as below:
• The presence of CD does not alter the relative distribution of TCE between water and GAC, which was supported by the observation of overlapping normalized isotherms. That is to say, even though some portion of TCE was associated with CD, the rest of TCE can be redistributed between water and GAC phases according to the coefficient obtained from CD-free solutions. This is an important indicator that the relative distribution of TCE between the water and GAC phases is independent of the presence of CD. It further indicates that the distribution of TCE between CD–water–GAC systems can be aptly described by standard TCE Freundlich isotherms for water–GAC dual-phase systems and water–CD partitioning coefficients. • It however does lower the absolute amount of TCE available to water and GAC phases due to the association of TCE with CD cavities with the evidence that apparent adsorption of TCE to GAC decreased with increasing CD concentration. This implies that absolute amount of TCE would be absorbed less on solid GAC and water phases but associated more in presence of CD. These findings could be important for optimizing the design, assessing treatment performance, and possibly aiding in predicting the lifetime and GAC replenishment rates in full-scale operations. • Apparent adsorption coefficient, Kf, decreased as CD concentration increased and adsorption constant, n, was independent of CD concentration. There was a linear relationship between the natural logarithms of Kf and CD solubility enhancement factor, which is reflective of the mathematical nature of the Freundlich isotherms.
Footnotes
Acknowledgments
Funding for this study was provided by the NATO Science for Peace Program. Special thanks to Dr. Justin Birdwell and Quan Tang for their kind assistance throughout this project.
Author Disclosure Statement
No competing financial interests exist.