




Abstract
Abstract
Using both stationary air samplers and personal air samplers, concentrations of total suspended particulates, particulate matter with a diameter less than 2.5 μm, elemental carbon, and organic carbon were measured in the kitchen, bedroom, and outdoors of a rural, nonsmoking household in northern China. The household used a traditional biomass cookstove in winter and summer and a more modern liquified petroleum gas cookstove on the first day in the summer. Most of the particulate matter concentrations both indoors and outdoors exceeded the national air quality standards of China (0.15 mg/m3 for indoor particulate matter with a diameter of 10 μm or less; 0.30 mg/m3 for ambient air total suspended particulate). In the kitchen in the winter, the daily mean concentration of particulate matter with a diameter less than 2.5 μm was 16 times larger than the national indoor air quality standard for particulate matter with a diameter of 10 μm or less. On average, 53% of the total suspended particulate concentration was due to particulate matter with a diameter less than 2.5 μm. While all of the residents of the household were exposed to high concentrations of particulate matter with a diameter less than 2.5 μm, the housewife had the highest exposure. High daily variation in concentrations was due primarily to differences in fuel burning rates. Significant differences between kitchen/outdoor and bedroom/outdoor concentration ratios and between winter and summer indoor/outdoor concentration ratios suggested that bedroom particulate matter concentrations were due to emissions from the kitchen in winter and the outdoors in the summer. The average winter and summer elemental carbon/organic carbon concentration ratios were 0.20±0.14 (n=24) and 0.32±0.16 (n=18), respectively. In the bedroom and outdoors, the elemental carbon and organic carbon concentrations were correlated linearly with each other and with the concentration of particulate matter with a diameter less than 2.5 μm. When only liquefied petroleum gas was used in the summer, the kitchen concentrations of particulate matter with a diameter less than 2.5 μm and organic carbon were similar to or higher than the concentrations measured when the biomass burning stove was used.
Introduction
During the 1980s, a large number of indoor air pollution measurements were taken, but after that time, few studies were conducted, and most focused only on particulate matter (PM), carbon monoxide (CO), and sulfur dioxide (SO2) (Zhang and Smith, 2007). However, PM, especially respirable PM with an aerodynamic diameter ≤2.5 μm (PM2.5), is a major human health concern (Albalak et al., 1999; Dockery et al., 1993; Siddiqui et al., 2009), and a number of investigations have found high concentrations of PM in the indoor air of rural China (Lu et al., 2006; Wei et al., 2004). It is not just the PM concentration that needs to be quantified. It is also important to quantify organic carbon (OC) and elemental carbon (EC) concentrations in PM, as OC often contains toxic compounds, such as polycyclic aromatic hydrocarbons (PAHs), and a relationship between EC and respiratory diseases and lung cancer mortality has been noted (Mauderly and Chow, 2008; Frazer, 2002). Furthermore, because EC (sometimes called black carbon) is thought to have a warming radiative force and OC is thought to have a cooling radiative force, they are of concern because of their impact on climate change. To the best of our knowledge, there is limited information on the EC and OC concentrations in indoor air in rural Chinese households. Moreover, significant house-to-house daily and seasonal variation in indoor air quality has led to significant uncertainty in population exposure assessments. Differences in indoor and outdoor air quality and among various rooms in rural Chinese households have been widely reported, with the most severe pollution often occurring in kitchens (Jiang and Bell, 2008).
The objective of this research was to study indoor air quality and personal exposure in a typical northern Chinese rural household under different cooking scenarios and seasons. To understand the indoor/outdoor pollution concentration, the relationship between kitchen air and bedroom air, the seasonal variation in the pollutant concentration, and the fractions of PM2.5, EC, and OC found in the PM resulting from different biomass burning practices, controlled experiments employing a commonly used biomass cookstove and a more modern liquefied petroleum gas (LPG) stove were conducted in the winter and summer. While personal exposure studies are believed to estimate the risk of inhalation exposure better than studies relying on stationary samples, they are rather limited in rural China (Jiang and Bell 2008; Baumgartner et al., 2011). Although this study focuses on a single rural household and does not represent all rural households in Northern China, it does provide useful information on typical and more modern cooking practices and fuels in summer and winter.
Material and Methods
Study home
The study home, which was a nonsmoking home, was located in a typical rural village in northern China. This area of China has a continental monsoon climate with cold, dry winters and warm, humid summers. The source for the data on temperature and humidity during the study period was a local meteorological station. The village, Zhuanghu (116°52′E, 39°59′N), which is located in Hebei province outside of Beijing (Supplementary Fig. S1), has more than 200 households and a population over 1000. Household heating occurs during the winter season from early December through late March. The study home, which was surrounded by similar houses with similar stoves, chimneys, and fuels, was built in 1989 and was a one-story house with a living room, dining room, kitchen, and three bedrooms. A commonly used brick biomass cookstove, typical for rural China, had been in use for more than a decade in the kitchen. In addition to the biomass cookstove, a portable coal stove and a LPG stove were occasionally used. During the study, the coal stove was not used, and the LPG stove was only used on the first day of the summer study. The 22.7 m3 kitchen was connected to a bedroom through a door and to the outdoors through another door and a window. The door connecting the kitchen and the bedroom was often left open, unless the kitchen was considered too smoky. Except during the day in summer, the door and window connecting the kitchen and the outdoors were usually closed.
The household consisted of three people. As two students stayed in the house during the study, a total of five people ate and slept there. The average number people in a rural Chinese household is 3.98 (National Bureau of Statistics, 2010). As in most rural households in northern China, the housewife did most of the cooking in the kitchen throughout the year. The biomass cookstove was vented through a chimney that passed through a heated bed (kang, in Chinese) in the adjacent bedroom before exiting through the chimney in the bedroom wall to the roof of the home. No smoke was observed leaking from either the kang or the chimney during the experiment. The house was heated in the winter by hot water supplied by a coal-fired boiler installed in the corner of the yard. The cookstove and the chimney were not regularly maintained. The layout of the house is shown in Supplementary Fig. S2.
Experimental conditions
Controlled exposure experiments were conducted for four days in the winter (Jan. 16, 17, 19, and 20, 2010) and three days in the summer (June 13, 14, and 15, 2010). The meteorological conditions for these days are listed in Supplementary Table S1. With the exception of the first day in the summer sampling period when the more modern LPG stove was used for comparison, three regular meals were cooked each day for five people using the biomass cookstove. For the six biomass sampling days, dry corn stalk was used as fuel for the first two days in the winter and the second day in the summer, and dry wood was used for the other two winter days and the third day in the summer. Daily cooking for each meal involved steaming, simmering, and limited stir-frying. Frying and roasting, which can cause high emissions of cooking fumes, were avoided. The detailed information on the quantity of fuel consumed and cooking durations are available in Supplementary Table S2. Written consent to participate in the controlled experiment was obtained from all members of the household and students. No member of the household smoked.
Sample collection and measurement
For each of the seven sampling days, duplicate 24-h TSP, PM2.5, and EC/OC samples were collected from stationary samplers located in the kitchen, in the bedroom immediately adjacent to the kitchen, and outdoors. In the winter, a total of eighteen stationary air samplers were in operation simultaneously each day. In the summer, twelve samplers were in operation simultaneously. All air samplers were deployed approximately 1–2 m above ground and ≥0.5 m from a wall. The air samplers in the kitchen were deployed 2.2 m from the front of the biomass cookstove. Low-volume impact samplers (Libra Plus LP-5, Buck, Orlando, FL; 4 L/min), using glass fiber filters with a 37 mm diameter, were used to collect PM2.5. Low-volume pumps (XQC-15E, Tianyue, China; 1.5 L/min), using glass or quartz fiber filters with a 30 mm diameter, were used to collect TSP and carbonaceous matter (EC and OC), respectively. The flow rate of the air samplers was calibrated before and after the sampling using a soap-film flow meter (GL-103B, Jiesi, Beijing) for the XQC-15E pump and a mini-BUCK primary flow calibrator (Buck) for the LP-5 pump. Field blank filter that was taken to the sampling site, installed in the sampler, removed without sampling, stored and transported to the laboratory (in the same way as filters intended for sampling) was not sampled because the measurements were all very high. The filters were baked at 450°C for 6 h and equilibrated in a desiccator for 24 h prior to weighing and sampling. After sampling, the particle-loaded filters were covered with aluminum foil and equilibrated in a desiccator for 24 h before analysis. Gravimetric measurements were conducted, using a digital balance with an accuracy of 0.00001 g. The EC and OC concentrations were measured, using a Sunset EC/OC analyzer (Sunset Lab, Tigard, OR).
Because of the high mobility of a study's subjects, personal air sampling is preferred over stationary air sampling for exposure studies (Wilson et al., 2000). For this reason, personal air sampling occurred simultaneously with stationary air sampling. Low-volume pumps (Libra Plus LP-5; 4 L/min), using glass fiber filters with a 37 mm diameter, were used for personal air sampling. On each sampling day, personal air samplers were worn by the housewife, the husband, and the two students conducting the research except when sleeping, showering, or using the restroom. During these activities, the samplers were not worn but were kept within 2 m of the person.
The sampling inlets were worn on the front of the shoulders. The housewife did the cooking, while the husband did noncooking chores, including outdoor chores. One student followed the housewife's activities closely, while the other student followed the husband's activities closely. Both students slept in the house during the study.
Data analysis
A total of 128 samples were analyzed. Ratios of indoor and outdoor air concentrations (I/O) were calculated. Using IBM SPSS (IBM, Armonk, NY) at a significance level of 0.05, nonparametric tests (Mann-Whitney U test and Kruskal Wallis test for two and multiple populations, respectively) were applied to interpret the data.
Results and Discussion
TSP and PM2.5 concentrations in the kitchen
Figure 1 shows the daily measured TSP and PM2.5 concentrations of the kitchen, bedroom, and outdoor air using stationary samplers. Detailed data is given in Supplementary Table S3. The calculated PM2.5/TSP concentration ratio is also shown in Fig. 1. The mean daily average TSP and PM2.5 concentrations in the kitchen were 2.4±1.2 mg/m3 and 1.3±0.8 mg/m3 in the winter and 0.77±0.25 mg/m3 and 0.46±0.10 mg/m3 in the summer, respectively. Because the variation among the samples from the three summer days was not significant even though biomass and LPG were burned on different days, the difference between the winter and summer samples was probably due primarily to ventilation differences. As the samples were collected over a 24-h period, but the cooking took place for only a few hours each day, it is likely that TSP and PM2.5 concentrations were much higher during cooking. Although neither TSP nor PM2.5 is listed in the Indoor Air Quality Standard of PRC (GAQS, 2002), the measured PM2.5 concentrations in the kitchen were much higher than the daily indoor air quality standard for PM10 (0.15 mg/m3),which is listed there, indicating severe pollution. Similar severe indoor air PM concentrations have been reported in rural kitchens when biomass is used for cooking. For example, in a rural village in northeast China, the 24-h mean PM4.0 (diameter less than 4.0 μm) concentration in kitchens during the heating season was 0.31 mg/m3 (Fischer and Koshland, 2007). In a study conducted in Pakistan, daily mean PM2.5 concentrations in the kitchens of 55 wood-burning households with little ventilation were as high as 2.74 mg/m3 (Siddiqui et al., 2009).
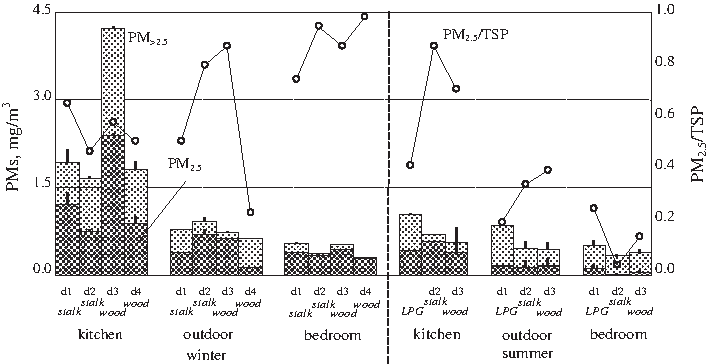
PM2.5 and TSP concentrations in the kitchen, bedroom, and outdoors in winter (four days, day 1 through day 4) and summer (three days, day 1 through day 3). Stacked bars represent PM2.5 (bottom) and TSP (total height). The results are shown as arithmetic means and standard deviations of paired samples. The PM2.5/TSP ratios are presented as circles. PM2.5, respirable particulate matter with an aerodynamic diameter ≤2.5 μm; TSP, total suspended particulate.
High variations were measured in the kitchen TSP and PM2.5 concentrations during the winter (see Fig. 1). On the third winter day, TSP and PM2.5 concentrations in the kitchen reached 4.2 mg/m3 and 2.4 mg/m3, respectively. Although similar amounts of wood were burned on the third and fourth winter days, on the third winter day, the cooking lasted 5 h, and the fuel burned per unit time (Rb) was slow, 0.03 kg/min. On the other three winter days, the burn rate was 0.11 kg/min (Supplementary Table S2).
A negative relationship between PM emissions and the burn rate of crop residues has been reported (Shen et al., 2010). Differences in burn rate may be caused by differences in fuel properties and weather conditions, which can also affect the draft in the chimney. The highest relative humidity (80%, compared to a mean of 64%) occurred on the third winter day, which could have resulted in high fuel moisture and/or poor ventilation. Even with approximately the same burn rates on each day, large differences in summer and winter PM2.5 and TSP concentrations were recorded (Fig. 1). This is probably due in large part to decreased ventilation during the winter, when the kitchen door and window were kept closed. Surprisingly, the TSP and PM2.5 concentrations on the first summer day, when LPG was used with the more modern cookstove, were as high or higher than TSP and PM2.5 concentrations when the cookstove was used with biomass on the second and third summer days (Fig. 1). High TSP concentrations were also measured outdoors on the first summer day (Fig. 1), so the fact that the TSP concentration in the kitchen on the first summer day was not lower than those of other days could be due in part to high outdoor concentrations. However, the outdoor PM2.5 concentrations were similar on the three summer days (p>0.05) (Fig. 1), so the high outdoor PM2.5 concentrations do not explain the high PM2.5 concentrations in the kitchen on the first summer day. Although LPG is often considered a cleaner burning energy source, the emission of soot from a similar LPG stove, due to poor air and fuel mixing, has been reported (Chen and Zhu, 2004).
TSP and PM2.5 concentrations in the bedroom and outdoors
Although the measured mean 24-h TSP (0.77±0.13 mg/m3 and 0.58±0.24 mg/m3 in the winter and summer, respectively) and measured mean 24-h PM2.5 (0.46±0.25 mg/m3 and 0.16±0.10 mg/m3 in the winter and summer, respectively) in the outdoor air were significantly lower than those in the kitchen (p<0.05), they exceeded the national air quality standard of TSP for ambient environment (24-h, 0.30 mg/m3) (BEP, 1996). In rural residential areas of China, solid fuel burning is a major PM emission source (Zhang and Smith, 2007). Because large quantities of solid fuels are burned in winter in most rural villages in northern China and the population density is high, ambient air pollution in the villages in winter is often similar to, if not more severe than that in large Chinese cities (Liu et al., 2007; Wang et al., 2009). Based on emission factors measured under similar conditions (Shen et al., 2010), the daily PM2.5 emission from this single household is estimated at 34.6±1.9 g/d. The majority of PM emitted from the household eventually reaches the ambient environment. As a result, PM2.5 concentrations in the outdoor air in the winter were significantly higher than in the summer (Fig. 1). However, because of the limited air exchange in the kitchen during the winter, the difference between winter and summer PM2.5 concentrations in the kitchen was greater than the difference between winter and summer concentrations outdoors.
On average, the daily mean TSP and PM2.5 concentrations in the bedroom were 0.43±0.12 mg/m3 and 0.36±0.068 mg/m3 in the winter and 0.41±0.092 mg/m3 and 0.063±0.055 mg/m3 in the summer (Fig. 1). Although the bedroom PM2.5 concentrations were 2 to 40 times lower than those in the kitchen, and slightly lower than those in the outdoor air, the concentrations in the winter exceeded China's indoor air quality standard for PM10 (24 h, 0.15 mg/m3) by a factor of 2 to 3. During the summer, the PM2.5 concentrations were close to, if not higher than, the standard. The indoor/outdoor TSP and PM2.5 concentration (I/O) ratios for the kitchen were greater than 1 (1.4–3.6), while the I/O ratios for the bedroom were ≤1 (0.2–1.0). These ratios indicate transport directions from the kitchen to outdoors in both winter and summer and from outdoors to the bedroom in summer. During the winter, it is likely that some of the PM2.5 in the bedroom is from the kitchen when the windows are closed.
PM2.5/TSP ratio
For most samples collected in this study, PM2.5 made up a large fraction of the TSP. The mean PM2.5/TSP ratio was 0.53±0.27 and varied from 0.14 (bedroom, summer) to 0.95 (bedroom, winter). Figure 2 shows a plot of log-transformed PM2.5 concentration versus log-transformed TSP concentration for the kitchen, bedroom, and outdoors. A linear correlation is evident for both winter and summer; however, the slopes are different. In general, the PM2.5/TSP concentration ratio in the winter (0.66) was significantly higher than the PM2.5/TSP concentration ratio in the summer (0.36) (p<0.05). Such a seasonal difference is probably not due to emission sources in the kitchen, because there were no significant differences in the PM2.5/TSP concentration ratio in the kitchen during the summer and winter (p>0.05).
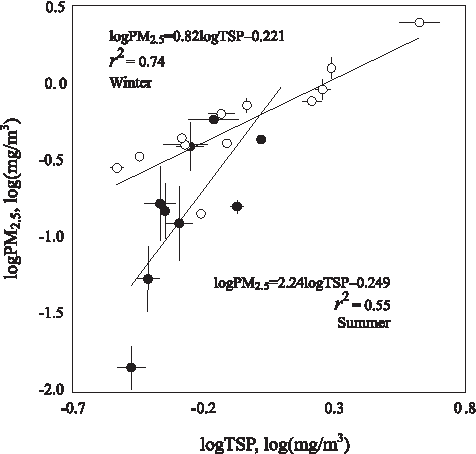
Relationship between the log-transformed TSP and PM2.5 concentrations in kitchen, bedroom, and outdoors in winter (○) and summer (●). Arithmetic means (circles) and standard deviations (bars) are presented.
With a single exception (outdoor, winter, day 4), the winter outdoor PM2.5/TSP concentration ratios were higher than those in the summer. Because the kitchen PM2.5/TSP concentration ratio is similar between the two seasons, the seasonality in outdoor air ratio can be explained by relatively high levels of coarse particles in the summer. This is probably due, at least in part, to dust from the surrounding roads and fields rather than biomass burning. This is further confirmed by the relatively high PM2.5 concentration ratio between the kitchen and outdoors (3.1±1.1) compared to the TSP concentration ratio between kitchen and outdoors (1.4±0.2) in the summer.
The PM2.5/TSP concentration ratio in the bedroom varied dramatically from 0.85±0.10 in the winter to 0.14±0.098 in the summer. In the winter, all the windows and all the doors (except those between rooms) of the house were closed tightly. In addition, the door between the kitchen and the bedroom was often open during the day. As a result, particulate matter in the bedroom was from the kitchen predominately. Fine particles (PM2.5) readily diffused from the kitchen to the bedroom, leading to an increased PM2.5/TSP concentration ratio in the bedroom. During the summer, the majority of particulate matter in the bedroom was from outdoors through open windows. As a result, the PM concentrations and the PM2.5/TSP concentration ratios were similar between the outdoors and the bedroom.
EC and OC concentrations
As shown in Fig. 3, the EC concentrations varied from 4.6 μg/m3 to 45.1 μg/m3, and OC concentrations varied from 22 μg/m3 to 3540 μg/m3. During the winter, high OC concentrations were measured in the kitchen on the third and fourth days when wood was burned. On the third winter day when the burn rate was slow, OC concentrations were their highest.
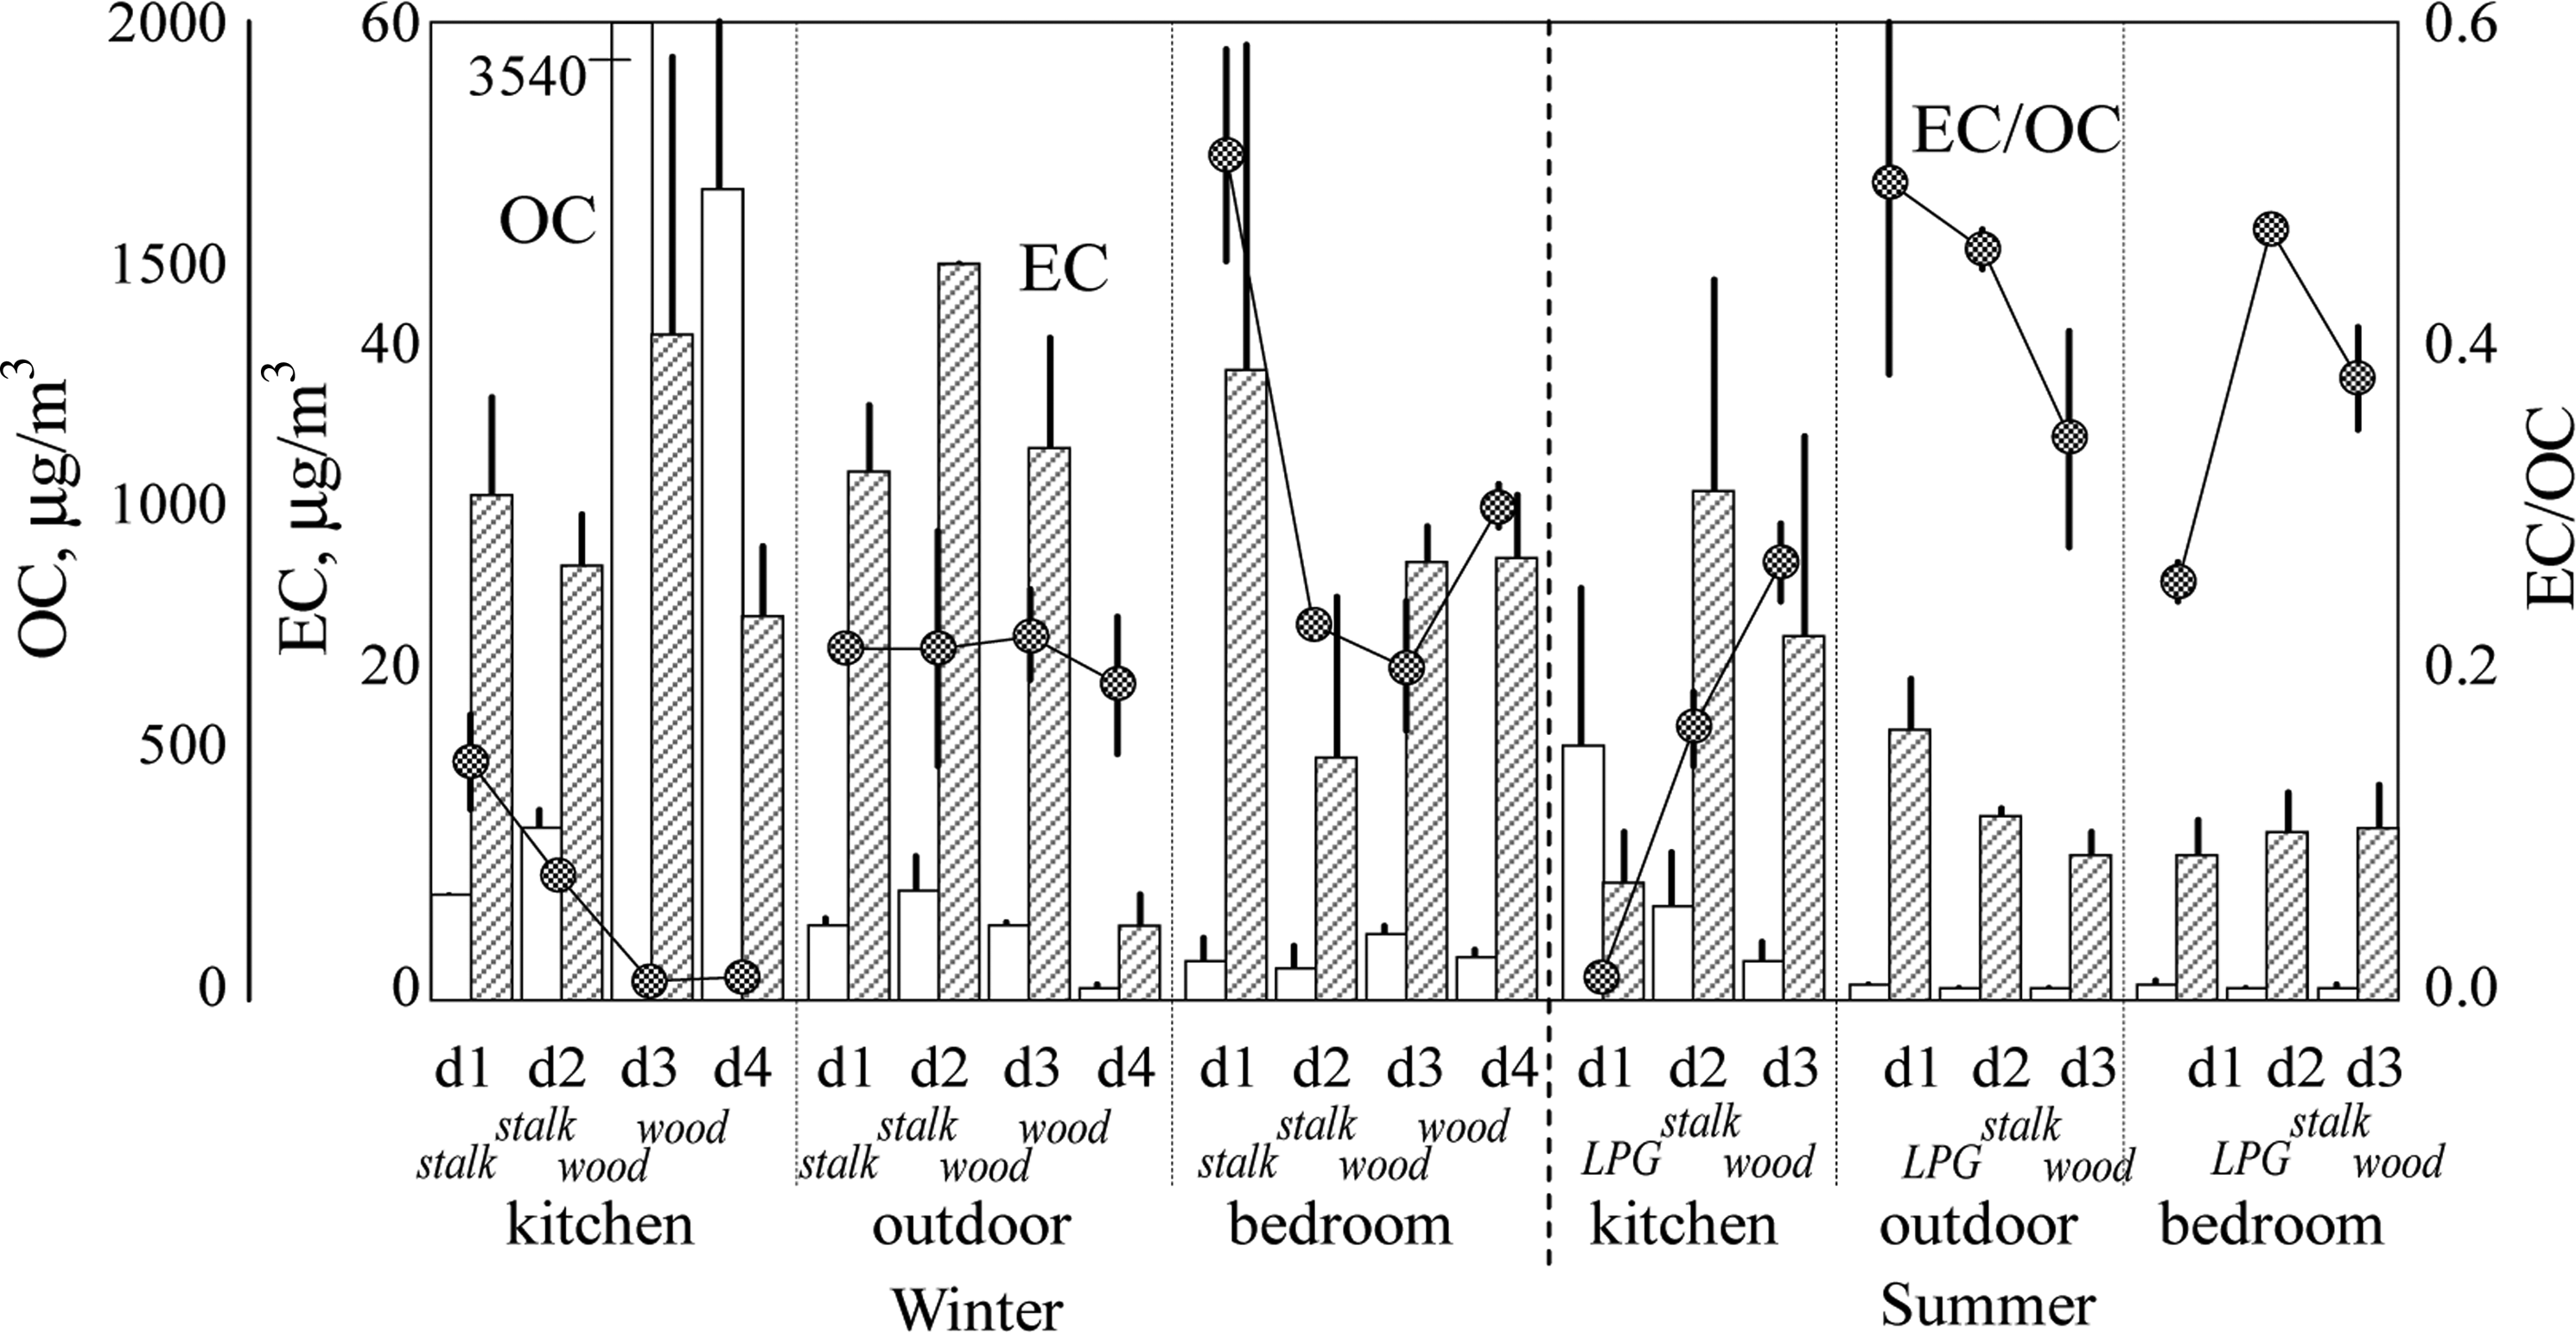
EC (filled bars) and OC (white bars) concentrations and the EC/OC ratios (circles) in the kitchen, bedroom, and outdoors in the winter (four days) and summer (three days) as arithmetic means and standard deviations of paired samples. EC, elemental carbon; OC, organic carbon.
Figure 4 shows a linear correlation between the log-transformed EC and OC concentrations. This suggests that, with the exception of the three kitchen data points, EC and OC sources were similar (Lai et al., 2010). It should be noted that relatively high OC concentrations occurred on the first summer day, when LPG was used with the more modern cookstove. Since stir frying was occasionally used, it is quite possible cooking fumes contributed to the relatively high OC concentrations observed for the three exceptions (See and Balasubramanian, 2008). The relatively low burning rate for the third and fourth winter days (0.03 kg/min and 0.06 kg/min compared to 0.13 kg/min and 0.15 kg/min for the other two winter days), may also be a reason for the relatively high concentrations. More studies are needed for a better understanding of the relatively high OC concentrations.
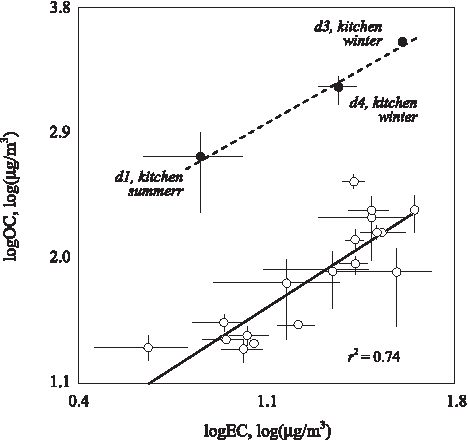
Relationship between the log OC concentration and log EC concentration. Three data points with relatively high OC concentrations are marked with filled circles.
When the kitchen, bedroom, and outdoor data are combined, the EC/OC ratios were 0.20±0.14 and 0.32±0.16 in the winter and summer, respectively. These ratios are similar to those reported for biomass combustion, although most of those reported ratios were based on PM2.5 rather than TSP. For example, EC/OC for crop residue emissions from Chinese household stoves has been said to be about 0.15 (0.04–0.27) (Li et al., 2009). In addition, it has been reported that the EC/OC ratio in ambient air from biomass burning areas ranged from 0.12 to 0.22, while EC/OC ratios in urban and industrial areas ranged from 0.58 to 0.97 (Mayol-Bracero et al., 2002). It was noted that the EC/OC ratios were similar to those observed for cooking fumes (0.13–0.23) and the effect of cooking fumes cannot be totally ruled out (See and Balasubramanian, 2008).
Because the fuel properties and combustion conditions in our study were similar, the EC concentrations from these primary emissions were similar between the two seasons. On the other hand, the kitchen OC concentrations varied significantly among days and seasons. Differences in OC concentrations in ambient air can often be explained by the formation of secondary organic carbon (SOC) under different conditions (Cao et al., 2003; Polidori et al., 2007), and some studies have measured high OC concentrations in cooking fumes (He et al., 2004). Although there is no direct evidence supporting the formation of significant SOC from cooking fumes in this study, it will be interesting to look into the processes in the future. The relatively high kitchen OC concentrations measured when LPG was used with the more modern cookstove were unexpected and may have been due to poor air and fuel mixing (Begum et al., 2009; Chen et al., 2004).
The outdoor EC and OC concentrations in the winter (29±17 μg/m3 and 136±83 μg/m3, respectively) were higher than they were in the summer (12±4 μg/m3 and 28±5 μg/m3, respectively). In urban areas of Beijing, the EC and OC concentrations are 15±11 μg/m3 and 37±19 μg/m3 in winter and 6±3 μg/m3 and 11±4 μg/m3 in summer, which are lower than measured EC and OC concentrations in a rural area (Dan et al., 2004). Severe ambient air pollution in northern China's rural villages is due to household solid fuel combustion (Liu et al., 2007). In the kitchen, the I/O of EC (0.6–5.1 and 0.4–2.8 in the two seasons) were much lower than the I/O of OC (1.4–72 and 3.2–16 in the two seasons), indicating other OC sources such as cooking oil. Seasonal differences can be explained by differences in ventilation (for example, windows open in summer and closed in winter). In the bedroom, the EC and OC concentrations were 27±10 μg/m3 and 91±30 μg/m3 in the winter and 10±1 μg/m3 and 28±6 μg/m3 in the summer. These concentrations are similar to those reported for other rural indoor environments (Begum et al., 2009), but considerably higher than those for urban indoor air (Lai et al., 2010).
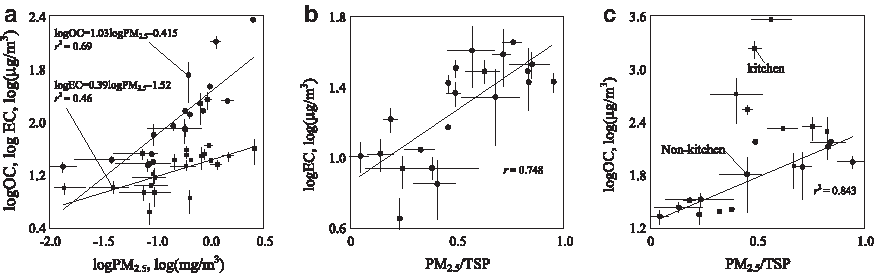
As two important components of PM, it is reasonable to expect OC and EC concentrations to be proportional to PM concentration, and the positive correlation of log-transformed OC and EC concentrations with log-transformed PM2.5 concentrations that are shown in Fig. 5a support this expectation. However, the slopes of the OC and EC regression lines differ by a factor of 2.6, indicating that as PM concentrations decreased, OC concentrations decreased much faster than EC concentrations. A positive correlation between EC emission factors from crop residue burned in an indoor stove and fine PM emissions (less than 1.1 μm in diameter) has been reported recently (Shen et al., 2010). In addition, the EC and OC concentrations in fine PM are much higher than they are in coarse PM (Funasaka et al., 2000). As shown in Fig. 5b, this study found a positive correlation between EC concentration and the PM2.5/TSP ratio. A similar positive correlation was observed for OC concentrations, but only in the bedroom and ambient air (Fig. 5c). This relationship did not exist in the kitchen, probably because of the directly emitted smoke with a high OC concentration.
Personal exposure
Figure 6 shows the 24-h mean PM2.5 concentration measured by the personal air samplers. For the cooking group (housewife accompanied by student) and the control group (husband accompanied by student), the daily average PM2.5 exposure was 0.59±0.22 mg/m3 and 0.25±0.05 mg/m3 in the winter and 0.18±0.02 mg/m3 and 0.13±0.08 mg/m3 in the summer, respectively. Both the cooking group and the control group exceeded the national 24-hour indoor air quality standard of 0.15 mg/m3 for PM10 (GAQS, 2002), in both seasons. In winter, the exposure of the cooking group was more than doubled that of the control group. The exposure concentrations of the cooking group was approximately 4 times higher than the national indoor air PM10 standard (there is no indoor air PM2.5 standard in China), indicating high exposure risk (PM2.3 standard should be lower than PM10 standard). This finding is consistent with other studies in developing countries (Albalak et al., 1999; Siddiqui et al., 2009). The personal exposure PM2.5 concentration in the control group in winter was even lower than the PM2.5 concentrations measured in the bedroom using stationary samplers, because the control group spent their time in rooms other than the bedroom and the kitchen (Supplementary Fig. S1).

Measured daily mean PM2.5 exposure concentrations in the winter (day 1 through day 4) and the summer (day 1 through day 3) from personal samplers worn by the housewife, husband, and two students. During the experiment, one student accompanied the housewife who cooked for everyone (cooking group) and another student accompanied the husband (control group). Arithmetic means and standard deviations are presented.
For individual test days, the PM2.5 exposure levels of the cooking group were always between the PM2.5 concentrations in the kitchen and those in yard and bedroom, indicating the contribution of cooking to the group's exposure levels. On the other hand, correlations between the exposure levels of the cooking group to PM2.5 and PM2.5 concentrations in kitchen, yard, or bedroom were all significant (log-transformed, p<0.05), suggesting that the daily variations in exposure depended not only on contamination in the kitchen, but also on PM2.5 concentrations in the nonkitchen environment.
Based on the difference in PM2.5 exposure concentrations between the cooking group and the control group and the cooking time durations, the mean PM2.5 concentrations in kitchen during cooking periods were roughly estimated by calculating weight averages, assuming that the exposure levels of the two groups were same when they were not in the kitchen. For the seven days of this study, the average PM2.5 concentrations in the kitchen during cooking periods were 3.87±3.96 mg/m3 in the winter and 1.75±1.20 mg/m3 in summer. These concentrations were 3.0 and 3.8 times higher than the daily average concentrations in the kitchen.
Conclusion
Although this study focused on a single household, the results add to our knowledge of the pattern and magnitude of rural indoor air pollution due to cooking practices. Additional studies on the effects of fuel properties, cooking conditions, environmental conditions, and participant activity patterns are needed. There is also a need for studies of PM size distribution (including ultrafine particles), chemical composition, and toxicity for various fuels. We had not expected to find that PM2.5 and OC concentrations in the kitchen were significantly higher than those in the ambient environment and bedroom when LPG. It has been reported that the mean TSP concentration in rural Beijing indoor air when LPG is used as the sole fuel, is 6.3 mg/m3 and over 93% of the TSP is PM10 (Liu et al., 1990). Furthermore, the direct-acting mutagenicity of PM generated from LPG combustion has been demonstrated in a mutagenicity test (Yin et al., 1990). A previous study in northeast China found that exhaust fans were used in all urban kitchens but not in rural kitchens where LPG was used as the fuel (Jiang and Bell, 2008). Because rural households in China are shifting from the use of solid fuels to LPG as a “clean” fuel, the associated change in indoor air pollution and potential adverse effects in rural kitchens require further study.
Footnotes
Acknowledgments
Funding for this study was provided by NIEHS (P42 ES016465), the National Natural Science Foundation of China (41001343, 40503018, and 40730737), Beijing Municipal Government (YB20101000101), the National Basic Research Program (2007CB407301), and the Ministry of Environmental Protection (200809101).
Author Disclosure Statement
No competing financial interests exist.
References
Supplementary Material
Please find the following supplemental material available below.
For Open Access articles published under a Creative Commons License, all supplemental material carries the same license as the article it is associated with.
For non-Open Access articles published, all supplemental material carries a non-exclusive license, and permission requests for re-use of supplemental material or any part of supplemental material shall be sent directly to the copyright owner as specified in the copyright notice associated with the article.
