




Abstract
Abstract
Pilot-scale electrokinetic (EK) separation field tests (2.2 m×10 m×0.2 m, W×L×D) were performed in a greenhouse to investigate the effects of pulse power on salt removal from saline soil. Initially, greenhouse soil had high electrical conductivity (EC; about 6–21 dS/m), and contained mainly Ca2+, Cl−, SO42−, and Na+ ions. After 1 month of treatment, the soil EC was reduced 56% using EK direct current (DC), whereas EK pulses (200 kHz) showed a similar (55%) or enhanced EC reduction (72%). Ca2+ removal was higher using EK pulses, because the pulses were effective at increasing soil–solution interactions, which dissolved additional Ca2+ ions. In addition, EK pulses consumed less than half the electric power of EK DC (134–144 kW·h/m3 vs. 268–354 kW·h/m3) during the same period. Therefore, pulse power both enhances salt removal and saves energy in EK soil remediation.
Introduction
Therefore, underdrainage is commonly used to reclaim saline soils. In practice, however, poor drainage conditions usually mean that many years are needed to attain the proper salinity for crop cultivation. Several other methods have also been used to reduce soil salinity, such as chemical remediation by organics or minerals, mechanical remediation by excavation, and removal of the salt-affected soil and halophytic vegetation. However, these methods have practical limitations (Ravindran et al., 2007).
Electrokinetic (EK) separation is an emerging technology used to remove various inorganic and organic compounds from porous media. It has been developed as a soil remediation technology that can be conducted in situ by applying a direct current (DC) between electrodes placed in the remediation site. It is especially effective for the decontamination of media with low permeability (Renaud and Probstein, 1987; Probstein and Hicks, 1993; Acar et al., 1995).
The restoration of saline soils can be accomplished by the EK technique because they contain large amounts of water-soluble salts. Contaminants are transported by mechanisms, including electromigration, in which ions and ion complexes move toward the electrode of opposite charge; electro-osmotic advection of the pore fluid in the soil medium toward the cathode (rarely toward the anode); diffusion caused by the generated chemical gradient; and electrophoresis (Acar and Alshawabkeh, 1993; Probstein and Hicks, 1993). For the mobilization of charged species, electromigration is generally the dominant mechanism of salt transport, because the velocities are much higher than in electro-osmosis (Luo et al., 2005; Lee et al., 2009b) and the effective ionic mobility of a charged species under a unit electrical gradient is much higher than the effective diffusion coefficient of the same species (Acar and Alshawabkeh, 1993). However, when the concentration gradients steepen or the amount of salts remaining in the pores decreases, diffusion becomes important (Probstein and Hicks, 1993).
Previous studies have demonstrated the efficiency and feasibility of the EK technique for restoring salt-accumulated soils collected from greenhouses or reclaimed lands (Jayasekera and Hall, 2007; Cho et al., 2009, 2010; Choi et al., 2009; Lee et al., 2011; Xu et al., 2012). In the laboratory-scale EK tests, salts such as Na+, Cl−, NO3−, and SO42− have mostly been removed from saline soils, greatly reducing soil salinity (Cho et al., 2009, 2010; Choi et al., 2009). Lee et al. (2011) conducted pilot-scale tests of the EK process, and suggested that an appropriate strategy for reducing the energy expenditure during long-term EK operations should be developed.
Pulse regimes can lead to energy savings because power is not supplied continuously. This results in a decrease in energy consumption at similar or even improved decontamination efficiency. Hansen and Rojo (2007) reported the effectiveness of electrodialytic remediation with a pulsed electric field for removing copper from mine tailings. Reddy and Saichek (2004) found that a periodic electric potential improved the removal of phenanthrene from spiked clay. In addition, Kornilovich et al. (2005) reported that EK treatment in the constant and pulse regimes achieved the same degree of decontamination of metal-contaminated clay, but the pulse regime led to noticeable energy savings. Ryu et al. (2009, 2010) studied pulsed-EK removal of Cd and Zn from fine-grained soils and found that it changed residual metal fractions into weakly bound fractions via exterior physicochemical reactions; hence, the energy expenditure was half of that of normal EK treatment under identical conditions, yet, the two treatments had similar removal efficiency.
These studies have shown that, when using pulses, the system depolarizes while the current is off. This facilitates reactions that increase the interactions between solutions and soil particles, resulting in augmented ion dissolution, micellar solubilization of ions (Reddy and Saichek, 2004), and/or changes in metal-binding forms from residual fractions into weakly bound fractions (Ryu et al., 2009, 2010). Pulsed electro-osmotic flow also improves flushing action (Reddy and Saichek, 2004). However, some researchers have shown that ion transport by pulsed EK regimes is relatively low compared to that of the conventional DC regime (Hansen and Rojo, 2007; Ryu et al., 2010).
In previous studies that employed periodic or pulsed EK treatment, the pulsed EK tests were generally conducted at low frequencies, with cycles of several days, minutes, or seconds. Ryu et al. (2010) reported that a higher pulse frequency (1800 cycles/h) increases the removal efficiency of Zn and Cd compared to a lower frequency (1200 cycles/h) due to the effective extraction of metals near the anode. Therefore, pulsed EK with a higher frequency is expected to achieve effective dissolution and improved ion transport.
In the present study, EK pulses (200 kHz) were used to remove salts from saline greenhouse soils. In particular, the effectiveness of pulsed power in terms of salt removal and energy savings was investigated under field conditions because a field study is essential to examine the feasibility of remediation technology. We expected EK remediation using pulse power to reduce the energy consumption of removing salts at about the same removal efficiency compared to EK treatment using DC power.
Materials and Methods
Site description
We conducted in situ EK tests in a greenhouse in Changwon-si, Republic of Korea. Chrysanthemums were under cultivation in the greenhouse, but they suffered from high concentrations of salts, which caused a decrease in productivity.
Pilot-scale EK tests were performed in the corner of the greenhouse 2.2 m×10 m area (W×L) that covered two ridges and three furrows. The ridges were called “Zone 1” and “Zone 2,” respectively (Fig. 1). The testing area was divided into three sections (Sections 1, 2, and 3) by making a 30-cm gap between the sections. An individual EK system was therefore separately operated in each section in either DC or pulse power mode.
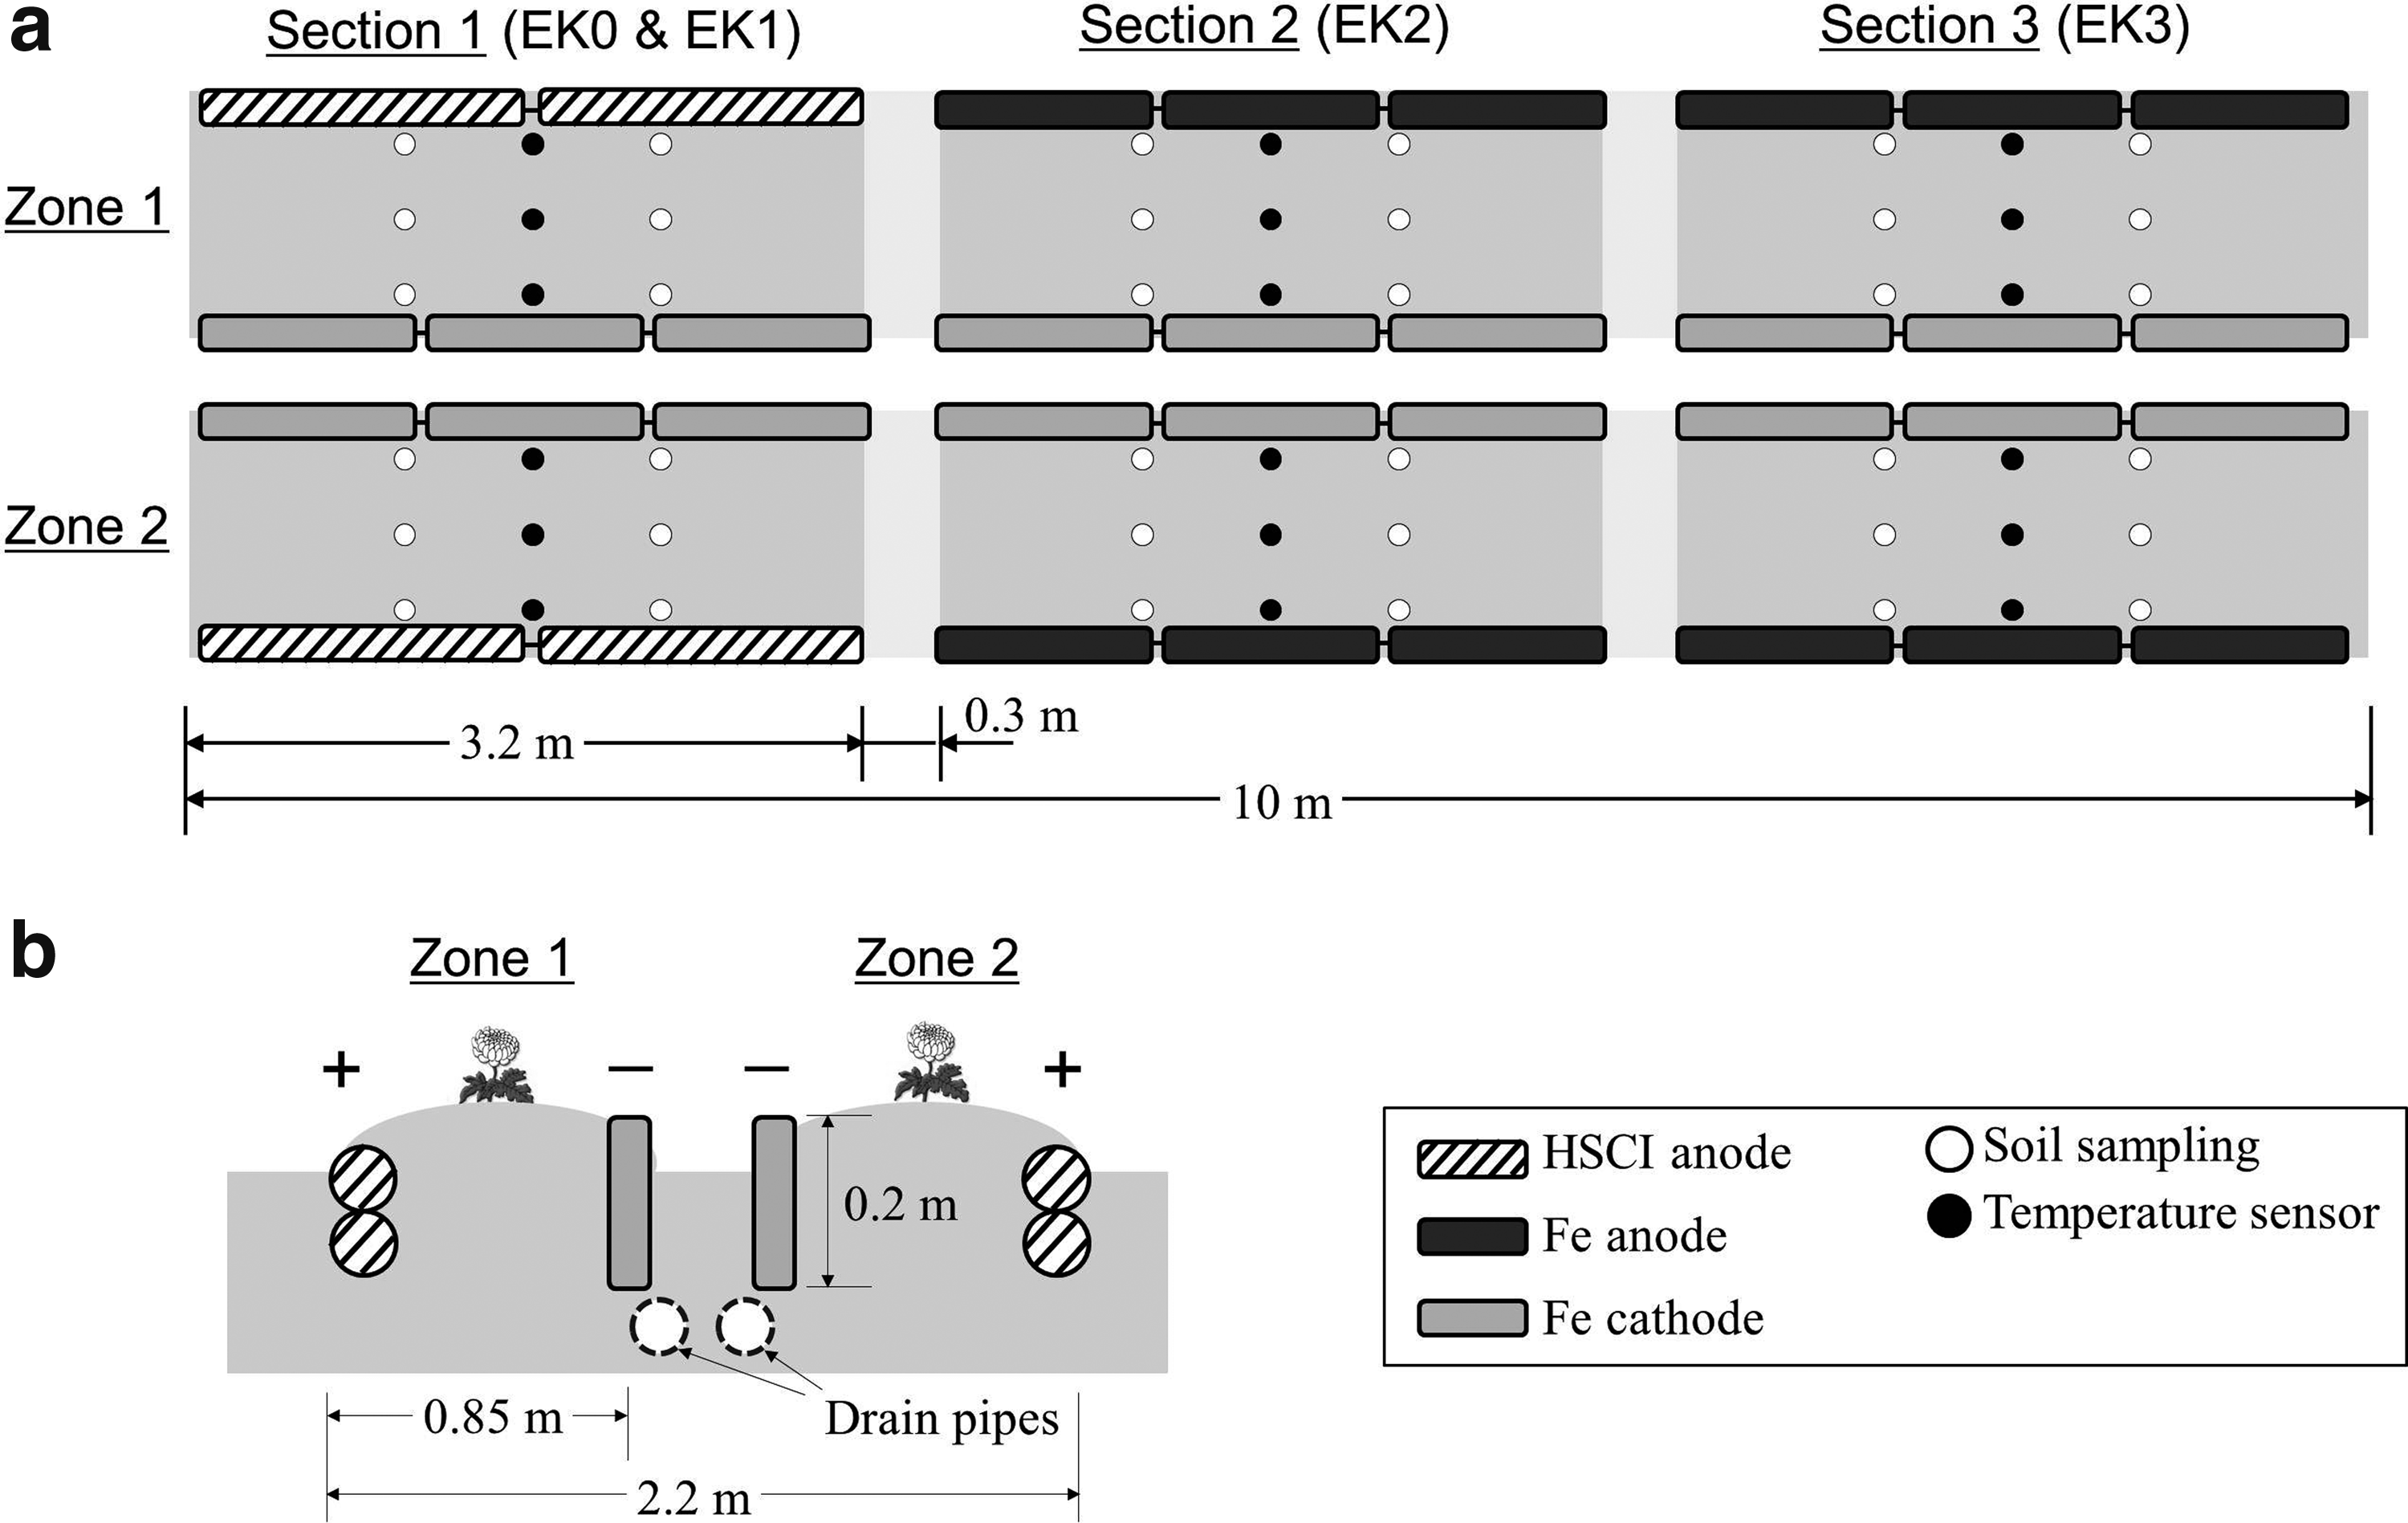
Schematic of the electrokinetic (EK) test site:
In greenhouses, most salts accumulate in the topsoil within a relatively short period of time because the fertilizer cannot be removed from the soil by rainfall, and salts are transferred from the subsoil to the topsoil due to water evaporation. Our test site showed the same trend. We focused on the top layer of soil (0–10 cm depth). The physicochemical properties of the soil are shown in Table 1. The soil consisted of silt (39.5%), sand (32.0%), gravel (19.8%), and clay (8.7%), and the largest particle did not exceed 1 cm in diameter.
EK, electrokinetic; EC, electrical conductivity.
The electrical conductivity (EC) of soil extracts indicates soil salinity. The average EC of the soil in each section ranged from 6.1 to 20.0 dS/m and the main salts were Ca2+, Na+, Cl−, and SO42− ions. Although the soil was mixed before running the experiments, the initial soil conditions of the three sections were not uniform. Therefore, there was wide variance in the concentrations of salts in soil samples depending on the location. Generally, the ion concentrations in Zone 1 were higher than those in Zone 2 due to the geographical features of the greenhouse.
EK test setup
Electrodes were installed along both sides of the ridge in the testing. As anode material, Fe plates were used in Section 1, while high cast silicon iron (HSCI; Samgong Co., Ltd.) rods were used in Sections 2 and 3. The Fe anode was used because we previously found that it was beneficial for the restoration of sulfate-rich saline soils (Lee et al., 2012). In addition, Fe is more economical than other insoluble materials. HSCI is an iron alloy with ∼15% silicon as the primary alloying element. It is primarily used in cathodic protection anodes. Because of its low consumption rate (0.25 kg/A per year), this anode is frequently used in soil (von Baeckmann et al., 1989). In all sections, the Fe plate was used as the cathode.
In Section 1, four HSCI rods (3.8 cm diameter×1.5 m length) and three Fe plates (1 m×0.3 m×5 mm, L×W×T) were installed in each ridge (Fig. 1b). For Sections 2 and 3, however, six pairs of Fe plates were arranged in each section. The anodes and cathodes were symmetrically arranged in Zones 1 and 2 of each section with respect to the center furrow to minimize the leakage current to external facilities in the greenhouse. To drain the electro-osmotic flow, which typically moves toward cathodes in the soil, perforated pipes were installed under the cathodes and the collected drainage was periodically discharged from the collecting bottle using a pump.
Before the pulsed EK tests, a DC power test was conducted in Section 1 using regulated DC power supplies (150 V, 10 A; DAP-15010, Daunanotek Co., Ltd.). This test was labeled EK0. For the pulsed EK tests, a new pulse power supply (100 V, 10 A) was manufactured. The frequency of the output pulse was 200 kHz and the duty ratio was 1:1. The EK1, EK2, and EK3 tests were conducted at the same time. While the pulse power was applied to EK1 and EK3, EK2 used DC power for comparison. All EK tests were conducted for 1 month, and during the tests, the soil was sprinkled with tap water every day to keep the soil moisture constant. The configurations of the EK tests are summarized in Table 2.
DC, direct current; HSCI, high-cast silicon iron.
Measurement and analysis
During the tests, the current and voltage applied to each pair of electrodes were measured by clamp meters (Hioki 3284; Hioki E. E. Co.), and soil temperature was checked by implanting thermocouples (PT100; Technox Inc.) 20 cm into the soil. The monitored data were saved every 10 min by a data acquisition system (Keithley 2750; Keithley Instruments Inc.).
Before and after treatments, soil samples were collected over the test area to determine the initial conditions and final results. The sampling locations are shown in Fig. 1. The samples were collected with a 2.5-cm-diameter soil sampler to a 20-cm depth, and each sample was separated into two parts: the top and bottom layers. After drying at 105°C for 24 h, measurements of pH, EC, and ion concentration were taken.
Five grams of soil was mixed with 25 mL deionized water and stirred vigorously using a magnetic stirrer for 30 min. The soil–water slurry was filtered through a 0.45-μm syringe filter and the filtrate was used for pH and EC measurements. Then, it was injected into the ion chromatography equipment (882 compact plus; Metrohm) to examine anion concentrations (Cl−, NO3−, PO43−, and SO42−). Exchangeable cations (Na, K, Mg, and Ca) were extracted from soil samples with a 1 N (normality) ammonium acetate solution in a 1:10 (soil:solution) ratio. These were analyzed by atomic absorption spectrophotometry (AAnaylst 800; Perkin-Elmer Inc.) after filtration through a 0.45-μm syringe filter.
Results and Discussion
Voltage and current
All EK tests were conducted under constant voltage, but it was adjusted based on field conditions (e.g., soil temperature). The changes in applied voltage and total electric current passed through each section were measured every 10 min. Figure 2 shows the applied voltage and the corresponding current with time. For pulsed tests, the average values are shown.

Change in applied voltage
In the EK0 test, about 50 V was applied to each zone initially. At that time, the total current was about 34 A and the soil temperature near the anode reached over 40°C, which may have had serious effects on the roots of the plants. The applied voltage was therefore reduced to 30 V and increased in a stepwise fashion to maintain a soil temperature below 30°C. During the test, due to trouble with the DC power supply, the EK0 process was stopped several times. The average voltage during the test period was 32 V.
The total current in the EK0 test decreased gradually, reaching 12 A at the end of the test. This gradual decrease can be explained by the reduction in the ion concentration within the pore water due to ion migration and neutralization of hydrogen and hydroxyl ions (Saichek and Reddy, 2003). The current passing through the section was much higher than in the other tests. This might have been caused by a high initial EC in the testing section.
The EK1, EK2, and EK3 tests were conducted at the same time and the voltage of each test was adjusted to about 30 V. The peak voltages of the EK1 and EK3 tests were about 60 V, but the average voltages actually supplied during the remediation were 29, 34, and 24 V in EK1, EK2, and EK3, respectively. (During days 7–10 in the test period, the data on voltage and current were not recorded, due to a problem with the data acquisition system.)
In the EK1 and EK3 tests, which used pulsed power, the current was 6–8 A. However, the current of the EK2 test, where the DC power was applied, ranged from 10 to 12 A. This was higher than for EK1 and EK3 because the voltage of EK2 was higher throughout the period. The current in EK1 decreased at the end of the test, possibly for the same reason as in the EK0 test. However, in the EK2 and EK3 tests, a current decrease was not observed due to the rise in applied voltage.
Soil temperature
For in situ application of the EK treatment to greenhouse soil, it is necessary to examine the changes in soil temperature, because extremely high temperatures may prevent crop growth. To evaluate this factor in the present study, three thermocouples were installed in each test section to investigate the temperature difference depending on the distance from the electrode: anode, middle, and cathode regions.
Figure 3 shows the changes in soil temperature in Zone 1 of the EK0 and EK2 tests. Because the temperature profiles in Zones 1 and 2 were similar in the same test, the graphs in Zone 2 are omitted in this article. As can be seen by comparing Fig. 3 with Fig. 2b, the temperature profiles were roughly similar to the changes in current with time. In the EK0 test, at the beginning of the experiment, when the total current was the highest (33–34 A), the soil temperature ranged from 37°C to 44°C. As the current gradually decreased, the temperature also decreased, ranging from 25°C to 32°C. In the EK2 test, where the current varied from 10 to 12 A, the soil temperature increased gradually from 24°C to 33°C as the applied voltage increased. The temperature profiles for EK1 and EK3 were similar to those for EK2 (Fig. 3b). These results suggest that increases in the current induce higher temperatures because the current generates heat.
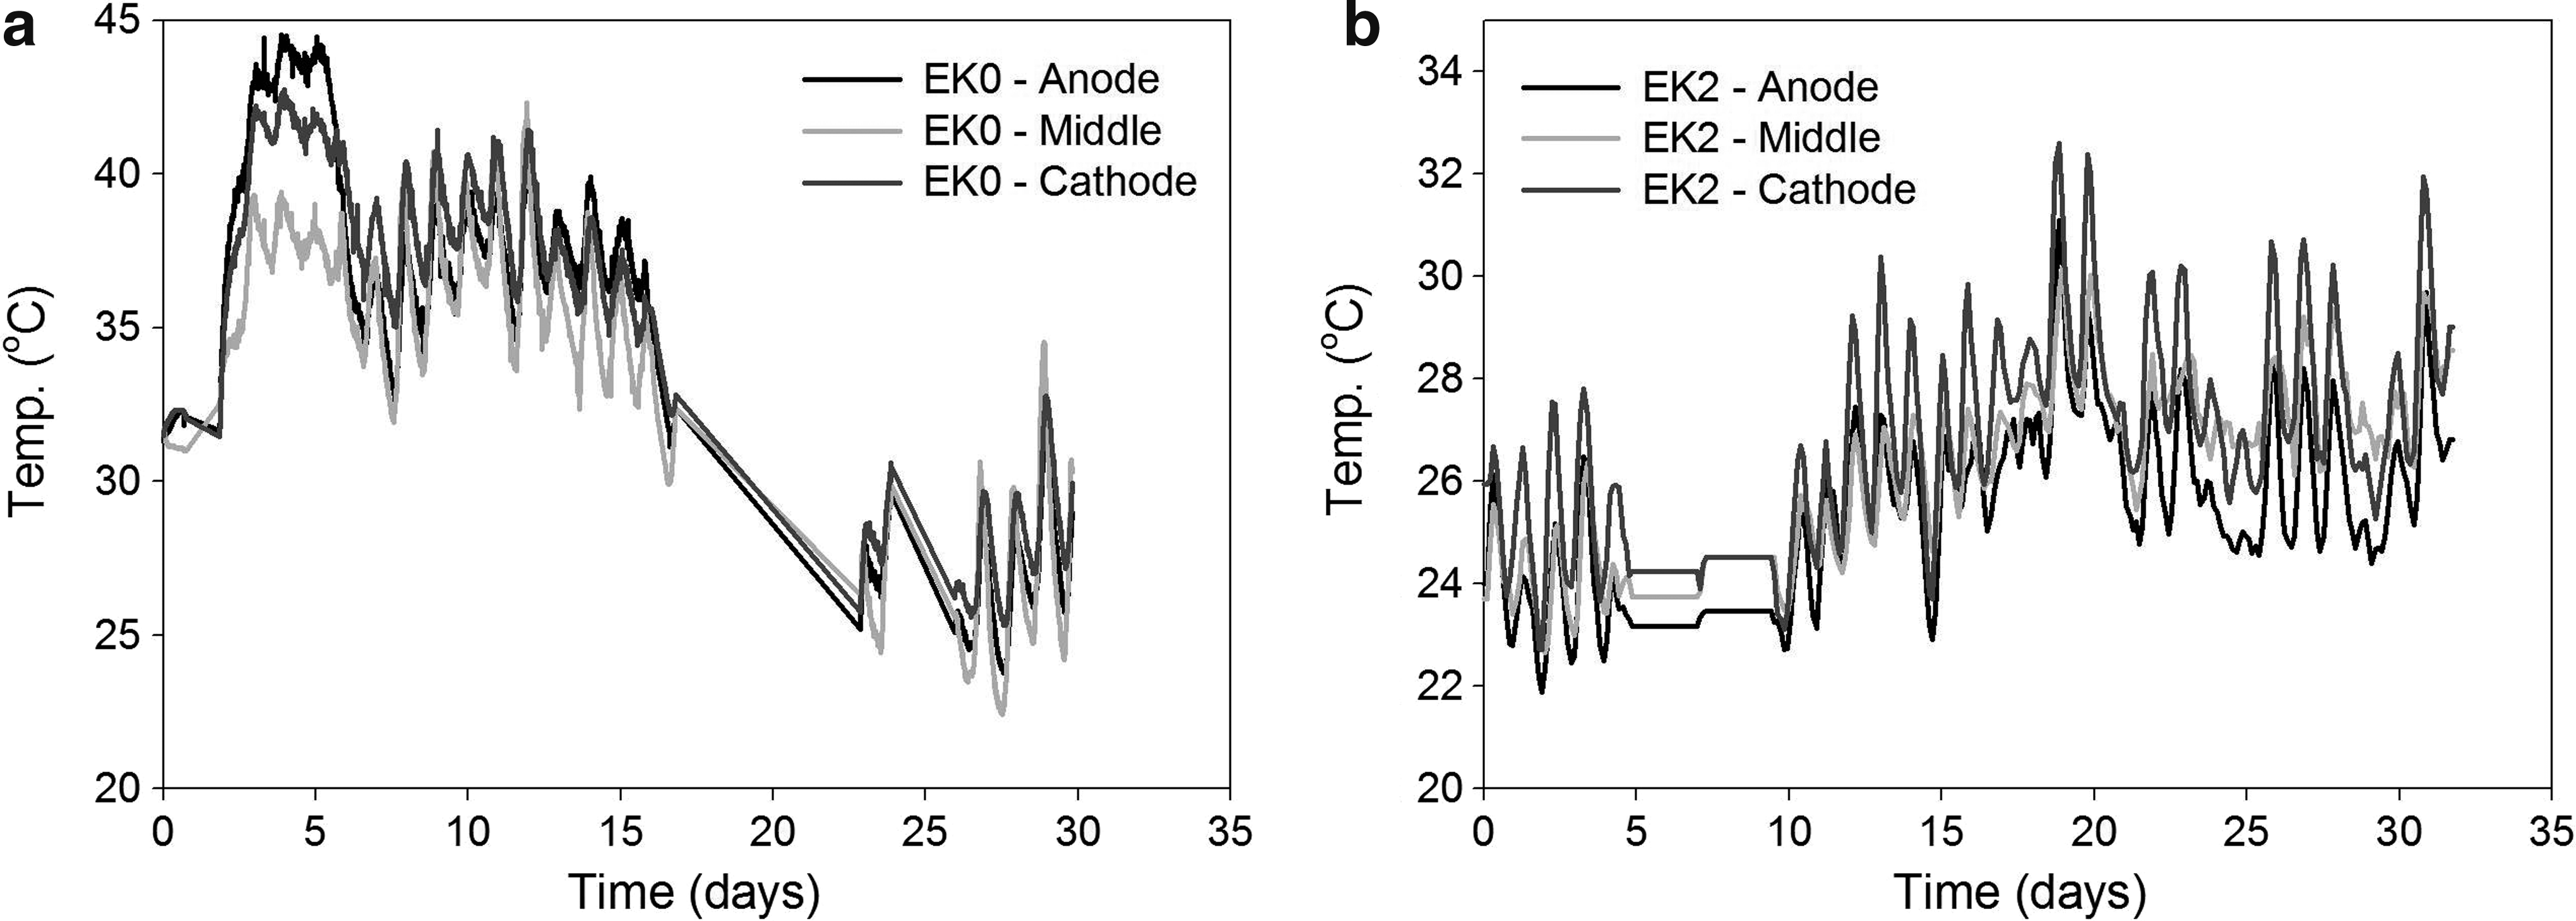
Change in soil temperature with time (Zone 1):
In all EK tests, the cathode regions had the highest temperature. This was probably due to the high resistance there. During the EK process, H+ and OH− ions are produced at the anode and cathode by electrolysis. Acid and base fronts thereby move from the anode and cathode regions, respectively. A high pH near the cathode can affect the soil zeta potential and the solubility and adsorption of contaminants (Probstein and Hicks, 1993). The adsorbed ions and precipitates produced by OH− ions may cause the soil pore to become clogged or blocked. This causes the soil resistance, and hence, the temperature to increase in the cathode regions.
Transport of salts in the soil
After the EK tests, the ion concentrations were investigated according to the position and depth. Then, the distributions of the main ions were plotted as the ratio of the final to the initial concentration.
In the EK process, charged ions are mainly moved by electromigration, electro-osmosis, electrophoresis, and diffusion. Cation transport is enhanced by both electro-osmosis and electromigration, because both mechanisms drive cations toward the cathode (Luo et al., 2005; Lee et al., 2009b).
Figure 4 shows the distributions of Na+ and Ca2+ in the top layer of the treated soil. As shown in Fig. 4a, in the cathode region of EK0, the Na+ ion remained at a high ratio, and gentle gradients were observed in the other tests. On the whole, the ratio of the residual to initial Na+ ions was low and only a small number of Na+ ions remained in some places of the test area. This supports the idea that cations moved toward the cathodes.
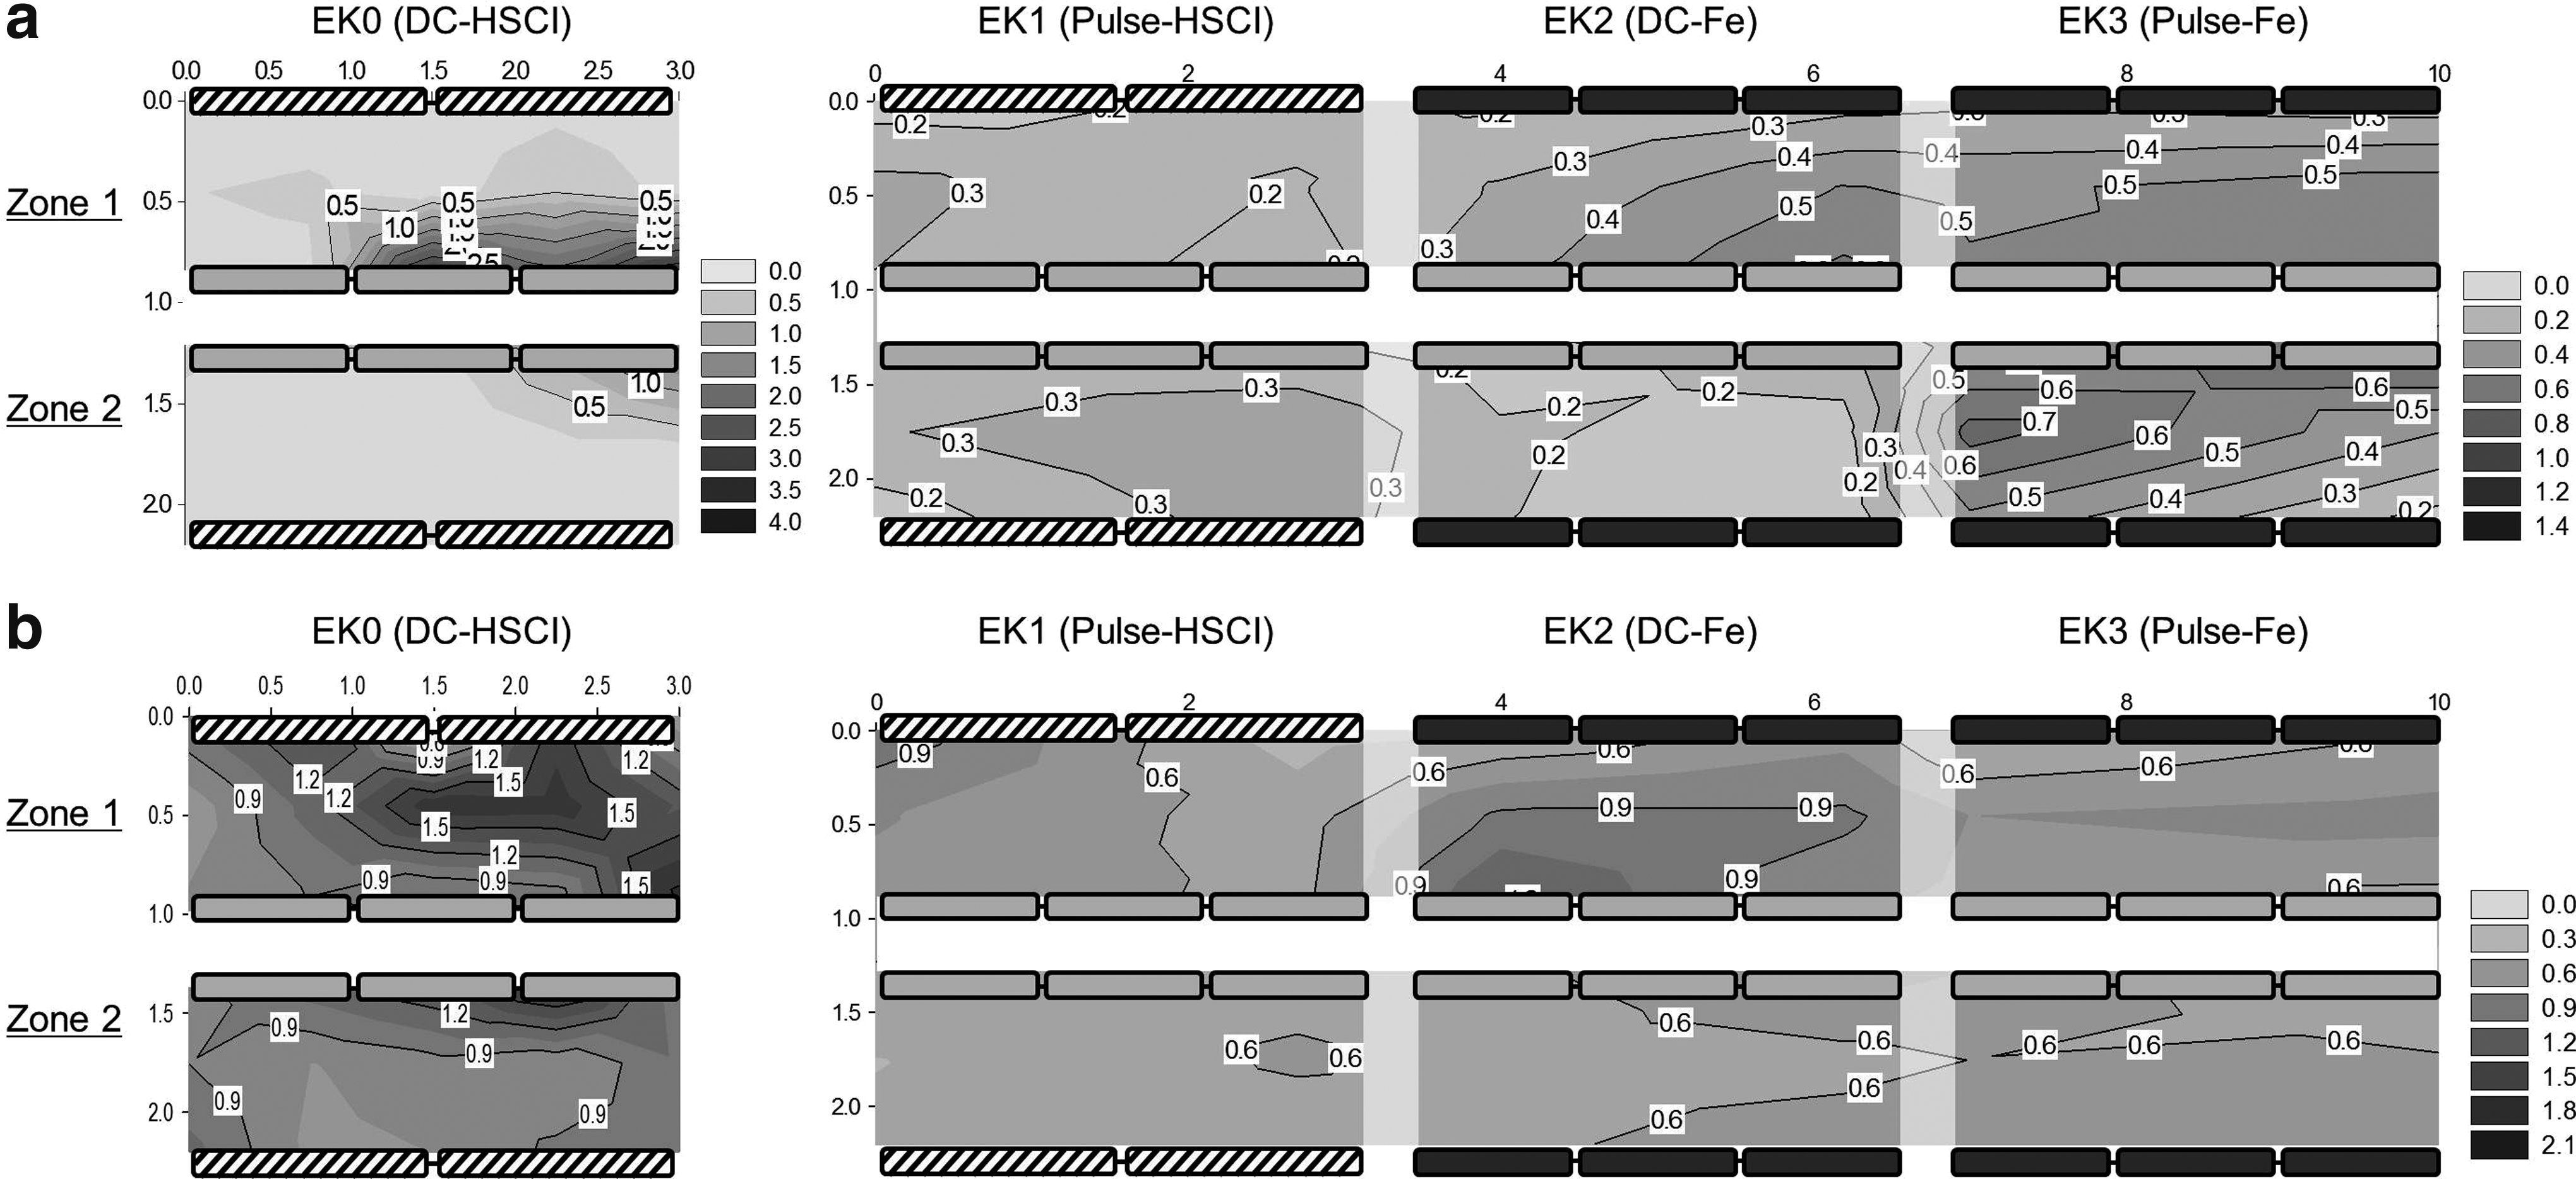
Change in cation distribution:
Similarly, the most abundant cation (Ca2+) moved toward the cathode, but it remained relatively high in the middle of the ridges and the cathode regions (Fig. 4b). Its transport was highly dependent on the soil pH, because Ca2+ precipitates in reactions with anions such as hydroxide and sulfate at a neutral or basic pH. This behavior is similar to that of metals. When a metal enters the region of high pH near the cathode, it may adsorb onto the soil, precipitate, or form hydroxo complexes that precipitate near the region of minimum solubility (Probstein and Hicks, 1993). Therefore, it appeared that Ca2+ ions accumulated near the cathode region where the pH was alkaline. This may have been the reason why removal of Ca2+ ions was more difficult than Na+ removal.
However, the Ca2+ accumulation was not significant in the pulsed EK tests (EK1 and EK3). While the ratio of final to initial Ca2+ ions ranged from 0.6 to 1.9 in EK0 and from 0.5 to 1.2 in EK2, respectively, it was <0.8 in EK1 and EK3. This implies that the pulse mode may have had a positive effect on Ca2+ removal. Reddy and Saichek (2004) reported that switching the electric potential on and off could generate a pulse of electro-osmotic flow, a pulse of electromigration, and/or a pulse of surfactant molecular movement that results in a flushing action. This flushing action increases solubilization and/or physically mobilizes the phenanthrene from the inner boundary layer into the bulk solution. Similarly, the enhanced Ca2+ removal can be explained by the pulse effect. When pulsed power was applied, pulses of electro-osmotic flow and electromigration may have occurred, facilitating reactions that increase the interactions between solutions and soil particles and induce additional dissolution of Ca2+ ions that are adsorbed onto the soil or bound with anions. Therefore, the pulse mode may facilitate the dissolution of calcium salts, and hence, improve ion transport.
The distributions of K+ and Mg2+ were similar to that of Ca2+. The levels of these cations were low around the anodes, but relatively high around the center and the cathodes (data not shown). This implies that electromigration was the mechanism of cation transport, which is consistent with the results of previous studies (Cho et al., 2009, 2010; Lee et al., 2011). However, the effects of the pulse were not remarkable in the K+ and Mg2+ distributions. This is probably because K+ and Mg2+ were more soluble than Ca2+, and hence, the contribution of the additional dissolution resulting from the pulse to the ion transport was negligible.
Figure 5 shows the distributions of Cl− and SO42− ions. Contrary to the cation distributions, it was difficult to find any tendency in anion transport: the anions accumulated in some regions without any apparent pattern. The Cl− ions were mostly reduced across the entire area, especially in the EK1 section, but they remained in several areas in the middle of the ridges. SO42− accumulated more than Cl− near the anodes, in the middle, and around the cathodes.
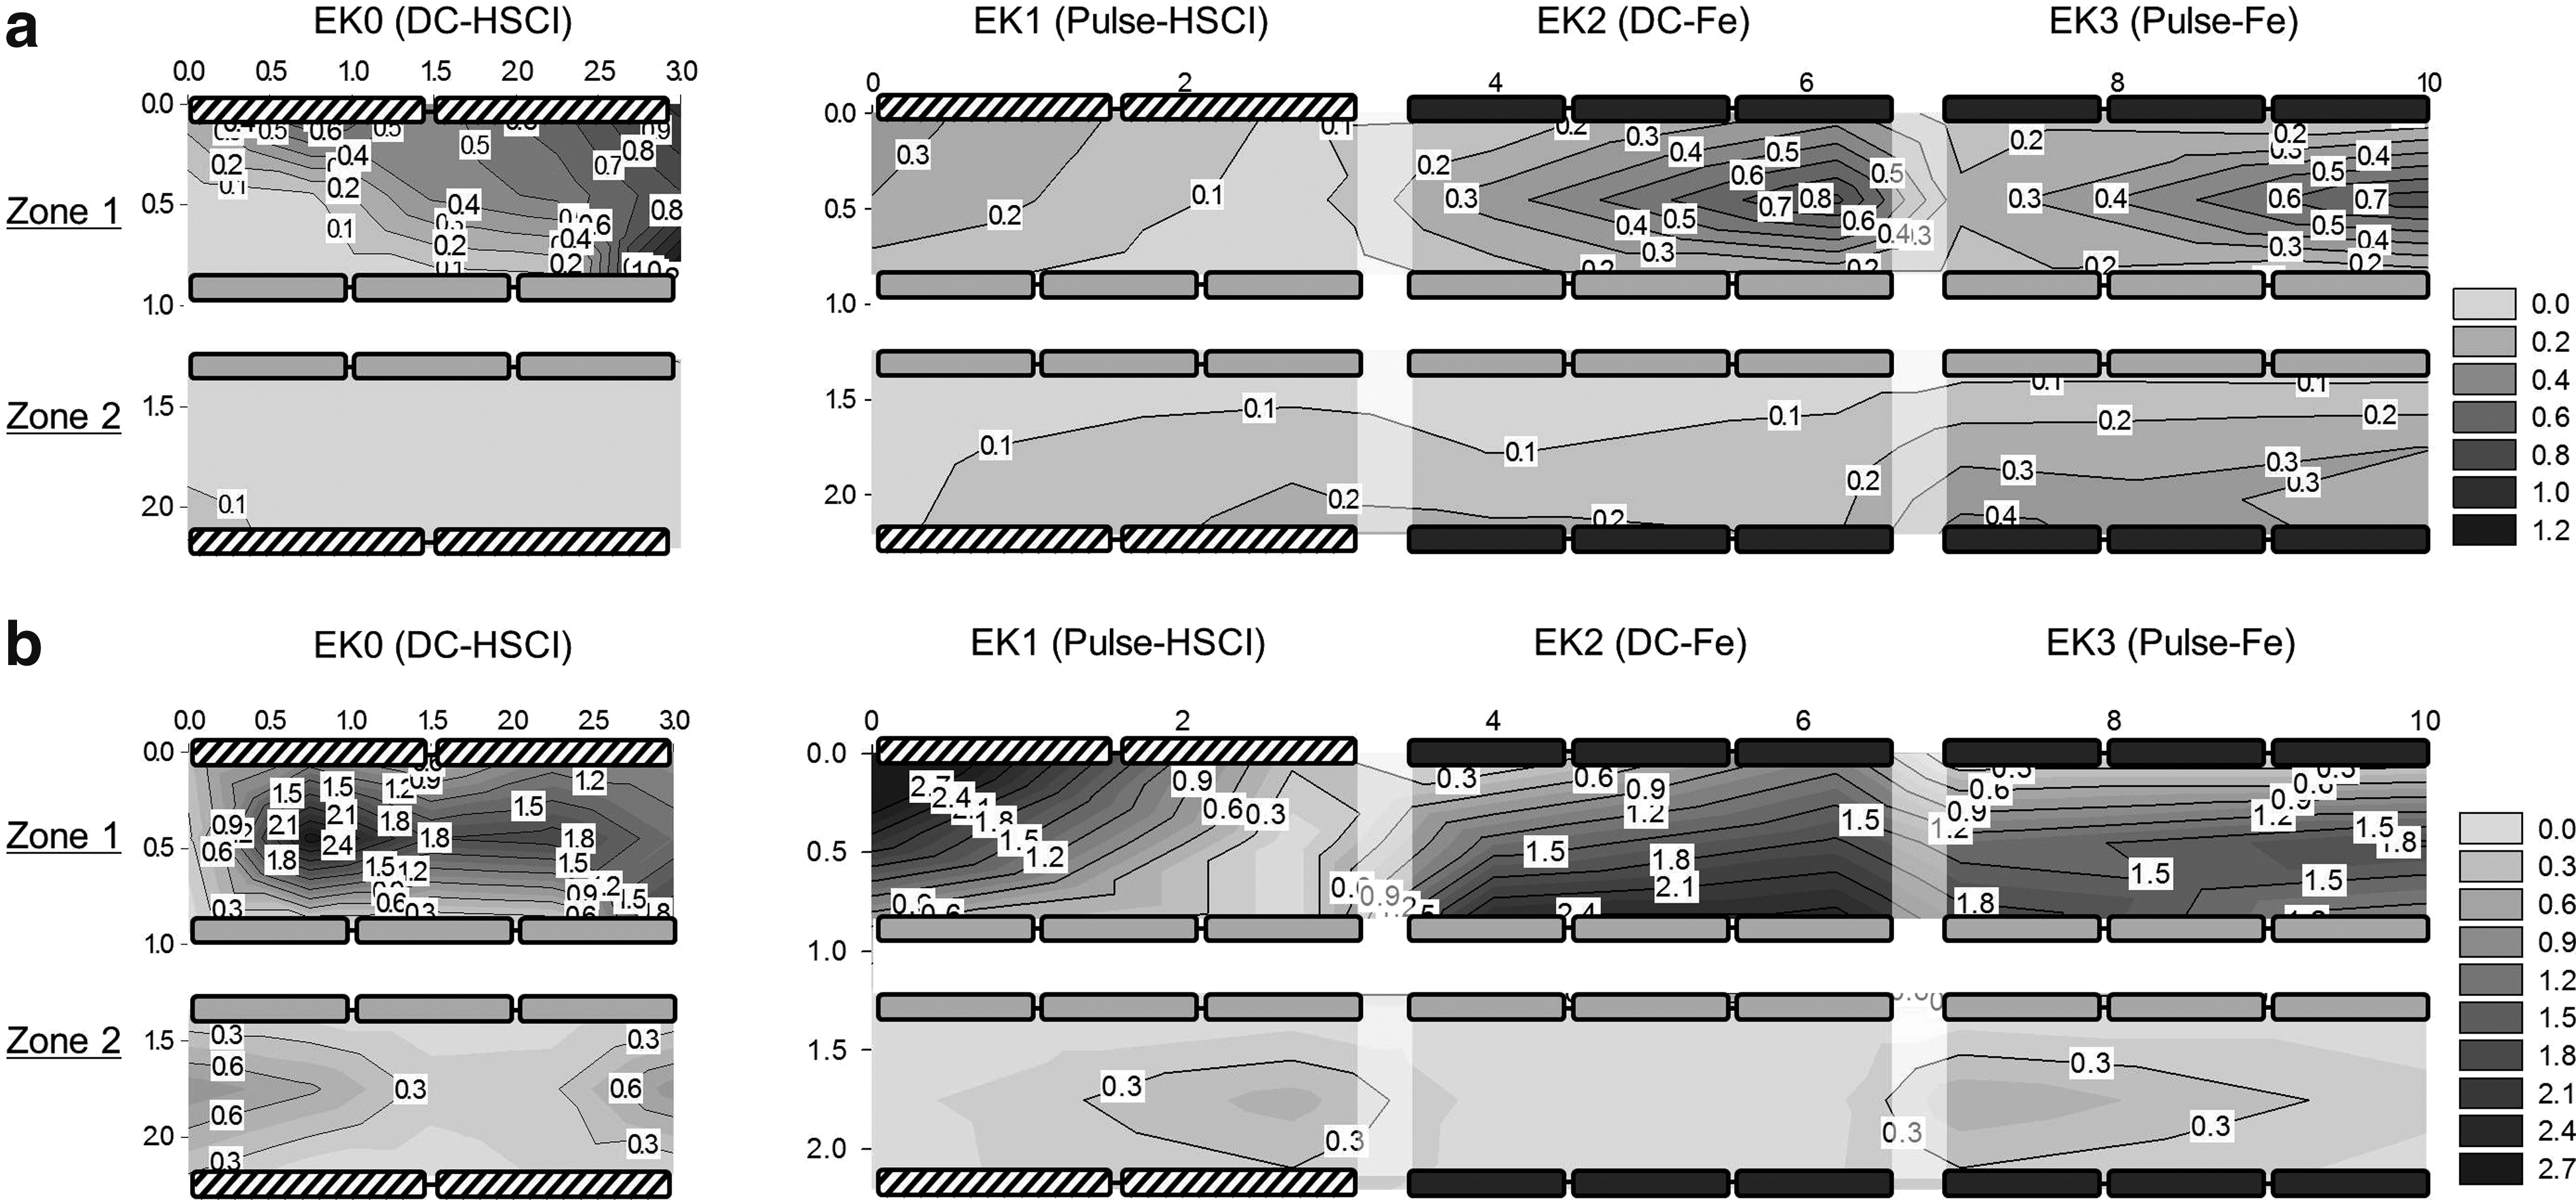
Change in anion distribution:
In EK remediation, anionic species may be transported by electromigration toward the anode even though the pore water moves toward the cathode by electro-osmosis (Lee et al., 2012). However, in the present study, it was ambiguous whether electromigration was the main mechanism of anion removal. This is probably because the slowing of anion transport by electro-osmosis became more serious when the salts had high adsorption strength. In addition, the initial concentrations of the ions were not uniform throughout each site, which may have caused the removal rate to vary accordingly. Therefore, although some anions were removed by EK treatment, it was difficult to determine the difference in anion removal between the normal EK and pulse modes.
EC reduction
Salinity is measured by passing an electrical current through a soil solution made from a soil sample. The ability of the solution to carry a current (its EC) is measured in decisiemens per meter (dS/m). The lower the salt content of the soil, the lower the dS/m rating and the lower the effect on plant growth. While crop yields are generally not significantly affected by salt levels of 0–2 dS/m, a level of 2–4 dS/m restricts the growth of some crops (Cardon et al., 2011).
Figure 6 shows the EC distribution as a ratio to the initial EC. In all EK tests, the soil EC was significantly reduced in Zone 2, but it increased over the initial values in Zone 1. Moreover, it seems that the EC distribution reflected the removal tendency of both Ca2+ and SO42− ions. According to Liu et al. (2006), the EC of saline soil is strongly related to the total concentration of salt, Cl−, the sodium adsorption ratio, and Na+. However, in a previous study, when sulfate-rich soil was remediated via the EK technique, the main ion contributing to the EC of soil extracts was SO42−, because the residual concentration of SO42− ions was the highest among the existing ions (Lee et al., 2012). In the present study, Ca2+ was the most abundant ion. Its accumulation was as high as that of SO42−. Therefore, the distribution of the soil EC appeared to be affected by both Ca2+ and SO42−.
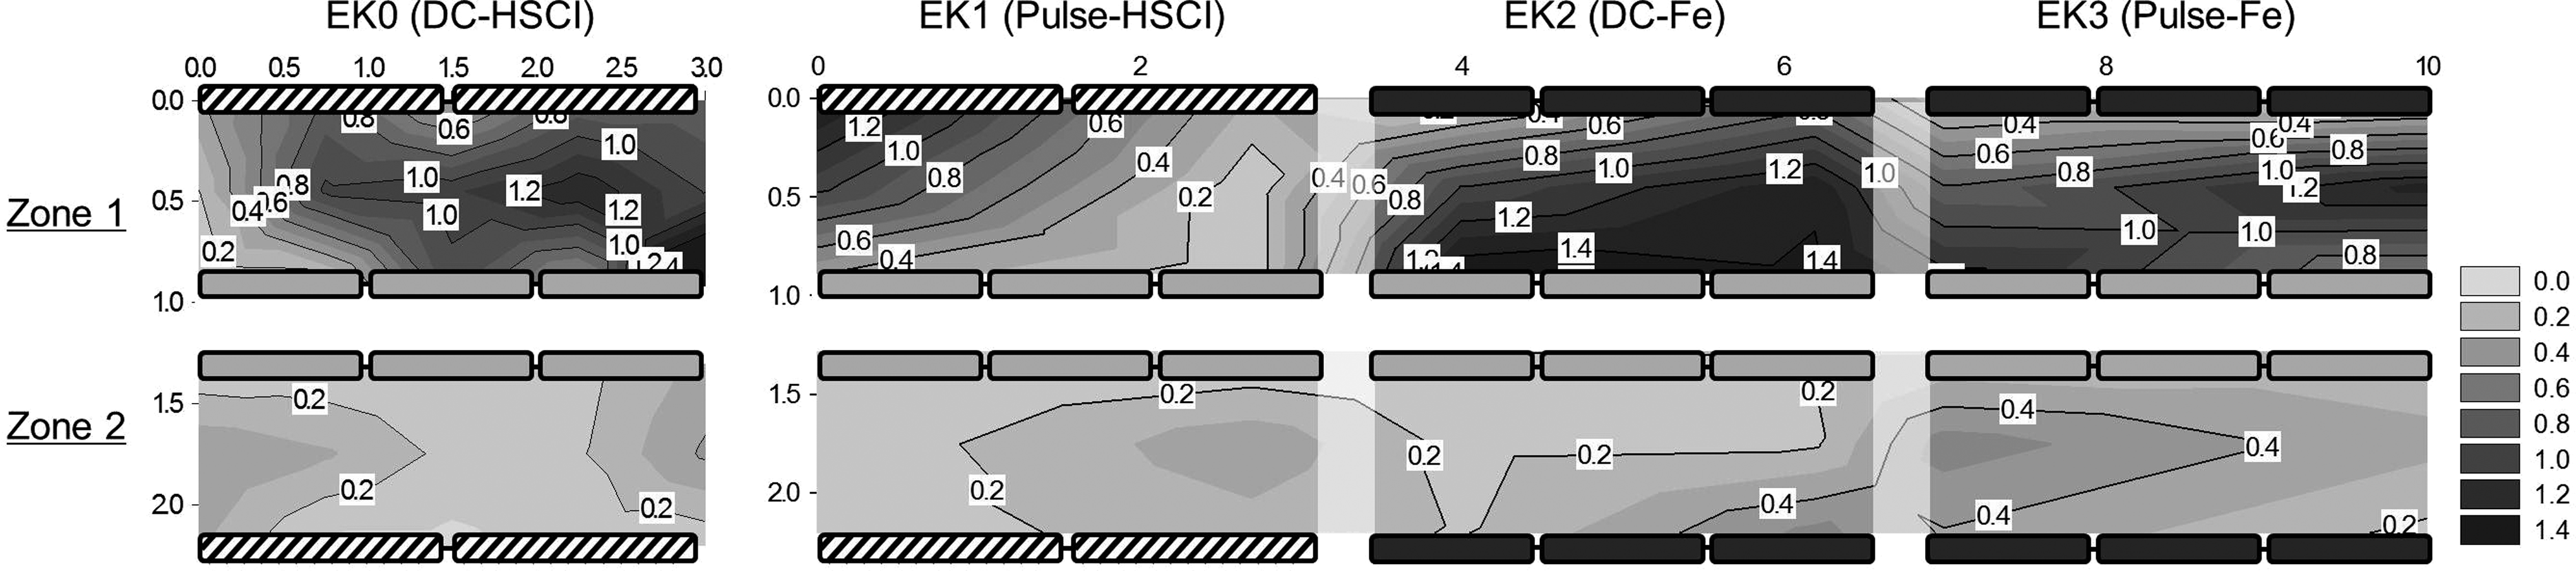
Change in soil electrical conductivity (EC) distribution.
Removal efficiency
The changes in the main ion concentrations and EC in each EK test zone are shown in Fig. 7. The removal efficiency of ions and the overall reduction in soil EC are summarized in Table 3. As mentioned previously, the initial concentrations of ions in Zones 1 and 2 were different due to the soil heterogeneity: the concentration in Zone 1 was generally higher than that in Zone 2. Therefore, the removal efficiency of each ion and the soil EC were examined in each zone. In general, the removal efficiency was higher in Zone 2 than in Zone 1 and the overall EC reduction ranged from 34% to 82%.
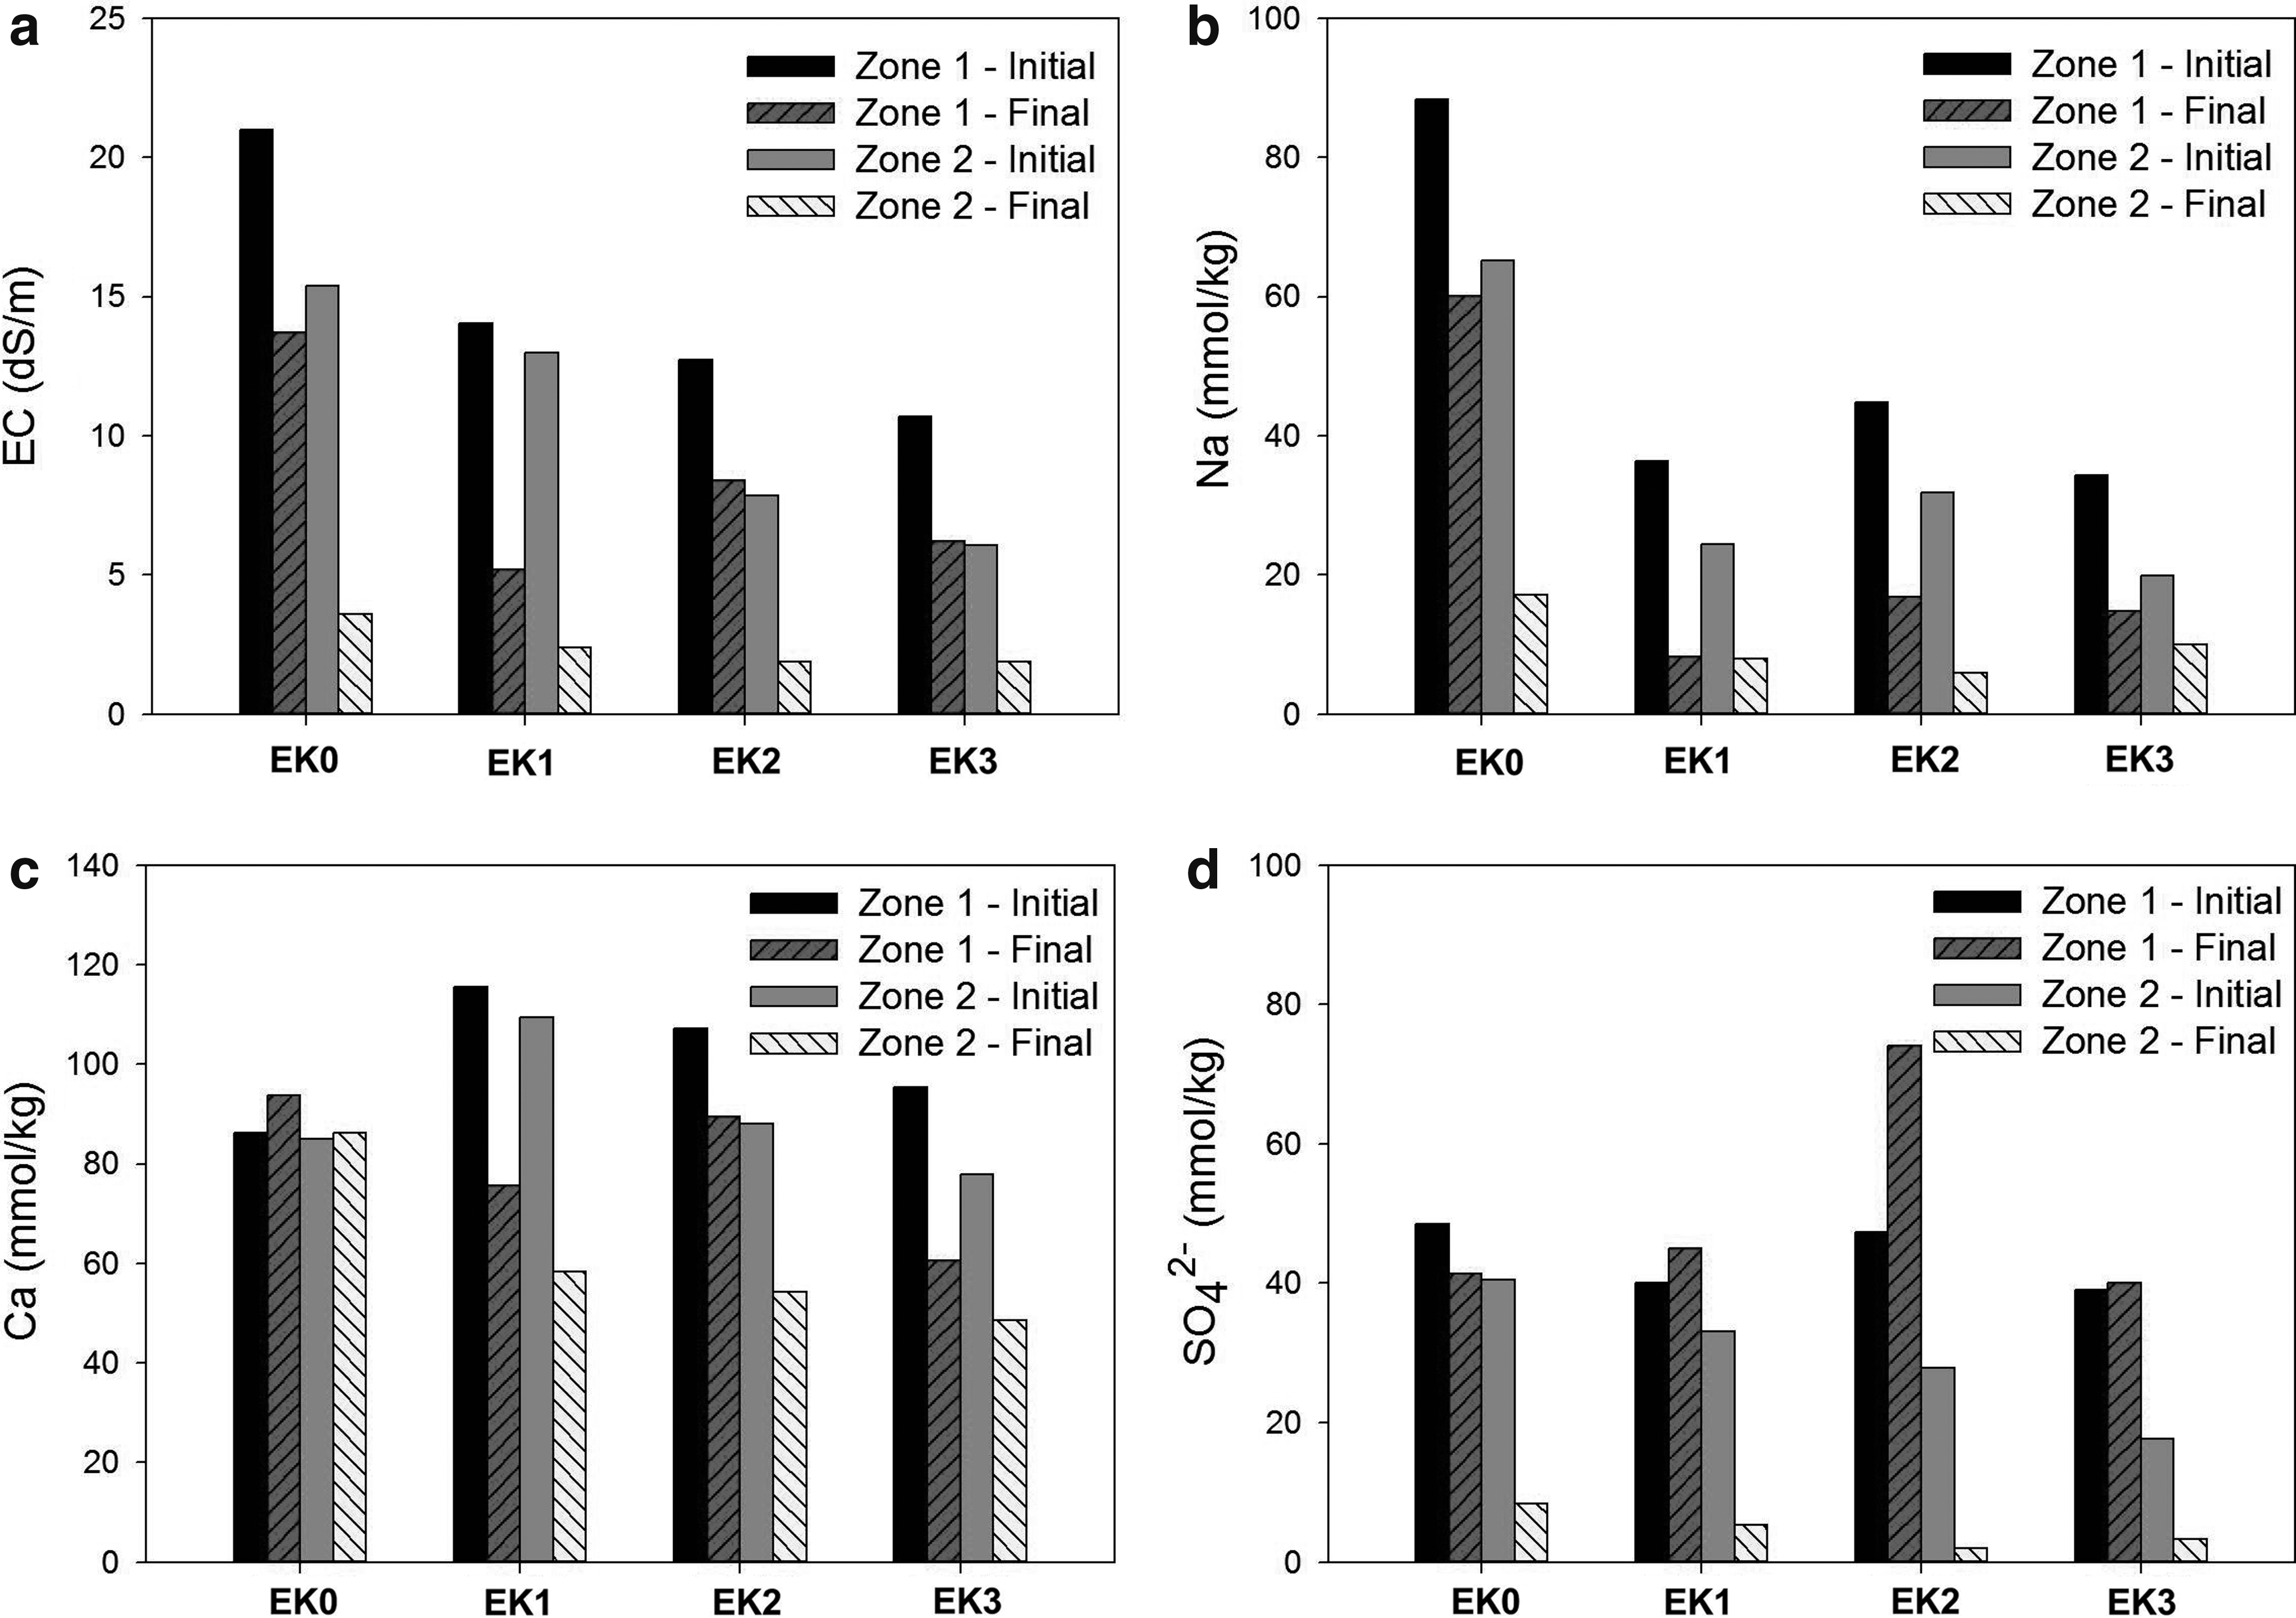
Changes in EC and ion concentrations:
The minus sign means a final content is over its initial value.
As briefly described in the section on ion distributions, among cations, the Na+ ion showed the highest removal efficiency (32–81%), while that of Ca2+ was the worst (−8% to 47%). The removal efficiencies of the other cations, Mg2+ and K+, ranged from −13% to 59% and from −8% to 51%, respectively, depending on the test conditions. In the case of anions, most of Cl− ions were removed in all test sections (66–97%). However, the removal efficiency of SO42− ions was quite different depending on the test zone and conditions.
On the whole, the EK1 test, where pulsed power was applied with HSCI anodes, achieved the highest reduction in soil EC. The average removal efficiency in Zones 1 and 2 was 72%, where those of EK0, EK2, and EK3 were only 55–56%. This indicates that pulsed EK treatment achieved a higher or similar saline reduction during the same treatment period, even if the average voltage was lower compared with the normal DC mode. This may be attributed to enhanced Ca2+ removal, which contributed to the overall decrease in EC. Hence, we expect that the EK pulse mode can achieve similar or better results with less electrical power than can EK DC.
Energy consumption
Table 4 lists the amount of energy consumed in the EK0–EK3 tests considering the volume of the remediation area and the decrease in EC, to compare the energy efficiency of pulsed versus normal EK treatments. The average electrical power applied in the EK0 test was 535 W DC, while that used in EK2 was about 380 W. In the pulse tests (EK1 and EK3), approximately half of the electrical power of EK2 was applied: 205 W in EK1 and 190 W in EK3. Because all of the EK tests were conducted for 1 month, the total energy consumed in each test was proportional to the average electrical power applied. Therefore, the EK0 test used the most energy for remediation (354 kW·h/m3), followed by EK2 (268 kW·h/m3), EK1 (144 kW·h/m3), and EK3 (134 kW·h/m3). As mentioned in the previous section, the pulse mode achieved similar or better results for salt removal. In addition, it consumed less than half the DC mode energy during the same remediation period.
The volume of the soil treated in each section was estimated at 1.09 m3 (1.7 m×3.2 m×0.2 m, W×L×D).
Many researchers have demonstrated that an EK system employing pulse power allows noticeable energy savings compared to DC power with the same peak voltage (Kornilovich et al., 2005; Ryu et al., 2009, 2010). This is natural, because the pulse regime intermittently applies electrical power to the system depending on the duty ratio. However, in the present study, because the applied voltage and the initial soil EC were different in each test, it was difficult to conclude that the pulse saved electrical energy for EK remediation, even though the amount of energy consumed in EK1 and EK3 was less than that in EK0 and EK2.
To investigate the energy savings, the energy efficiencies of the two modes were compared by representing the reduction in EC in terms of energy consumption. In the DC tests, although the average DC power applied to EK0 and EK2 was different, the EC reduction per unit electrical power was almost the same (0.015–0.016 [dS/m]/[kW·h]). However, in the EK pulse system, it was much higher (0.028 and 0.044 [dS/m]/[kW·h]). This means that the pulse power reduced the soil EC more effectively with the same amount of energy. Previously, Lee et al. (2011) reported that a pilot-scale EK study for nitrate removal consumed 259–461 kW·h/m3 of energy for 21 days with DC power. In comparison, the present field study was more economical despite the scale-up and a longer operation time. The EK0 test used a similar amount of power and the EK pulse mode significantly reduced the energy expenditure for the treatment of a unit volume of soil. Therefore, employing the EK pulse system can be an appropriate strategy for field applications.
Conclusions
The effect of pulse power on EK removal of salt from saline soil was investigated by conducting pilot-scale EK field tests in a greenhouse. The following conclusions can be drawn from this study:
• The in situ EK technique is feasible for the restoration of saline greenhouse soils. For in situ application to soils in cultivation, the current should be controlled to limit increases in temperature, especially near the cathodes. • After 1 month of EK treatment, although many Na+ and Cl− ions were removed, ions with a high adsorption capacity such as Ca2+ and SO42− were difficult to remove. However, the pulse mode can enhance Ca2+ removal by inducing the additional dissolution of ions. • Compared to EK treatment using DC power, the EK pulse mode with 200 kHz and a 1:1 duty ratio achieved similar or even better results for EC reduction. In addition, the pulse mode removed the salts more efficiently. Therefore, pulse power can enhance salt removal and save power in EK soil remediation. • Employing an EK pulse system would be an appropriate strategy for field applications. However, further studies on the effects of variables such as the pulse frequency and duty ratio on EK removal are necessary for more effective remediation.
Footnotes
Acknowledgment
This work was supported by a grant from the Korean government, Ministry of Knowledge Economy.
Author Disclosure Statement
No competing financial interests exist.