
Abstract
Abstract
Estrogens, a potent group of endocrine disruptors toward aquatic species, are primarily excreted as conjugates from humans and animals. Radioassay-based approaches with detailed speciation have been frequently conducted for environmental-fate studies for pesticides; however, such techniques have not been exploited for reproductive hormones, and especially for hormone conjugates. This article describes a simple, robust, and high-mass-recovery approach to investigate the fate and transformation of a prototype estrogen conjugate, that is, 17β-estradiol-3-glucuronide (E2-3G), and its metabolites (free estrogens) in a laboratory soil and water matrix without the need for enzymatic cleavage and/or fluorescent derivatization. E2-3G and its metabolites were baseline resolved in a single run using high-performance liquid chromatography (HPLC) and quantified by liquid scintillation counting of the HPLC effluents. Transformation of E2-3G and the disposition of its metabolites––the free estrogens 17β-estradiol and estrone––into aqueous, sorbed, and gaseous phases, were adequately accounted for in a soil–water batch system. High mass balances ranging from 99.0% to 114.1% were obtained. Although the method gave lower sensitivity (parts per billion) than tandem mass spectrometer (parts per trillion), it offered sufficient chromatographic resolution and sensitivity to study the fate of labile estrogens in environmental matrices, using the concentration range of this study. An additional advantage of the approach was the relatively low cost of the instrumentation employed. The presented approach can be successfully applied to study the fate of conjugated hormones and their metabolites in the environment allowing simultaneous discernment of complex fate and transformation processes in soil, water, and gas.
Introduction
Estrogen conjugates are innocuous, but can be easily hydrolyzed to free estrogens by enzymes β-glucuronidase and sulfatase in the environment (Khanal et al., 2006). 17β-estradiol (E2) is the most potent female sex hormone that is present in its free form in feces. E2 can also be formed in the environment as the hydrolyzed metabolite of glucuronide or sulfate conjugates of E2 (D'Ascenzo et al., 2003). The estrogen estrone (E1), has about one-fifth the estrogenic potential of E2 (Wise et al., 2011), and is also excreted in its free form in the feces. It can also be produced as the oxidized product of E2, or as the hydrolyzed metabolite of sulfate or glucuronide conjugates of E1 (Khanal et al., 2006). Environmental fate and transport of sex hormones, especially conjugates, are not well understood because of their labile nature that poses many analytical challenges (Scherr et al., 2009). Various transformation processes such as hydrolysis and oxidation may result in multiple estrogen metabolites in the aqueous and sorbed phases (Khanal et al., 2006), while methanogenesis (Czajka and Londry, 2006) and mineralization (Fan et al., 2007) can produce the gaseous metabolites, methane and CO2, respectively (Fig. 1).
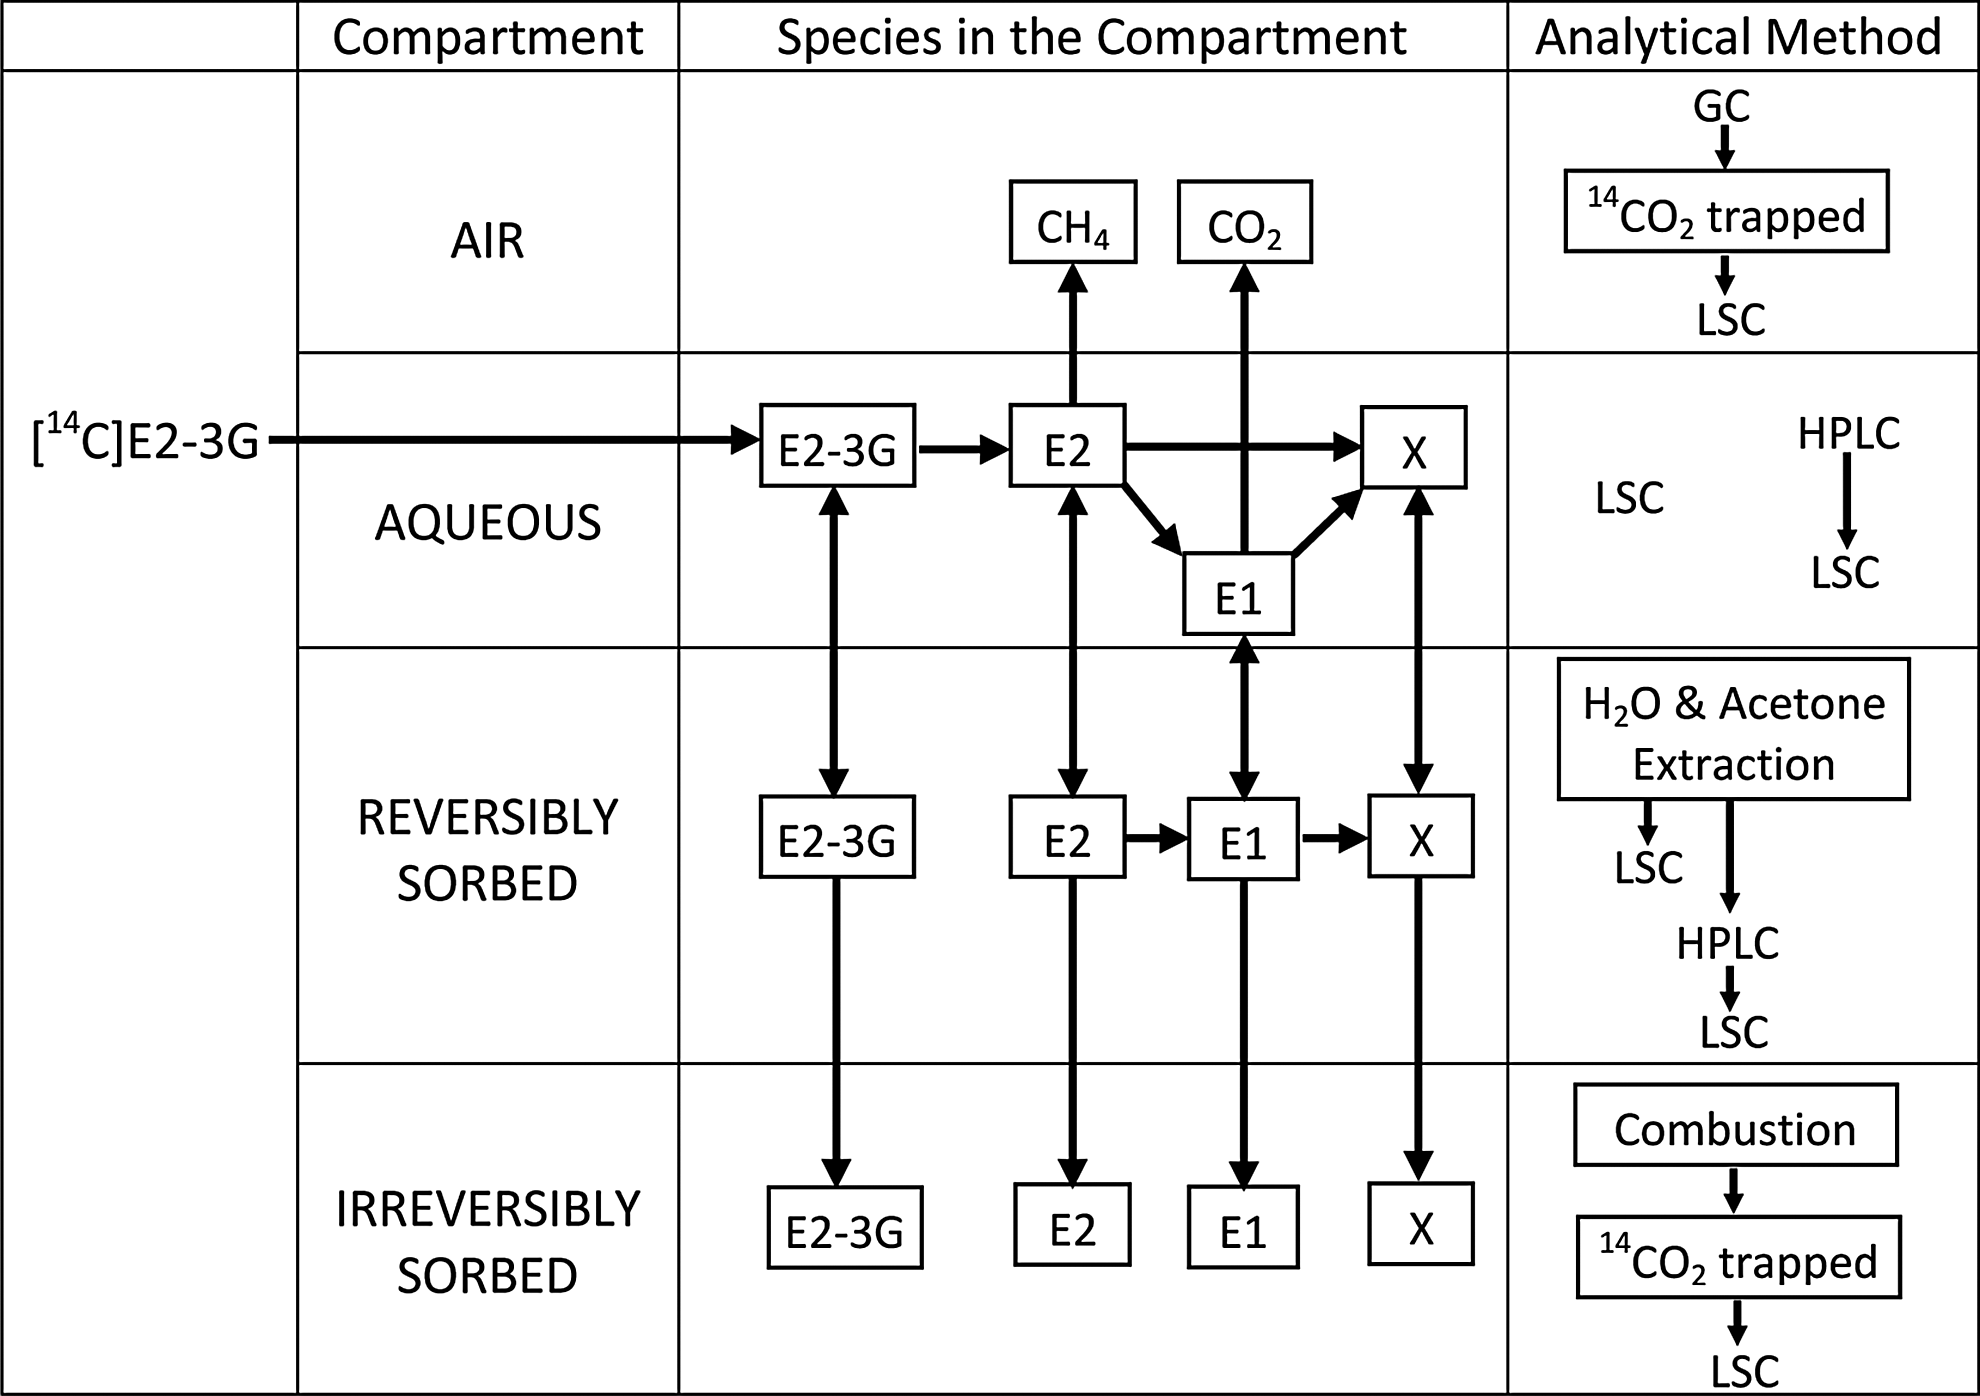
Mass balance and analytical methods used in each compartment. Possible metabolites of 17β-estradiol-3-glucuronide (E2-3G) and pathways are shown in each compartment; X is unidentified radioactive metabolites in scattered peaks. Radiolabeled E2-3G was spiked into the aqueous phase of the aqueous phase to initiate the batch study.
Gas chromatography (GC) is often used to study the environmental fate of steroid sex hormones (Pacakova et al., 2009). However, direct analysis of conjugated steroids is not possible using GC without first hydrolyzing the conjugates and then derivatizing. High-performance liquid chromatography (HPLC) is being increasingly used, as it alleviates the need of hydrolysis of the conjugates (Ingerslev and Halling-Sørensen, 2003). Gas or liquid chromatography–mass spectrometry (MS) or tandem mass spectrometry (MS/MS) offers lower detection limits (ng/L). However, none of these methods can quantify estrogens that are irreversibly bound to soil.
Radioassay-based approach may provide solutions to the analytical challenges of studying the fate and transformation of conjugated estrogens and their metabolites in the laboratory settings. Analysis of radiolabeled estrogens using liquid scintillation counting (LSC) does not suffer from matrix issues, unlike liquid chromatography (LC)-MS. All major fate compartments in soil/water systems (i.e., dissolved, bound, and gaseous) are directly quantifiable with radiological methods (Fan et al., 2007). Pesticide fate and transport have been frequently studied using the combination of radioassay with HPLC (Vithala and Kenneth White, 1996; McDonald et al., 2006; Wang et al., 2009), while this approach is not yet common for environmental fate investigation of steroid hormones. Fan et al. (2007) and Zitnick et al. (2011) used radioassay with thin-layer chromatography for free sex hormones. Marfil-Vega et al. (2011) used LC-MS/MS and LSC to quantify E2 metabolites radioactivity, respectively. This study presents a radioassay-based approach with detailed speciation capability to investigate the environmental fate of highly labile estrogen conjugates such as 17β-estradiol-3-glucuronide (E2-3G). To the best of our knowledge, there are no reports in the literature for a radioassay-based approach to study the fate of conjugated sex hormones in impure or difficult matrices such as soil.
Material and Methods
Reagent and chemicals
The study compound (17β-[4-14C]-estradiol-3-glucuronide [E2-3G; 99% radiochemical purity, specific activity 103.13 Bq/μg]) was synthesized in-house using published methods (Shrestha et al., 2011).
Acetonitrile, ammonium acetate, hydrochloric acid, calcium chloride dehydrate, and formaldehyde (all analytical grade) were purchased from Sigma-Aldrich (St. Louis, MO) and were used as received. Carbo-Sorb E (CO2 entrainment solution) and Permafluor (liquid scintillation cocktail) were purchased from PerkinElmer (Waltham, MA), and Ecolite scintillation cocktail was obtained from MP Biomedicals (Santa Ana, CA). All aqueous solutions were prepared using nanopure water.
For HPLC analysis, individual and composite standards of E2-3G, E2, and E1 were prepared in methanol at concentrations of 0.73, 0.50, and 2.5 ng/μL, respectively. A 50 μL injection was used for all analyses. The standards were stored at −20°C when not used.
Batch soil application
The analytical procedures presented in this batch study are demonstrated using soil, but presumably can be applied to other dirty environmental media, such as sediment, manures, or biosolids. The soil used for the batch studies was the surface horizon (0–6 cm) of a Hamar series soil (sandy-, mixed-, and frigid-typic Endoaquolls). The sand:silt:clay distribution was 83:10:7, organic carbon content was 1.35%, pH was 7.0, and CEC was 9.3 meq 100/g. The soil was air-dried and sieved through a 2 mm sieve and stored in a glass jar until used.
Radiolabeled E2-3G was spiked into triplicate vials containing 1.6 g of soil and 8 mL of 0.01 M CaCl2 (final concentration of 3.7 μg/mL); in addition, triplicate blank and control (0.5 μg/mL) were prepared. Blank vials contained only soil and nanopure water and no analyte. The blank vials were used to investigate the matrix effect on the chromatographic separation and on the method limit of detection (LOD). The control vials had no soil, and were spiked with the radioactive study compound to investigate its stability in the presence of light and water at room temperature. Additional seven vials (stop vials) were prepared (3.7 μg/mL) for destructive sampling to analyze the sorbed phase by sacrificing one stop vial at each sampling event. The vials were agitated (360° every 5 s), and were sampled at 4, 8, 24, 48, 72, 168, and 336 h. Analyses, as described subsequently, were used to quantify and/or qualitatively assess the radioactivity in the gaseous and aqueous phases, and the reversible and irreversible sorbed phases of the soil were analyzed (Fig. 1).
At each sampling time, the vials were centrifuged (380 g, 20 min), and supernatant aliquots of 100 and 120 μL were removed to allow the determination of aqueous phase radioactivity and speciation (metabolite formation), respectively. The aqueous phase radioactivity was measured by LSC of the 100-μL aliquots. The remaining 120-μL aliquots were filtered (0.45-μm PTFE glass filter), and formaldehyde (2.7% final volume) was added to inhibit any microbial activity. The speciation samples were stored at −20°C until further analysis (Fig. 1). Headspace samples (500 μL) were removed with air-tight syringes at the end of aqueous sampling from the regular vials for gas-phase analysis. To protect the integrity of the headspace samples, the batch vials were tightly sealed with Teflon-lined butyl stoppers and aluminum crimp caps, and care was taken to ensure that the tip of the syringe needle was below the liquid surface while aqueous aliquots were sampled.
One of the stop vials was retired at each sampling time. The aqueous and sorbed fractions were separated after centrifugation (380 g), and formaldehyde (2.7% final volume) was added to both fractions and then stored at −20°C until further analysis (Fig. 1).
Analytical techniques
Extraction of the reversibly sorbed fraction
Soils from stop vials were extracted with water (4 mL×3) and acetone (4 mL×3) by sonication for 30 min (Zitnick et al., 2011) to analyze reversibly sorbed fractions (Fig. 1). It should be noted that there may be a risk of incomplete extraction of hydrophobic contaminants from soil, especially in the case of aged samples (Pignatello and Xing, 1995). This may result in the underestimation of the reversibly sorbed fraction and the overestimation of the irreversibly sorbed fraction.
Extracts were evaporated (water extract by vacuum centrifugation and acetone extract with nitrogen), reconstituted in 50:50 acetonitrile:water, and filtered through a 0.45-μm filter before speciation analysis (see below).
Speciation
Aqueous and reversibly sorbed phases were analyzed by HPLC (Waters 600E System Controller and pump; Milford, MA) equipped with a reverse-phase C18 column (Phenomenex® Luna®, 4.6 μm, 250 mm×5 mm; Torrance, CA), a fluorescence detector (FLD; Jasco FP 920; Jasco, Easton, MD), and a fraction collector (Gilson FC 204; Middleton, WI). The HPLC-FLD was used for identifying metabolites by retention time comparison with the reference standards, and for collection of [14C] fractions for LSC analysis. The fluorescence excitation (λex) and emission (λem) wavelengths were 280 and 312 nm, respectively. The mobile phases were Solvent A: 90% 50 mM ammonium acetate (pH 4.5) and 10% acetonitrile, and Solvent B: 90% acetonitrile with 10% 50 mM ammonium acetate (pH 4.5). The gradient was programed as follows: initial condition at 20% solvent B, 29-min concave gradient (curve 7 on gradient programmer) from 20% to 100% solvent B, a hold at 100% solvent B from 29 to 32 min, and a linear return to 20% solvent B from 32 to 35 min. The flow rate was 1.0 mL/min. The gradient curve (shape 7, shallow concave) was used instead of a linear gradient to improve separation between E2 and E1 near the end of the run. The curve allowed delaying the introduction of more solvent B until E2 was eluted first. Both Solvents A and B were degassed daily for 30 min with helium at a flow rate of 30 mL/min.
Quantification of irreversibly sorbed fraction
To quantify soil nonextractable radioactivity, aliquots of dried, residual soil (five replicates of 0.1 g each) from the stop vials were combusted using a Packard 307 sample oxidizer (Packard Chemicals, Meridan, CT; Fan et al., 2007). Blanks were also run before and after a sample set. 14CO2 gas generated from combustion was entrained into 8 mL of CarboSorb E, which was then diluted with 12 mL of Permafluor scintillation cocktail in 20-mL glass scintillation vials. The vials were shaken and stored overnight before counting. Samples were counted with automatic background deduction. Trapping efficiency of [14C] from the combustion process was established before each combustion set, and was ≥98%.
Gas-phase radioactivity
An aliquot of headspace gas (500 μL) was analyzed for radiolabeled methane to determine whether methanogenesis occurred. The headspace aliquot was injected into an HP 5790A gas chromatograph (GC; Avondale, PA) equipped with a 3-m glass column (1.5-mm inner diameter, 7.0-mm outer diameter) packed with 3% OV-17. Initial temperature was 30°C, with a 2-min hold, then raised to 180°C at 30°/min, and held for 5 min. The effluent of the column was split to a flame ionization detector (FID; 42%), and a 740°C oven (58%) containing Cu(II)O, which would catalyze the conversion of [14C] methane into 14CO2.The FID was attached to an integrating recorder (HP 3390A). A six-point standard curve (10, 25, 50, 75, 100, and 150 μL) for methane was determined each day, and linearity of the curve always exceeded R2=0.96. The radiolabeled CO2 was trapped by sparging into CarboSorb E (8 mL) at the correct retention time for methane, then diluted with Permafluor (12 mL), and counted by LSC. A known amount of [14C] toluene was injected unto the GC system and was trapped in the CarboSorb, which always gave the trapping efficiency >90%.
Quantitation of [14C]
All radioactivity was measured with LSC. Radioactivity was determined in all aqueous samples, reversibly sorbed extract samples, HPLC fractions collected from the aqueous samples and reversibly sorbed extract samples, 14CO2 trapped during combustion of the irreversibly sorbed fractions, and 14CO2 trapped during the GC analysis of the headspace aliquots. Liquid samples were mixed with 4 mL of scintillation cocktail EcoLite in a 6-mL HDPE scintillation vial, shaken in a vortex, and counted with an LSC (1900 CA; Packard, Downers Grove, IL). Gaseous samples generated from GC oven oxidation or combustion analyses were counted in 20-mL borosilicate glass scintillation vials by trapping 14CO2 into CarboSorb E and diluted with Permafluor as described previously. Before LSC analysis, the vials were stored overnight in the dark to reduce the effects of induced chemiluminescence and photoluminescence (Cheng and Wong, 2008). To eliminate static charge buildup on the plastic vials during dry weather or contact with latex gloves, the vials were wiped with an antistatic sheet before loading into the LSC. Samples were counted for 10 min and background-corrected, daily with five replicate blanks.
Verification of metabolites
E2-3G and its metabolites were verified using a Waters Alliance 2695 HPLC system (Milford, MA), coupled to a Waters Micromass quadrupole time-of-flight (Q-TOF) LC-MS/MS (Shrestha et al., 2011). Briefly, the LC separation was carried out using a C18 column (Symmetry, Waters; 3.5 μm, 2.1 mm×100 mm) and a mobile phase consisting initially of Solvent A: 40% acetonitrile in water, and Solvent B: 60% acetonitrile in water, increasing linearly to 100% B over 10 min, with a 5 min hold at 0.2 mL/min.
Negative-ion mode was used for mass spectral analysis, with the Q-TOF operating conditions: source temperature 120°C, desolvation temperature 350°C, capillary voltage 2500 V, cone voltage 35 V, and collision energies 20 eV and 50 eV. Data were acquired across a mass range of m/z 100–500 Da at a scan time of 0.1 s. Ions at m/z 447.21, 271.17, 269.17, 183.08, and 145.06 were monitored.
Results and Discussion
Simultaneous analysis of conjugate and free estrogens
An FLD was selected over a UV detector, because fluorescent properties of estrogens allowed greater selectivity with the FLD detector. Also, FLD minimized background interference from interfering environmental compounds in the soil–water matrices that absorb in the UV region. The FLD λex and λem values of 280 and 312 nm, respectively, were able to detect both E2-3G and free estrogens, and were close to those reported previously [λex and λem at 282 and 315 nm, respectively (Mao et al., 2004)] in an analysis of free estrogens E2 and E1. Analyzing 40 ng of E2-3G and E2 produced prominent peaks in the chromatogram; however, the FLD response of E1 at the same mass was low due to its lower native fluorescence (Bramhall and Britten, 1976). A standard injection contained masses of 36.5, 25, and 125 ng for E2-3G, E2, and E1, respectively.
A single-gradient elution scheme was developed to account for the wide degree of polarity of the compounds. Some researchers have used two different isocratic elutions for separately analyzing the conjugates and the free estrogens (Gatti et al., 1998). The mobile-phase gradient of this study was optimized to achieve >2-min resolution for all recognized peaks, that is, E2-3G, E2, and E1, to avoid metabolite overlap in adjacent HPLC fractions trapped every minute using the fraction collector. Solvent elution was also tested with different gradient shapes (linear, concave, and convex) to maximize the resolution in a reasonable time. The separation achieved with the adopted gradient elution scheme is shown in Fig. 2.

High-performance liquid chromatography (HPLC) chromatogram for aqueous-phase sample at 4 h, showing the parent compound (E2-3G) and the metabolites 17β-estradiol (E2) and estrone (E1). Other spurious peaks are nonradioactive peaks from the matrix effect. *Asterisks represent the location of the radiolabel in the compounds.
Compound identification/verification
The HPLC peaks from batch study samples that eluted at 5.2, 27.4, and 29.9 min coincided with elution times for E2-3G, E2, and E1 standards, respectively. The LC-QTOF mass spectrum of the 5.2-min peak contained ions that were consistent with E2-3G (Fig. 3A; m/z of 447.22, 271.17, 175.03, and 113.02). The mass spectrum of the 27.4-min peak contained ions at m/z 271.17, 183.08, and 145.06, which are diagnostic for E2 (Fig. 3B). Mass spectral peaks for the 29.9-min peak (m/z 269.17, 183.08, and 145.06) were identical with standard E1 (Fig. 3C). A radioactive HPLC peak occasionally detected at 8.4 min suggested a metabolite that was relatively high in polarity, but not as polar as E2-3G. Further investigation of that peak was outside the scope of this study.
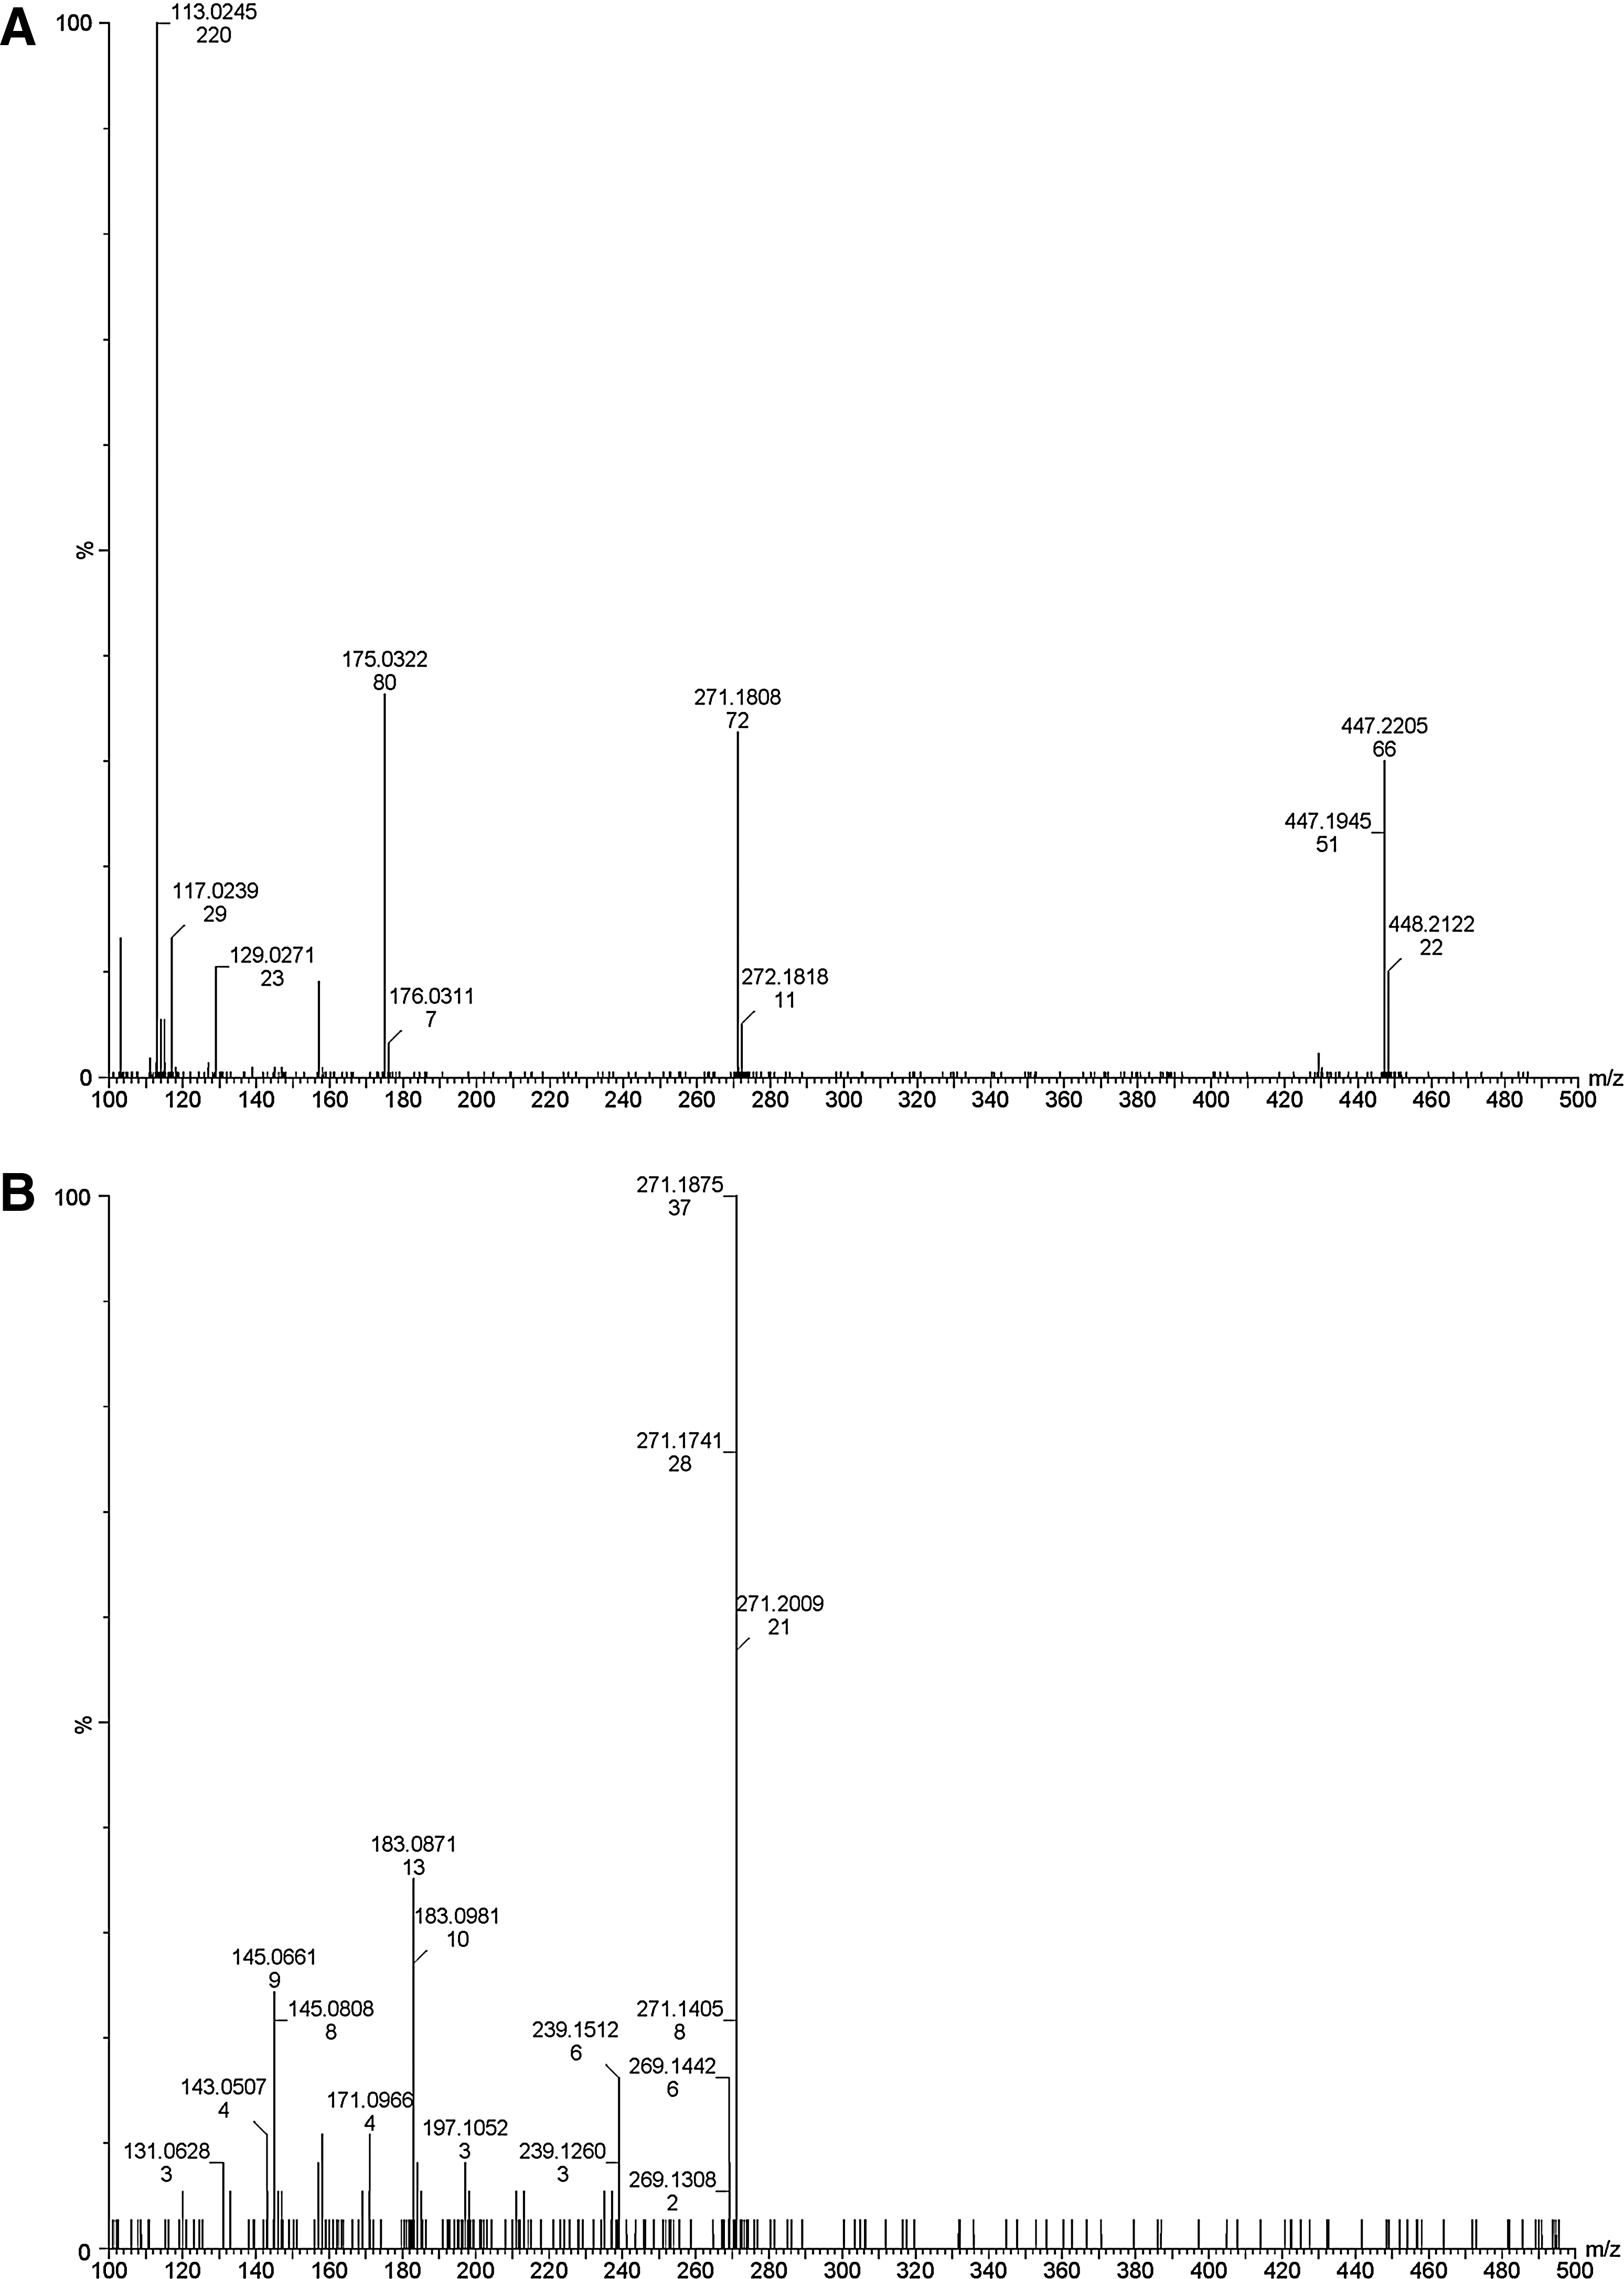
Mass spectral analyses of the HPLC fractions collected for the peaks eluting at 5.2, 27.4, and 29.9 min, respectively, from an aqueous aliquot of the soil–water batch experiment, confirming the spectra of
Speciation in aqueous and sorbed phases
Table 1 presents the aqueous- and sorbed-phase speciation of E2-3G and its metabolites, E2 and E1, at 4 and 24 h. The presence of E2 demonstrated the deconjugation of E2-3G by the hydrolyzing enzyme β-glucuronidase (Khanal et al., 2006), which is ubiquitous in natural soils. The presence of E1 indicated its formation by the biotic and/or abiotic oxidation of E2 (Colucci et al., 2001; Sheng et al., 2009). Even though the detection of the transient metabolite at 8.4 min was not included in the scope of the present study, verification of the known metabolites and detection of unknown metabolites are some of the highlights of the radioassay-based approach. Some scattered radioactivity (X) was also observed in the reversibly sorbed phase, but they did not produce any pattern with discernible peaks and were not considered for further analysis except in the total reversibly sorbed phase (Fig. 4).

Mass balance of [14C] in aqueous, reversibly sorbed, and irreversibly sorbed compartments in the soil–water batch system along with total recovery. Recovery is shown as a percentage-normalized concentration (C/C0). Scale of X-axis has been adjusted to highlight the changes in early time points.
The values are shown as normalized concentration (C/C0).
E2-3G, 17β-estradiol-3-glucuronide; E2, 17β-estradiol; E1, estrone.
The LOD was defined as three times the standard deviation of the background noise and calculated by counting HPLC fractions of the blank vials (containing only soil and nanopure water) in the LSC. The LOD was 39±5.5 μg/L for E2-3G and 24±3.3 μg/L for E2 and E1 in the aqueous phase. The sorbed phase LODs were 3±0.4 μg/kg for E2-3G and 2±0.3 μg/kg for E2, and E1, respectively. No method detection limit was determined for the combustion process or headspace samples.
Since no quantitative information was derived from the HPLC chromatograms, no calibration or validation studies for the HPLC were performed. However, as a quality control, the standards containing radiolabeled E2-3G, E2, and E1 were run daily.
Mass balance
The mass balances based on radioactivity in the combined aqueous, reversibly sorbed, and irreversibly sorbed fractions produced excellent results, ranging from 99.0% to 114.1% of the spiked amount (Fig. 4). Headspace analysis showed insignificant mineralization (<4 ng of CH4; radioactivity<background radioactivity). Such an excellent mass balance increased the confidence that all major fate and transformation pathways of the estrogen conjugate were adequately accounted for in the simple analytical approaches presented in this study. Quantification of the metabolite distribution among different phases as well as the ability to achieve high mass balance are some of the strengths of the radioassay-based approach.
Conclusions
A simple, robust, and reliable approach to study the fate of an estrogen conjugate and its metabolites in a laboratory setting was presented. Similar studies with other estrogens and in different environmental matrices, such as sediment and manure, can be easily conceived utilizing the present approach. Adequate resolution was achieved that was required for the identification and quantification of metabolites in both the aqueous phase and reversibly sorbed extracts of soil. A relatively high concentration of E2-3G, compared to levels detected in the environment, was required in this study due to radiochemical specific activity considerations, to ensure detection of the study compound and its metabolites, as they undergo different biogeochemical processes. The initial concentration of 3.7 μg/mL, yielding ∼381 Bq/mL with the specific activity used in this study, provided sufficient sensitivity and resolution to discern metabolites in the various fate compartments of the soil. Using higher concentrations could, however, mask concentration-dependent processes if processes such as rate-limited enzymatic hydrolysis were to occur. Both E2-3G and all metabolites were separated in a single run, offering the versatility of simultaneous monitoring of all the compounds at detection limits suitable for fate and transformation studies. Use of LC-MS/MS was optional and used only to further verify the peaks of E2-3G, E2, and E1. By not requiring a hydrolysis step before separation by HPLC, significant experimental time was saved; levels of all species could be analyzed simultaneously; separate HPLC mobile phases for conjugates and free estrogens were not required; and LSC could be used as a simple and reliable quantification tool. In conclusion, the combination of HPLC and LSC allowed the direct measurement of the fortified radiochemical in all compartments with an excellent mass balance, and made the characterization of metabolites a relatively easy and inexpensive process. In studies where commercial standards for metabolites are not available, characterization will be additional steps, with the use of tandem mass spectrometry and other characterization tools.
Footnotes
Acknowledgments
We thank Dr. David Smith (USDA-ARS) for making available his laboratory for this research and also providing his valuable suggestions. We also thank Colleen Pfaff, Dee Anne Ellig, Barb Magelky, Mike Giddings, Grant Harrington, Jason Holthusen (USDA-ARS), and Nathan Derby (Soil Science Department, North Dakota State University) for their support in the laboratory work and Glenn Wittenberg (USDA-ARS) for his IT support. This research was based upon work supported by the USDA-NIFA through an AFRI Competative Grant (No. 2010-65102-204000).
Author Disclosure Statement
No competing financial interests exist.