
Abstract
Abstract
This work describes the successful coupling of partial nitrification (nitritation) and anaerobic ammonium oxidation in a membrane-aerated biofilm reactor (MABR) with continuous aeration. Controlling the relative surface loadings of oxygen versus ammonium prevented complete nitrite oxidation and allowed anaerobic ammonium-oxidizing bacteria (AnaerAOB) to develop and be retained for >250 days. Daily autotrophic nitrogen removal of 1.7 g N/m2 (75% of influent N load) was achieved at an oxygen/nitrogen surface loading ratio of 2.2, with up to 85% of the influent N proceeding through AnaerAOB. During early nitritation, nitrogen oxide (NO(g), NO2(g), and N2O(g)) emissions comprised up to 10% of the removed influent nitrogen, but emissions disappeared after proliferation of AnaerAOB. Microbial communities were radially stratified, with aerobic ammonium-oxidizing bacteria (AerAOB) colonizing nearest to and AnaerAOB furthest from the membrane. Despite the presence of nitrite-oxidizing bacteria, this work demonstrated that these autotrophic processes can be successfully coupled in an MABR with continuous aeration, achieving the benefits of competitive specific N removal rates and the elimination of gaseous nitrogen oxide emissions.
Introduction
Alternatively, nitrite oxidation can be minimized in conventional co-diffusion biofilms by establishing low dissolved oxygen (DO) and/or elevated temperature conditions (Picioreanu et al., 1997; Helmer et al., 2001; Pynaert et al., 2004; Furukawa et al., 2006). Unfortunately, because co-diffusion biofilms provide the electron donor and acceptor from the same phase (liquid), it can be difficult to completely decouple the loadings of these two substrates, thus limiting optimization of oxygen transfer efficiency and overall N removal.
Membrane-aerated biofilm reactors (MABRs) offer counter-diffusion delivery of electron donor and acceptor, allowing independent control of each as well as a high transfer efficiency, high substrate utilization rates, reduced volatile organic compound emission due to bubbleless oxygenation, and redox stratification of the biofilm (Ahmed and Semmens, 1992; Brindle and Stephenson, 1996; Schramm et al., 2000; Terada et al., 2003, 2007; Cole et al., 2004). MABRs have been successfully applied for treatment of carbonaceous wastewaters (Cole et al., 2004; LaPara et al., 2006), nitrification (Hibiya et al., 2000; Terada et al., 2006), and total nitrogen removal (Hibiya et al., 2003; Terada et al., 2003; Pellicer-Nacher et al., 2010). Stable nitritation has been established in continuously aerated MABRs for short durations (<60 days; Terada et al., 2004; Downing and Nerenberg, 2008). Nitritation and anaerobic ammonium oxidation have also been coupled in a completely autotrophic MABR by artificially distributing the inoculum biomass using an external biofilm support skeleton (Gong et al., 2007, 2008). Approaches proposed for controlling NOB in counter-diffusion MABRs include controlling the oxygen to ammonium flux ratio (Bernet et al., 2005; Terada et al., 2007; Lackner et al., 2008) and the DO concentration at the membrane–biofilm interface (Downing and Nerenberg, 2008). Recently, successful autotrophic N removal efficiencies up to 72% were obtained in an intermittently aerated MABR, leading to repression of NOB and emergence of AnaerAOB (Pellicer-Nacher et al., 2010), although NOB were not completely eliminated. However, to date, no reports exist on the stable and long-term coexistence of these two metabolic groups of AerAOB and AnaerAOB in biofilms grown de novo in continuously aerated MABRs.
A consequence of low DO concentrations in N removal processes is autotrophic denitrification of nitrite (
The present study examined the capability of a continuously aerated MABR to achieve stable nitritation coupled with anaerobic ammonium oxidation while treating a synthetic high-strength nitrogenous wastewater. Performance was related to oxygen and ammonium loadings at a low membrane–biofilm interface DO concentration (<1.0 mg/L) to achieve desired metabolic outcomes. Nitrogen mass balances were performed to examine the fate of influent nitrogen, and the production of gaseous oxides of nitrogen is quantified. Finally, spatial distribution of AerAOB, NOB, and AnaerAOB microbial populations was examined.
Methods
Reactor configuration
The MABR was modeled after Rector et al. (2004) without rotation of the membrane module (Supplementary Fig. S1 and Supplementary Table S1). The 98 fibers were Silastic polydimethylsiloxane laboratory tubing (Dow Corning 508-009), 3.18 mm outer diameter, 1.98 mm inner diameter, potted in chlorinated polyvinyl chloride end caps, and were operated in an open-ended, flow-through configuration. The specific membrane (outer) surface area was 0.715 cm2/cm3 of reactor vessel volume. The vertical reactor was 9.4 cm diameter and 63 cm in height. Temperature was controlled at 30°C. Liquid flow was recycled at a constant rate equivalent to 200 reactor volumes per day to minimize boundary layer resistance. Inlet aeration gas (either air or 80% argon/20% oxygen) was controlled at 0.013 m3 per day by a mass flow controller (Aalborg GFC-17). Lumen pressure was maintained by a backpressure needle valve. Bulk liquid DO was monitored by an Orion Model 97-08 oxygen electrode (Thermo Fisher Scientific) inserted into a flow cell. pH was automatically controlled with sodium carbonate to typically between 7.0 and 7.6. Additional details regarding the reactor are described in the Supplementary Data and elsewhere (Gilmore et al., 2009).
Biomass
The reactor was inoculated only once, at startup, with 1 g of biomass from two sources: (1) 0.66 g from a nitrifying activated sludge acclimated to intermittent aeration for 9 days at 30°C and (2) 0.34 g from a mixture of two seed sludge sources taken from a lab-scale bioreactor performing oxygen-limited autotrophic nitrification and denitrification (OLAND; Courtesy of W. Verstraete, Ghent, Belgium) and a full-scale plant achieving anaerobic ammonium oxidation (Courtesy of B. Wett, Strass, Austria).
Reactor operation
The MABR was operated for 555 days treating an organic carbon-free synthetic wastewater designed to mimic the nitrogenous component resulting from source separation or a confined human operation such as a long-term space exploration mission: 47.1 mM NH3-N (added as NH4HCO3), 14.3 mM NaCl, 3.7 mM KHCO3, 0.8 mM KHSO4, 1.25 mM KH2PO4, 0.83 mM MgSO4, 1.23 mM CaCl2, and 0.11 mM FeCl2, in distilled water (Smith et al., 2008).* To investigate the hypothesis that a completely autotrophic system could be developed in this configuration, organic carbon was not included in the feed, which is an approach used by others (Smith et al., 2008). This also facilitated as detailed nitrogen balancing as possible with minimal contribution of heterotrophic organisms. Average substrate loadings for each phase of operation are described in Table 1.
Argon:O2=80% argon, 20% O2.
Oxygen surface load calculated as maximum imposed oxygen flux across membrane into biofilm, LO2(max)=K (C*−Cbiofilm base), where Cbiofilm base=0 mg/L and K=9.17×10⁻⁴ cm/s (Gilmore et al., 2009), and gas-phase oxygen concentration was the average of inlet and outlet concentrations.
LNH4+ is based on ammonium-N loaded to the reactor.
Calculation of loading rates and fluxes of oxygen and nitrogen
The oxygen surface loading was defined as the maximum potential flux of oxygen across the membrane into the biofilm using a biofilm base DO concentration of 0 mg/L (LO2=K [C*]; Pellicer-Nacher et al., 2010). The mass transfer coefficient was 9.17×10⁻⁴ cm/s and was independent of lumen pressure and velocity in the range of lumen pressures relevant to the present work (Gilmore et al., 2009). The gas phase oxygen concentration (y) was shown by outlet gas measurements and by a mechanistic oxygen transfer model to be nonuniform along the length of the fiber, with the outlet oxygen concentration equal to ∼45% of the inlet gas concentration (Gilmore et al., 2009). Therefore, a linear average concentration was used in the oxygen surface load calculation [yinlet+(0.45×yinlet)]/2. The nitrogen surface loading (LNH4) was based on inlet mass flow rate divided by the membrane outer surface area.
Nitrogen mass balancing and metabolic pathway determination
Mass balance equations and reaction stoichiometry were used to determine the fate of nitrogen and oxygen utilized by AerAOB, NOB, and AnaerAOB. Two possible conditions were evaluated: Condition 1 assumed that all oxygen goes to either ammonium oxidation by AerAOB or nitrite oxidation by NOB, and excess
Biofilm sectioning for fluorescence in situ hybridization
MABR biofilm was fixed in situ (in the reactor vessel while still attached to the membranes) for analysis by fluorescence in situ hybridization (FISH). Additional details regarding the fixation, cryosectioning, hybridizations, and imaging of biofilm sections for thickness measurements and FISH are provided in the Supplementary Data (Section 3).
Oxygen microsensor measurements
Oxygen profiles were performed on days 204 and 458 using an OX-10 Clark-type oxygen microsensor (Unisense) with a specified nominal tip diameter between 8 and 12 μm. Calibrations and profiling were performed as described elsewhere (Gilmore et al., 2009).
Analytical methods
Duplicate or triplicate samples for soluble analyses were filtered through 0.45 μm nitrocellulose membrane filters. As available, all analyses were performed in accordance with procedures outlined in Standard Methods for the Examination of Water and Wastewater (APHA et al., 1998). Analytical methods for nitrogen species are described in the Supplementary Data (Section 4).
Results and Discussion
Controlling loading rates of oxygen and nitrogen allows control of NOB long enough to establish an active AnaerAOB population
Performance was categorized into four phases as described below and shown in Fig. 1 and Table 1.

Reactor performance. Soluble nitrogen species in reactor effluent over the duration of operation. Nitrogen in the feed was composed entirely of ammonium. Roman numerals correspond to phases of operation. Data points circled reflect
Phase I, days 0–23, startup
Establishment of nitritation during Phase I at 0.83 g
Phase II, days 24–92, nitritation
Predominantly, nitritation was achieved from days 24–70 at a loading of 1.57 g
Phase III, days 93–297, nitritation and partial nitrite oxidation
On day 92, lumen pressure was reduced to 34 kPa (5 psig), resulting in rapid stabilization of effluent oxidized nitrogen. On day 108, a load increase to 2.35 g
Phase IV, days 298–550, nitritation + anaerobic ammonium oxidation
Between days 287 and 298, concentrations of
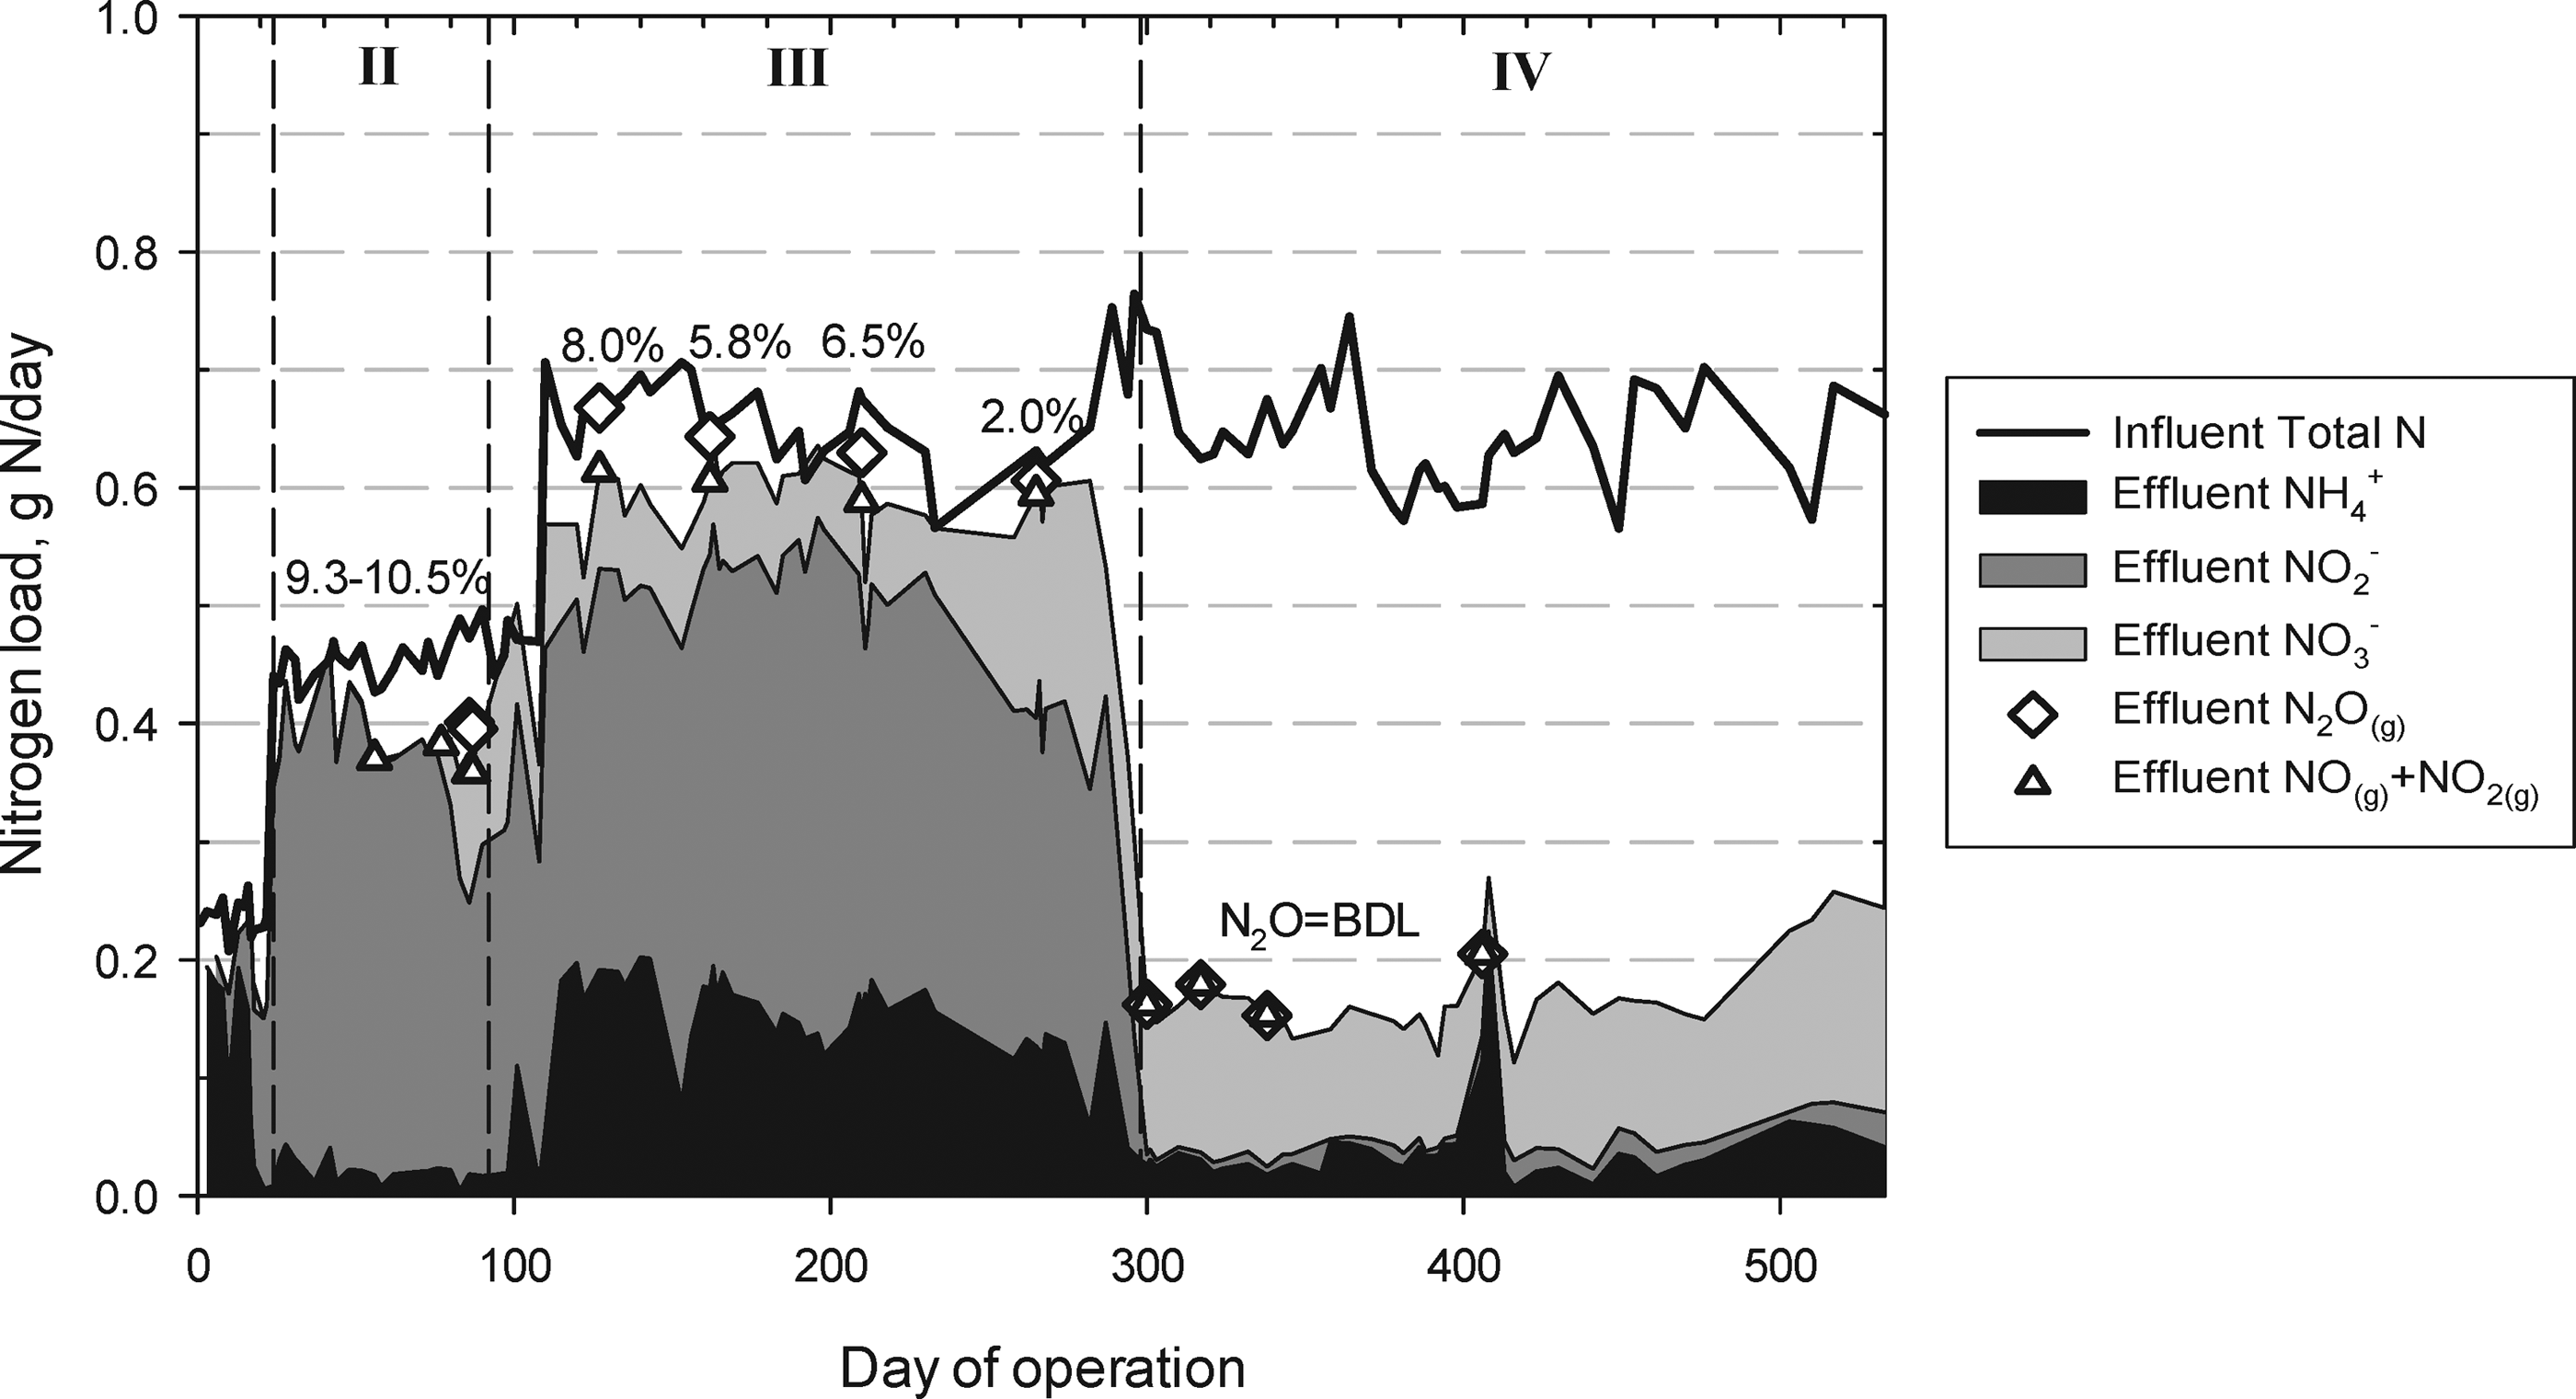
Aqueous and gaseous effluent nitrogen speciation (cumulative) from N balances. Influent contained only
The ratio of oxygen flux to ammonium flux into the biofilm has been shown through modeling and experimental studies to be a potential control parameter for achieving partial nitritation (Bernet et al., 2005; Matsumoto et al., 2007; Terada et al., 2007). However, substrate fluxes themselves are not directly controllable but rather they are a function of mass loads, reactor hydrodynamics, and especially biokinetics. In contrast, recent work (Pellicer-Nacher et al., 2010) has shown that the ratio of oxygen surface loading relative to ammonium surface loading can be an effective practical parameter for controlling MABR performance. Table 1 shows that this substrate loading ratio tracks well with performance during the discrete phases of operation. While the Phase IV LO2/LNH4+ was greater than theoretical reaction stoichiometries proposed by others of 1.75 g O2/g
A mass balance of N species was performed during Phase IV to corroborate the apparent achievement of nitritation coupled with anaerobic ammonium oxidation (Supplementary Data, Section 2). The contribution of heterotrophic denitrifiers could not be determined; however, it was calculated that between 82% and 85% of the influent nitrogen proceeded through anaerobic ammonium oxidation (defined as
Prior work (Pellicer-Nacher et al., 2010) has shown slightly lower NOB activity in an MABR with sequential aeration (
Coupling anaerobic ammonium oxidation with low-DO nitritation eliminates N-oxide emissions
Figure 2 illustrates cumulative effluent nitrogen speciation (excluding N2(gas)) relative to the influent N loading. Biomass N was calculated to be negligible (<1% of the daily total influent N). Early in the study, NOx(g) and N2O(g) contribution to the N balances was significant, however, with NOx(g) and N2O(g) concentrations averaging 56 ppmv (n=5) and 2,540 ppmv (n=6), respectively. Short-term operational changes did not result in emission reductions that could be attributed to biological mechanisms (Supplementary Data, Section 5).
The shift toward anaerobic ammonium oxidation was accompanied by a remarkable decrease in gaseous emissions (Fig. 2). NO(g) and NO2(g) fell to below 7 ppmv each following day 300, and N2O(g) fell below the detection limit of 100 ppmv. Thus, when AnaerAOB activity was established in the system, N-oxide emissions were essentially eliminated.
It is likely that the NO(g) and N2O(g) in this study were attributable to nitrite reduction by AerAOB. Emissions were present only in the first 300 days of the study and highest at day 127, when AerAOB dominated the reactor. Further, high
DO microsensor profiles on day 204 (Gilmore et al., 2009) and day 458 (Supplementary Data, Section 6) revealed a microaerobic region extending at most 90 μm from the membrane, with membrane surface DO concentrations ranging from 0.80 mg/L at Port 1 to 0.20–0.40 mg/L at Ports 2–4. This limited oxygen penetration into the biofilm was lower than comparable studies with continuous aeration (Schramm et al., 2000; Terada et al., 2003). The low DO concentrations (<1.0 mg/L) measured at the base of the biofilm in this study are near the oxygen half-saturation coefficient values reported for AerAOB and NOB, and may have contributed to the successful outcompetition of NOB by AerAOB. Other studies (Fux et al., 2004; Downing and Nerenberg, 2008) have also found that lowering DO generally favored AerAOB over NOB.
Low-DO microenvironments generate radial stratification of microbial communities in the biofilm
Interrogation of the microbial community in the radial direction revealed clear patterns. AerAOB predominated near the membrane, either in microcolonies or in striated bands (NEU; Fig. 3A, B). These near-membrane AerAOB were dominated by the halophilic and halotolerant Nitrosomonas europaea/Nitrosomonas eutropha lineage as evidenced by hybridization with NEU (Fig. 3B). In some biofilm sections, a second group of AerAOB was observed further from the membrane (Fig. 3C, cyan), which hybridized with Nmo218/Cluster 6a192 probe mixture, indicating homology with the Nitrosomonas oligotropha lineage. Nitrosospira sp. (probe Nsv443) was not detected. Data on the concentration of ammonium within the biofilm were not collected (i.e., via microsensors). However, throughout the study, bulk liquid ammonium concentrations exceeded reported KNH4 values for the AerAOB studied here (Martens-Habbena et al., 2009), a condition that may have provided the halophilic and halotolerant Nitrosomonas spp. with an advantage.

Micrographs of biofilm sections at the end of operation, subjected to different 16S rRNA–targeted fluorescent probe combinations.
As suggested by reactor performance, NOB were detected and were most often of the Nitrospira lineage, and Nitrobacter-like NOB were sparsely detected in some samples (signals with NIT3). Nitrospira microcolonies were located near the membrane (Nspra662; Fig. 3G, cyan) and were often in close proximity to microcolonies of AerAOB (Nso190; Fig. 3H, magenta), although some differences were observed based on axial sample location.
Prior work has demonstrated that the composition of the biomass inoculum is significant in determining the ultimate microbial community (Terada et al., 2010). If r-strategist AerAOB were present in the inoculum, they colonized the membrane surface rapidly, deprived NOB of oxygen, and reduced the incidence of r-strategist NOB, such as Nitrobacter. In the MABR studied here, r-strategists dominated the AerAOB population, likely preventing prospective Nitrobacter from colonizing. However, a high-rate NOB community in the MABR was also suppressed by the low DO concentration at the membrane–biofilm interface (<1.0 mg/L), which favored K-strategist NOB Nitrospira over r-strategist Nitrobacter. Although work is needed to reproduce this outcome, early colonization by an r-strategist AerAOB and a low-DO biofilm base concentration may have contributed to a biofilm displaying good nitritation ultimately suitable for colonization by AnaerAOB.
Near the bulk liquid side of the biofilm, positive signals for Planctomycetales (Pla46; Fig. 3D, magenta) were examined with more specific probes for AnaerAOB groups: Amx820 and Kst157. A band of AnaerAOB clusters (Amx820; Fig. 3E, F, blue) was visible in the outer region of the biofilm near the anaerobic bulk liquid, while no substantial signal from Kst157 was observed (Fig. 3E, F, magenta). Thus, Brocadiaanammoxidans was the predominant AnaerAOB lineage present.
In contrast to MABR with sequential aeration (Pellicer-Nacher et al., 2010), in the MABR reported here, AnaerAOB were not as directly collocated with AerAOB, because continuous aeration did not provide anoxic time periods needed for AnaerAOB to grow near AerAOB. Instead, radial stratification of microbial populations across the biofilm was consistent with previous experimental and modeling studies (Terada et al., 2003; Lackner et al., 2008; Smith et al., 2008). In addition, the presence of heterotrophs was predicted by mass balances and performance (see previous Phase IV discussion and Supplementary Data, Section 2). It is possible that the regions of FISH micrographs containing nontarget organisms (differences between areas fluorescing green in Fig. 3G and no signal in Fig. 3H) may have contained heterotrophs, nontarget AerAOB and AnaerAOB, and ammonia-oxidizing archaea, or other communities. Prior computational modeling has predicted, between AerAOB and AnaerAOB layers, a middle region of heterotrophs feeding on biomass decay products (Lackner et al., 2008), although the identity of these nontarget communities could not be verified in the present study. This observation underscores the need to incorporate heterotrophic metabolisms in MABR models, even when considering predominantly nitrogenous wastewaters. As illustrated in the nitrogen balances, the contribution of heterotrophs to oxygen consumption and/or heterotrophic denitrification may be significant relative to the autotrophic communities present. The presence of AerAOB and NOB at significant distances from the membrane (Fig. 3A, C) was unexpected, as DO would be negligible in this region. The mechanisms that determine temporal changes in community locations are not clear, and further study could consider community analysis at different times over the life of the system to determine the nature of these dynamics.
Summary
This study demonstrates that a biofilm grown de novo with continuous aeration can couple nitritation and anaerobic ammonium oxidation in a single MABR. Sustained nitrogen removal from a synthetic wastewater free of organic carbon was achieved for an extended duration, using relative loading ratios of oxygen to nitrogen as the primary control parameter for outcompeting NOB. Removal rates of 1.7 g N/m2 daily membrane area (0.14 kg N/m3 daily reactor volume) were achieved, with up to 85% of the influent nitrogen proceeding through anaerobic ammonium oxidation. Because new wastewater solutions must be compatible with the greater goal of environmental sustainability, low-DO nitritation systems must mitigate the release of the greenhouse gas nitrous oxide. This work demonstrated that an important benefit of coupling these two autotrophic metabolisms in a single reactor is a disappearance of nitrogen oxide emissions.
Footnotes
Acknowledgments
Funding was provided by the National Aeronautics and Space Administration (NASA) grant to B.F.S. and N.G.L., and by a Danish Research Council grant to B.F.S.
Author Disclosure Statement
No competing financial interests exist.
*
Hummerick, M. (2005). Personal communication. Dynamac Corp., Kennedy Space Center, FL.
References
Supplementary Material
Please find the following supplemental material available below.
For Open Access articles published under a Creative Commons License, all supplemental material carries the same license as the article it is associated with.
For non-Open Access articles published, all supplemental material carries a non-exclusive license, and permission requests for re-use of supplemental material or any part of supplemental material shall be sent directly to the copyright owner as specified in the copyright notice associated with the article.