




Abstract
Abstract
Development of electrochemical generation of active chlorine (AC) was studied by circulating the electrolyte through an electrolytic cell. Beside electrolyte concentration and anode current density, circulation time and volume of circulated electrolyte were the main parameters of the process. Optimum electrolyte concentration and anode current density were found to be 40 g/L and 800 A/m2, respectively. The optimum circulation coefficient, which represents the ratio of circulated electrolyte volume to volume of the electrolytic cell, was in the range 14–18. Results showed that the maximum generation rate and minimum electricity consumption rate were reached after 40 min of circulation time when the optimum parameters were used. Temperature of the circulated electrolyte was monitored, and the effect of temperature change on AC generation was explored. Design of the electrolytic cell facilitates removal of scale that forms on the electrode surfaces by the passing electrolyte.
Introduction
In situ electrochemical generation of AC is safer and more cost effective than the centralized generation process (Kraft et al., 1999; Isa et al., 2009). The advantages of in situ electrochemical generation include the lack of requirement for transport or, storage; moreover, the oxidizing agents can be produced according to demand. In situ electrochemically generated oxidizing agents, mainly AC, also can be used for treatment of different wastes and for various industrial purposes. A novel treatment strategy for RO membrane concentrate using electrochemically generated oxidizing agents is proposed by Van Hegea et al. (2004). Electro-oxidation has been successfully implemented for the abatement of hard-to-treat wastes such as landfill leachate (Chiang et al., 1995; Wang et al., 2001), textile effluent (Vlyssides et al., 2000), and wastewater containing polyaromatic organic pollutants (Panizza et al., 2000).
In the electrochemical process, a direct current (DC) voltage is applied between electrodes, leading to electrolysis of the water. At the anode, the main product is oxygen, which is accompanied by an acidification of water in the vicinity of the anode as shown in Equation (1). At the cathode, hydrogen is formed as shown in Equation (2) (Kraft, 2008).
The efficiency of the electrochemical AC generation process is mainly based on the production of hypochlorite ions and/or hypochlorous acid from the oxidation of chloride ions in electrolyte. AC is produced at the anode in a side reaction to oxygen evolution. The following simplified reaction mechanism describes the process:
Hypochlorous acid and the hypochlorite anion stay in equilibrium as
The oxidation and disinfecting effect of AC are based on the release of atomic oxygen according to the following (Kraft, 2008).
Electrochemical generation of AC, with the use of sodium chloride solution as chloride bearing electrolyte, has been studied by many researchers (Gordon et al., 1987; Rajeshwar and Ibanez, 1997; Venczel et al., 1997; Kraft et al., 1999; Venkitanarayanan et al., 1999; Drogui et al., 2001; Al-Hamaiedeh, 2009; Isa et al., 2009). The results of the above-mentioned studies show that the amount of produced AC increases proportionally with the concentration of Cl− in the electrolyte and anode current density, but adversely with the electrolyte flow rate through the electrolytic cell. The efficient electrode materials were found to be the titanium-based anode and the stainless-steel cathode (Kraft, 2008; Isa et al., 2009).
Relatively high concentrations of AC can be produced from highly concentrated electrolytes. However, the use of highly concentrated electrolytes increases salt consumption. The concentrations of AC can be increased by circulating low-concentrated electrolytes through the electrolytic cell. Beside the anode current density and electrolyte concentration, the electrolyses or circulation time and the volume of the electrolyte to be circulated are the main parameters of the process. This research aims at the development of a new electrochemical AC generation method by circulating low-concentrated electrolytes through the electrolytic cell. The optimum parameters of the process, namely electrolyte concentration, anode current density, electrolyte volume, and electrolysis (circulation) time, will be explored.
Materials and Methods
Experiments were conducted using a laboratory setup as illustrated in Fig. 1. The cell was connected to a Franell AP (100 V, 90 A) rectifier. The electrolyte was pumped from vessel (1) by peristaltic pump (2) through cell (3) to vessel (1) again. Samples were collected in 20-min intervals in a glass tube bottle (6) to determine AC concentration; a continuous monitoring of the electrolyte temperature was achieved by a thermometer (5). The cell was made of a tubular vertical stainless-steel cathode with a diameter of 0.06 m and height of 0.08 m, bounded by two perforated plates from the upper and lower sides. A vertical granular tubular titanium anode coated with nickel oxide with a diameter of 0.0 4 m was welded to the lower plate coaxially with the tubular cathode. A stainless-steel rod with a diameter of 0.02 m acting as a second cathode was welded to the upper plate, passing inside the tubular anode. The cell was connected to a DC power supply through these plates; the upper plate supplied the cathodes, while the lower supplied the anode. The electrolyte entered the cell from an influent pipe through the lower perforated plate and leaves through the upper perforated plate to the effluent pipe Fig. 2. The work volume of the electrolytic cell was 0.232 L; anode surface area was 0.023 m2, and the distance between electrodes was 10 mm. A new design for the electrolytic cell to reduce the electrolytic scale formation will be developed. The design of electrolytic cell prevents scale formation on the electrode surfaces, and it is removed by the high circulation flow rate of electrolyte through the cell that developed by a peristaltic pump. The rate of AC generated from circulating constant electrolyte volume during a specified time interval was not affected by the electrolyte flow rate. This is because the time the electrolyte spent in the cell (detention time) was not affected by changing the flow rate of the circulated electrolyte. Large-scale cells with more electrolysis chambers can be manufactured using the same design by adding more coaxial anode and cathode tubes of different diameters and lengths. To determine the optimum electrolyte concentration, pure sodium chloride solutions of different concentrations 10, 20, 30, 40, and 50 g/L as NaCl were used as electrolytes. The experiments involved circulating each electrolyte through the electrolytic cell for up to 100 min using a fixed current density of 600 A/m2, and the same volume from each electrolyte. To determine the optimum anode current density, experiments were conducted using electrolytes of the same concentration and volume of 40 g/L and 0.825 L, respectively, while using anode current densities of 400, 600, 800, and 1000 A/m2. The optimum electrolyte volume to be circulated through the cell depends on the volume of the cell; therefore, the term circulation coefficient Kc, which represents the ratio of electrolyte volume to the volume of electrolytic cell, was introduced. To determine the optimum Kc value, experiments were conducted using an anode current density of 800 A/m2, a concentration of 40 g/L, and Kc values of 4.44, 8.9, 13.3, and 17.7, which are equivalent to volumes of 1, 2, 3, and 4 L respectively. The concentration of AC was determined, and electrolyte temperature T (°C) was recorded after every 20 min. The concentration of AC was measured using the DPD (N,N-diethyl-p-phenylenediamine) methods with a HACH DR-4000 spectrophotometer (HACH Co.). All experiments were duplicated, and the results were presented as mean values with deviations of <5%. The mass of AC (MAC) in grams was estimated as the product of AC concentration (CAC) and electrolyte volume. The generation rate of AC (G; g/h) and the rate of consumed electricity per kilogram of generated AC (P; kW·h/kg) have been calculated using the following formulas:
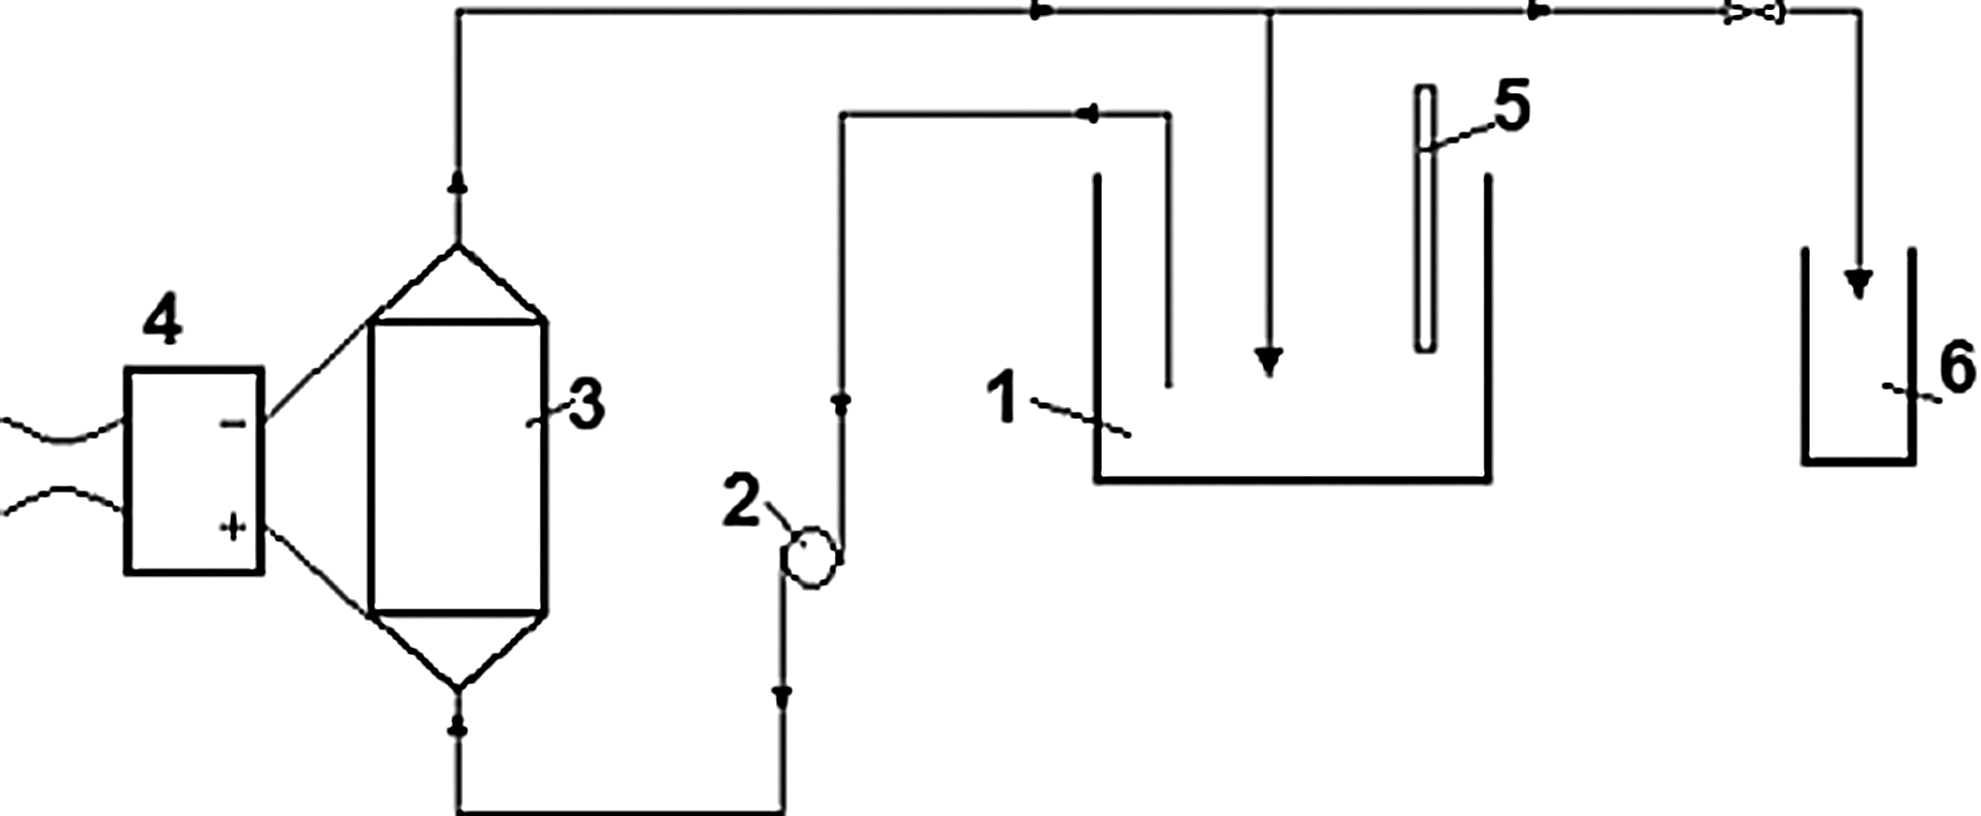
Laboratory setup. 1, electrolyte vessel; 2, peristaltic pump; 3, electrolytic cell; 4, rectifier; 5, thermometer; 6, sampling glass.
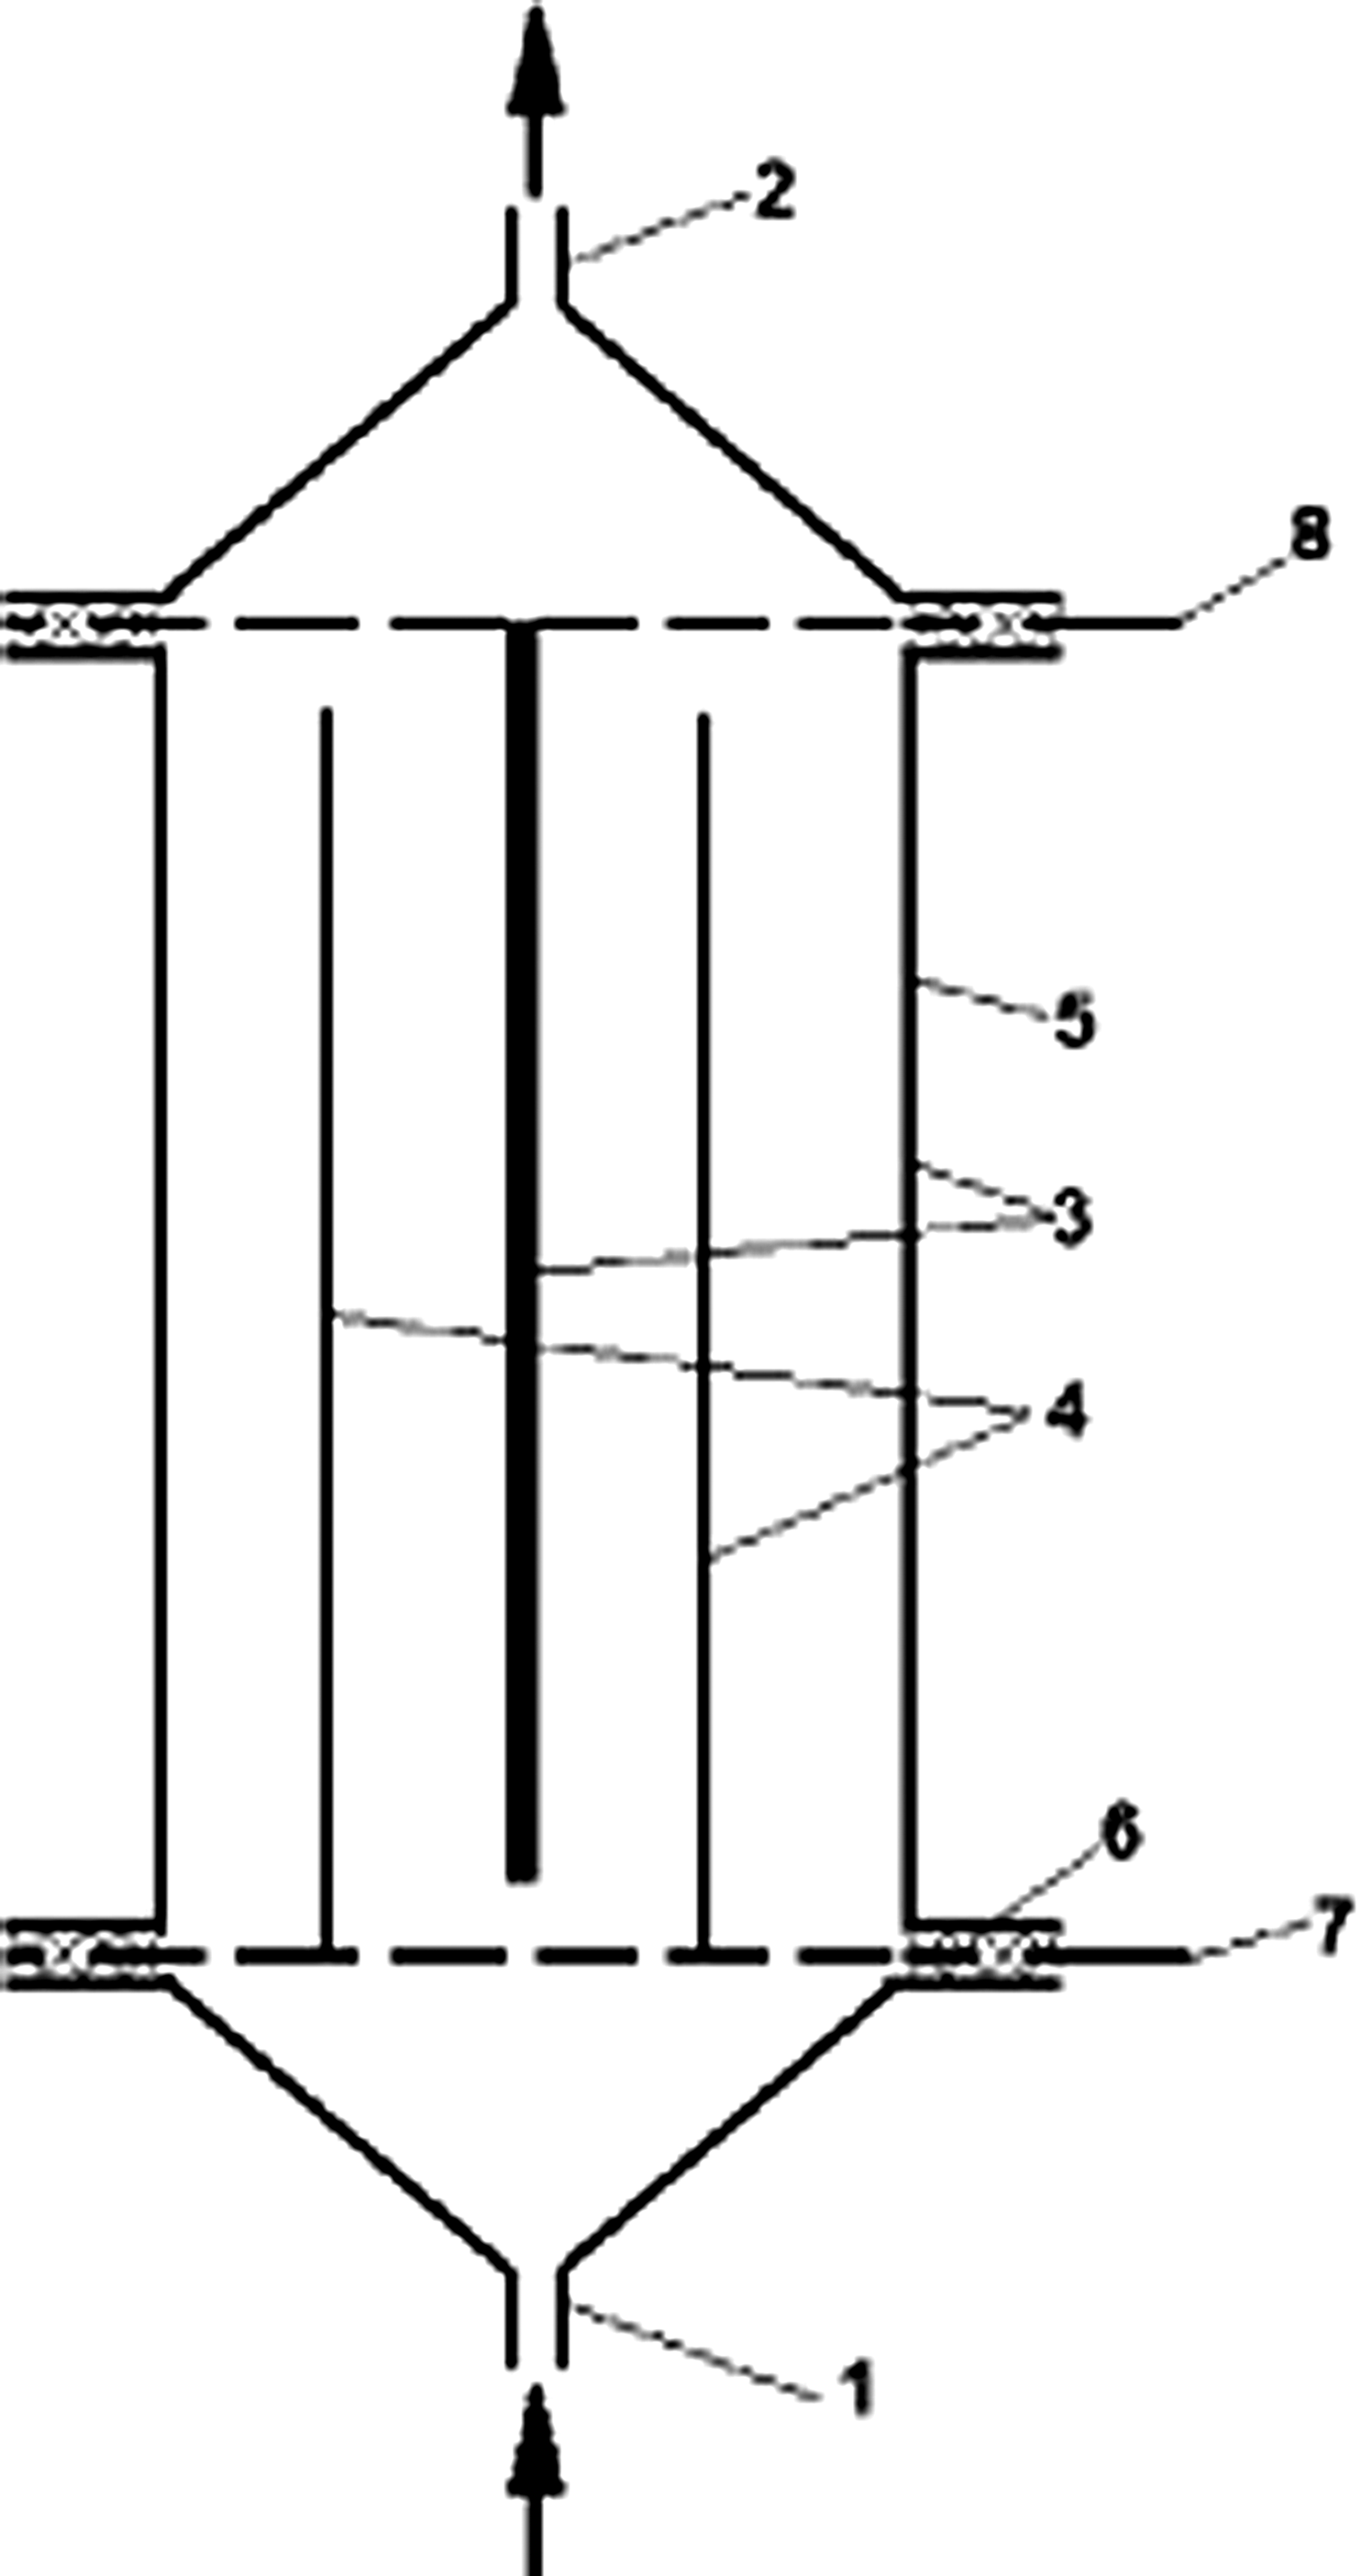
Electrolytic cell. 1, influent pipe; 2, effluent pipe; 3, cathodes; 4, anode; 5, cell external body; 6, isolation rubber; 7, anode connector to power supply; 8, cathode connector to power supply.
where t is circulation time (in hours), V is voltage between electrodes, and I is current (in A).
To maintain a constant anode current density of 800 A/m2, the voltage between electrodes was calibrated during electrolyses in the range of 5.6–7 V.
Results and Discussions
The concentration of the produced AC increases by increasing the concentration of NaCl in the electrolyte and circulation time as shown in Fig. 3. When electrolyte concentrations of 10, 20, and 30 g/L were used, the concentration of AC increased with time up to 50 min. Beyond 50 min, the concentration of AC did not increase with time. This occurred because the AC formation shown in Equations (3–5) approached AC oxidation to ClO3 as seen in Equation (9):

Effect of electrolyte concentration on the concentration of the generated active chlorine (AC).
When electrolyte concentrations of 40 and 50 g/L were used, the concentration of the produced AC continued to increase during a circulation time of up to 100 min. However, increasing electrolyte concentration from 40 to 50 g/L did not lead to an appreciable increase in the produced AC concentration. Therefore, the optimum electrolyte concentration can be considered to be 40 g/L. The results presented in Fig. 4 demonstrate that during a circulation period of up to 160 min, the higher anode current densities (from 400 to 800 A/m2), the higher the produced AC concentrations would be. The concentration of AC decreased after 35 min when the anode current density of 1000 A/m2 was used in comparison to the AC concentration produced at 800 A/m2. The decrease in AC concentration occurred due to intensive mixing of the electrolyte by the large amount of gases produced when the anode current density was 1000 A/m2. The intensive mixing increased the diffusion and oxidation of ClO− ions at the anode. As a result, the required time to reach the equilibrium between the formation and oxidation of AC decreased and thus reached after 35 min. Therefore, the optimum anode current density was considered to be 800 A/m2.

Effect of anode current density on the concentration of the generated AC.
Using the electrolyte concentration of 40 g/L and an anode current density of 800 A/m2, experiments were conducted to determine the optimum Kc value (electrolyte volume). During electrolyses, the concentration of the produced AC was determined after every 20 min as shown in Fig. 5. The results indicate that the lower the Kc value, the higher the concentration of the produced AC with time. After 20 min, the concentration of AC produced from electrolytes with low Kc values (4.44 and 8.9) reached 3.5 times of that produced from electrolytes with high Kc values (13.3 and 17.7) respectively. However, after 40 and 200 min, this value decreased to 2 and 1.9 times, respectively. This decrease occurred due to the rapid increase in the temperature of low-Kc-value electrolytes in comparison to electrolytes of higher Kc values as shown in Fig. 6. High temperature enhances the oxidation of ClO− and formation of ClO3, which is regarded as a byproduct (Al-Hamaiedeh, 2004).
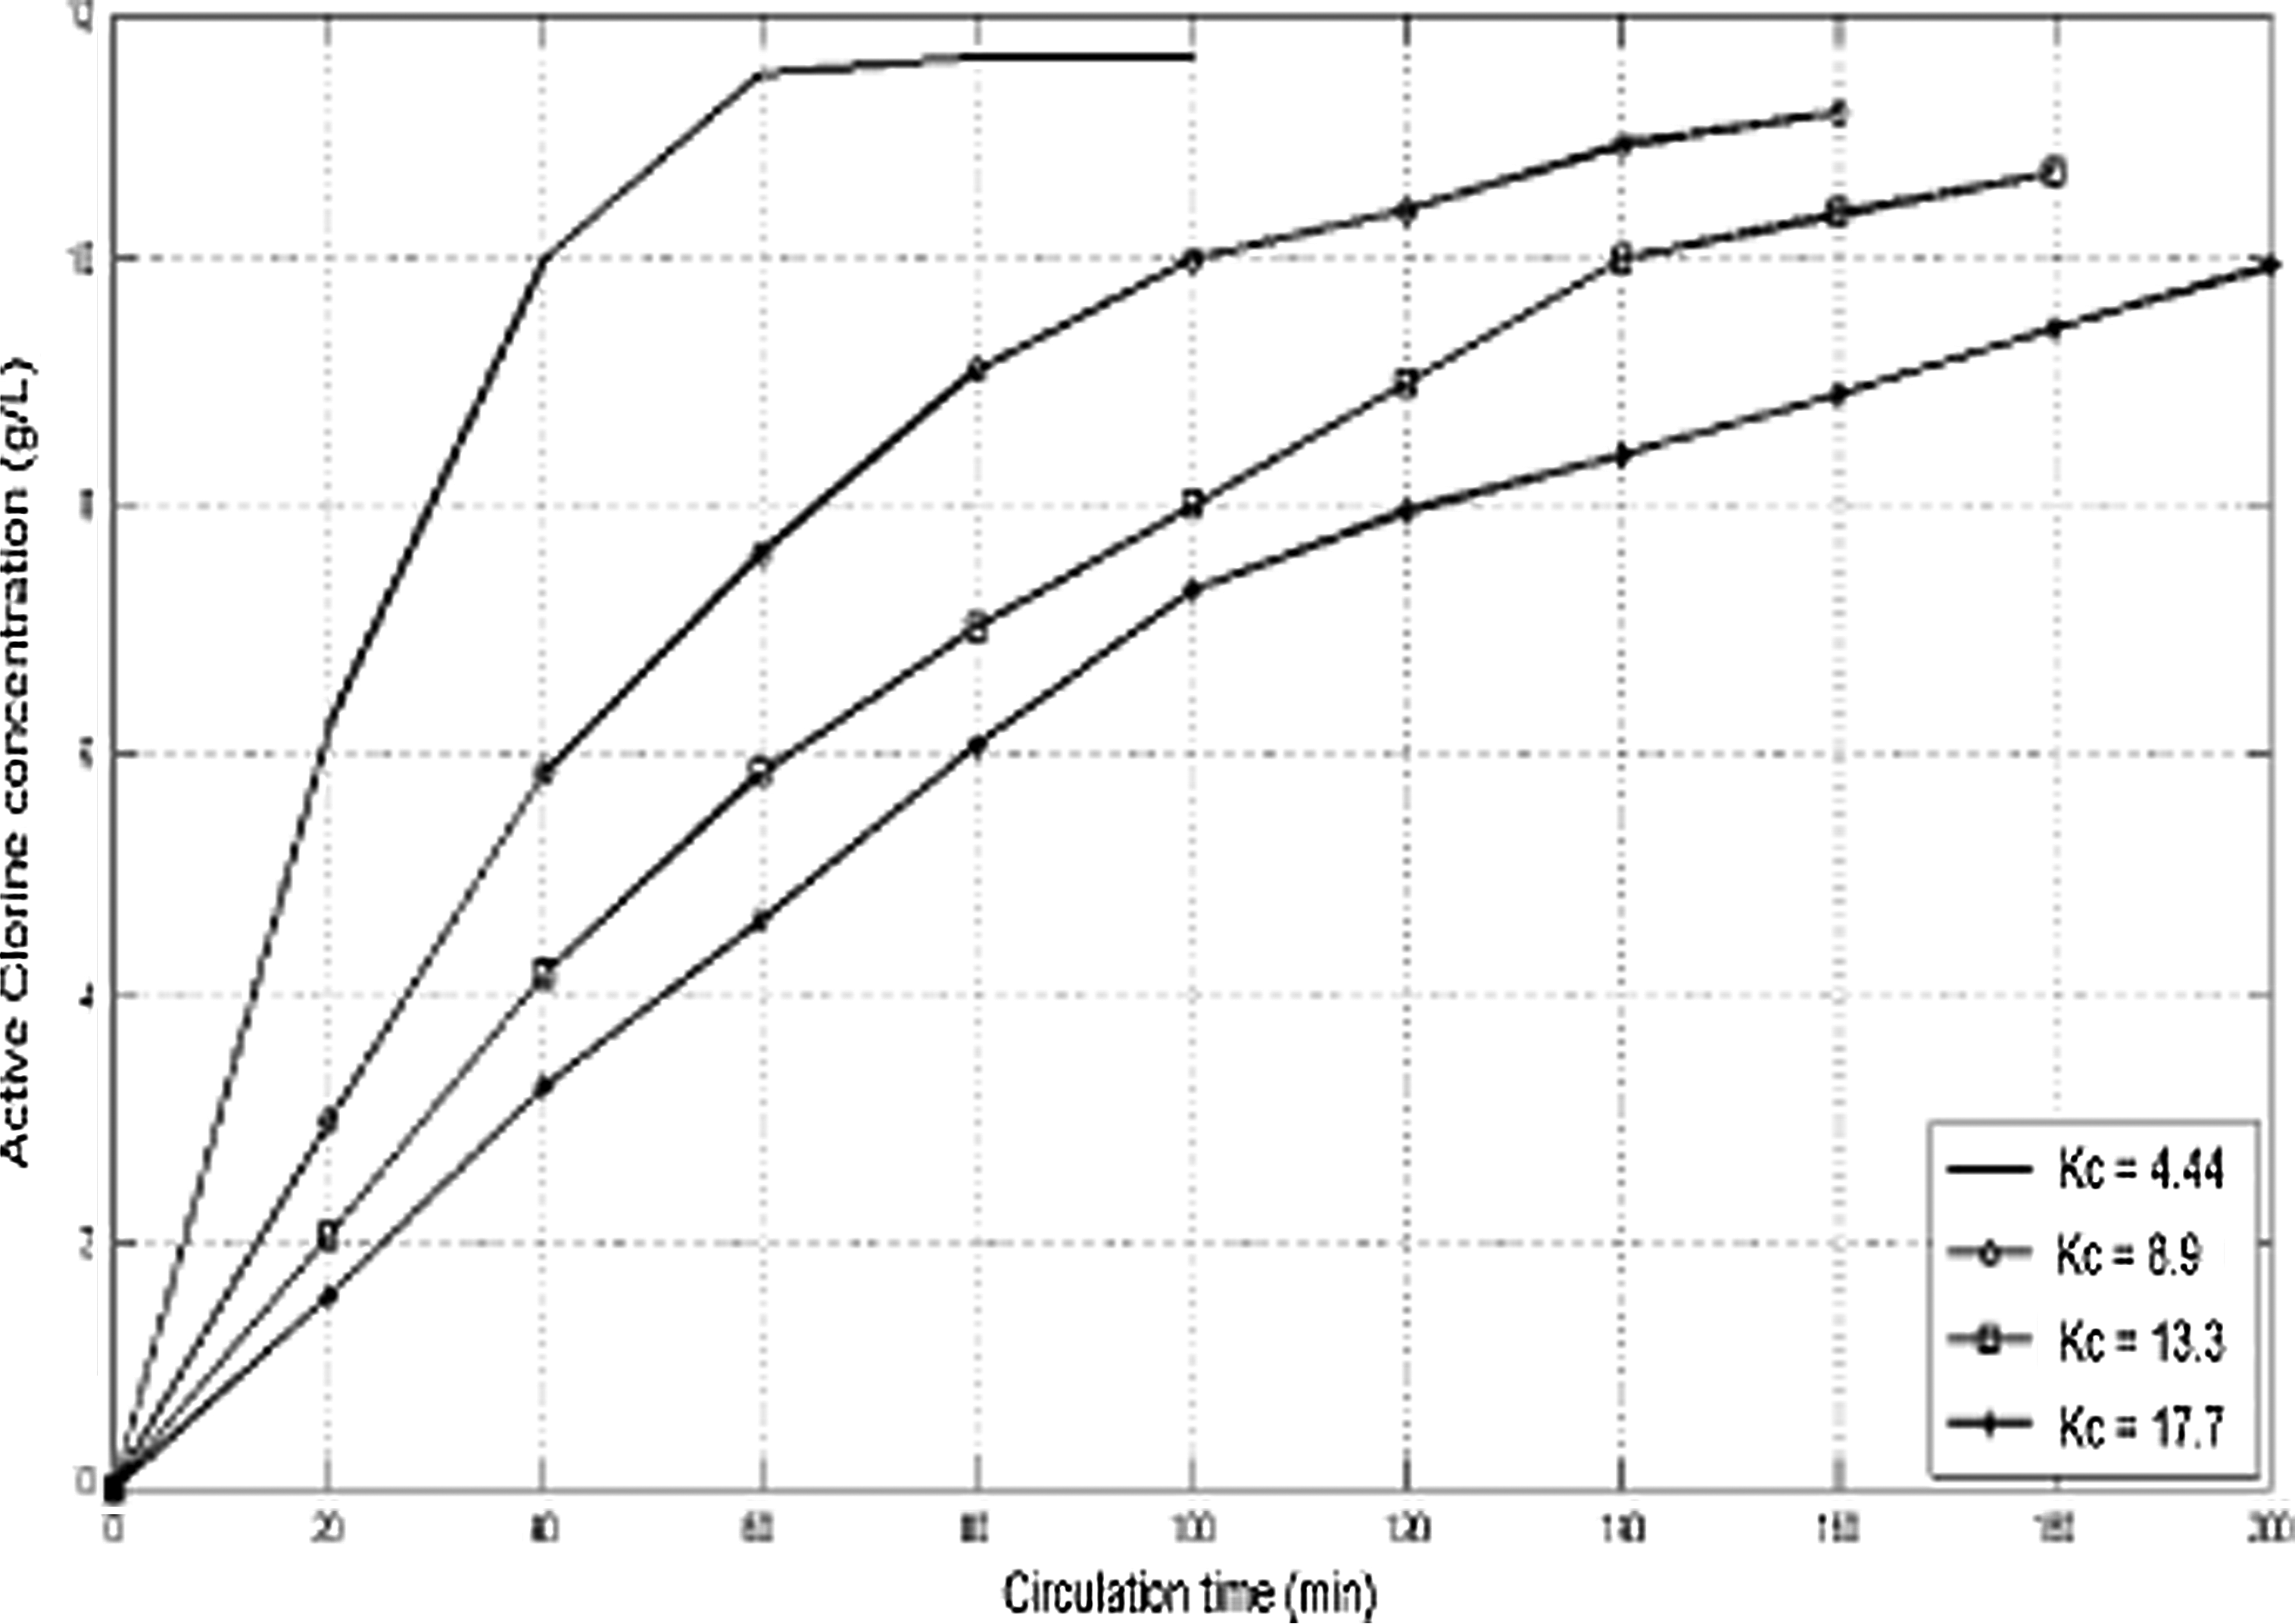
Effect of circulation coefficient on the concentration of the generated AC.
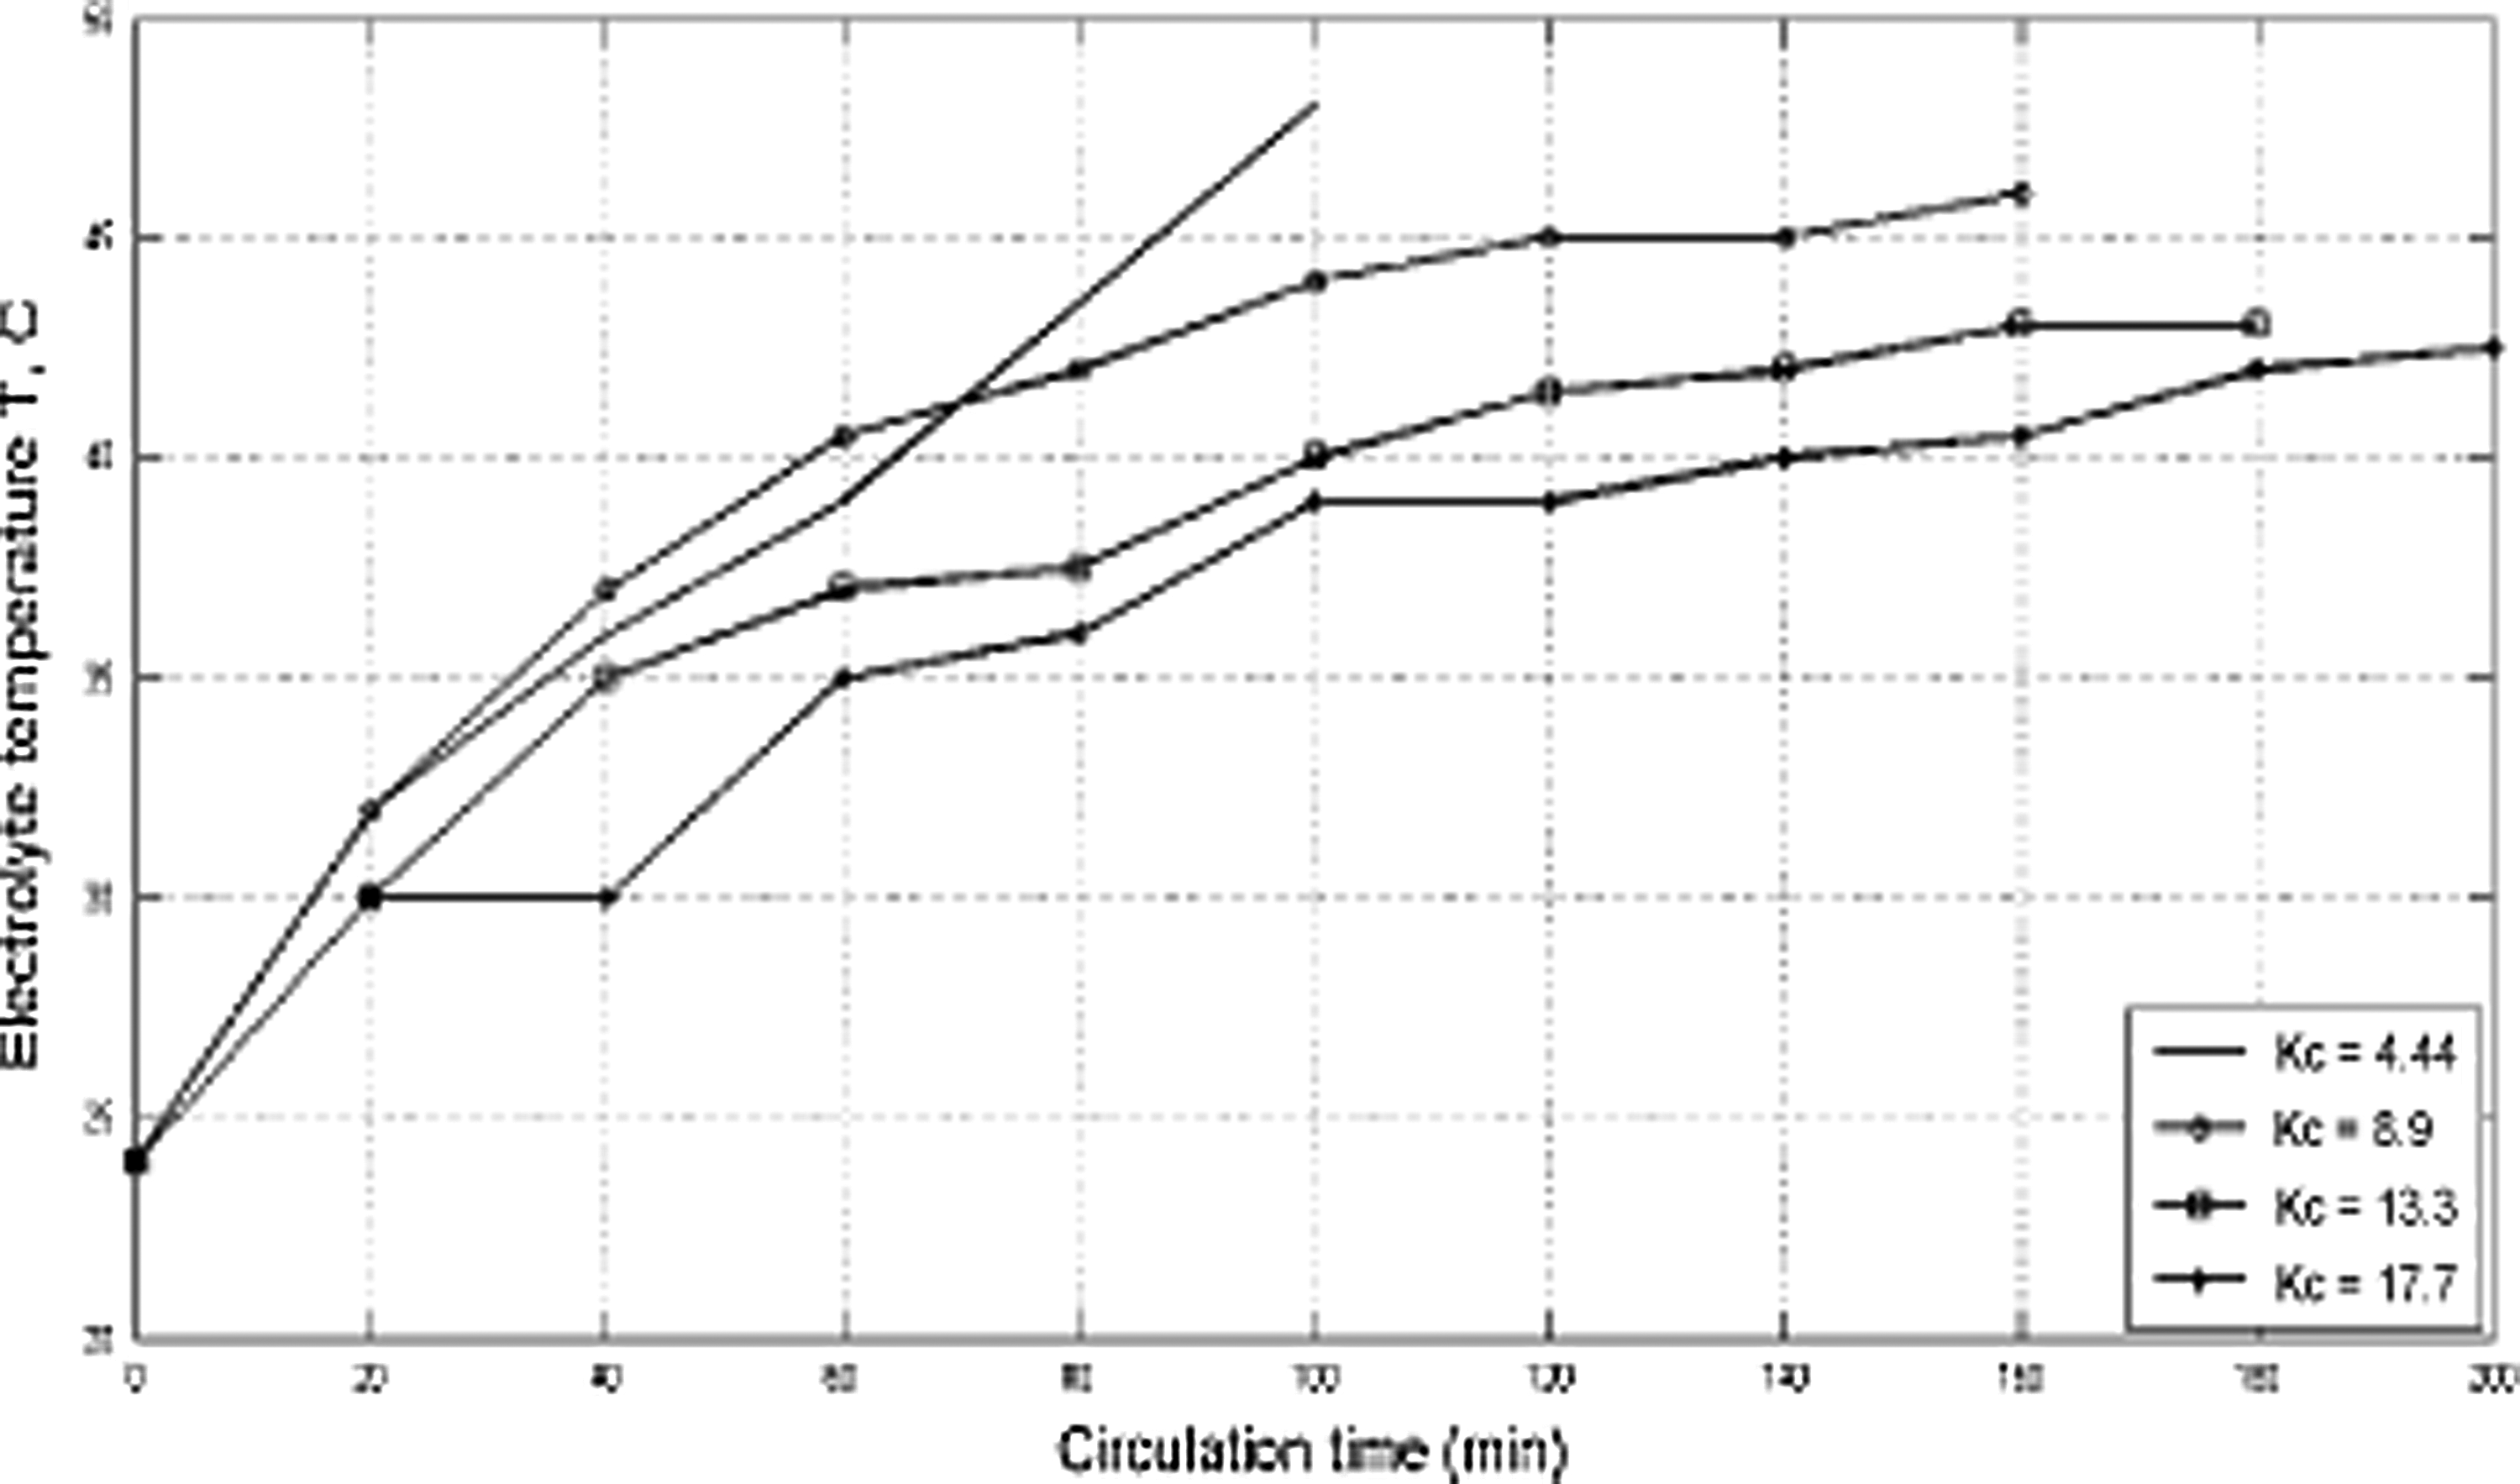
Change of electrolyte temperature by time for different circulation coefficients.
The results presented in Fig. 7 show that the calculated mass of the produced AC increased with time at the same rate for all Kc values for a circulation time of up to 20 min. Beyond 20 min, the rate of generated AC mass decreased with time. However, in electrolytes of low Kc value, the decrease is more appreciable. This occurred as a result of the increase in ClO− oxidation and reduction of chlorine solubility in the electrolyte due to an increase in temperature with time. Moreover, the available Cl− ions necessary to form AC in the electrolyte also decreased with time, especially when electrolytes of low Kc values were used. Therefore, the time required to establish the equilibrium between AC formation and reduction was about 60 and 100 min for Kc values 4.44 and 8.9, respectively, while it was 140 and 200 min for Kc values 13.3 and 17.7, respectively.
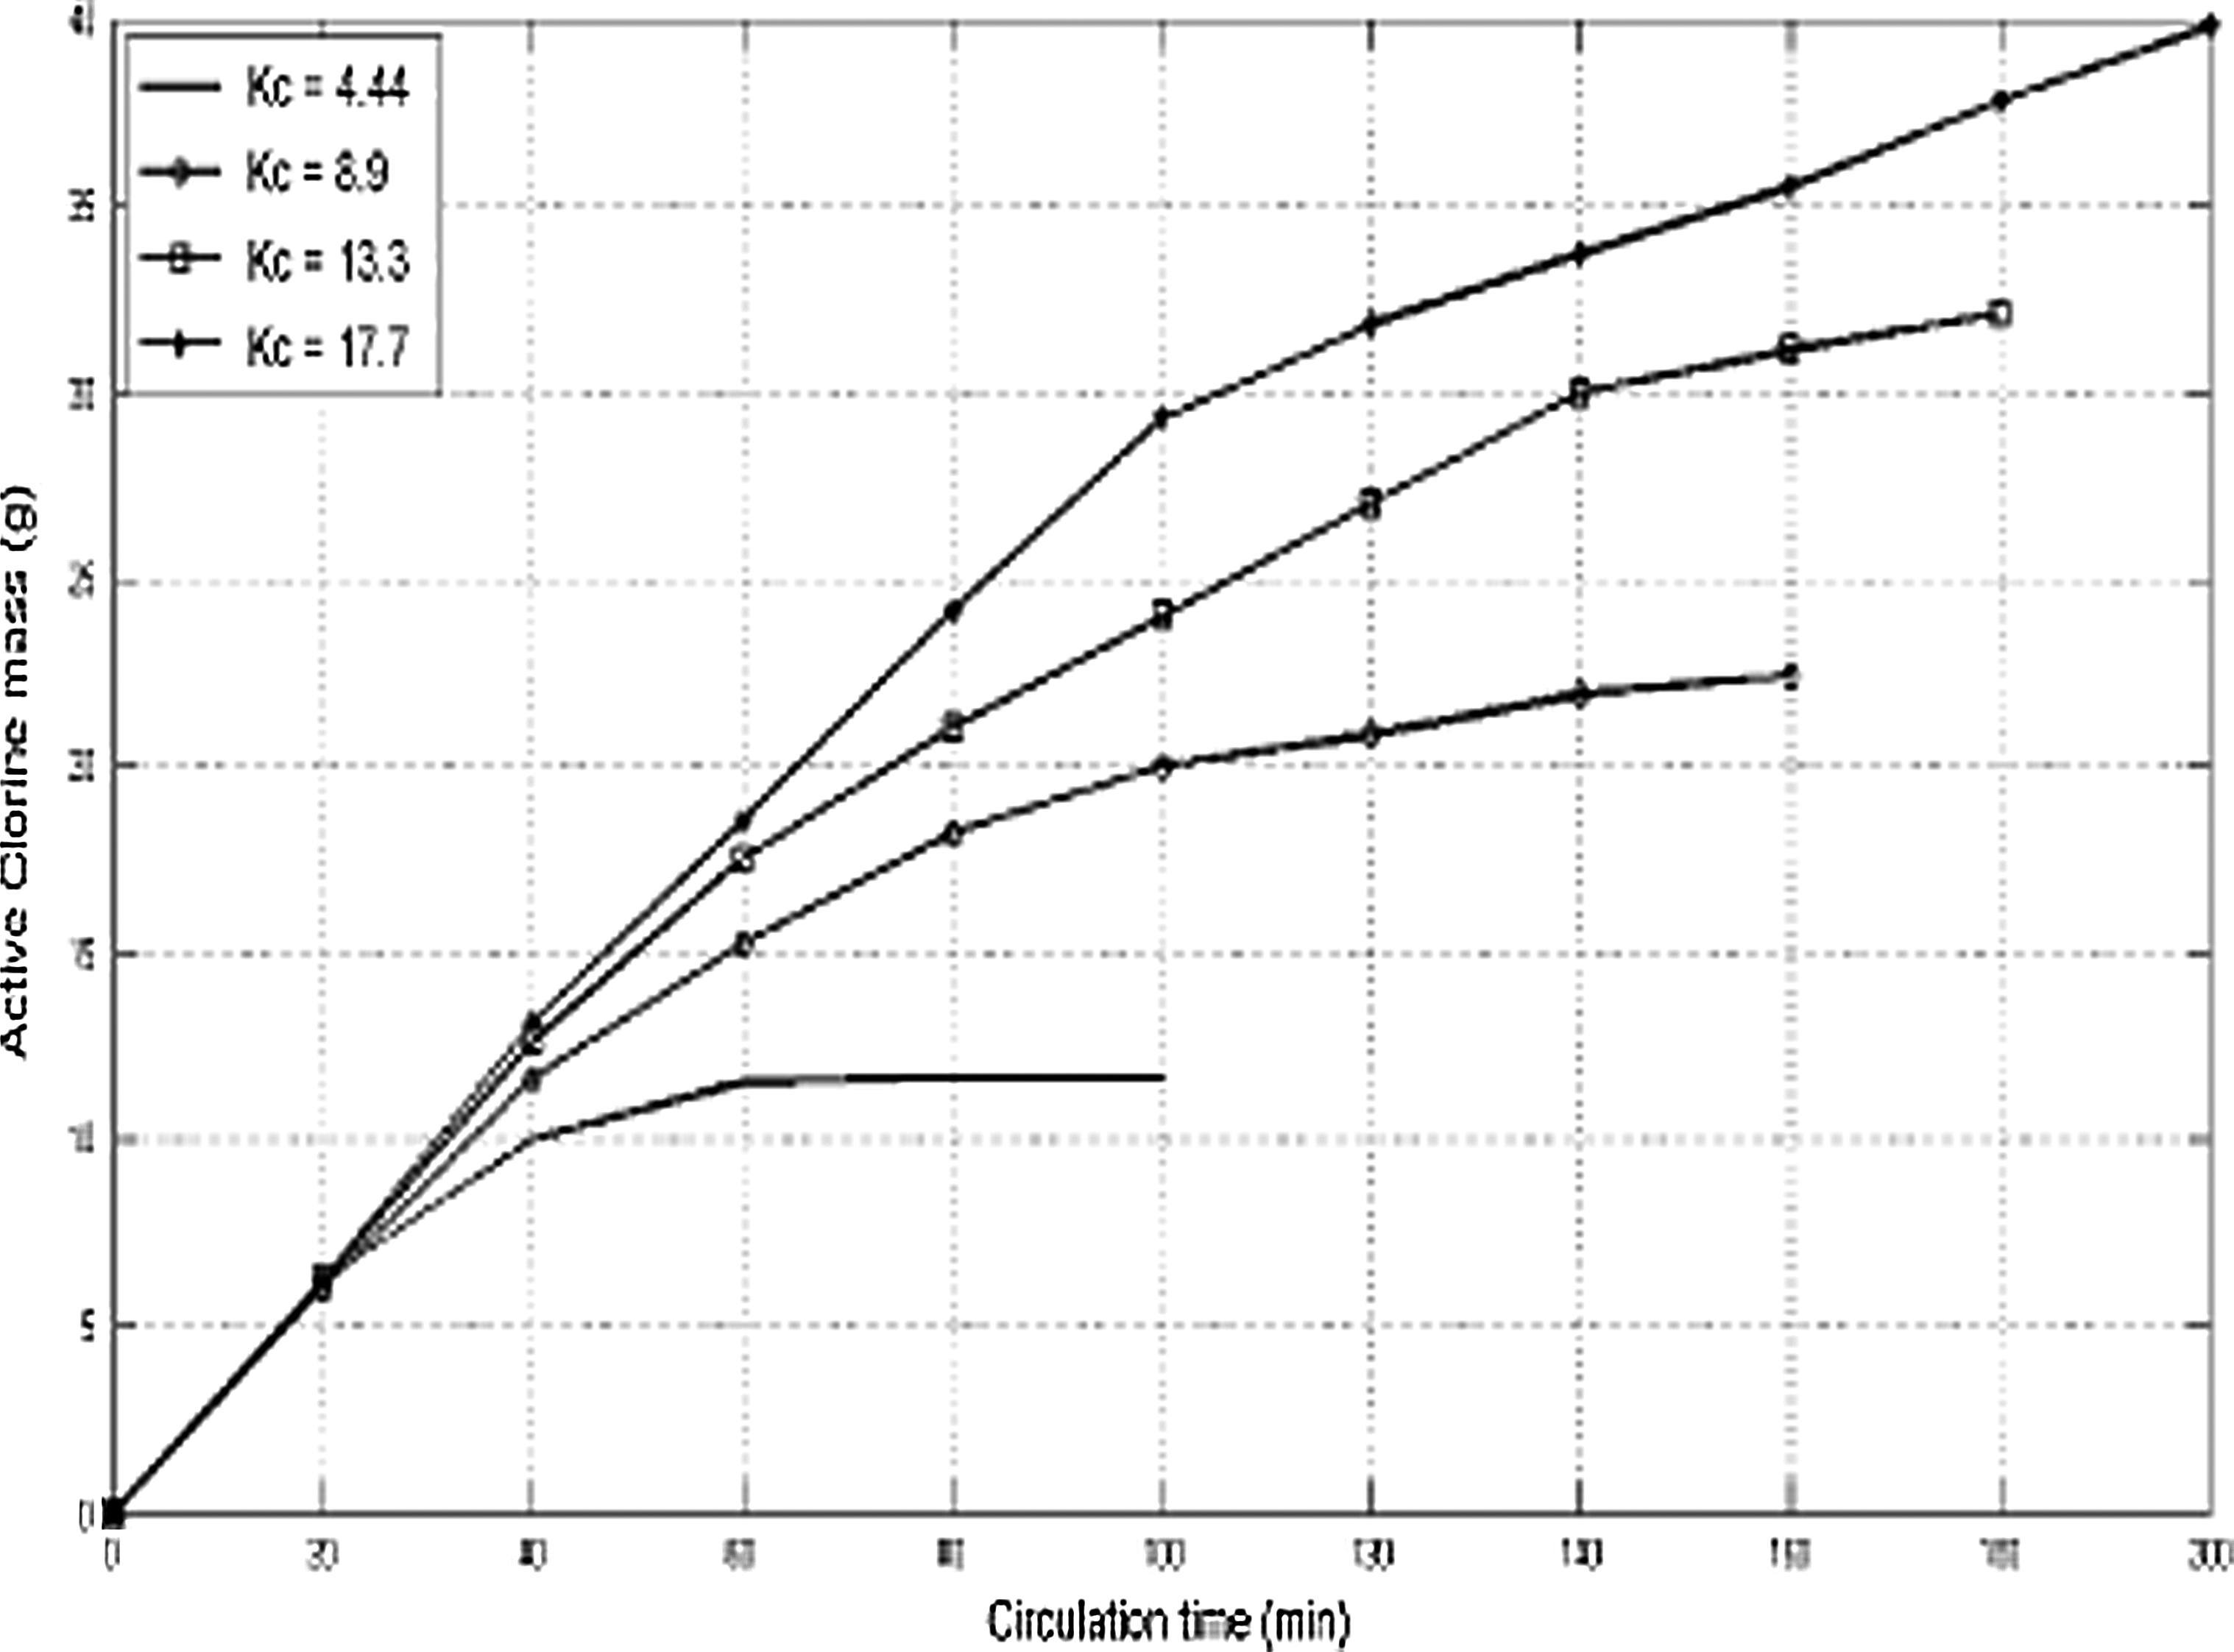
Effect of circulation coefficient on the mass of the generated AC.
The estimated hourly generation rate of AC and the rate of consumed electricity per unit mass of generated AC are shown in Figs. 8 and 9. The generation rate increases equally and proportionally with time for all Kc values during a circulation time of up to 20 min, reaching about 18.5 g/L. Beyond 20 min, the rate decreases for Kc values 4.44 and 8.9, while it continued to increase for Kc values 13.3 and 17.7, reaching 19 and 19.6 g/L, respectively, after 40 min. The results presented in Fig. 9 indicate that the higher the Kc value the lower the rate of consumed electricity at any time. The consumption rate increased proportionally with the circulation time for Kc values 4.44 and 8.9. However, for Kc values 13.3 and 17.7, the minimum consumption rate was found after 40-min circulation. This is because the maximum generation rate was achieved after 40-min circulation for the same Kc values. After 40 min of circulation, the rate of electricity consumed was 5.55 and 5.2 kW·h/kg for Kc values of 13.3 and 17.7, respectively, while it was 8.6 and 6.9 kW·h/kg for Kc values of 4.44 and 8.9, respectively. Therefore, the optimum circulation time can be considered 40 min, and the optimum Kc value lies in the range (14–18).
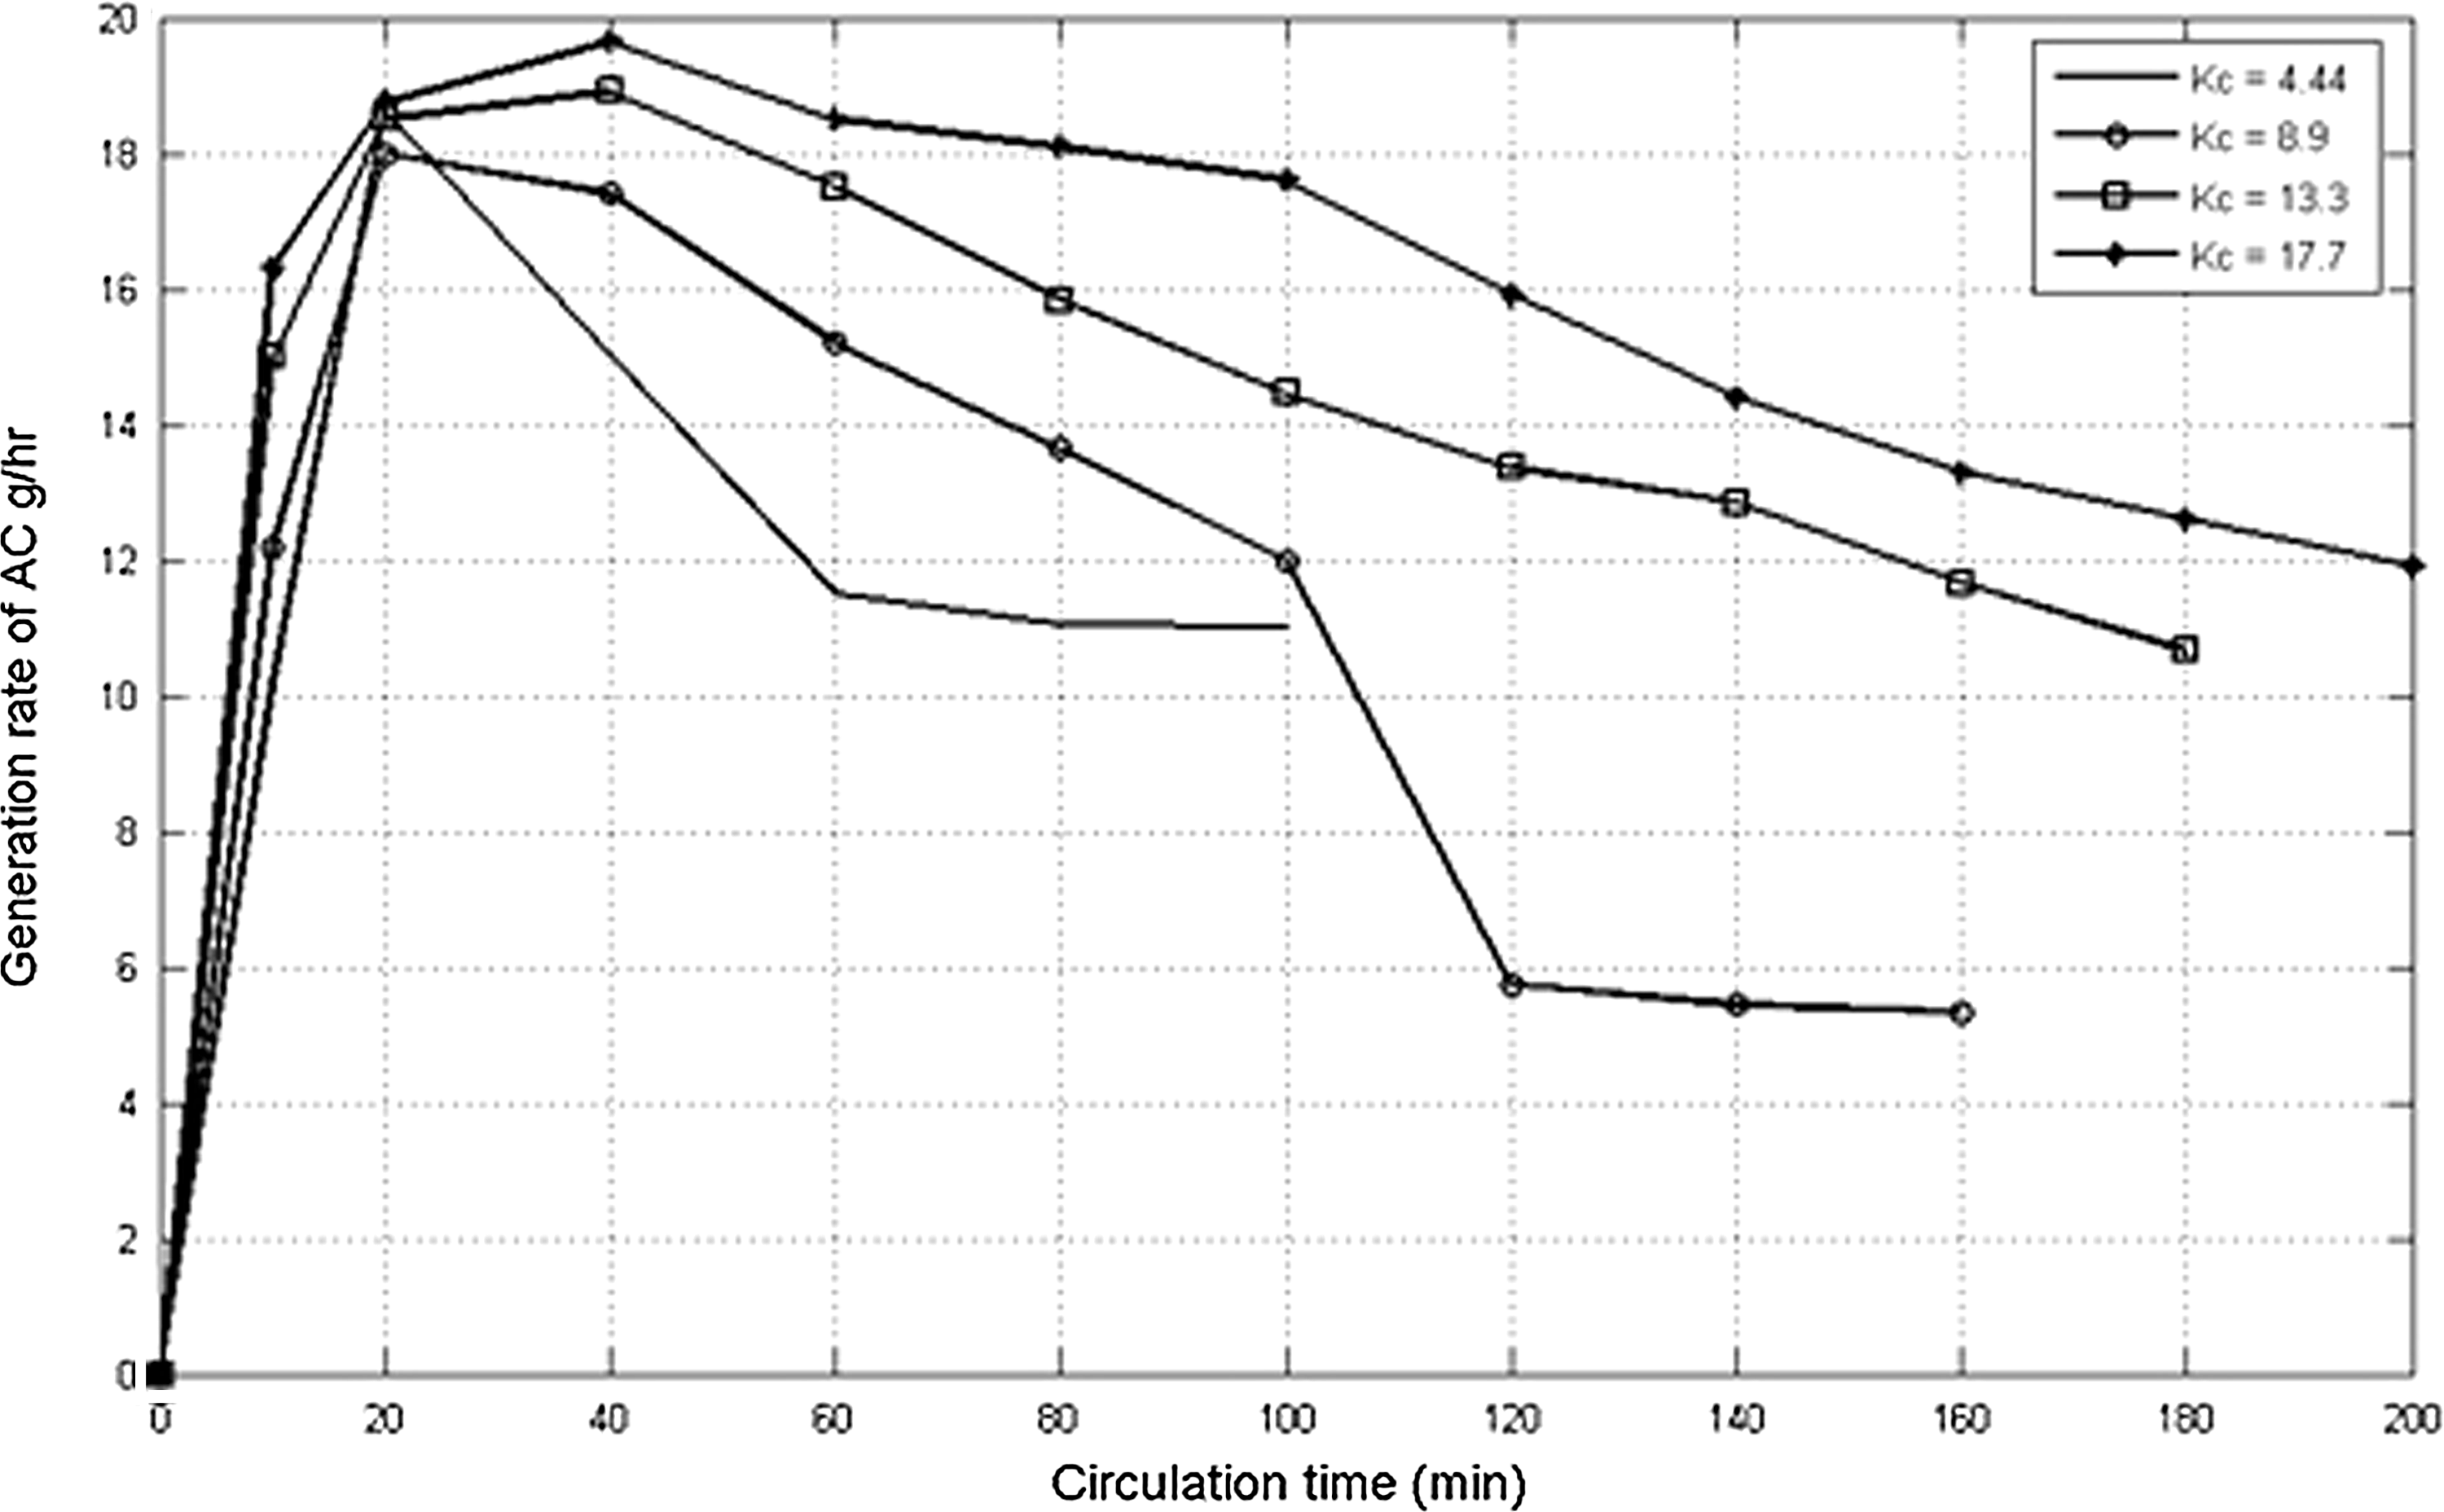
Effect of circulation coefficient on the generation rate of AC.
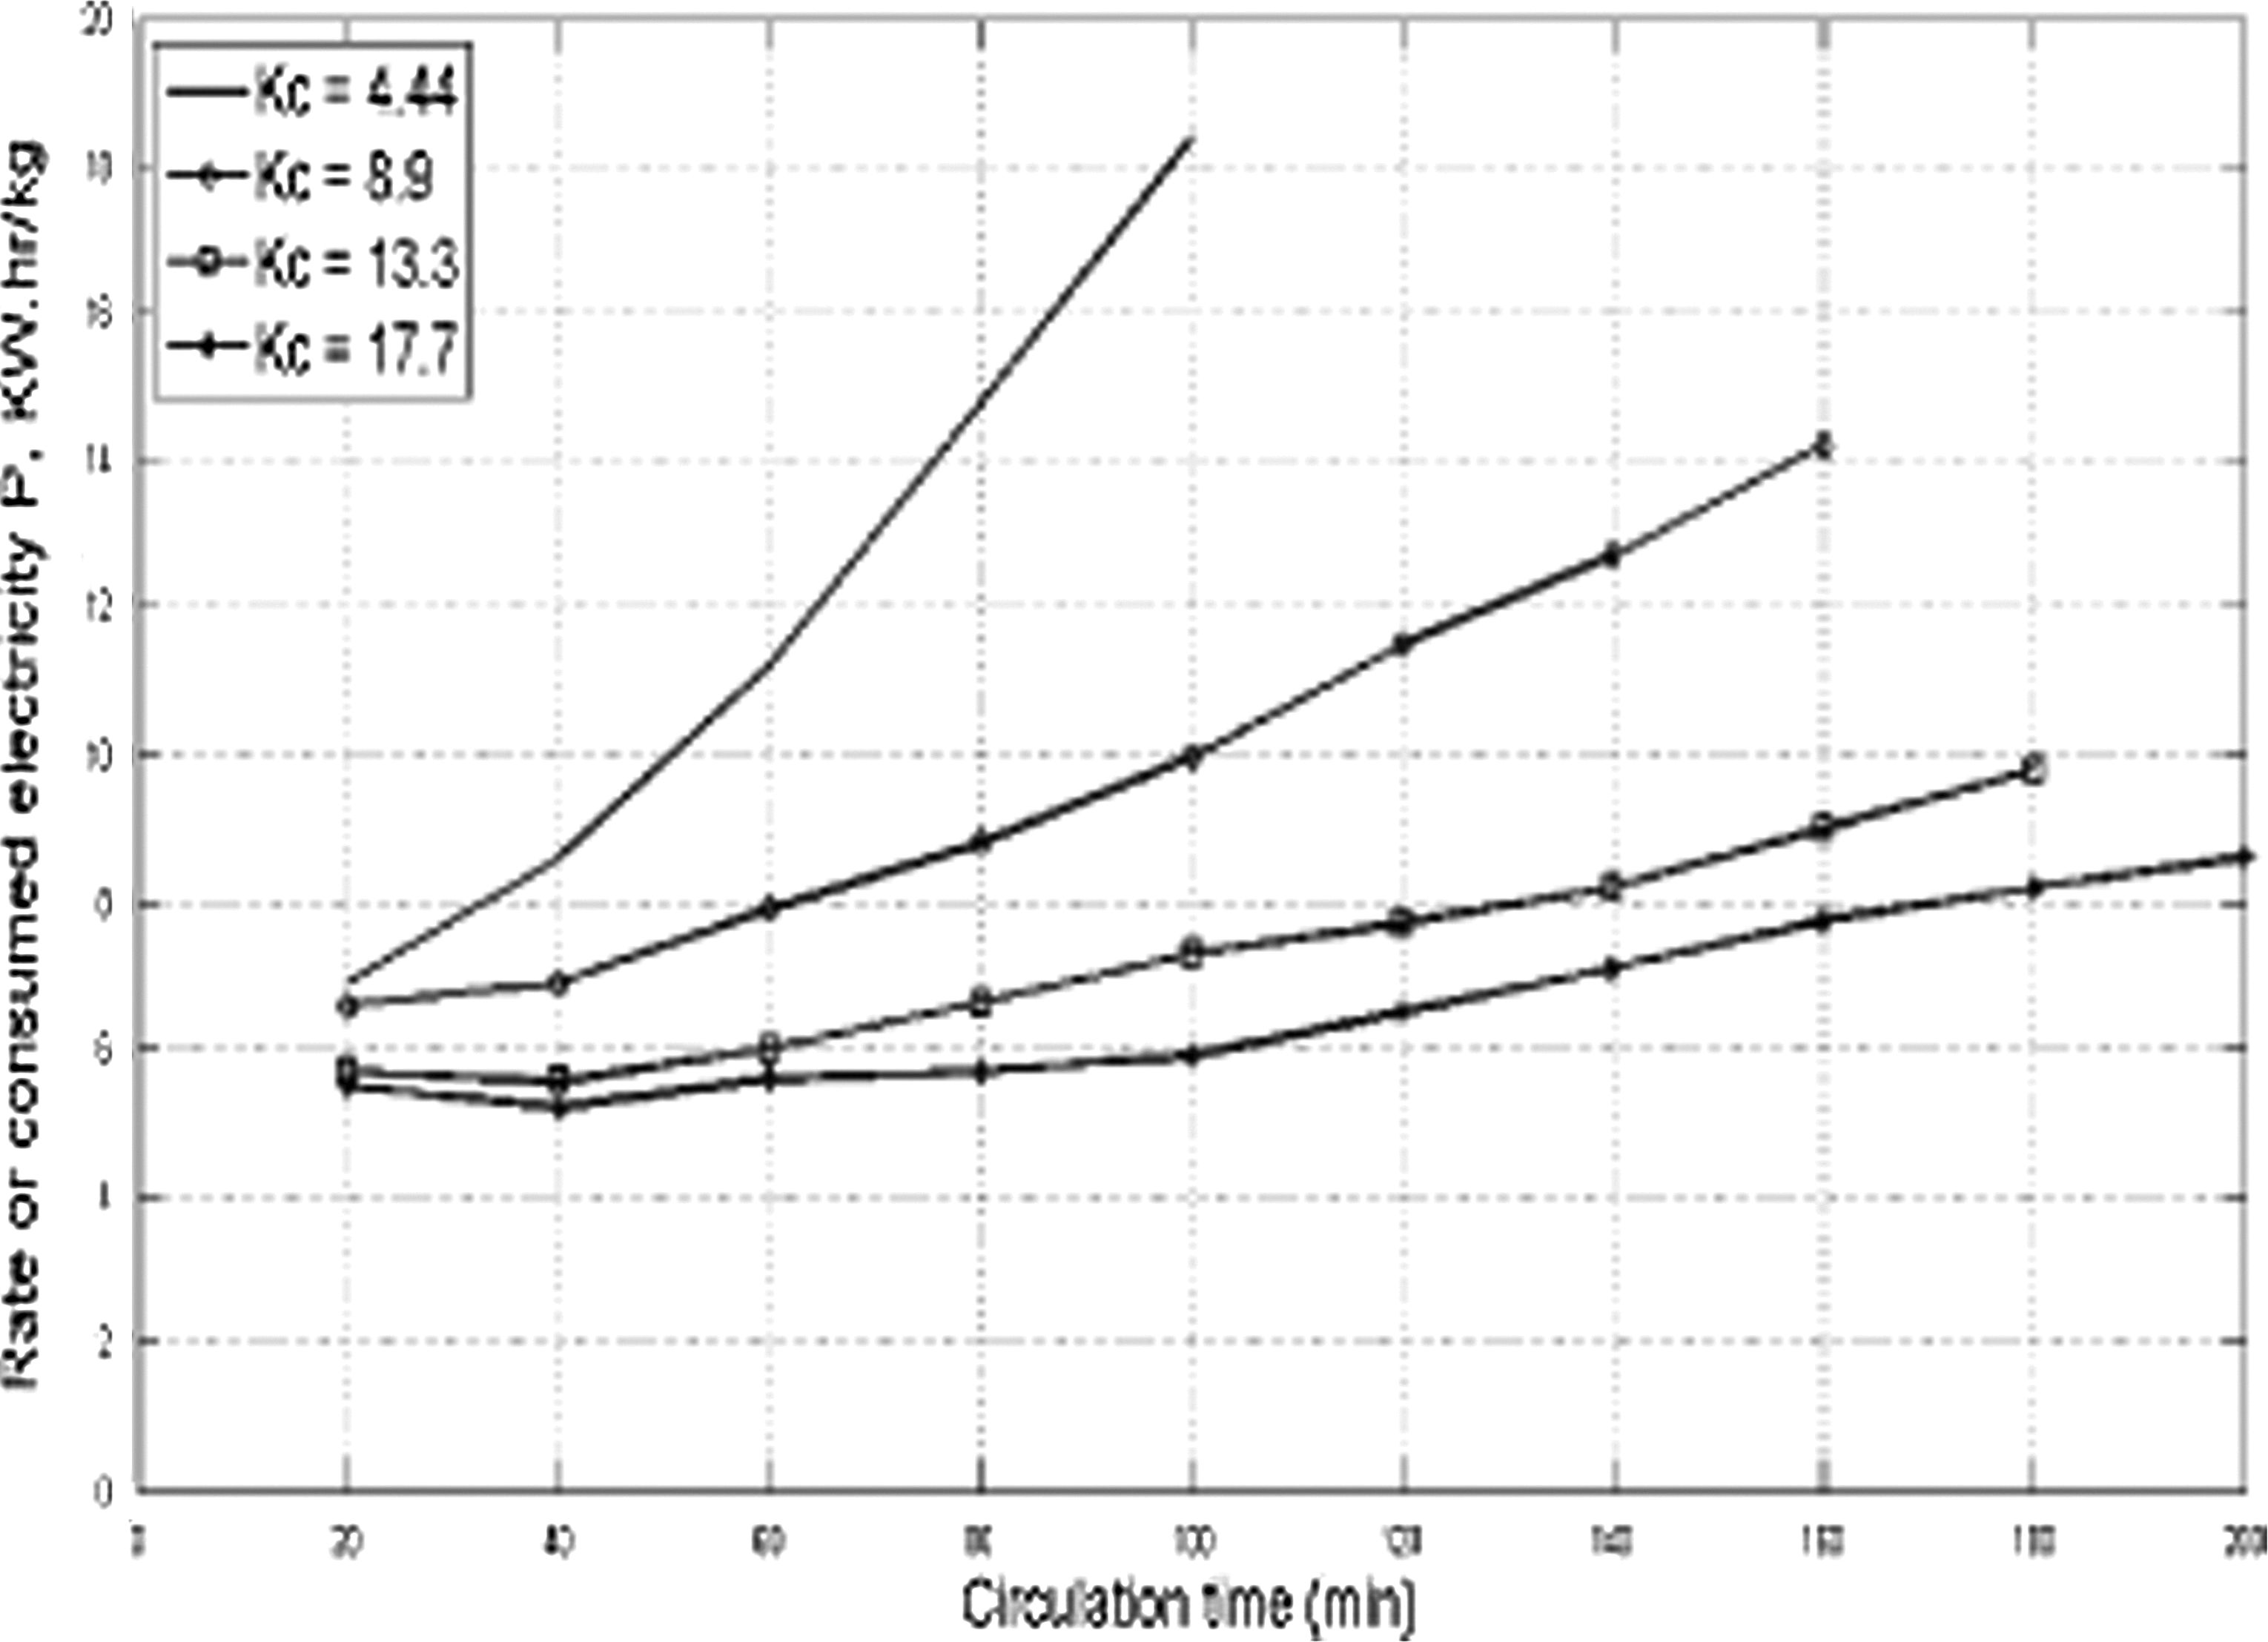
Effect of circulation coefficient on the rate of the consumed electricity.
Conclusion
Electrochemical generation of AC by circulating the electrolyte through an electrolytic cell provided oxidation of the high proportion of Cl− ions that exist in the electrolyte to form AC. The process was influenced not only by the electrolyte concentration and anode current density, but also by the ratio of electrolyte volume to volume of the electrolytic cell and by the circulation time. The maximum AC concentration was produced by using electrolyte concentration of 40 g/L as NaCl and anode current density of 800 A/m2. The electrolyte volume and circulation time values were optimum when the maximum AC generation rate and minimum rate of consumed electricity were achieved. The optimum circulation time was considered 40 min, while the optimum electrolyte volume was considered to be in the range of 14–18 times the electrolytic cell volume.
Footnotes
Author Disclosure Statement
No competing financial interests exist.