
Abstract
Abstract
Nanotechnology offers substantial prospects for the development of state-of-the-art products and applications for agriculture, water treatment, and food industry. Profuse use of nanoproducts will bring potential benefits to farmers, the food industry, and consumers, equally. However, after end-user applications, these products and residues will find their way into the environment. Therefore, discharged nanomaterials (NMs) need to be identified and quantified to determine their ecotoxicity and the levels of exposure. Detection and characterization of NMs and their residues in the environment, particularly in food and agricultural products, have been limited, as no single technique or method is suitable to identify and quantify NMs. In this review, we have discussed the available literature concerning detection, characterization, and measurement techniques for NMs in food and agricultural matrices, which include chromatography, flow field fractionation, electron microscopy, light scattering, and autofluorescence techniques, among others.
Introduction
Ag, silver; Si, silicon; NP, nanoparticle.
In agriculture, ENMs are mostly used to provide novel routes for pesticide delivery to plants (Scott and Chen, 2003; Chaudhry et al., 2008). However, this could release an excess of ENMs in soil, ground water, and food products, with unknown consequences (Klaine et al., 2008; Boxall and Molhave, 2011). ENPs like ZnO and CeO2 ENPs, widely used in food and commercial products, are potentially toxic to humans and plants (Nel et al., 2006; Lin et al., 2009; Moos et al., 2011; Lee et al., 2012; Mihranyan et al., 2012; Priester et al., 2012). These, as well as silver (Ag), gold (Au), and iron oxide (Fe3O4) ENPs, are potentially toxic to soil microbiota (Barrena et al., 2009; Ge et al., 2011; Sinha et al., 2011; Bandyopadhyay et al., 2012a).
This review embraces different measurement techniques for ENPs/ENMs in food and agricultural products, and the challenges associated with them. The available literatures on food additives, food processing and packaging, along with agricultural products containing NMs are discussed. The reported benefits of these products have been discussed in Tables 1 and 2, along with specific examples. Accordingly, the review provides the list for the separation and characterization techniques for NMs present in food- and agriculture-related products (Figs. 1 and 2).
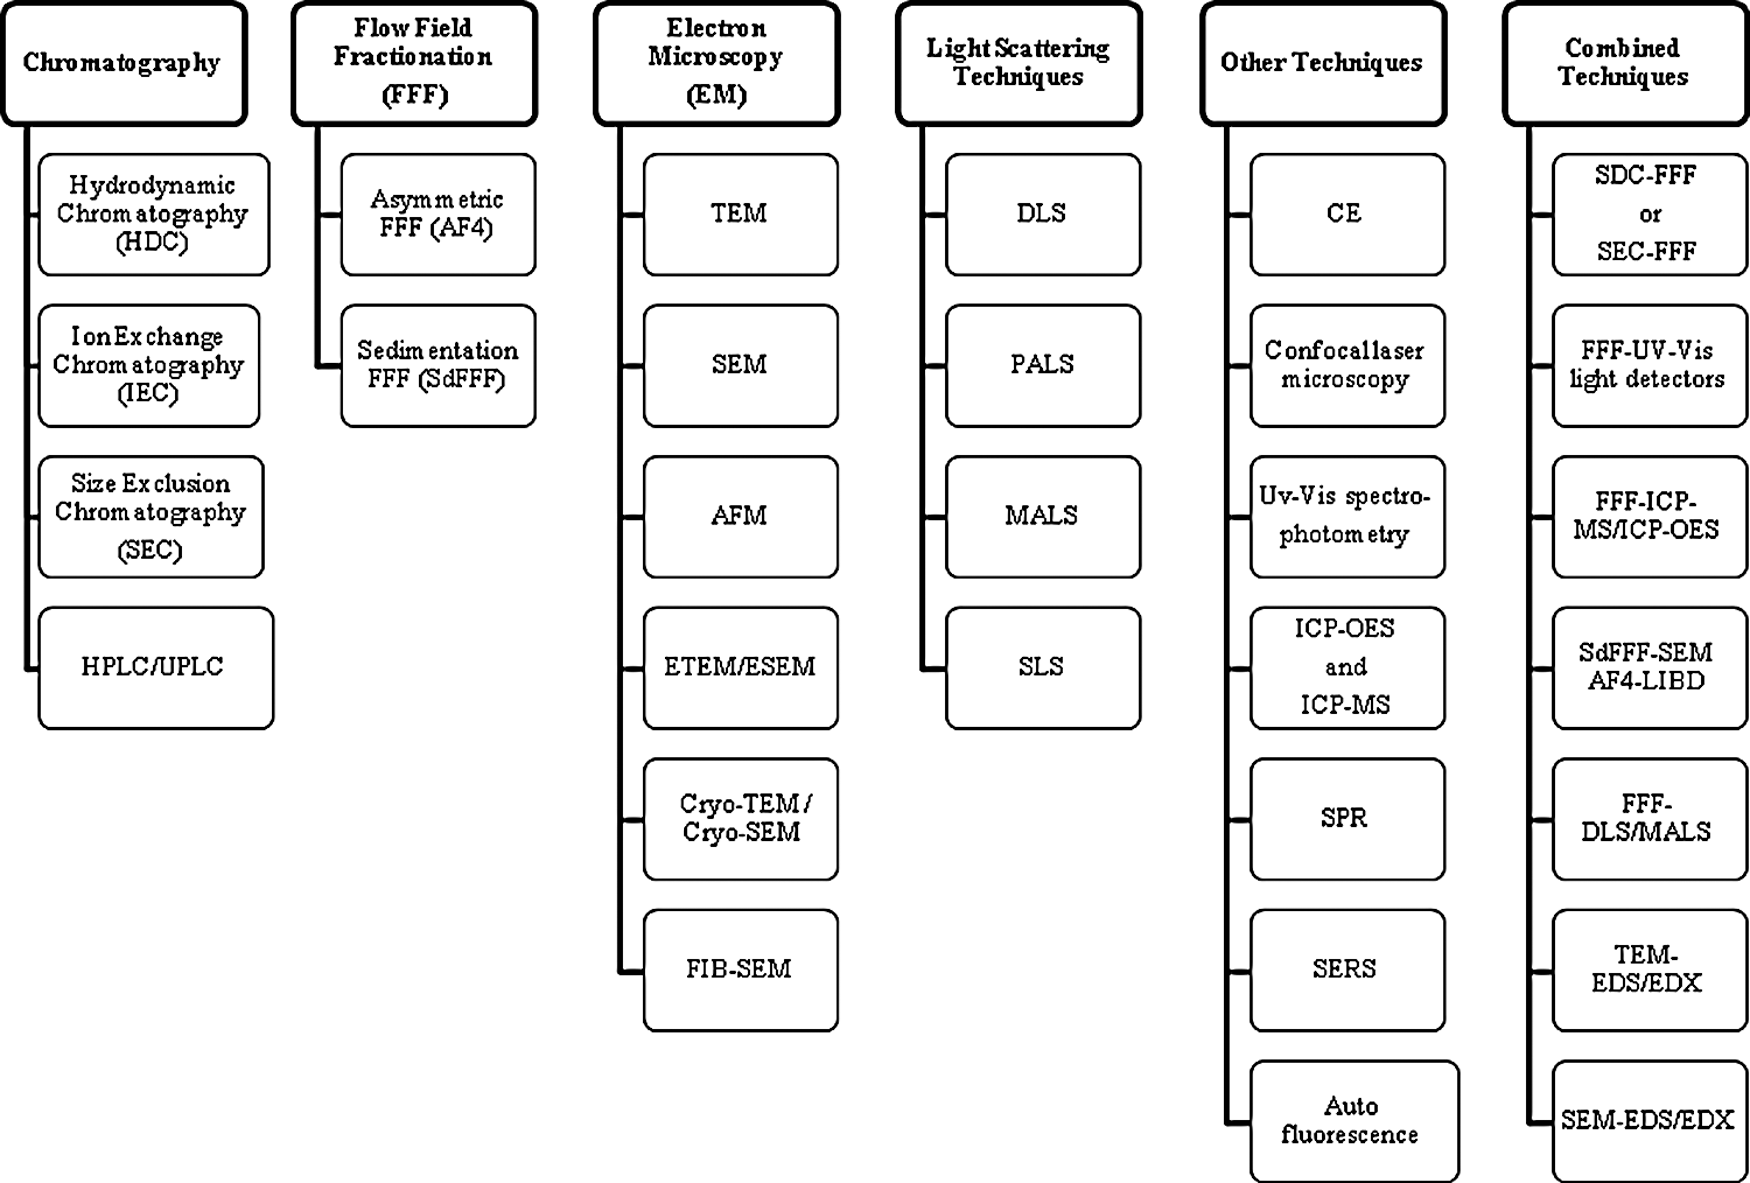
List of available separation and detection techniques for the measurement of nanomaterials (NMs)/nanoparticles (NPs) in food and agriculture products. AFM, atomic force microscopy; CE, capillary electrophoresis; DLS, dynamic light scattering; EDS/EDX, energy dispersive X-ray spectroscopy; EM, electron microscopy; ETEM/ESEM, environmental TEM or SEM; FIB, focused ion beam; HPLC/UPLC, high- or ultra-performance liquid chromatography; ICP, inductively coupled plasma; LIBD, laser-induced breakdown detection; MALS, multiangle light scattering; MS, mass spectrometry; OES, optical emission spectrometry; PALS, phase analysis light scattering; SDC, sample displacement chromatography; SEM, scanning EM; SERS, surface enhanced Raman scattering; SLS, static light scattering; SPR, surface plasmon resonance; TEM, transmission EM; UV-vis, ultraviolet-visible.
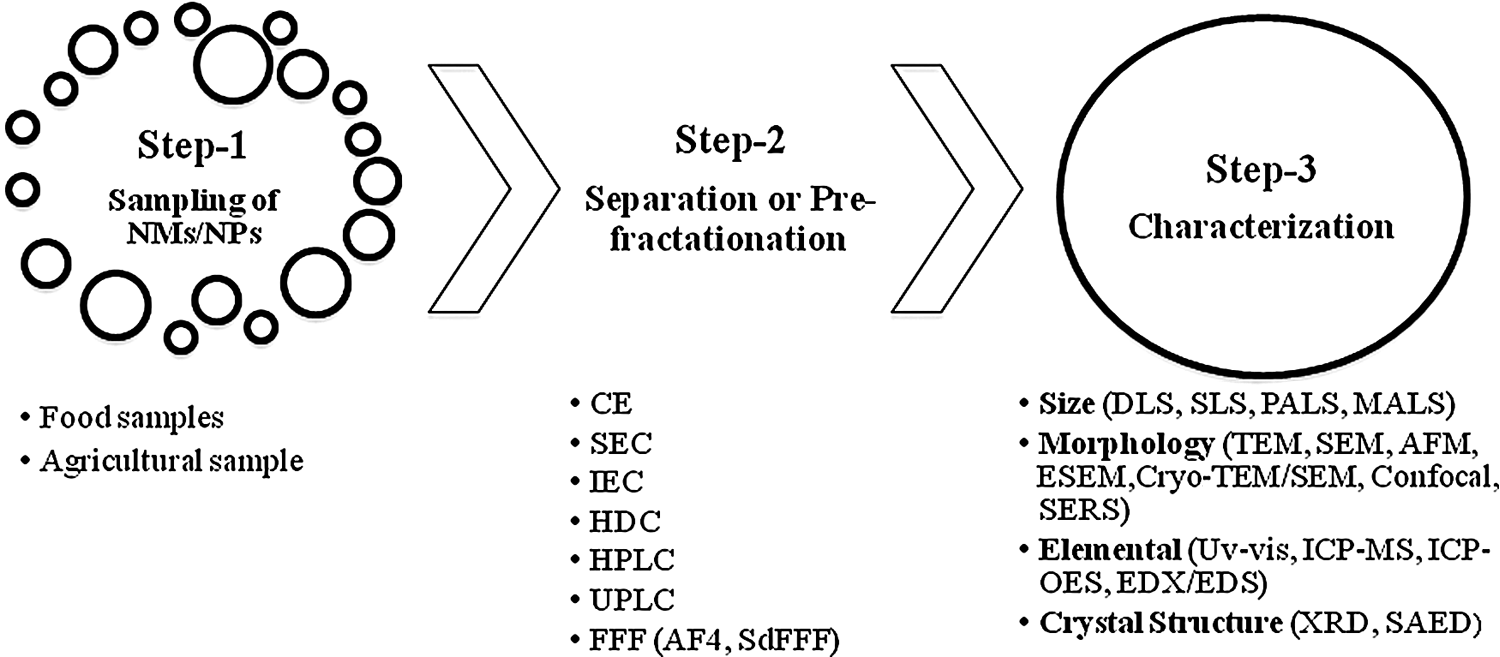
Different steps for measuring NMs/NPs present in food and agricultural samples along with their corresponding analytical tools/techniques. SAED, selected area electron diffraction; XRD, X-ray diffraction.
Discussion
Separation and characterization of NMs in food and agricultural samples
Food and agricultural samples are heterogeneous systems, which may contain a mixture of natural NPs (NNPs) and ENPs of different composition (Tiede et al., 2008; Kammer et al., 2011). The mixing of ENPs with NNPs will impact their agglomeration and reactivity in any medium (Tiede et al., 2008; Farre et al., 2011). Hence, sometimes the samples require separation or pretreatment before characterization (Tiede et al., 2008). Sample preparation and prefractionation can be done in different stages or analytical processes to reduce complexity of the sample matrices with minimum alteration (Tiede et al., 2008; Bandyopadhyay et al., 2012b). In addition, physicochemical parameters, such as size, type, surface charge, and reactivity, might influence the fate, transport, and ecotoxicology of NMs (Magnuson et al., 2011; Pycke et al., 2011; Bandyopadhyay et al., 2012b). Available separation and characterization techniques are discussed in detail.
Separation techniques
Several separation techniques can be used for the detection of NMs in food/agricultural samples (da Silva et al., 2011; Farre et al., 2011; Pycke et al., 2011; Bandyopadhyay et al., 2012b). Separation or prefractionation can be achieved by a variety of techniques, including capillary electrophoresis (CE), chromatography, and flow field fractionation (FFF), among others (Magnuson et al., 2011). Recently, Magnuson et al. (2011) reported the use of high-performance liquid chromatography (HPLC), ultra-performance liquid chromatography, and CE with FFF as efficient separation techniques for NMs in food products.
In chromatography, compounds can be separated based on their charge (weak/strong cation or anion exchange chromatography; [IEC]), molecular mass (size exclusion chromatography [SEC]), hydrophobicity/polarity (reversed-phase HPLC, hydrophobic interaction chromatography), and specific characteristics (affinity chromatography), depending on the type of materials in the stationary phase (Williams et al., 2002; Lead and Wilkinson, 2006; Tiede et al., 2008). Luykx et al. (2008) reported the use of SEC and IEC to measure NMs in different food matrices. For example, SEC, coupled to refractive index and multiangle light scattering (MALS) detectors, has been used to characterize polysaccharides present in food samples (Fee et al., 2003; Hokputsa et al., 2004). SEC can also be coupled with a range of detection techniques to characterize NPs, along with the monitoring of the size fractionation (Song et al., 2004; Helfrich et al., 2006).
HPLC allows the separation of pigments, carbohydrates, vitamins, additives, mycotoxins, amino acids, proteins, lipids, chiral compounds, and triglycerides in fats and oils (Luykx et al., 2008; Magnuson et al., 2011). Hydrodynamic chromatography (HDC) is also a very efficient technique to separate NPs in food and agricultural samples based on their hydrodynamic radius (Tiede et al., 2008). HDC coupled with an ultraviolet–visible (UV-vis) detector has been used for the size characterization of colloidal suspensions and biomolecules in food and biological samples (Williams et al., 2002; Blom et al., 2003; Luykx et al., 2008).
FFF, a technique similar to HPLC, can be used to separate NMs based on thermal or hydraulic gradients, electrical forces, and sedimentation (Hassellov et al., 2008; Luykx et al., 2008; Bolea et al., 2010). The general principles of the FFF technique are described in detail elsewhere (Giddings, 1993; Schimpf et al., 2000). It is a flexible elution technique where simultaneous separation and measurement can be done across a broad macromolecular colloidal particulate, ranging from about 1 nm to more than 100 μm (Giddings, 1993). A major advantage of this method is the lack of a stationary phase, thus restraining the interaction between the sample and the equipment surfaces (Giddings, 1993; Schimpf et al., 2000). FFF can be used by an online or offline detection mode for the analysis of complex food samples (Kammer et al., 2011). For instance, FFF coupled with online detectors, such as inductively coupled plasma-mass spectrometry (ICP-MS)/optical emission spectrometry, has been used for elemental analysis of metallic NPs (Kammer et al., 2011; Baalousha et al., 2006). FFF can be coupled with fluorescence, MS, and light scattering techniques for the quantitative detection of NMs in complex systems (Hassellov et al., 2008). Kammer et al. (2011) reported that FFF combined with HPLC and UV-vis light detectors is an efficient tool for the detection of NMs in food samples. Soil and sediments can be analyzed by using FFF in combination with other online/offline detectors. For example, ZnO NPs have been separated from soil particles through FFF (Gimbert et al., 2007).
Sedimentation FFF (SdFFF) has been used for characterizing micrometer size (You et al., 2002) and submicrometer size particles in food materials (Jussila et al., 1997; Udabage et al., 1997; Udabage et al., 2003). SdFFF is suitable for separation and characterization of emulsions in food samples. It is an elution-based analytical technique, which provides high-resolution separation of NMs in gentle, low shear conditions. Saeseaw et al. (2005) reported the use of SdFFF for the measurement of small food particles present in different types of flour and milk samples. SdFFF, coupled with ICP-MS, has been used for the characterization of particle size and elemental distribution in soil colloids (Ranville et al., 2005).
Asymmetric flow FFF (AF4) is another technique for NM characterization. Bouby et al. (2004) reported the characterization of Fe3O4/hydroxide colloids by using a combined AF4 and laser-induced breakdown technique with trace detection limit of 1 mg/L. This combination can be ideal for measuring NMs in agricultural soil, aquatic samples, and/or humic substances containing Fe3O4/hydroxide. AF4, in combination with MALS, has gained importance in the field of food science to detect submicron size particles (Hupfeld et al., 2009).
Detection or characterization of NMs in food and agriculture
The most widely used detection techniques for NMs in food and agricultural samples include: microscopic and spectroscopic techniques, dynamic light scattering (DLS), surface plasmon resonance (SPR), and autofluorescence, among others (Caldwell et al., 1992; Contado et al., 1999; You et al., 2002; Durand et al., 2003; Regnault et al., 2004; Arfvidsson et al., 2004; González-Melendi et al., 2008; Rebe Raz et al., 2012).
The classical light scattering technique can provide the structural information and, in combination with DLS or FFF, the shape of the particles (Brar and Verma, 2011). DLS (also known as photon correlation spectroscopy) uses the scattered light to measure the rate of diffusion of NPs and provides a size distribution in terms of hydrodynamic diameter. This is suitable for sensing small aggregated proteins (<0.01% weight) in various food samples (Brar and Verma, 2011). Yegin and Lamprecht (2006) reported the use of DLS for size characterization of lipid nanocapsules. Durand et al. (2003) described the use of DLS (along with optical microscopy) for the size measurement of natural particles (∼1–3 μm) present in milk. The surface structure of the casein micelle NPs was also achieved in simple and rapid experimentation using DLS (Griffin et al., 1983; Griffin et al., 1988; Alexander and Dalgleish, 2006). However, it is hard to quantify accurately the presence of any aggregates with DLS. This problem can be overcome by using the phase analysis light scattering (PALS) technique. PALS has been used to determine the isoelectric point and electrophoretic mobility of the whey protein isolate solution (Vanapalli and Coupland, 2000). Static light scattering is also considered as another rapid and reproducible light scattering technique for food samples varying from 0.05 to 2000 μm. This technique has already been used for the particle size measurement of dairy products (Michalski at al., 2001), casein micelles (Huppertz and deKruif, 2007), lactose crystals (Mimouni et al., 2005), skimmed milk (Gaucher et al., 2007), and whole milk (Saveyn et al., 2006; Ahmad et al., 2008).
Electron microscopy (EM) techniques are widely used to determine the size, shape, and other elemental properties of NPs/NMs in food matrices. Standard EM instruments facilitate size and shape determination of NMs with a better resolution. Transmission EM (TEM) is one of the indispensable nanoscale imaging techniques for the characterization of NMs <200 nm in food and agricultural samples. In TEM, electrons are transmitted through the sample to acquire an image (Peters et al., 2011). This technique is suitable for imaging NPs with a resolution of 0.5 nm (Tiede et al., 2008). The NPs appear as dark dots on a lighter background, as the density of the inorganic NPs is higher compared with the background in the food matrix. TEM has been employed to measure milk-protein-based nanotubes, the shape of serum albumin NPs, and enzyme-functionalized peptide nanotubes (Luykx et al., 2008). TEM, coupled with an energy dispersive X-ray spectroscopy (EDS or EDX) detector is used to get the elemental compositions of NMs, while at the same time, TEM images can provide the size, morphology, and size distribution of NMs with accuracy of ±5% (Burleson et al., 2004). However, this technique is mostly used to localize and identify inorganic particles. This technique is not helpful in organic NPs, as carbon is the major element in the NPs and the food matrix (Peters et al., 2011). Recently, by using TEM, the scanning electron microscope (SEM), EDS, along with Zetasizer (DLS), Zhang et al. (2012) determined the size, shape, and elemental characteristics of AgNPs present in Ag-contaminated pears. The authors mentioned that the combination of two or more techniques is suitable for characterizing the NPs in the food samples (Zhang et al., 2012). SEM can be employed for detecting larger particles (achieving a spatial resolution of ∼500 nm) (Burleson et al., 2004). SEM provides a high-resolution image of a sample surface in a distinctive three-dimensional appearance. Additionally, the SEM has been used to observe the morphology of polysaccharide NPs, protein NPs, and the liposomal NPs (Luykx et al., 2008).
The sample preparation for the EM study can be very tedious, as it requires thin sections for imaging (Dudkiewicz et al., 2011). Additionally, standard EM instruments (TEM and SEM) operate under high-vacuum conditions; therefore, samples containing water cannot be imaged before sample preparation. In addition, chemical fixation and dehydration of the samples is required before imaging, which can produce artifacts (Burleson et al., 2004). Liquid samples and emulsions (e.g., milk, yogurt, or salad dressings) can be encapsulated in agar and/or chemically fixed followed by dehydration before the TEM or SEM analysis (Kalab and Larocque, 1996; Egelandsdal et al., 1999). An environmental TEM or SEM (ETEM/ESEM) can be employed to characterize samples in wet conditions or without chemical fixation. The food and agricultural samples can be imaged in a controlled atmosphere in ETEM, whereas, in ESEM, hydrated samples can be imaged as the samples remain under high vapor pressure. Reports indicate that it is possible to image samples with 100% relative humidity by controlling the vapor pressure (Burleson et al., 2004; Dudkiewicz et al., 2011). ESEM has been employed to investigate the presence of inorganic microsized and nanosized contaminants in food products (Gatti et al., 2009).
Cryo-TEM/Cryo-SEM can be used to acquire high-resolution images of biological samples under high vacuum and below ambient temperature (between −100°C and −175°C). The lower temperature (typically the vitrified state) allows the life-like appearance of the sample and helps to obtain the micrograph of hydrated and chemically unmodified state of the sample (Dudkiewicz et al., 2011). This is ideal for samples that cannot be fixed chemically (e.g., fat- and polysaccharide-based food samples). Cryo-SEM can be applied for imaging NMs in suspensions, solid lipid NPs, or micelles. Dudkiewicz et al. (2011) reported that Cryo-SEM has a higher resolution compared to ESEM. Nonetheless, ESEM can be used to observe the dynamic changes associated to the sample morphology.
Atomic force microscopy (AFM) is also considered a powerful tool to investigate the fine structural information of food materials. AFM can detect irregularities in the polymer structure that usually hindered the detection in whole sample-based analyses (Round et al., 1996). Thus, AFM imaging provides the potential to characterize the integral heterogeneous assemblies of food macromolecules (Yang et al., 2006, 2007).
Soil and sediment samples containing NMs with unique properties, such as light absorption, fluorescence, or containing a rare metal, can be effectively analyzed by TEM or SEM techniques (von der Kammer et al., 2006). These properties are also sensitive for UV-vis spectrophotometry, where colored species (such as ferrihydrite and humic colloids) in soil samples can be detected (Bouby el al., 2004).
In addition to EM, confocal laser microscopy can also be used to detect NMs in agricultural samples, specifically, in plant and microbial systems. This technique was used to detect CeO2 and ZnO NPs inside corn plant tissue. Confocal microscope images showed NP aggregates in root epidermis, cortex, and some NP aggregates in the xylem vessels (Zhao et al., 2012a, 2012b).
SPR or surface-enhanced Raman spectrometry-based approaches are also being employed to measure NPs (Tiede et al., 2008; Rebe Raz et al., 2012). A recent report described the use of human metallothionein-based SPR sensors to detect and measure AgNPs in food and environmental samples (Rebe Raz et al., 2012). The authors acknowledged SPR as a rapid screening tool that can provide real-time automated measurements. The sensitivity of the sensor increased as the size of the AgNPs increased, probably due to the enhancement of the SPR signal, which is proportional to the mass of the binding analyte (Rebe Raz et al., 2012).
Autofluorescence can also be used to analyze agricultural samples. NMs can be detected with this technique: glutaraldehyde-fixed plant samples. González-Melendi et al. (2008) reported the use of autofluorescence to detect core shell magnetic NPs in Cucurbita pepo plants. The plant samples showed the presence of NPs inside the cell wall of the xylem vessels. Actually, the presence of lignin in the cell wall of the plant tissue helps to autofluoresce the samples. Therefore, the method can visualize some particles associated with the cell wall of xylem vessels, which are highly autofluorescent due to their major component—lignin (González-Melendi et al., 2008).
Conclusion
In summary, there are many analytical methods/tools for the separation and detection of the NMs in food and agricultural samples. These include chromatography, light scattering techniques (classical and advanced), and electron microscopy, among others. However, to the best of the authors' knowledge, a limited number of studies have been reported for the detection of NMs in food and agricultural samples. Therefore, extended future studies are needed to understand the environmental fate, transport, and ecotoxicity of the released ENMs/ENPs.
Footnotes
Acknowledgments
This material is based upon work supported by the National Science Foundation and the U.S. Environmental Protection Agency under Cooperative Agreement Number DBI-0830117. Any opinions, findings, and conclusions or recommendations expressed in this material are those of the author(s) and do not necessarily reflect the views of the National Science Foundation or the U.S. Environmental Protection Agency. This work has not been subjected to EPA review and no official endorsement should be inferred. The authors also acknowledge the USDA grant number 2011-38422-30835, the NSF Grant number CHE-0840525, and the Dudley family for the Endowed Research Professorship in Chemistry.
Author Disclosure Statement
No competing financial interests exist.