
Abstract
Abstract
Nanotechnology and its characterization can be overwhelming when viewed through its multitude of applications. Product designers are bringing new high-value nanotechnology products to market that address many different nanoapplications. These nanoapplications span most science and engineering disciplines, thus creating a complex market that instrument manufacturers are beginning to understand. This article addresses the nine most common nanomaterial characteristics and nearly 35 different analytical techniques commercially available to measure these nine characteristics. Current commercial instrumentation used in nanobased research and development (R&D) is currently used to mitigate the manufacturing risks. Simple nanocharacterization instruments with high throughput are still lagging new nanoproduct production. This void is being filled by the R&D bench-type laboratory instruments that require high-level operational skills. Instrument manufacturers are hesitant to rush into the uncertainty of nanomanufacturing characterization market segments. For instrument manufacturers, it appears that the environmental market segment presents the most opportunity and likely will be the foundation for most nanomaterial characterization innovations. This article discusses the complexity of the nanotechnology market and the challenges the instrument manufacturers face.
Introduction
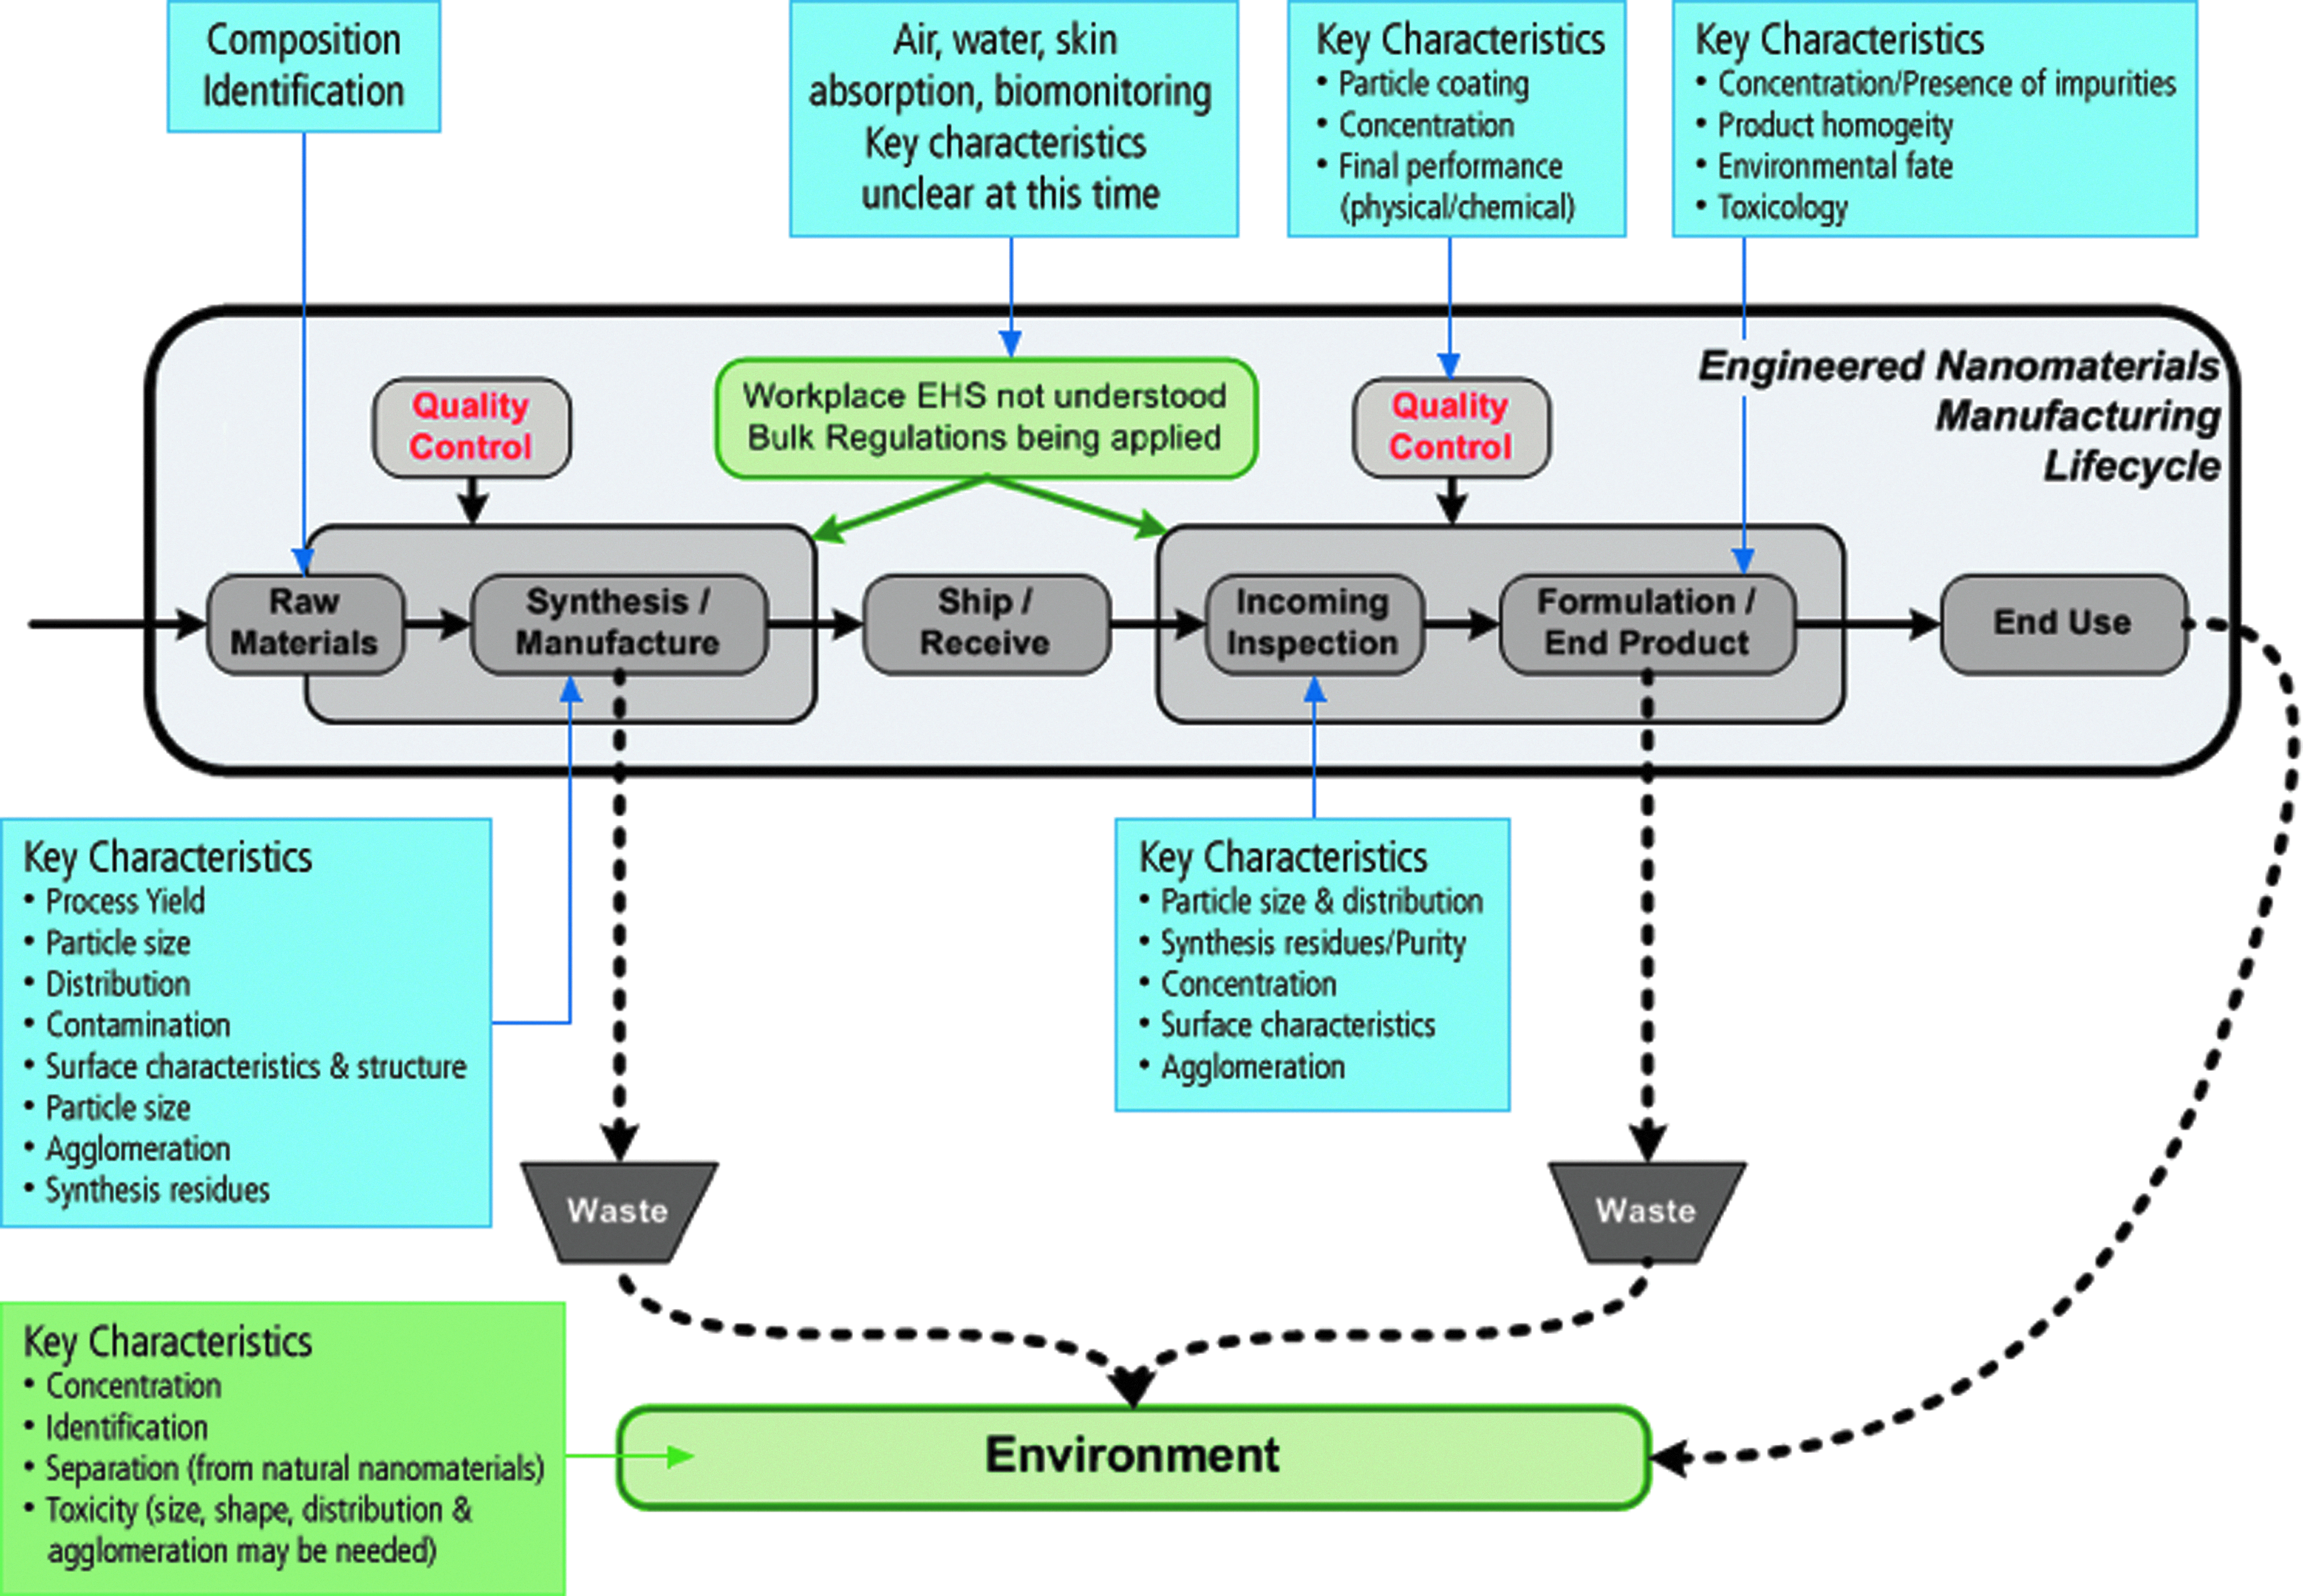
Engineered nanomaterial life cycle. Reprinted with permission from Salamon et al. (2010).
Nanotechnology consists of collections of complex and sometimes perplexing research data and hypotheses. As tradition has it, early scientific work relies on traditional laboratory and material science practices. Nanoproducts are coming to market much faster than environmental sciences and toxicological sciences can keep up with, thus creating risk analysis gaps. These nanoproduct introductions are creating niche markets that span most realms of science and engineering disciplines. This cross-pollination involves physics, chemistry, material sciences, biology, toxicology, and medicine; electrical engineering, mechanical engineering, and optical engineering; and environmental sciences.
ENMs' characterization market complexity expands with each new nanoproduct. From an instrument manufacturer's view, this complexity is challenged by the varying skill sets needed for each of these scientific and engineering disciplines. Not only are the skill sets different, their languages are different, too. An example of the impact of different languages is the use of the liquid chromatography–inductively coupled plasma–mass spectroscopy system (LC-ICP-MS). Many times, the science–language boundary between chromatographers and spectroscopists is such that the operator may be very well versed in the ICP-MS operation, but confounded with the LC operation (and vice versa), because software is designed for their respective fields. Sometimes, if hyphenated instrument software confusion exists, remedial tutoring may be in order. For new instruments, differences in discipline jargon will influence the future instrument software design.
Nanomaterial-based products have the potential for great monetary gain that has created a competitive market that is very secretive. Processes, formulations, and product risk mitigation are guarded secrets. Some companies consider their creative and cost–effective environmental health and safety (EHS) solutions as a competitive edge over their competition. In fact, in some cases, the cloak of secrecy covers the manufacturing EHS procedures that keep the workplace safe.
There are five market considerations instrument manufacturers face as they develop a nanotechnology characterization marketing strategy:
• Nanotechnology is a complex science. • Development of ENMs requires varied skill sets. • The instrument market spans many scientific and engineering disciplines. • There are a vast number of end-product applications, many unique. • The industry is draped in secrecy.
Now, with a minimal understanding of the nanotechnology market complexity, the nanostage is set to discuss the priorities the analytical instrument manufacturers consider important to nanomaterial characterization:
• What nanomaterial characteristics are important to know? • What existing instruments can be adapted to nanomaterial characterization? • What environments should nanomaterials be measured in? • In today's worrisome global economic climate, how is the Return on Investment (ROI) justified for new instrument commercialization (or how large is the market, and how long is the payback period before a profit is realized)?
Discussion
What nanomaterial characteristics are important to know?
The excitement regarding the synthesis and application of nanomaterials is based on the fact that, because of the very small size, the characteristics and behavior are quite different to bulk materials with the same composition. As a result, the range of nanomaterial parameters that have to be assessed to characterize nanomaterials is large (Salamon et al., 2010).
Aleck Stefaniak has “summarized twenty-three different physio-chemical material properties that were identified as important for NO characterization as part of the risk assessment process collected from published literature” (Stefaniak et al., 2012). I have chosen to address nine key characteristics that contribute to the uniqueness of nanomaterials, and these are depicted in Fig. 2.

The nine most common characteristics needed to understand and define a nano-object (or nanoparticle) are depicted above. Reprinted with permission from Hassellhov and Kaegl (2009).
The nine most common nanomaterial characteristics are the size of the particle, their shape, size distribution, concentration, agglomeration, surface characteristics, the presence of surface coatings, the presence of impurities, and structure (Hassellhov and Kaegl, 2009; Stefaniak et al., 2012). “Consequently, at the nanoscale, there are considerable analytical measurement challenges, including the ability to use, for example, one technique such as ICP-MS to measure the elemental concentration of gold in a suspension as the only metric, does not provide enough information to thoroughly understand the nanomaterial” (Salamon et al., 2010). Currently, there are more than 35 analytical techniques available to characterize these nine basic nanomaterial characteristics.
What existing instruments apply to nanomaterial characterization?
Seven of the nine nanomaterial characteristics, particle size, size distribution, surface charge, surface area, shape, agglomeration, and structure, have traditionally been characterized by one of the following analytical techniques:
• Four electron microscopy techniques: scanning electron microscopy (SEM), transmission electron microscopy, atomic force microscopy, and confocal microscopy • Four other analytical techniques: dynamic light scattering, field flow fractionation, molecular gas adsorption (BET), and electrophoresis • Ultraviolet/visible spectroscopy (UV/Vis) and fluorescence spectroscopy (FL) are used for particle-size identification if the material is known and if it is reflective. FL is also used for agglomeration studies.
For the remaining characteristics, nanoparticle concentration and composition, there are many analytical techniques to choose. The correct analytical technique is determined by the material type, their functional coatings, and application. Nanoparticle concentration may be characterized by one or several of the following analytical techniques: ICP-MS, LC-MS, UV/Vis, and FL. Nanoparticle composition may be characterized by several analytical techniques: ICP-MS, LC-MS, UV/Vis, FL, thermogravimetry analysis (TGA), differential scanning calorimetry, dynamic mechanical analysis, Fourier-transform infrared spectroscopy (FTIR), Raman spectroscopy, and hyphenated techniques of TGA (gas chromatography–mass spectroscopy [TGA-GC-MS], TGA-MS, and TGA-FTIR). The nine basic nanomaterial characteristics provide the basic knowledge to proceed to product development and manufacture. “Heavy characterization is necessary to establish existence, synthesis, and properties” (Richman and Hutchinson, 2009).
For composition, the purity or the coating on a nanomaterial may be of interest. As described above, there are many analytical techniques that can characterize nanomaterials, but there is no silver bullet. There is no single instrument that can do it all. More perplexing is that multiple instrument manufacturers may provide instrument solutions that exacerbate the need for specific skills to precisely prepare samples, maneuver through different instrument software packages, and finally obtain and interpret the data.
Nanoscientists' first choice for characterization is to use the analytical techniques readily available. Once these available techniques have completed their usefulness, then alternate instrumentation is sought out and added to their laboratories. Often overlooked by nanomaterial laboratory managers and scientists, it is the time consumed for scheduling routine instrument servicing, especially when there is the need for potentially nine different instrument manufacturers' service calls. To prevent a potential servicing nightmare, some nanomaterial laboratories use a single vendor to coordinate the servicing of all laboratory instruments. This cost–effective laboratory resource management is becoming the norm (PerkinElmer, 2012).
Where are we now?
As Richman and Hutchinson recognized in 2009, there was and still is today an instrumentation bottleneck when advancing the use of nanomaterials through production and application product stages. “Production characterization is mostly concerned with batch-to-batch variation and maintaining advertised functions or properties (Richman and Hutchinson, 2009).” The progression to commercialize simple, easy-to-use, accurate, reproducible instruments for nanomanufacturing is still lagging the nanoproducts' race to the market.
Adding more complications to the characterization task is a concern voiced by a group of international toxicologists. They are concerned that there are not enough certified reference nanomaterials to calibrate instruments.
A substantial commitment in resources (both financial and time) is required to develop a reference material (RM) and, more specifically, a certified RM (CRM), one that is accompanied by an appropriately determined measurement uncertainty and a detailed metrological traceability assessment, often produced by imprimatur of endorsement by formally recognized or government-mandated standards development bodies (Roebben and Emons, 2011; Stefaniak et al., 2012).
In the case of nan-objects [a material with one, two, or three external dimensions in the nanoscale (ISO, 2010)], progress toward development of nanoscale RMs is inhibited by: (1) the lack of user consensus on needs and applications; (2) the need for multiple-target measurements to enable safety testing as opposed to measurement of individual properties; and (3) the fact that nanotechnology development has far outpaced toxicology and the development of scientifically sound, validated and widely adopted characterization methods needed to assign relevant measurements and values to RMs.
In addition to nanoscale RMs for risk assessment, RMs are needed for performance control and instrument calibration (Stefaniak et al., 2012).
Stefaniak rigorously examines the opportunities of RMs and further suggests, “As such, an opportunity exists for metrology and risk assessment communities to clarify whether RMs are truly needed or whether ‘test materials,’ based, for example, on the NOs…carry no reference or certified values may be useful for hypothesis testing or to facilitate the inter-laboratory reproducibility aspect of method validation studies.…A separate term such as ‘representative test material’ (RTM) might be more appropriate” (Stefaniak, 2012). Currently, the instruments are calibrated using available RMs, CRMs, and RTMs. Until RM certification expands, RTMs will have to suffice to enable toxicologists to catch up to the ever-growing number of nanobased products available to the industry and consumers.
What environments should nanomaterials be measured in?
The nanomaterial manufacturing process illustrated in the simple diagram in Fig. 1 depicts nanomanufacturing waste streams. Nanomaterials may enter the environment via air, water, or contact transfer during manufacturing, product use, or through end of product life, as they transform in landfills, bodies of water, or soils and sediments. The EHS of manufacturing personnel is probably the first population and environment of concern, and secondly are industry and consumers' environment, as they use nanomaterial products at work, home, at play, indoors, and out-of-door environments.
“Process waste has always been a manufacturing issue. Now with the introduction of nanoparticles this raises new issues for consideration as nanowaste is different from bulk waste” (Salamon et al., 2010). Laboratory toxicology experiments have shown that nanomaterials can enter the human body through inhalation, ingestion, dermal exposure, or ocular exposure (NNI, 2009). As a result, government and academic scientists and engineers are investigating nanomaterial-exposure-sensing devices for the workplace.
The development of commercially available nanomaterial sensors and nanomaterial protective wear continues, but are not yet 100% proven. Many nanomaterial manufacturers and nanomaterial formulators are addressing EHS issues by following the bulk-material regulations and working with the National Institute for Occupational Safety and Health (NIOSH) and the U.S. Environmental Protection Agency (EPA) to establish new nanomaterial EHS guidelines and nanowaste disposal guidelines. The NIOSH has recently published a nanotechnology research safety guideline, entitled General Safe Practices for Working with Engineered Nanomaterials in Research Laboratories (NIOSH, 2012). The U.S. Food & Drug Administration has published a food manufacturers' nanotechnology guide for food additives (U.S. FDA, 2012).
Laboratory equipment used for discovery and R&D is expanding its roles for the new methods of characterization for the environment. Until recently, nanomaterial characterization by the ICP-MS addressed just two parameters of the nine basic parameters (Fig. 2): composition and concentration. New, high-speed electronics and faster data rates enable the ICP-MS instruments to characterize five nanomaterial parameters: composition, concentration, size, size distribution, and agglomeration. A new method called single-particle–ICP-MS (SP-ICP-MS) has emerged. Many academics and government agencies are using this technique to investigate low levels of nanoparticles in the environment. Heithmar, of the U.S. EPA in Las Vegas, has been using SP-ICP-MS to investigate silver ENM transformation in surface waters.
Most ENMs currently in production can be categorized as either metal-containing ENMs (i.e., metals, metal oxides, or semiconducting quantum dots) or carbon-based (i.e., fullerenes and their derivatives, and carbon nanotubes). ENMs containing metals have a greater potential to enter the environment than carbon-based ENMs. This is a result of the fact that the major uses of metal-containing ENMs are in dispersive applications, while carbon-based ENMs are generally incorporated into solid composites. This increased exposure potential for metal-containing ENMs has motivated intense research into their environmental processes, such as transformation, transport and fate, exposure pathways, and potential adverse effects on humans and sensitive organisms.…SP-ICP-MS has demonstrated promise as a practical analytical method for characterization of metal-containing ENMs in environmental waters…. SP-ICP-MS is capable of sample throughputs of over twenty samples per hour (Heithmar, 2011).
The work presented in Figs. 3, 4, and 5 are data of the characterization of gold nanoparticles by the SP-ICP-MS.
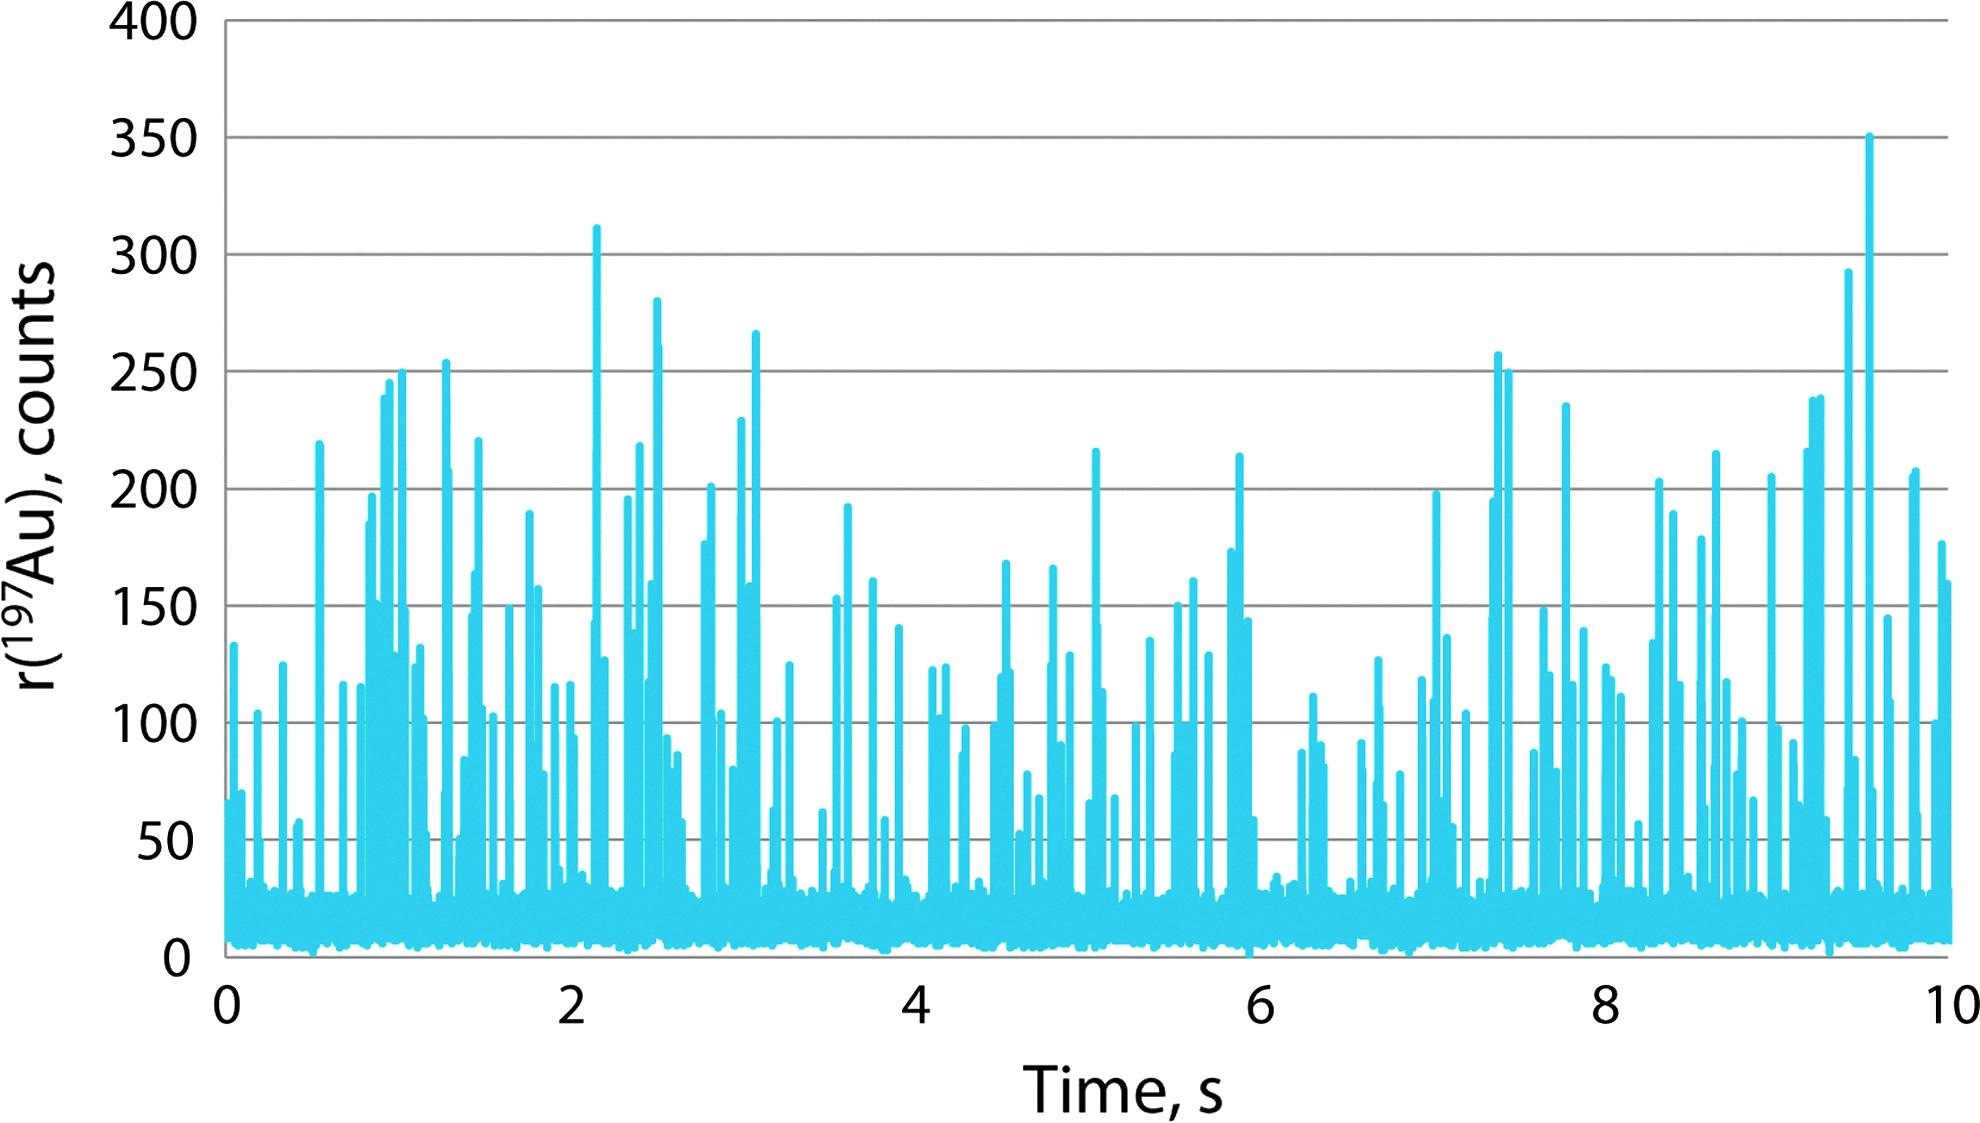
The general pattern of obtained signal when measuring nanoparticles (NPs) in single particle ICP-MS mode is displayed above. This is the analysis of 10-ppb Au+50 nm Au NPs+80 Au NPs. Reprinted with permission from Stephan (2012).
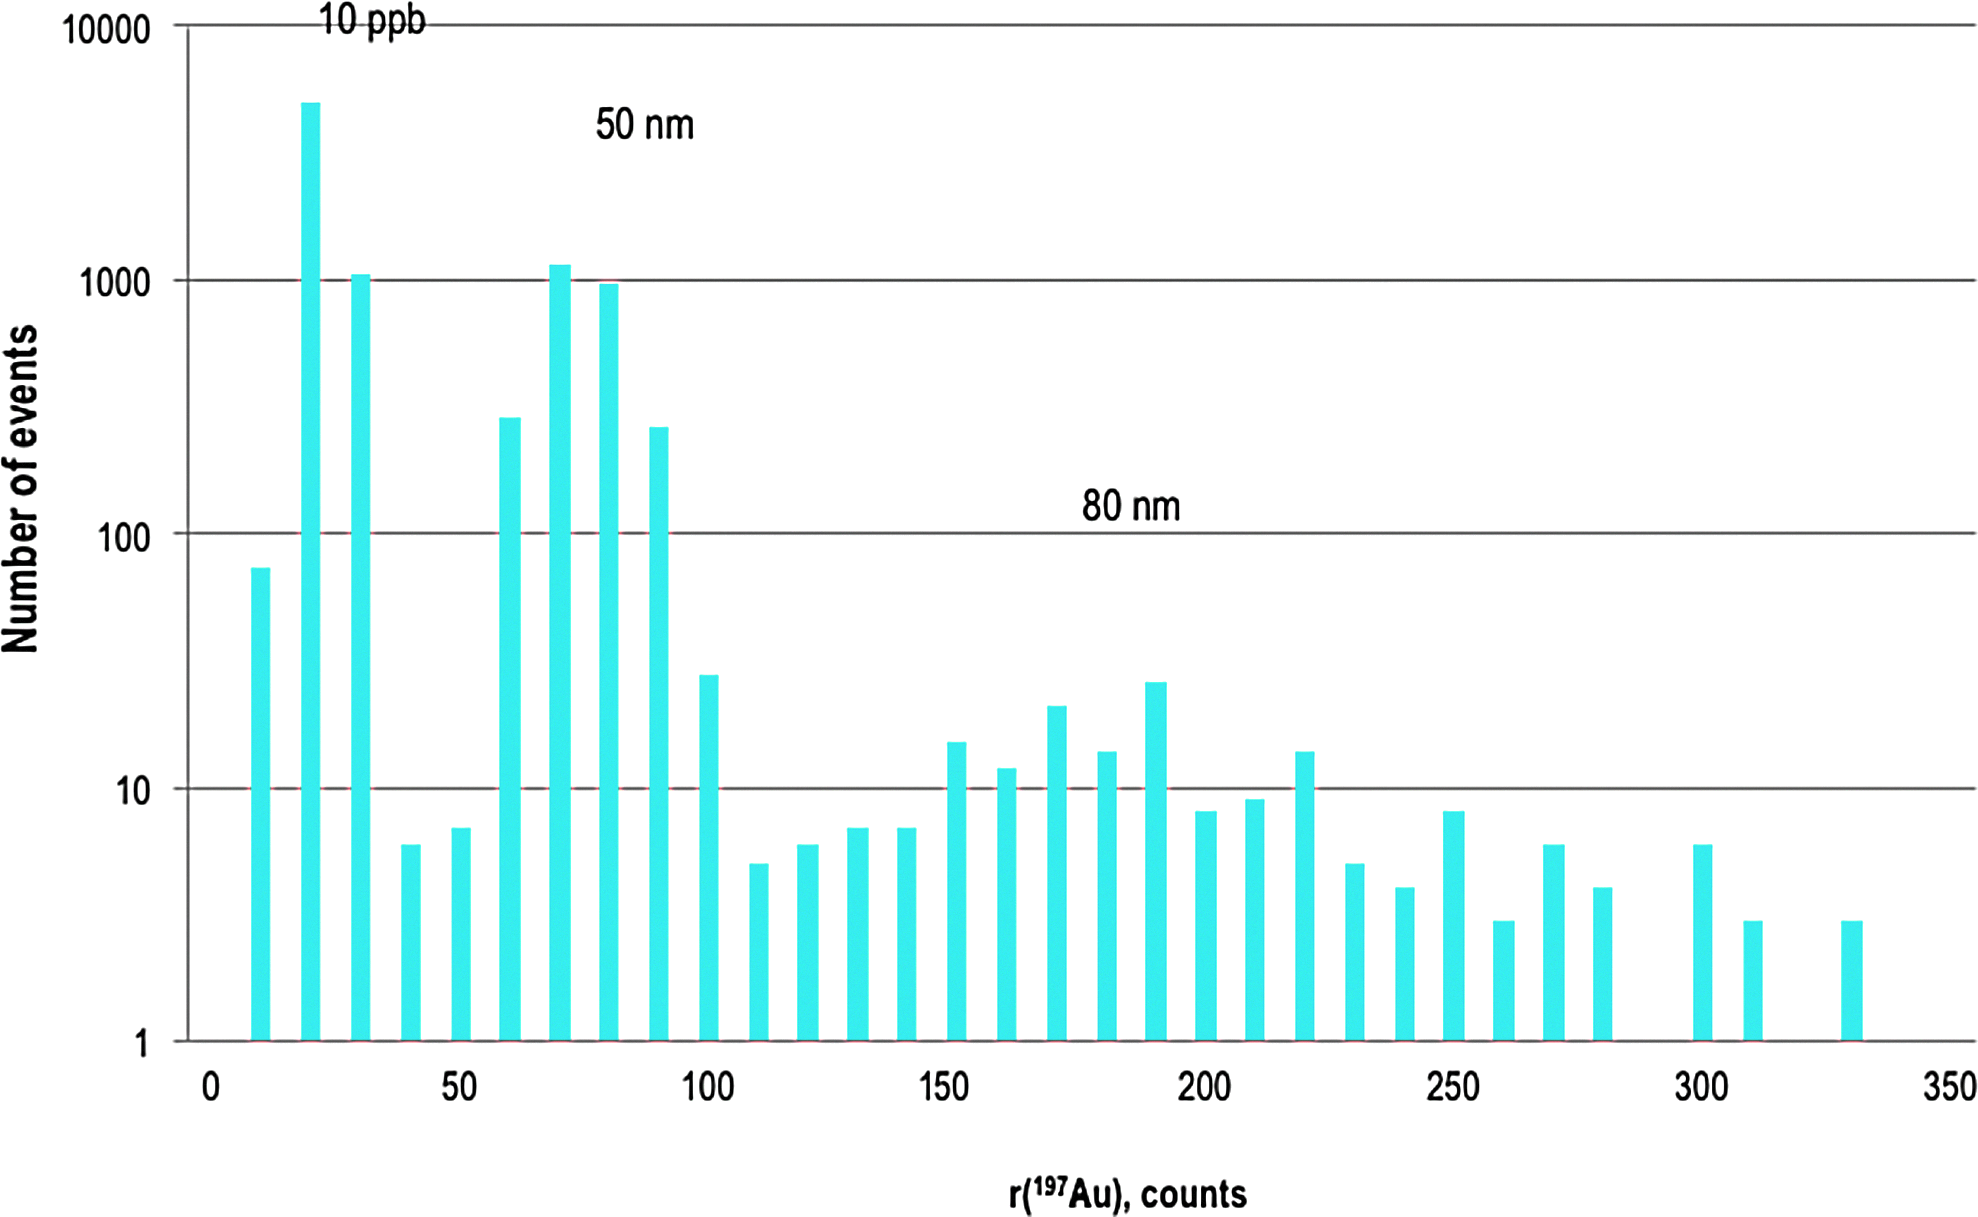
This figure illustrates the ability to differentiate different particle sizes from dissolved Au. This is the analysis of 10-ppb Au (dissolved)+50 nm Au NPs+80 Au NPs. Reprinted with permission from Stephan (2012).

This figure illustrates the ability to differentiate two different particle sizes, 50 nm Au NPs and 80 Au NPs. Reprinted with permission from Stephan (2012).
Gold nanoparticle standard reference materials (RM 8011, RM 8012, and RM 8013–NIST®, Gaithersburg, MD) were used to represent samples.…[This instrument] is equipped with a high-speed mass analyzer which has a scan rate that exceeds 5000 data points/sec, a read speed that exceeds 3000 points/sec, a slew speed of 1.6 million amu/sec, and a detector capable of integrating ionic signals at a dwell time as short as 100 μsec with a settling time of only 50 μsec. Combined with a unique ion path design (Triple Cone Interface [TCI] and Quadrupole Ion Deflector [QID])…assesses nanoparticle fate, transformation, and transportation in different matrices (i.e., environmental, biological, food, etc.) (Stephan, 2012).
Since this new method, the SP-ICP-MS, is gaining global traction, the International Organization for Standardization (ISO) Technical Committee 229, Nanotechnologies, is conducting a round-robin test to validate NP characterization for counting and size by the SP-ICP-MS. Within ISO TC 229, Working Group 3, Health, Safety, and the Environment brought this testing proposal forth, and ISO TC 229 Working Group 2, Metrology—Measurements and Characterization, will review this work.
The U.S. EPA is not only interested in metal-based NPs, but is concerned with multiwalled carbon nanotubes (MWCNTs). They have implemented a Significant New Use Rule (SNUR) that applies to
multi-walled carbon nanotubes (MWCNT) which was the subject of premanufacture notice (PMN) P-08-199.…[The final SNUR states,] any person intending to manufacture, import, or process the substance for a use other than as an additive/filler for polymer composites and support media for industrial catalysts must submit a SNUR (in accordance with the requirements of 40 CFR part 721, subpart A) at least 90 days before commencing such use (U.S. EPA, 2011).
The U.S. EPA is also studying the environmental implications of carbon nanotubes (CNTs) filled composite materials. Recently, Sahle-Demessie, of the U.S. EPA in Cincinnati, has led this effort using TGA. TGA lends itself to the characterization of CNTs and other nanocomposites.
TGA was the first analytical technique chosen to compare the effects of UV exposure times on CNTs…In a laboratory environment, three high purity MWCNTs samples that had no specific wrap were analyzed. They were nearly the same weight and came from the manufacturing lot. They were subjected to the same UV light source. The intent of the UV light is to simulate sunlight in a controlled manner. Three samples were exposed to UV for 9.0 h, 5.5 h, and 4.0 h…then run in the TGA in an oxidative environment to 900°C (Sahle-Demessie, 2011).
Figures 6 and 7 are the TGA data collected. Additional scanning electron microscope (SEM) images, not shown here, indicated that the CNT lattice deteriorated due to the UV exposure.

x axis=temperature: When observing thermogravimetric weight-loss curves in regard to temperature, the weight-loss curves above indicate that carbon nanotubes (CNTs) exposed to UV light for 9 h began decomposition at a lower temperature than the other two samples of shorter exposures. Reprinted with permission from Sahle-Demessie et al. (2011).
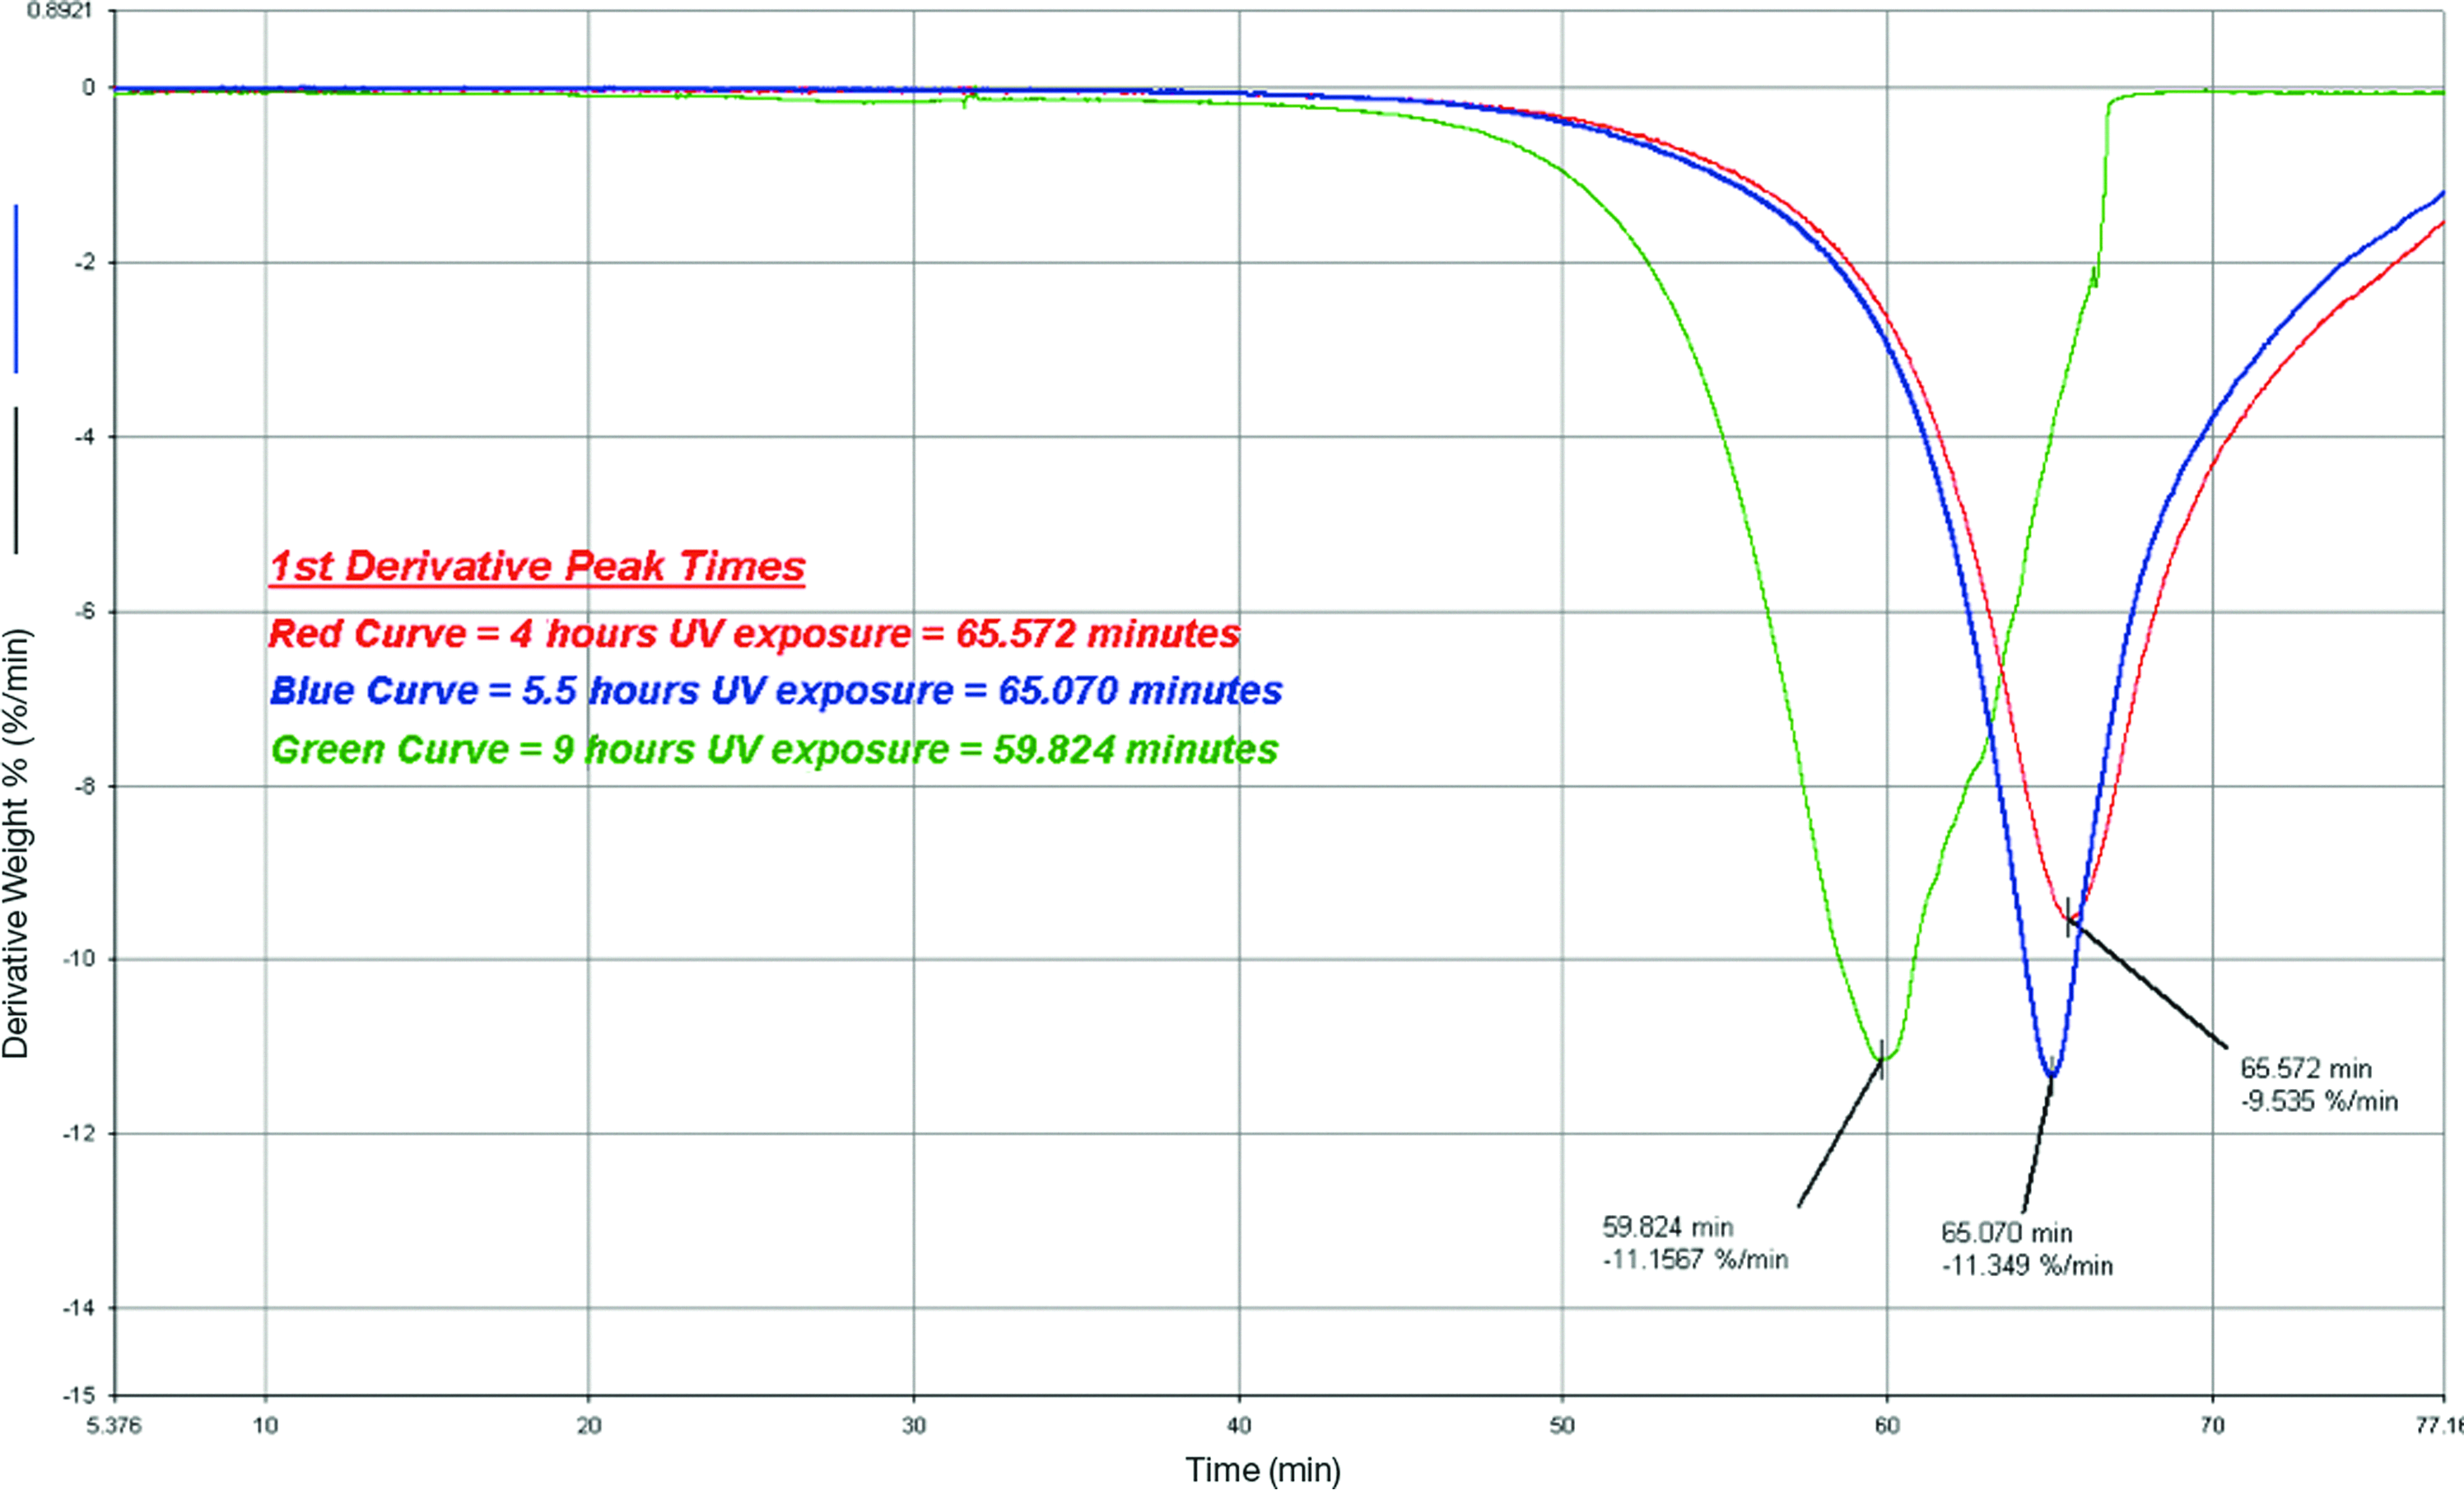
x axis=time: To gain a better understanding of the results, the same data file is displayed on a Time x-axis. The 1st derivative curve of each weight-loss curve is displayed. The 1st derivative is a widely used tool to compliment the thermogravimetry analysis (TGA) weight-loss curve, and like the weight loss curve, the 1st derivative curve is very reproducible. Upon examination of the 1st derivative curves above, the CNT sample with the longest UV exposure decomposes more than 5 min before the other two samples of shorter exposure times. Reprinted with permission from Sahle-Demessie et al. (2011).
How is ROI justified to commercialize a new instrument?
As nanotechnology grows and touches nearly every segment of our lives, new instruments will be required to simply and accurately characterize the appropriate nanomaterial characteristics. Currently, no instrument company can accomplish this task of developing a new, commercially available, nanospecific instrument without support from private industry, academia, or government. The size of a nanotechnology instrument market, for completely new instruments, is not completely understood and is considered a high-risk investment by some instrument manufacturers. However, if the financial burden is shared, then new instruments could be developed to meet the nanoscience's need. In the coming years, the demand for new nanomaterial characterization methods and instruments will rocket. Trying to keep up with this market growth and delivering new instruments to the nanotechnology market will be a challenge. Identifying the right market niche can only be accomplished by two particular types of collaborative relationships that share the burden of investment. The first collaborative relationship is private–private collaborations between nanotechnology industry/academia and instrument manufacturers, where vested shareholders in nanotechnology projects identify instrument requirements and share the research and development costs. The second collaborative relationship is the public–private collaboration, where government agencies and instrument manufacturers join forces to fund and develop new methods, software, and instruments. Currently, all the nanomaterials were characterized in a laboratory setting. Hopefully, future collaborations will result in the development of new laboratory instruments and new field-deployable instruments. These new instruments will be driven by future industry regulations.
Summary
Nanotechnology is truly an amazing science where all parties are proactive in maintaining a safe environment. The synergy of public and private entities with instrument manufacturers is beginning to materialize. The timeframe for new laboratory instruments and field-deployable instruments are on the far horizon, but until then, new methods for existing laboratory-based analytical instruments are progressing. The potential of nanoapplication expansion is nearly unlimited, and instrument manufacturers will meet the challenges brought forth by these new markets.