
Abstract
Abstract
Our understanding of biofilm function has been greatly increased with the aid of one-dimensional biofilm models. However, to date, there has been no evaluation of how the inclusion or exclusion of nitrite within nitrification/denitrification biofilm models may impact simulated prediction of the biofilm community composition and effluent water quality. As such, several variations of commonly assumed nitrification and denitrification models with a common set of kinetic parameters were simulated in a one-dimensional membrane-aerated biofilm model to identify the differences in simulation output with respect to simultaneous nitrification and denitrification. Our results indicated that the inclusion of nitrite as an intermediate affected the biofilm community composition, microbial activity, and effluent water quality. Even under circumstances when the predicted water quality results were similar, significant differences persisted in the microbial activity. For example, chemical oxygen demand (COD) removal was independent of the including nitrite as an intermediate; however, the processes that contributed to COD removal (i.e., aerobic oxidation vs. anoxic denitrification) varied considerably between model assumptions, and as a result, affected differences between the predicted oxygen demand. Simulations also helped to identify inefficiencies caused by nitrite looping, a phenomenon in which NO2− cycles between oxidation within aerobic regions and reduction within anoxic regions. Overall, results indicated that if one-dimensional biofilm models are used to inform our understanding of fundamental biofilm processes, then the manner in which nitrite is modeled must be carefully considered to avoid introducing modeling artifacts into our interpretation of simulation results.
Introduction
A variety of models have been used by researchers to simulate nitrogen dynamics in biofilms (Table 1). As a basis for the current work, all permutations of one-step and two-step nitrification and denitrification biopathways are considered (Table 2). Essentially, the models are defined by the inclusion or exclusion of nitrite (NO2−) within nitrification and denitrification biopathways. Inclusion of NO2− increases the number of processes modeled, thereby increasing the complexity of the model. Two different methodologies for modeling denitrification have been typically adopted by past modeling efforts. The first category, parallel denitrification, assumes that both NO3− and NO2− can be reduced to nitrogen gas (N2), but NO3− reduction does not proceed via the intermediate product NO2− before terminating as N2 (Matsumoto et al., 2007; Downing and Nerenberg, 2008; Lackner et al., 2008; Wang et al., 2009). The second category, sequential denitrification, assumes that NO3− reduction must proceed through NO2− before being reduced to N2 (Tiedje, 1998).
Anammo×® (Pagues BV, Balk, The Netherlands), anaerobic ammonium oxidation.
1N1D, one-step nitrification, one-step denitrification; 1N2D Seq, one-step nitrification, two-step sequential denitrification; 2N1D, two-step nitrification, one-step denitrification; 2N2D Seq, two-step nitrification, two-step sequential denitrification; 2N2D Par, two-step nitrification, parallel denitrification.
The degree of model complexity is often chosen based upon the bulk liquid NO2− concentrations. For example, if the NO2− concentrations in the bulk liquid are minimal, the modeler may choose to exclude NO2− as in the suite of activated sludge models (ASM) (Henze et al., 2000); however, this approach may be ill advised since NO2− could be a critical component governing the rate of biological processes within the biofilm, even though it does not appear to be of any significance given the bulk water quality data (e.g., de Beer et al., 1997).
A survey of one-dimensional biofilm models detailed the various nitrification and denitrification models that have been used in past works (Table 1). Aside from Elenter et al. (2007), every model that used two-step nitrification studied nitritation in which NO2− was the desired end product of nitrification. Even though sequential denitrification was the most used two-step mechanism for ASM (Sin et al., 2008), the authors of this manuscript are not aware of a one-dimensional biofilm model published in literature that has considered modeling denitrification in this manner. Although a thorough comparison of nitrification and denitrification reactor model results with and without nitrite as an intermediate have not been investigated previously, critical modeling aspects such as kinetics and rate expressions have been discussed elsewhere (Carrera et al., 2004; Latimer et al., 2009).
One of the primary reasons that research interest has been directed toward nitrogen removal pathways in biofilm-based technologies is the proficiency of biofilms to develop a redox-stratified condition that supports efficient nitrogen elimination pathways such as simultaneous nitrification and denitrification (SND) and deammonification (combination of partial nitritation and anaerobic ammonium oxidation). The membrane-aerated biofilm reactor (MABR), in which, oxygen-permeable membranes serve as both a means of biofilm immobilization and aeration, is one such technology that is particularly adept at supporting both SND and deammonification (Syron and Casey, 2008).
This study aims to examine the effects of commonly applied nitrification and denitrification models on one-dimensional membrane-aerated biofilm models performing SND. To achieve this goal, we modeled the biofilm community composition and water quality of a membrane-aerated biofilm using five combinations of nitrification—denitrification pathways using a common set of kinetic parameters (Table 2). In addition, we also explored the differences due to the type of waste stream treated and associated nitrogenous loading rate.
Experimental Protocols
Development of mathematical models
A multispecies MABR was modeled using the one-dimensional biofilm reactor compartment of the simulation software Aquasim 2.1g (Reichert, 1998). A diffusive link within the Aquasim software was used to link a completely mixed gas compartment with the base of the biofilm compartment such that a counter-diffusion biofilm was simulated (Debus and Wanner, 1992). The biofilm was assumed to be rigid (i.e., porosity throughout the biofilm is constant) with a constant liquid volume fraction (ɛl) of 0.75 (Koch et al., 2000). The simulated reactor had a confined reactor volume of 5×10⁻³ m3 and was supplied with oxygen via 250 siloxane membranes, each 300mm long with outer and inner diameters of 2 and 0.8 mm, respectively, that yielded a biofilm attachment surface area of 0.75 m2. Since the microbial population is attached directly to the oxygenation source (i.e., the shell-side of the membrane), oxygen transfer efficiencies are relatively high compared to other aerated biological processes. Additionally, oxygen gradients within the biofilm can be better controlled, thereby allowing redox-stratified conditions necessary for SND and deammonification to develop throughout the biofilm's depth.
Five models based upon the inclusion or exclusion of nitrite as an intermediate within nitrification and denitrification models were used as the basis for this study (Table 2). One-step nitrification was catalyzed by a lumped microbial group, autotrophic nitrifying organisms (ANO), while two-step nitrification was characterized by ammonium oxidizing organisms (AOO) and nitrite oxidizing organisms (NOO). Ordinary heterotrophic organisms (OHO), anaerobic ammonium oxidizing organisms (AMO), and particulate undegradable organics (U) were incorporated into all model variations. Stoichiometric parameters for AMO were selected from an elemental balance conducted by Takacs et al. (2007). All kinetic and stoichiometric parameters included in the model simulations, as well as the stoichiometric matrix, are detailed in the Supplementary Data (Supplementary Tables S1–S4). Parameter notation was applied according to a recently proposed standardized framework for wastewater treatment modeling (Corominas et al., 2010). The reaction rate expressions used in this study were similar to Matsumoto et al. (2007) (Supplementary Table S5).
The one-step nitrification, one-step denitrification (1N1D) model was the only simulation that did not actively model AMO since NO2− production was not included. Heterotrophic growth occurred during aerobic and anoxic conditions with a reduction factor to account for a decreased activity when NOx (NO2− or NO3−) was utilized as the electron acceptor. All models assumed that NHx was released during decay and assimilated during growth reactions. Endogenous decay was modeled under aerobic and anoxic conditions for heterotrophs and autotrophs (Manser et al., 2006). Oxygen flux, JO2, followed a mechanistic oxygen transfer model derived via an oxygen mass balance around the lumen of a hollow fiber membrane (Gilmore et al., 2009):
where n is the number of membranes; Qair is the volumetric airflow rate; H is the nondimensional Henry's law constant; SO2,F and SO2,G are the concentrations of oxygen at the biofilm base and within the membrane lumen, respectively; d, l, and δ are the inner diameter, length, and thickness of the membranes, respectively; DO2,silicone is the diffusion coefficient of oxygen in silicone, and KG is the membrane/air partition coefficient. The biofilm's area, A, was modeled as if grown on a cylindrical base such as a hollow fiber membrane:
where z is the distance perpendicular from the substratum. The biomass detachment velocity, ude, was calculated in the same manner as Lackner et al. (2008):
where uF is the biofilm growth velocity, LF is the biofilm thickness, and LF,max is the maximum biofilm thickness.
Model simulations
The biofilm was discretized into 20 grid points, and each simulation spanned 100 days with time steps of 0.01 days. Within the 100 days of simulation time, steady state was reached with respect to a biomass concentration, soluble species concentration, and biofilm thickness. The treatment of three different wastewaters was simulated to determine the impact of the various nitrification and denitrification mechanisms on a range of waste types. The simulated wastewaters were a primary effluent characteristic of a domestic wastewater treatment plant, a septic tank effluent, and a centrate sidestream from an anaerobically digested sludge. Waste stream characteristics and modeled parameters are detailed in Table 3. Simulated biofilm thickness and intramembrane partial pressure were chosen based on an iterative process to maximize total nitrogen (TN) removal via SND for each waste stream whenever simulated using the two-step nitrification, two-step sequential denitrification (2N2D Seq) model type.
Sufficient alkalinity for complete nitrification.
Assumed as 50% of the stoichiometric alkalinity requirement for nitrification.
COD, chemical oxygen demand; STE, septic tank effluent.
To more clearly identify the inherent differences that could be propagated by including nitrite as an intermediate within nitrification and denitrification biofilm models, three separate studies with varying levels of complexity were examined. Study 1 only examined the centrate sidestream at a nitrogen-loading rate of 1.25 g-N/day (1.67 g-N/m2-day). Since only one waste type and loading rate were simulated, it was possible to evaluate the differences between the nitrification and denitrification models types for a broad range of outputs, including substrate removal rates/efficiencies, substrate profiles inside of a simulated biofilm, biomass profiles inside of a simulated biofilm, and process contribution toward the overall substrate flux. Study 2 determined whether waste type/strength impacted the variances between model types as noted in Study 1, but only evaluated chemical oxygen demand (COD) and TN removal as well as O2 flux. Finally, Study 3 extended the previous two studies to include the differences between steady-state models due to changes in mass loading rates of each wastewater.
Process contribution toward substrate removal rates
Contributions of each process toward the total flux, J, of soluble species Si were quantified by using a trapezoidal approximation:
where
Results
Hypothesized differences caused by including nitrite as an intermediate
As a starting point for this study, some of the hypothesized differences in model output as caused by nuances in each model's nitrification and denitrification biopathways are highlighted below. Obviously, one-step nitrification models (1N1D and one-step nitrification, two-step sequential denitrification [1N2D Seq]) would not accurately capture the flux of NO2−. As such, it should be noted that this article did not attempt to compare the accuracy of the five nitrification and denitrification model types; rather, this study was an attempt to compare differences in their simulation output under a consistent set of kinetic parameters. Even though AMO species were included in the modeling framework, it would be expected that the AMO activity would be negligible since the simulations were designed to optimize the degree of SND under relatively high oxygen fluxes when compared to MABR modeling studies specifically optimized for AMO growth (Lackner et al., 2008). The 1N2D Seq model type had questionable utility since it was the only model type that had not been modeled in literature. It was included in this exercise to provide exhaustive coverage of all permutations attainable via one-step and two-step nitrification and denitrification models. Although not used in practice, the 1N2D Seq model type should provide a unique simulation in which, no aerobic NO2− sinks exist; thereby, all of the effluent NO2− would be attributable to incomplete denitrification. Another unique situation was expected for the 2N2D Par (two-step nitrification, parallel denitrification) model type in which, the modeler could quantify the contribution of short-cut denitrification (i.e., the mass of NO2− reduced directly to N2 via denitrifying OHO before being oxidized to NO3− by NOO). Since short-cut denitrification was modeled using a specific biopathway for the 2N2D Par model type, it was hypothesized that this model would report the highest TN removal when compared to the other model types, especially for centrate sidestream due to its carbon-limited nature and the inherently efficient utilization of COD that is characteristic of short-cut denitrification (Ahn, 2006). Finally, the 2N2D Seq model type could produce a special scenario called nitrite looping: a phenomenon in which, NO2− that was reduced by denitrifying OHOs was reoxidized to NO3− by NOOs rather than being further reduced to N2 via the denitrification pathway (Latimer et al., 2009; Landes et al., 2011). Since NO2− reduction efficiency could be diminished as a result of nitrite looping, lower TN fluxes were expected for the 2N2D Seq model type.
Study 1—identifying variations in model output
All of the results for Study 1 were based upon the simulated capacity of a MABR to treat centrate at a nitrogen loading of 1.25 g-N/day (1.67 g-N/m2-day). Oxygen flux was adjusted to optimize SND for the 2N2D Seq model. Percent COD (∼100%) and NHx (56.2–61.9%) removal were similar for all models types, while TN removal efficiencies displayed some variance between model types (Table 4). As hypothesized, the 2N2D Par model exhibited the highest TN removal efficiency (32.2%), whereas the 2N2D Seq model produced the lowest percent TN removals (20.8%). Effluent NHx concentrations varied as much as 34 g-N/m3 between model types. The only model type that resulted in substantial bulk liquid NO2− concentrations (86 g-N/m3) was the 1N2D Seq model type in which, an unexpectedly large fraction of incomplete denitrification was simulated. Although this result seems like an outlier in the current study, incomplete denitrification may be a reasonable occurrence within MABRs characterized by thin, oxygen penetrated biofilms since oxygen completely inhibits the nitrite reductase, while partially inhibiting the nitrate reductase (Phillips et al., 2002).
The differences in model output were further investigated by plotting the steady-state substrate concentration profiles in a biofilm (Fig. 1). Concentration profiles within the biofilm were relatively flat for NHx and NOx (i.e., the concentration at z=0 was equal to the concentration at z=Lmax) indicating that the diffusional flux was equivalent to the flux of microbial conversion. Nonetheless, unique nitrogen profiles were generated by the sequential denitrification model types. The 1N2D Seq model produced elevated NO2− concentrations, while the 2N2D Seq model resulted in the highest NHx (Fig. 1).

Steady-state substrate profiles at a nitrogen loading of 1.25 g-N/day (1.67 g-N/m2-day) for treatment of centrate sidestream waste.
For all model types, O2 penetrated to a depth of ∼270 μm (54% of Lmax) before the O2 concentrations dropped below the O2 half-saturation constant for nitrifiers (KO2=0.5 g-O2/m3). The depth of simulated O2 diffusion agreed relatively well with an experimental study that treated a carbon-limited waste (total organic carbon:N=1.1) using an MABR in which, O2 diffused 18–43% of the total biofilm depth (Terada et al., 2003). Finally, the HCO3− concentrations throughout the biofilm were well below the HCO3− half-saturation constant for ANO/AOO (KHCO3=1.78 mol/m3) (Fig. 1), thereby limiting the NHx removal efficiencies for all model simulations to ∼60% (Table 4). It should be noted that the estimated NHx removal efficiencies would only be ∼50% if not for the denitrification-produced alkalinity.
Although water quality was relatively similar for all models, there were significant differences in the predicted biofilm community composition. The sequential biofilm models (1N2D Seq and 2N2D Seq) were characterized by sharper transitions in the OHO volume fraction indicating that heterotrophic bacteria occupied a smaller fraction of the biofilm depth (Fig. 2). Since less competition between nitrifying and heterotrophic bacteria would exist for the sequential model types due to the lower OHO populations in the aerated portions of the biofilm, it was assumed that the sequential model types would simulate higher rates of the nitrifying activity. On the contrary, the sequential model types produced the lowest percent NHx removals when compared to the other model types (Table 4). Although the NHx removal efficiencies for the 1N2D Seq model type did not deviate significantly from the remaining models, the 2N2D Seq simulations produced unique NHx results. Interestingly, the primary cause for the contrast between 2N2D Seq model simulations and the remaining models was explained by the competition for oxygen exerted by NOO as shown by the distinctively large NOO volume fraction profile (Fig. 2). The maximum NOO volume fraction within a given biofilm slice for the 2N2D Seq model was 7.8%, whereas the other two model types that considered NOO (two-step nitrification, one-step denitrification [2N1D] and 2N2D Par) displayed maximum values of 3.5%. Similarly, as determined by integrating the curves in Fig. 2, the cumulative NOO biomass concentration for the 2N2D Seq model was 0.76 g/m2, almost two-fold greater than the 2N1D and 2N2D Par model types that both reported NOO concentrations of 0.41 g/m2.
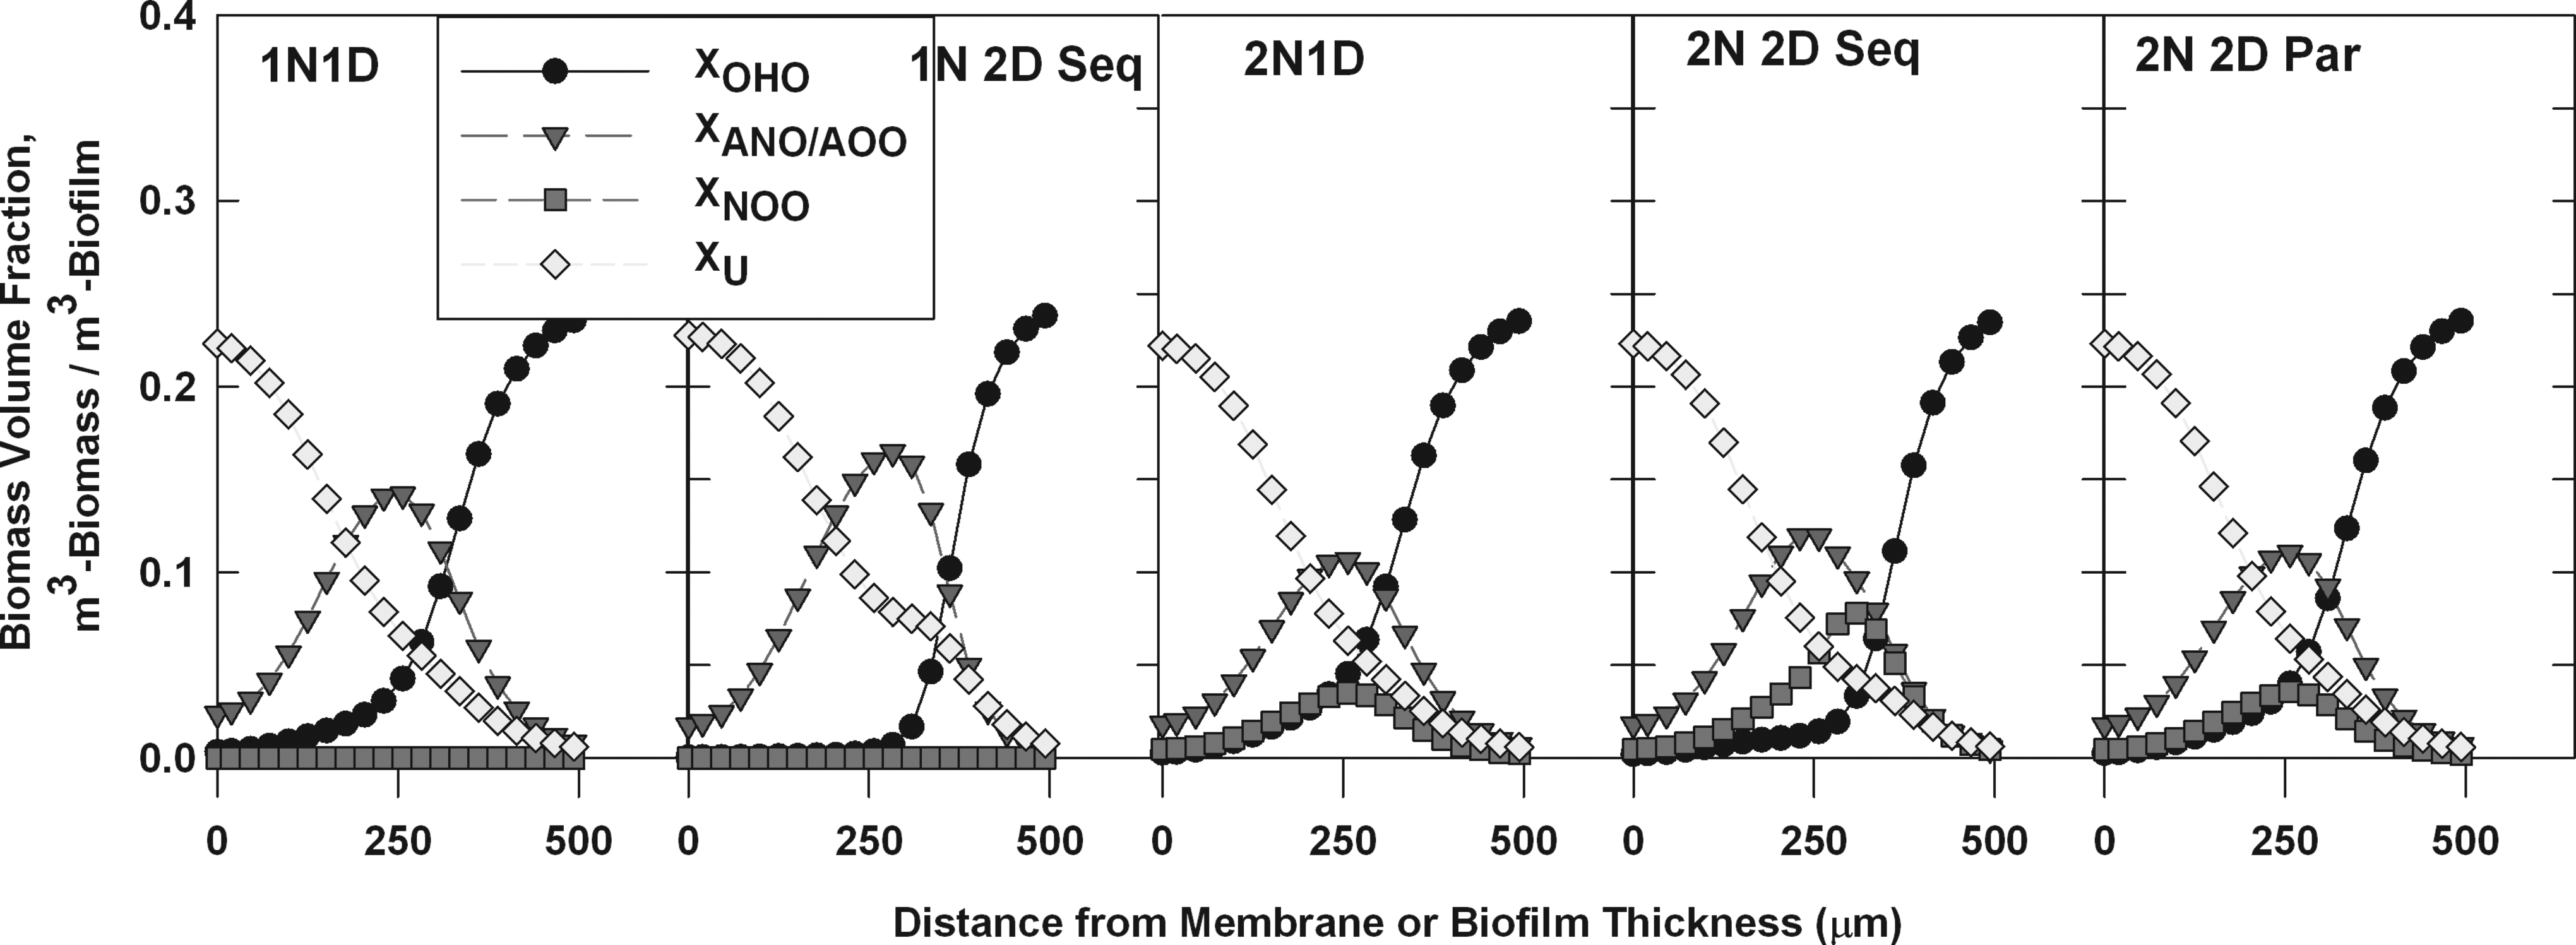
Steady-state biomass profiles at a nitrogen loading of 1.25 g-N/day (1.67 g-N/m2-day) for treatment of centrate sidestream waste.
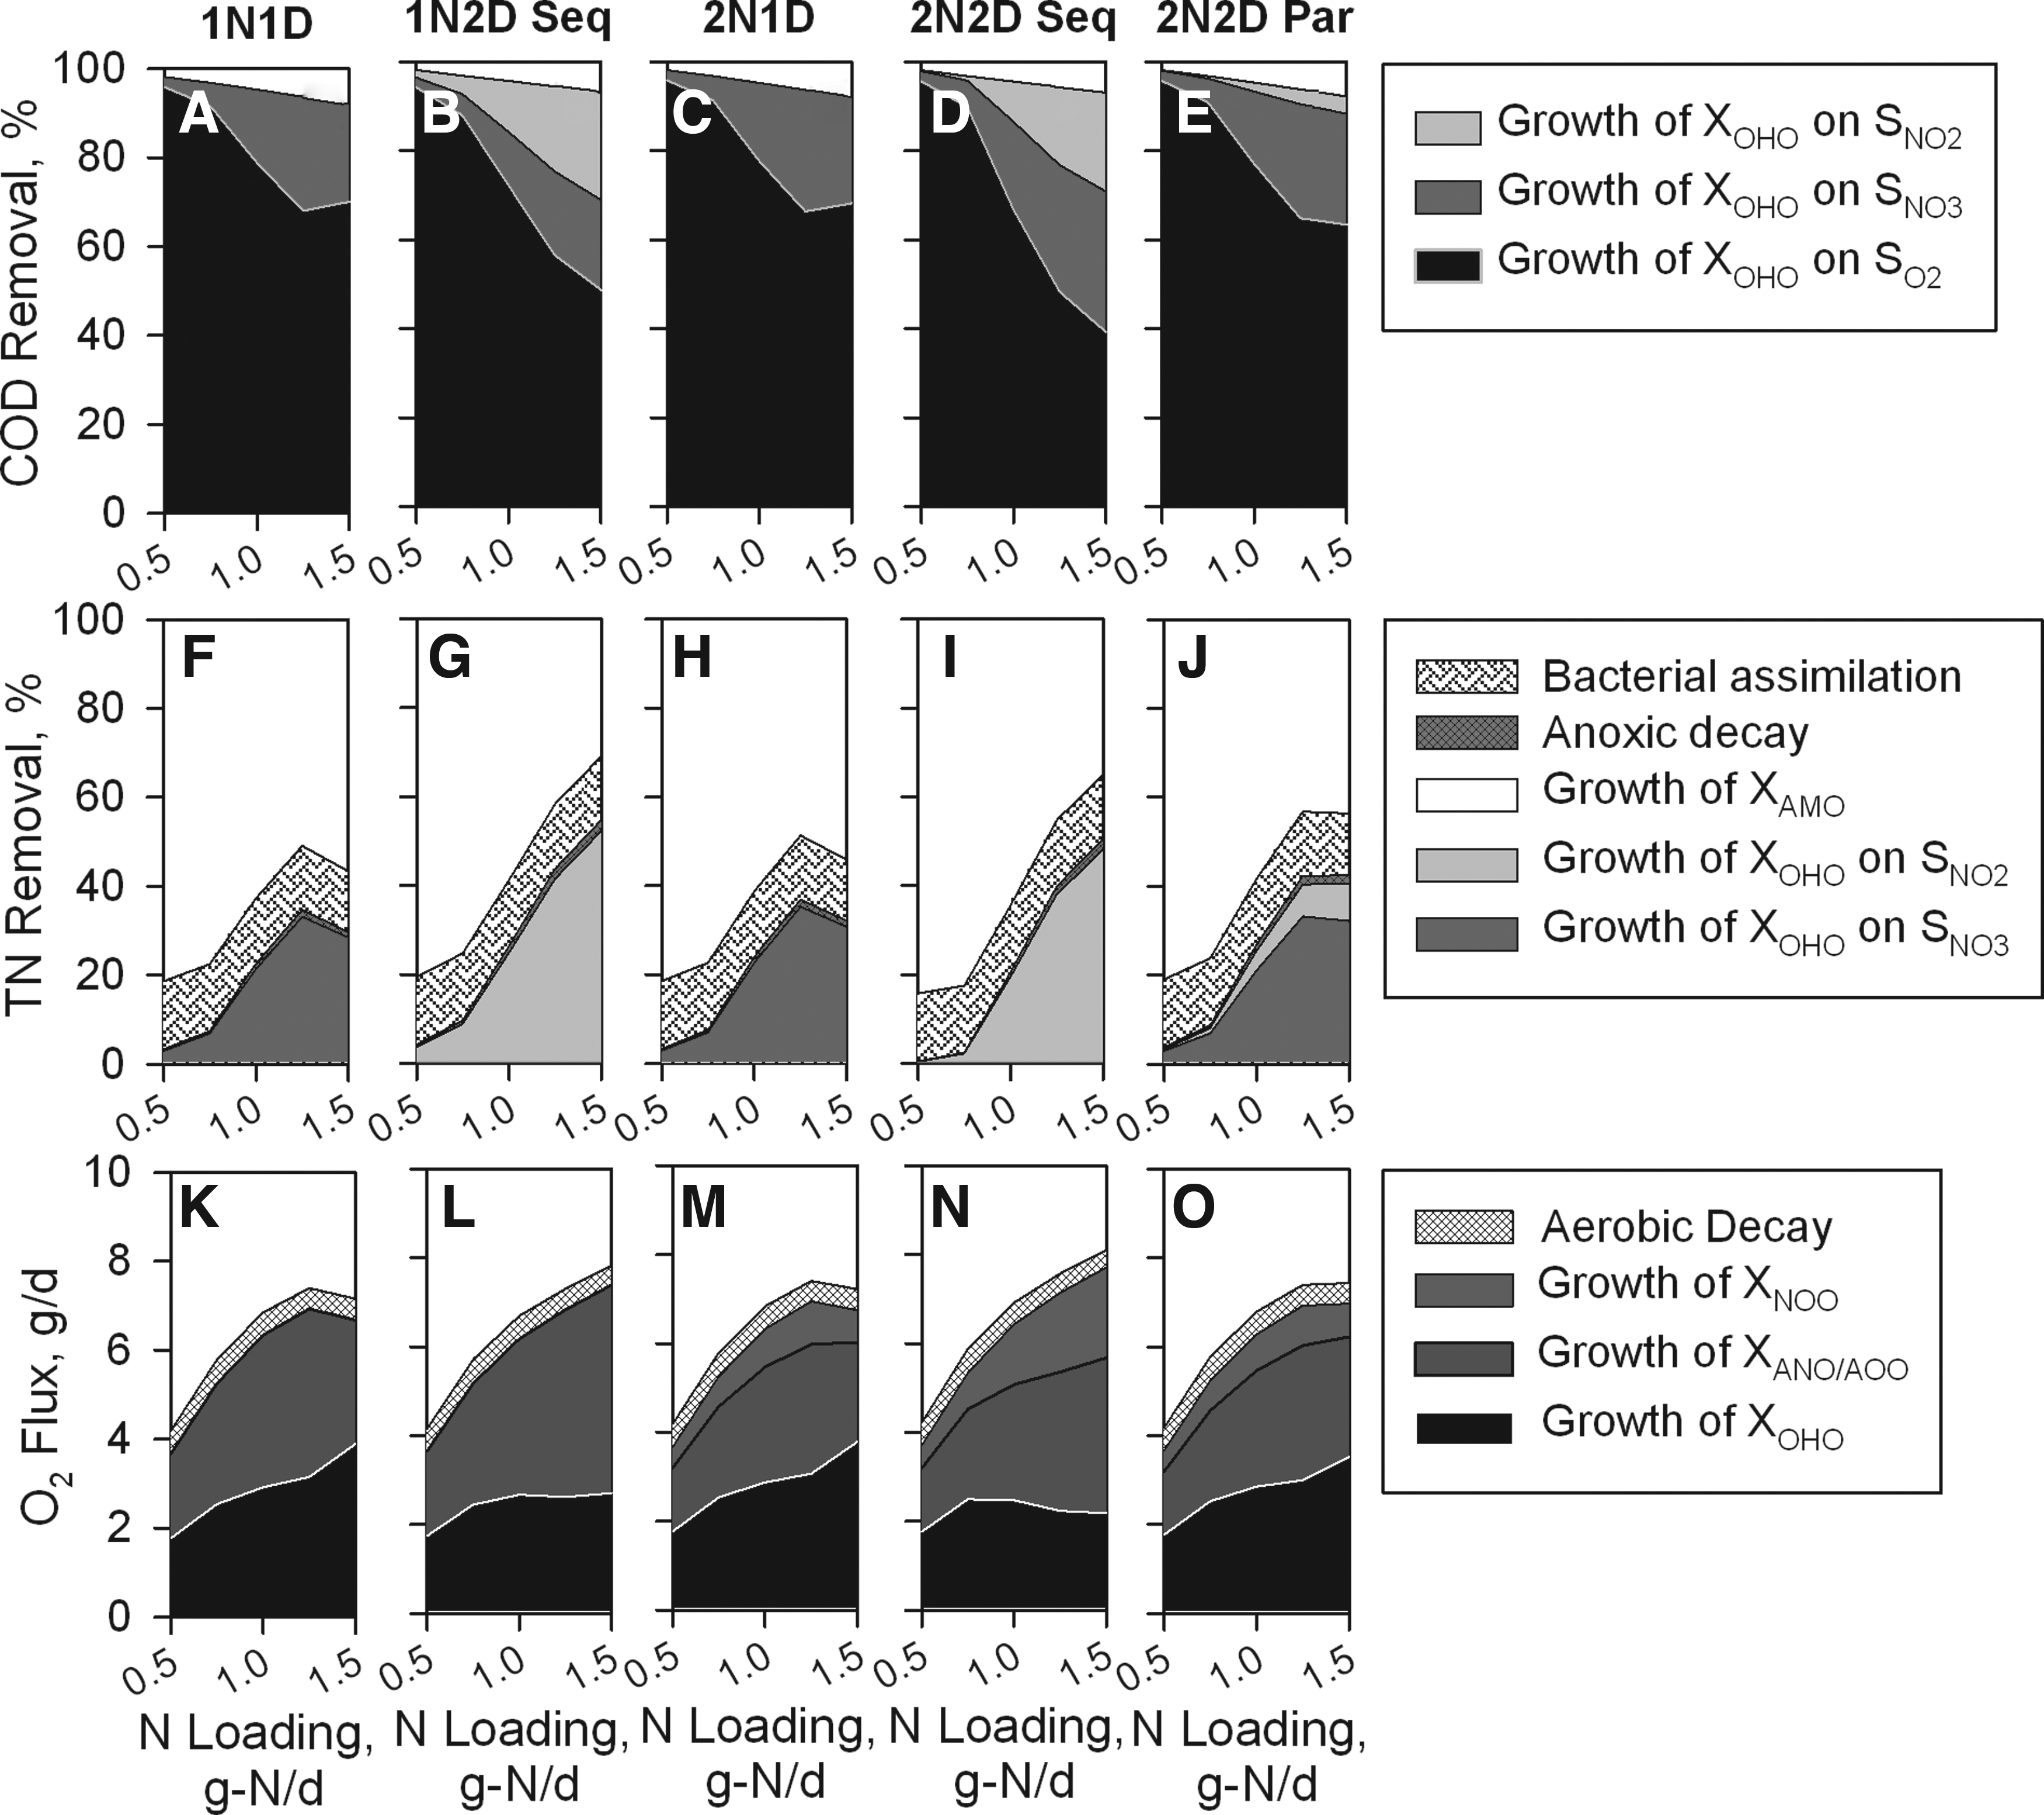
The final aspect of Study 1 sought to investigate the disparities in process contribution toward a given substrate's flux as caused by including nitrite as an intermediate. Equation (4) was applied to each process that contributed to the removal and/or production of COD, TN, and O2. In this manner, a detailed itemization of each reaction rate's contribution to the net flux of COD, TN, and O2 was elucidated as shown in Fig. 3A, D, and G. Aerobic oxidation of COD was marginal for most model types with contributions toward the net COD flux ranging from 12% for the 1N1D model to 1.6% for the 2N2D Seq model. As cited for the slightly higher TN removal rates achieved in the 2N2D Par model, the contribution of short-cut denitrification was quantified to be 1.9% (Fig. 3E). For the sequential model types, the flux of COD via reduction of NO3- should account for 40% of the total anoxic COD removal rate based upon stoichiometry; however, this value was simulated as 50% and 64% for the 1N2D Seq and 2N2D Seq models, respectively (Fig. 3A). In addition to the high bulk liquid NO2− concentrations, the divergence from stoichiometric expectations further confirmed that incomplete denitrification occurred in the 1N2D Seq model type. On the other hand, the 2N2D Seq simulation departed from stoichiometric expectations due to a reason other than incomplete denitrification. Instead, nitrite looping propagated the inefficiencies noted for COD removal.

Process contributions toward overall COD removal rate
Within Study 1, five of the simulated results corroborated that nitrite looping occurred in the 2N2D Seq model: (1) TN removal rates were lower than other model types (Table 4) since more NO2− was being oxidized rather than reduced following the first step of denitrification, (2) NOO populations were higher than other model types (Fig. 2) despite lower NHx removal (Table 4), (3) the production of NO2− by AOO was 0.68 g-N/day (0.91 g-N/m2-day), while the consumption of NO2− by NOO was 1.10 g-N/day (1.46 g-N/m2-day), (4) the consumption of O2 by NOO was 10% higher than stoichiometrically predicted (Fig. 3G), and (5) the amount of COD removed during denitrification with NO3− as the electron acceptor was 24% higher than stoichiometrically predicted (Fig. 3A).
Experimental evidence that explicitly corroborated the occurrence of nitrite looping was not found in literature; however, the following studies have examined the topic. While quantifying the community makeup of three aerobic granular systems using fluorescent in situ hybridization and quantitative polymerase chain reaction, Winkler et al. (2012) reported that (1) the NOO/AOO ratio was unexpectedly high and (2) the nitrite oxidizing capacity was three times greater than the ammonium oxidizing capacity. The researchers hypothesized that nitrite looping could be responsible for these findings. In another instance, an activated sludge modeling study found that a calibrated full-plant simulator predicted lower effluent TN concentrations whenever a 1N1D modeling framework was simulated as opposed to a 2N2D Seq modeling framework (Latimer et al., 2009). The differences in the predicted TN concentration were attributed to nitrite looping, and its effects on the 2N2D Seq simulation results were minimized by changing half-saturation affinity constants to enhance the NO2− uptake ability of facultative OHO versus NOO. In this manner, the 2N2D Seq model was better calibrated to match experimental results for an activated sludge system, and the occurrence of nitrite looping within the simulation results was explained through the lens of kinetics. On the other hand, a previous modeling study focused on biofilms rather than suspended biomass, suggested that nitrite looping within biofilm systems may be plausible so long as denitratation-produced NO2− interacted with NOO before being either reduced to N2 or diffusing out of the biofilm (Landes et al., 2011). Although the simulation results were attributed to diffusional transport of denitratation-produced NO2− from anoxic to aerobic regions, it was postulated that this interaction could also occur due to close spatial proximity of OHOs and NOOs or advective transport mechanisms. For the current study, nitrite looping was mathematically possible as a result of denitratation-produced NO2− diffusing from anoxic to aerobic regions.
Study 2—impact of waste type on model output
The general purpose of Study 2 was to determine whether the variations in model output, as demonstrated through Study 1, were evident whenever other waste types were simulated (Table 4 and Fig. 3). For all waste types investigated, COD removal did not vary significantly as nitrite was included. Unlike the centrate sidestream simulations, the highest NHx and TN removal efficiencies were reported for the 1N2D Seq model. The 2N1D and 2N2D Par models exhibited similar O2 consumption and COD removal patterns; however, as a result of short-cut denitrification, the 2N2D Par model reported higher TN removals. In general, a consistent theme regardless of the waste applied was that the models with the highest NHx removal also reported the highest TN removal.
For the 2N2D Seq simulations, a wide variety of nitrite looping scenarios occurred. The amount of NO2− oxidized by NOO was 1.6-, 1.4-, and 1.8-fold greater than the amount of NO2− produced by AOO whenever the centrate sidestream, domestic wastewater, and septic tank effluent waste were simulated, respectively. Despite the variation in NO2− consumption by NOO, the amount of oxygen consumed by NOO was consistently higher for the 2N2D Seq model type regardless of the wastestream that was simulated (Fig. 3G–I). The contribution of NHx assimilation toward TN removal decreased as aerobic COD consumption by OHO decreased (Fig. 3A–F). The sequential model types always reported the least contribution of aerobic COD oxidation; thereby, more COD was consumed via anoxic denitrification processes (Fig. 3A–C). Complementary to increased COD consumption via denitrification should be increased TN removal as was the case for the 1N2D Seq model type; however, nitrite looping prevented the efficient use of COD under anoxic conditions for the 2N2D Seq simulations (Fig. 3D–F).
Study 3—impact of loading rate on model output
Study 3 aided in determining whether or not implications from Studies 1 and 2 could be applied as the nitrogen mass loading rate was varied. To provide the general trends that accompanied changes in mass loading rates, only the centrate sidestream and the domestic wastewater were presented (Figs. 4 and 5). These two waste types were presented since they were most affected by nitrogen mass loading rates.

Process contributions toward overall COD removal rate
Process contributions toward overall COD removal rate
Centrate sidestream simulations
In general, COD and TN removals did not vary for the centrate sidestream, except for the lowest loading rate in which, OHO began to compete with nitrifying bacteria for O2 (Fig. 4). Although the intramembrane air pressure was held constant for all nitrogen loading rates, the flux of O2 that diffused into the biofilm reactor compartment increased as the microbial activity increased at higher loading rates (Fig. 4K–O). For reference, the maximum JO2 for the centrate sidestream simulations was 12.4 g-O2/day (16.5 g/m2-day), which indicated that the O2 transfer efficiencies increased from 24% to 44% as the nitrogen loading increased from 1.0 to 2.0 g-N/day (1.3–2.6 g-N/m2-day). For all model types simulated with the centrate waste, bacterial assimilation accounted for ∼4% of TN removal regardless of the loading rate. Similarly, decay processes contributed for ∼4% of TN removal at all loading rates.
Domestic wastewater simulations
NHx and TN removal efficiencies declined at the highest loading rate whenever the model type did not include NO2− as an intermediate (1N1D, 2N1D, and 2N2D Par), while overall COD removal efficiencies did not greatly vary as a function of the model type (Fig. 5). Upon closer inspection, it was revealed that the contribution of oxic and anoxic processes toward COD removal varied between the model types (Fig. 5A–E). For all nitrogen loading rates, the sequential denitrification model types (1N2D Seq and 2N2D Seq) consistently had a larger anoxic process contribution toward COD removal than model types that omitted sequential denitrification (1N1D, 2N1D, and 2N2D Par). This was most evident at the highest loading rate in which, the oxygen consumption trend increased for aerobic heterotrophs, while it decreased for nitrifying organisms whenever nonsequential denitrification models were simulated (Fig. 5K–O). As a consequence of a less nitrification activity and less anoxic COD consumption, nonsequential denitrification models also reported decreased TN removal efficiencies at the highest liquid loading rate (Fig. 5F–J). Considering that the maximum JO2 for domestic wastewater simulations was 16.4 g-O2/day (21.9 g/m2-day), the simulated O2 transfer efficiencies ranged from 26% to 45% for nonsequential denitrification models and from 26% to 49% for the sequential denitrification model types, which was similar to the values obtained with the centrate sidestream. Bacterial assimilation accounted for ∼14% of TN removal regardless of the loading rate, and for the lowest nitrogen loading rate, the vast majority of the total TN removal was attributable to bacterial assimilation. In contrast, decay processes contributed marginally to TN removal (<2.5%) at all loading rates.
Conclusions
The purpose of this study was to identify the inherent differences that could be propagated by including nitrite as an intermediate within nitrification and denitrification biofilm models. The overarching conclusion reached as a result of this study was that mathematical simulation results varied only slightly with respect to water quality (with the exception of the 2N2D Seq results) and more profoundly with biofilm speciation based upon the inclusion or exclusion of nitrite. Interestingly, the greatest disparities in model results occurred for seemingly identical model types, specifically models that applied parallel denitrification (2N2D Par) versus sequential denitrification (2N2D Seq).
Magnitude of dissimilarity between model types was shown to be a function of waste type and mass loading rate. Global implications could not be applied with respect to the impact of including nitrite as an intermediate; nonetheless, some general statements could be claimed based upon the conditions simulated in this article. COD removal rates did not vary between model types even though the processes that contributed to the COD flux did vary. The sequential denitrification model types (1N2D Seq and 2N2D Seq) had the lowest aerobic COD consumption contributions, the 1N2D Seq model type consistently had elevated NO2− concentrations when compared to the remaining models, and the rate of TN removal was proportional to the rate of NHx removal. This study also introduced a method to itemize each processes contribution toward the flux of a given soluble species. Since biofilm models are often used to educate our understanding of microbial interactions, inclusion or exclusion of nitrite as an intermediate in biofilms models will play a significant role in the interpretation of how varying microbial processes interact. Finally, the impact of nitrite looping on the 2N2D Seq model type was highlighted. The current study demonstrated that nitrite looping was mathematically possible as a result of denitratation-produced NO2− diffusion from anoxic to aerobic regions whereby it was oxidized to NO3−.
Footnotes
Acknowledgment
The authors would like to thank NASA and the Texas Space Grant Consortium for the generous support of this research.
Author Disclosure Statement
All authors declare that no competing financial interests exist.
Nomenclature
References
Supplementary Material
Please find the following supplemental material available below.
For Open Access articles published under a Creative Commons License, all supplemental material carries the same license as the article it is associated with.
For non-Open Access articles published, all supplemental material carries a non-exclusive license, and permission requests for re-use of supplemental material or any part of supplemental material shall be sent directly to the copyright owner as specified in the copyright notice associated with the article.