
Abstract
Abstract
Effects of micro- and mesoporosity of resorcinol–formaldehyde xerogels (RFXs) on the adsorptive properties of crystal violet (CV) were investigated. RFXs were synthesized at different pH values, and corresponding pore structures were examined. RFXs were characterized by thermal gravimetric analysis, scanning electron microscopy, and wide-angle X-ray diffraction. RFXs performed efficiently for removing CV from water, and were easily regenerated. RFXs synthesized at pHs of 5.5 and 7.0 exhibited relatively high surface areas and micropore volumes, whereas those synthesized at pH 2.5 exhibited relatively low surface areas and micropore volumes. Overall, surface areas of RFXs increased when increasing the pH of RF solutions, and this corresponded to higher CV adsorption capacities. This work is the first of its kind for studying the use of RFXs in the removal of such dyes from wastewater, and is anticipated to have a major impact on the treatment of wastewater generated by textiles industries.
Introduction
This article is concerned with resorcinol–formaldehyde xerogels (RFXs) that are synthesized by sol–gel polymerization at different pH values. The characterization of the RFXs is addressed and their capacity for CV adsorption is studied, while keeping in consideration the reusability of these xerogels after regenerating. This work is the first study of using these resins for removing such dyes from wastewater, and is anticipated to have a major impact on the wastewater treatment processes in the textiles industry.
Experimental Protocols
Sample preparation
The solution of resorcinol and formaldehyde was prepared from resorcinol (Sigma-Aldrich; with purity 99%), formaldehyde (Sigma-Aldrich; 37% [w/w] formaldehyde stabilized with 10–15% [w/w] methanol), nitric acid (HNO3; Fisher), and deionized water. The molar ratios of resorcinol to catalyst, resorcinol to formaldehyde, and resorcinol to water were 500, 0.5, and 0.05, respectively. Similar procedures were carried out with four resorcinol–formaldehyde (RF) solutions with equal recipes, but with initial pH values of 2.5, 4.0, 5.5, and 7.0, where the pH values are set using a few drops of diluted HNO3 or ammonium hydroxide solutions. The corresponding xerogels were coded as S-2.5, S-4, S-5.5, and S-7, respectively. The solutions were kept at a temperature of 70±0.1°C for a week to cure. The resulting wet gels are monolith-shaped, with different colors ranging from yellow to brown. Then, after repeated washes with acetone as described elsewhere (Awadallah-F et al., 2011), they were dried at 50±1°C to produce dry xerogels. CV was obtained in an analytical reagent grade from TCI and was used as received. It is a monovalent cationic dye with the structure shown in Fig. 1.
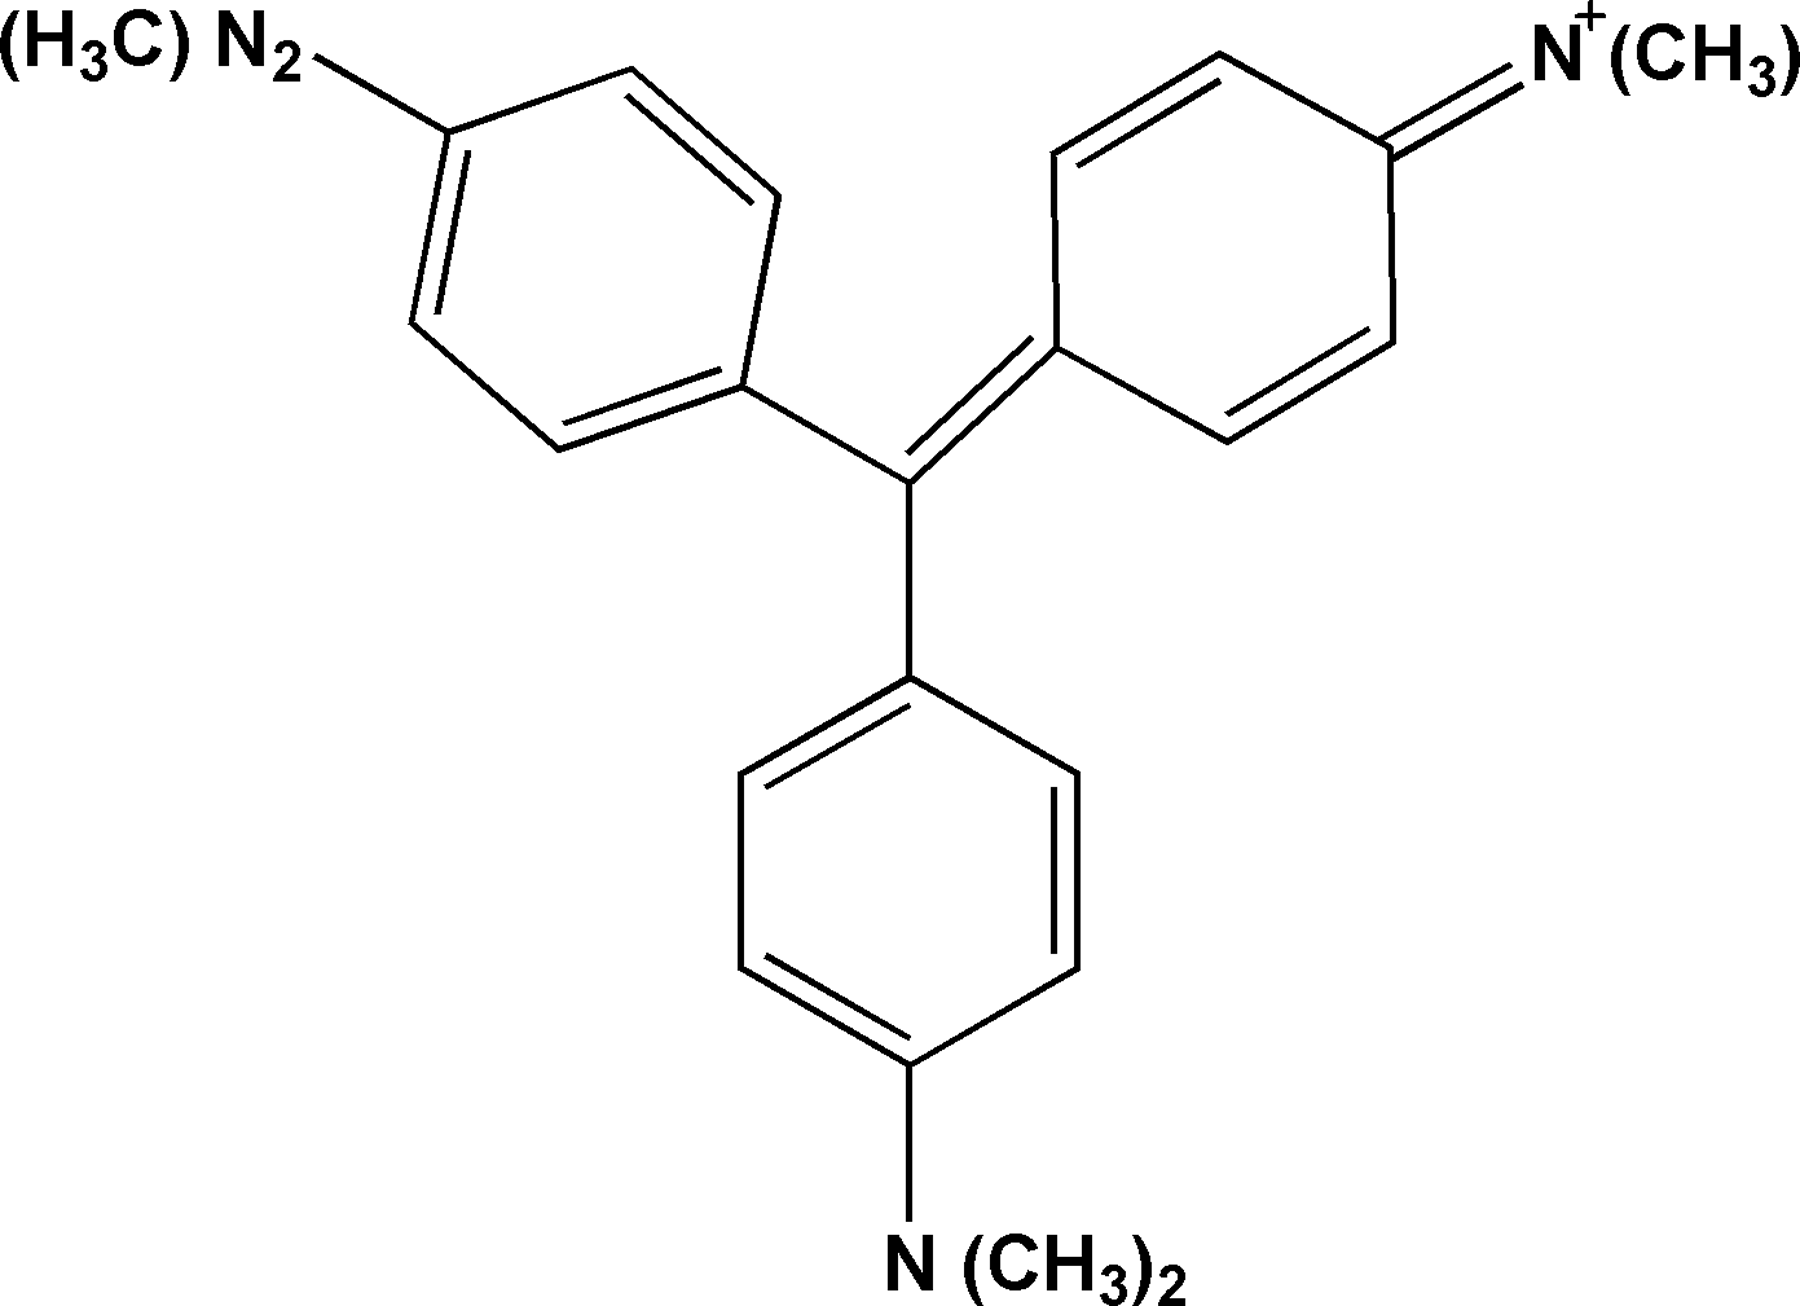
Chemical structure of crystal violet (CV) dye.
Characterization
A Micromeritics ASAP-2420™ surface area and porosity analyzer was used to analyze the adsorption/desorption isotherms of N2 at 77 K. Xerogels were first degassed at 130°C for 4 h. An environmental scanning electron microscope (SEM; FEI-Quanta 200) was used at an acceleration voltage of 25 kV. Thermogravimetric analyses (TGAs) were carried out under an N2 atmosphere with PerkinElmer Pyris 6 TGA. Wide-angle X-ray diffraction (WAXD) measurements were conducted in reflection mode at 25°C using a Bruker-D2 Phaser. The Cu Kα radiation (λ=1.54 Å) source was operated at a voltage of 50 kV and a current of 40 mA.
Adsorption studies
The RFXs (0.1–0.2 g) were immersed in 50 mL of solutions of CV (1–13 mg/L) in water for 24 h at 25°C. The initial and final CV concentrations were measured by a Lambda-40 ultraviolet–visible spectrophotometer at λmax=598 nm. The amount of CV adsorbed was calculated from the initial and final CV concentrations as Qe=(C0 – Ce)V/m, where V is the volume of solution (mL); m is the mass of dried RFX (g); and C0 and Ce are, respectively, the initial and final concentrations of CV (mg/mL).
Regeneration and reusability
The reusability of the RFXs was examined after conducting adsorption/desorption experiments of CV at 25°C by washing the saturated RFXs several times with deionized water. Desorption of CV was studied by putting each washed RFX into a methanol solution containing 1–8% acetic acid. After mixing for several minutes and removing the RFX, the CV concentration in the solution was measured to estimate the amount of CV desorbed (Liao et al., 2004).
Results and Discussion
N2 adsorption/desorption isotherm
The amount of N2 adsorbed at 77K on the RFXs is shown in Fig. 2. The adsorption quantity increases gradually at low pressure, and then undergoes a sharp increase at high pressure as shown by S-5.5 and S-2.5. Such isotherm shape (showing a sharp increase at P/P0 of ∼0.7) is indicative of condensation of sorbate in mesopores (Gommes et al., 2007). The isotherms of S-2.5 and S-5.5 are close to Type-IV (Webb et al., 1997). It is also shown in Fig. 2 that the N2 isotherm on S-7 follows a linear trend with a shape close to Type-V (Webb et al., 1997). This indicates that this sample has a very high monolayer adsorption capacity. Several adsorption characteristics can be observed from the adsorption isotherm of N2 on S-7. The gradual increase of amount adsorbed in P/P0 from 0.1 to 0.99 indicates an adsorption with primarily mesoporous and small, nonsignificant portion of macroporous structures as deduced from pore size distributions (Gregg and Sing, 1982). The hysteresis loop for N2 is observed to be very small (negligible) for S-7 and S-2.5. Nonetheless, a noticeable hysteresis is found for S-5.5.
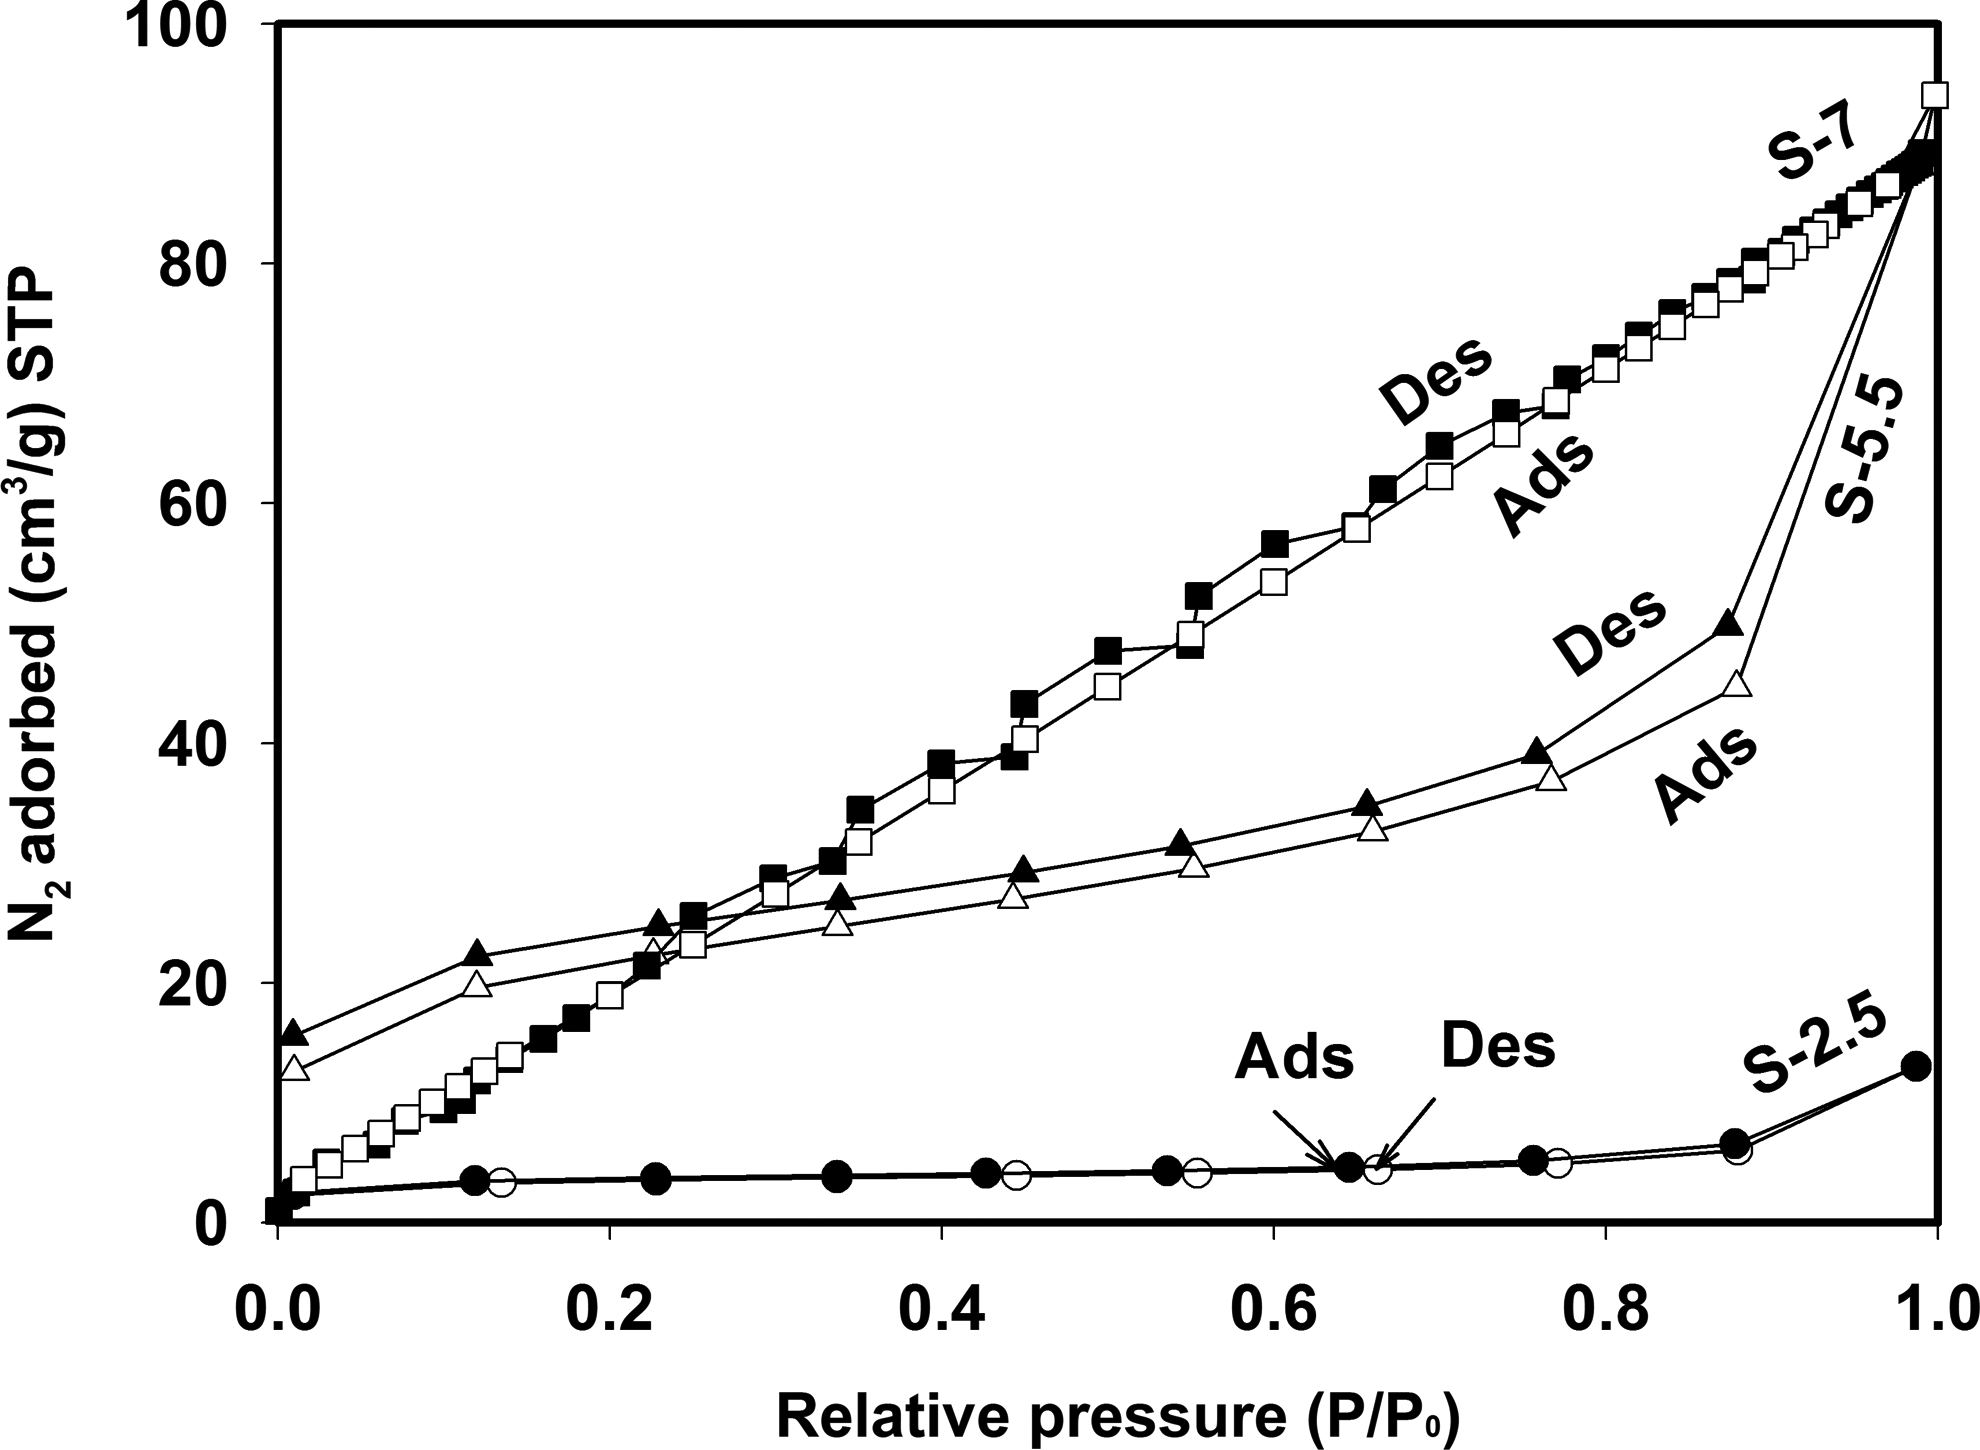
Adsorption/desorption isotherms of N2 at 77K represented by solid and empty symbols, respectively.
Surface heterogeneity
A surface area analyzer was used to estimate adsorption energies at various surface segments using a modified density functional theory. Figure 3 shows measured incremental surface area distributions as functions of adsorptive energy (e/k, where k is Boltzmann's constant); which is related to the isosteric heat of adsorption (Olivier, 1999). It is observed that S-5.5 exhibits a broad energy peak covering e/k values ranging from ∼20 to ∼35K. In contrary, S-7 shows a relatively narrow peak in the e/k range of ∼40–45K, followed by few tiny peaks (negligible) around e/k values of 72, 82, 86, and 98K. Further, S-2.5 showed an almost flat pattern without any noticeable surface areas contributing to the energy of adsorption. Therefore, the heterogeneity is exhibited mostly by S-5.5, followed by S-7, while S-2.5 exhibits a null heterogeneity. Furthermore, the energy of S-7 is higher than that of S-5.5, which indicates that S-7 exhibits a higher adsorption affinity toward N2. Consequently, the initial conditions of RF solutions play a pivotal role in determining the heterogeneity of RFX surfaces.
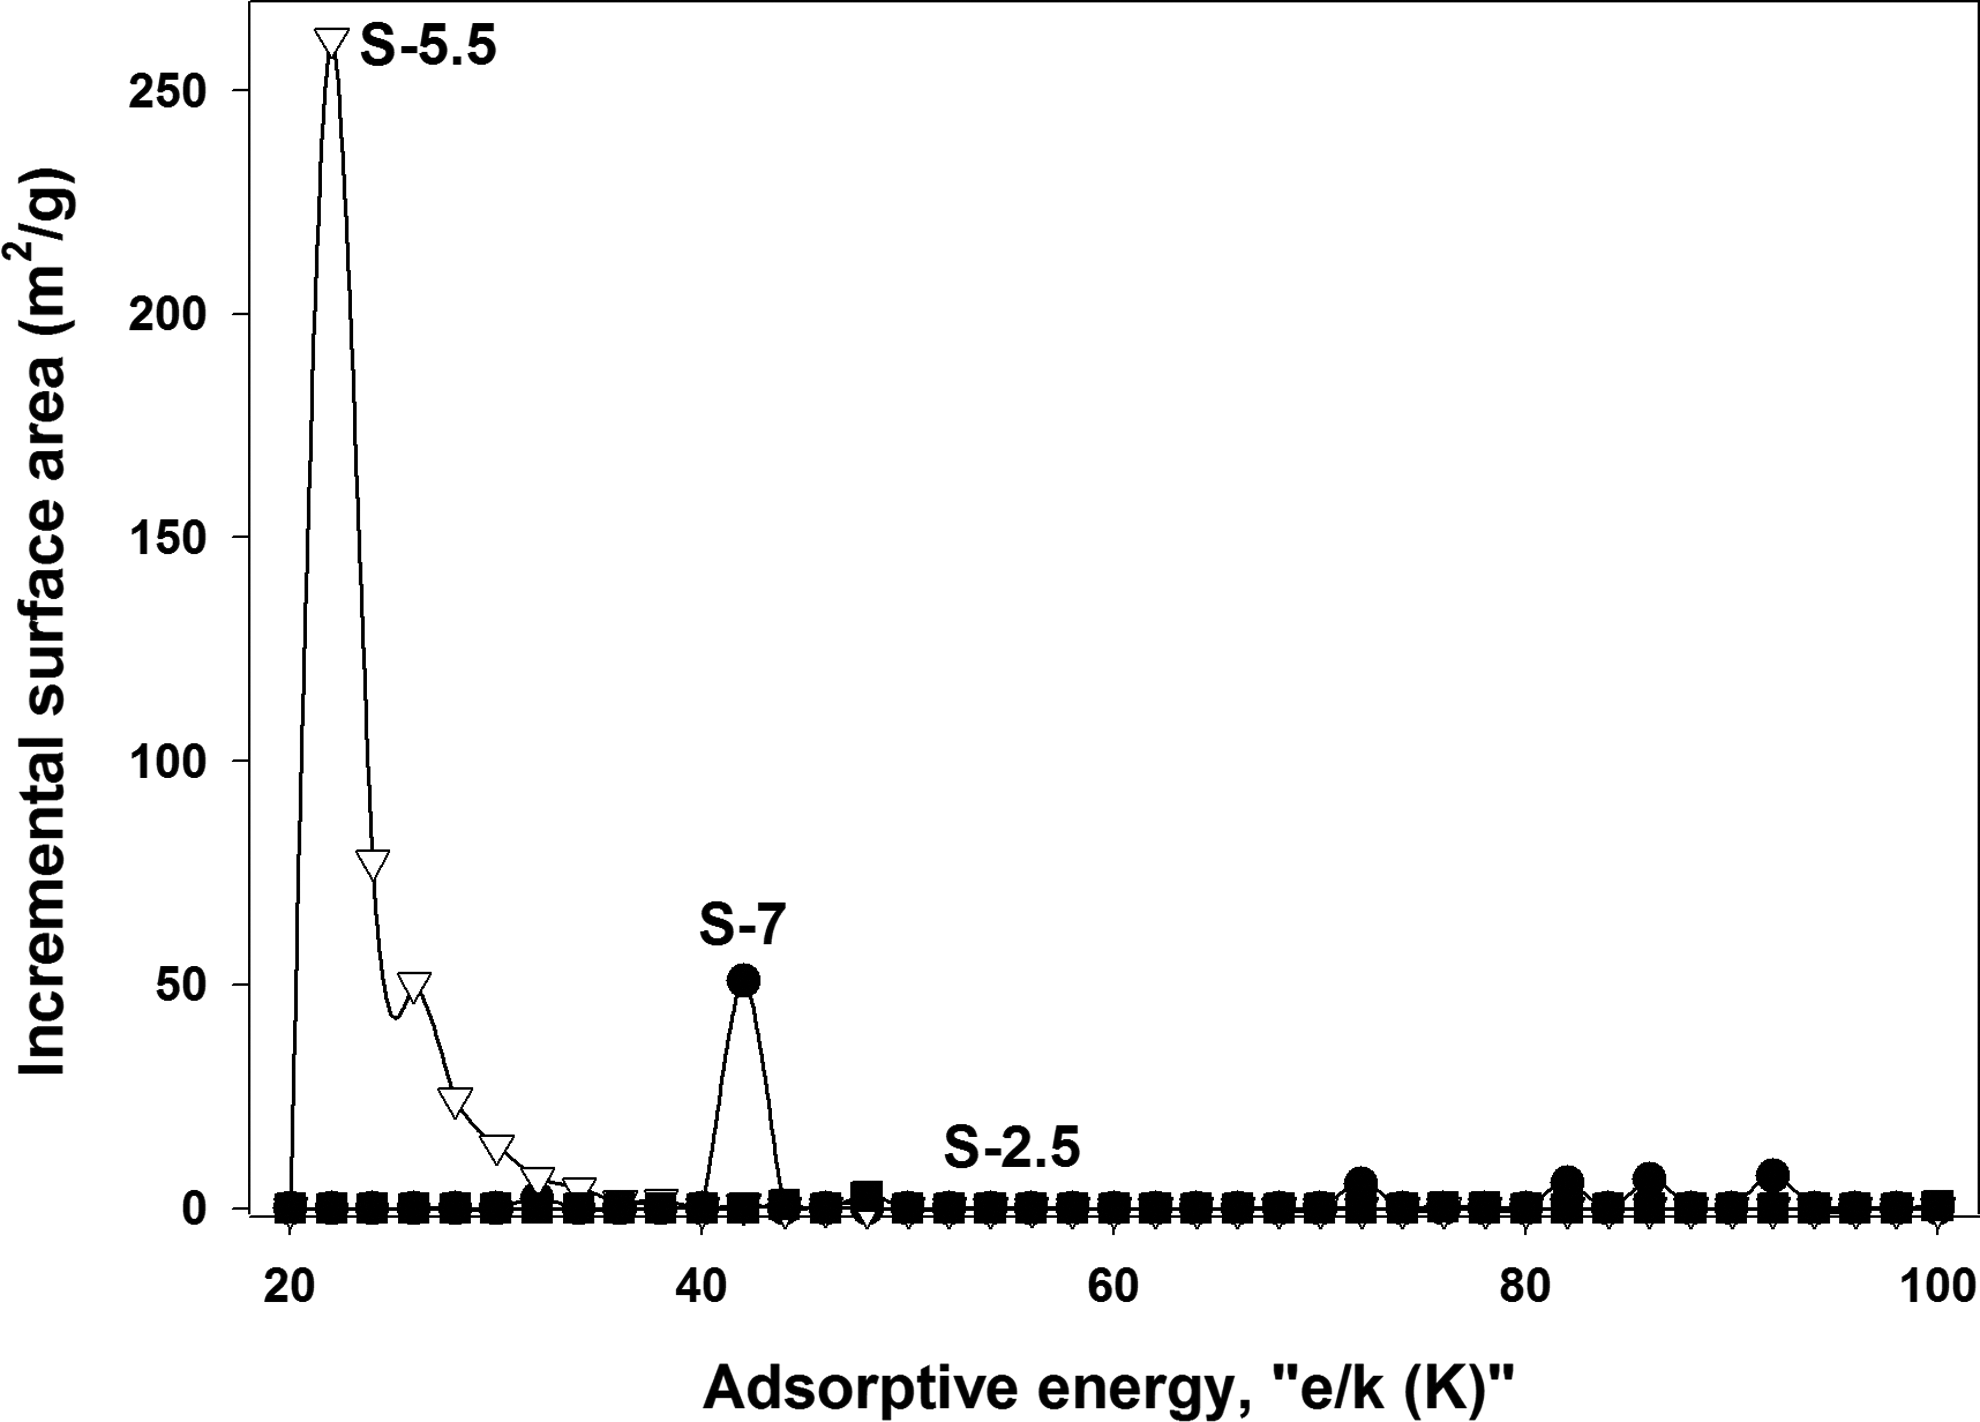
Incremental surface area distributions versus adsorptive energy.
Figure 4 shows the SEM morphologies, where different textures of RFXs were observed. Particle sizes of S-7 are the biggest among all. The S-5.5 resulted in particles smaller than those of S-7. On the other hand, the other two samples showed smooth surfaces and, hence, are not shown.
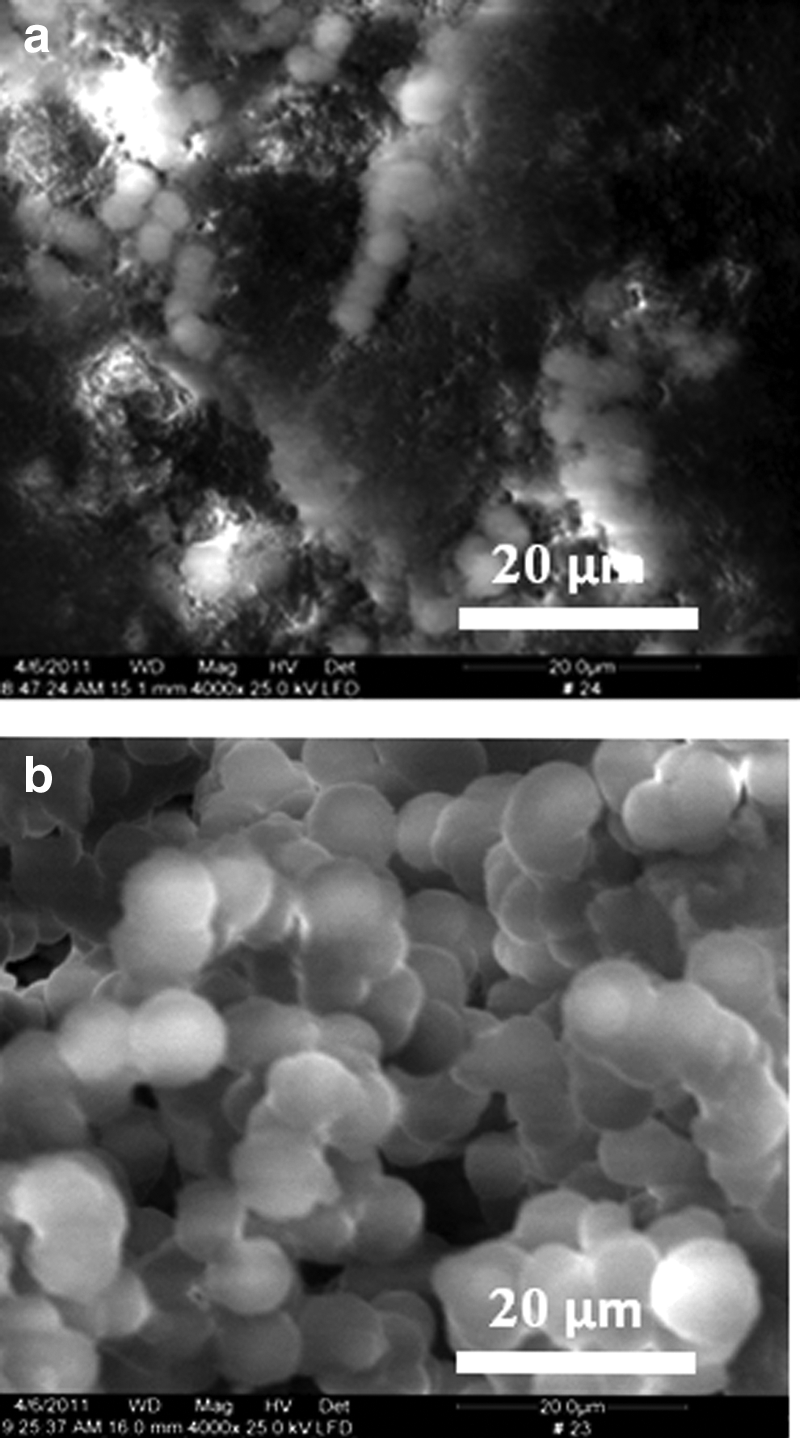
Scanning electron micrographs of resorcinol–formaldehyde xerogel (RFX) samples
Pore structure study
Various contribution of the initial solution pH to the porosity of RFXs can be interpreted by textural characteristics presented in Table 1. Figure 5 shows the influence of pH on the pore sizes and cumulative surface areas of RFXs. The surface area and porosity analysis for S-4 produced no results, even after repeating the surface area measurements with freshly prepared samples. The S-4 contained only macropores, which shrink significantly upon ambient drying, which leaves dense crosslinkings (Tonanon et al., 2006). Nonetheless, the results of S-2.5, S-5.5, and S-7 were positive as shown in Fig. 5. Furthermore, it was observed that the cumulative surface area of S-7 is higher than S-5.5 for pores wider than ∼3 nm. Nonetheless, for narrow pores (<∼3 nm), S-5.5 exhibits a higher surface area. This shows that although S-5 has a better potential in adsorbing molecules at low partial pressures, S-7 will be more effective when dealing with higher relative pressures that correspond to wider pores. Surface areas of both S-7 and S-5.5 are higher than S-2.5. The cumulative surface areas for S-7 increased gradually, then leveled off at 42 m2/g at a pore width of 12.5 nm, and then increased gradually up to 46 m2/g. S-5.5 exhibited a slight increase in cumulative surface area from 15 up to 24.98 m2/g for a corresponding pore width range of 7.5–11 nm and then leveled off again, which indicates the existence of pores in these two distinctive ranges of pore widths. The cumulative surface area of S-2.5 is very slight and leveled off at a small pore width.

Cumulative pore surface area distributions versus pore widths.
Particle size was determined from SEM image analyses.
S-2.5, S-4, S-5.5, and S-7: resorcinol–formaldehyde xerogel samples resulting from solutions with initial pH values of 2.5, 4.0, 5.5, and 7.0; SDFT: surface area derived from the density functional theory method; Vt: total pore volume derived from the DFT method at P/P0=0.99; Qm: monolayer capacity derived from the Dubinin–Radushkevich model; STP: standard temperature and pressure; Rh: average pore hydraulic radius derived from the Micropore method.
Figure 6 displays the incremental surface area versus the corresponding pore widths for S-2.5, S-5.5, and S-7. It was observed that increasing the pH level in the reaction media leads to increasing the most available incremental surface area. Furthermore, the pores of S-2.5, S-5.5, and S-7 are mostly in the range of micro- and mesopore regions, which contribute to the surface area more than macropores (Lin and Ritter, 1997). In addition, it was observed that the pore widths increase with decreasing pH value (Job et al., 2006). Figure 7 shows the cumulative pore volume distributions for S-7, S-5.5, and S-2.5. It was observed that the pore volume order for different RFXs is S-7>S-5.5>S-2.5. Figure 8 shows that the most available incremental pore volumes of different also follows the order of S-7>S-5.5>S-2.5.

Incremental micro- and mesopore surface area distributions versus pore widths.
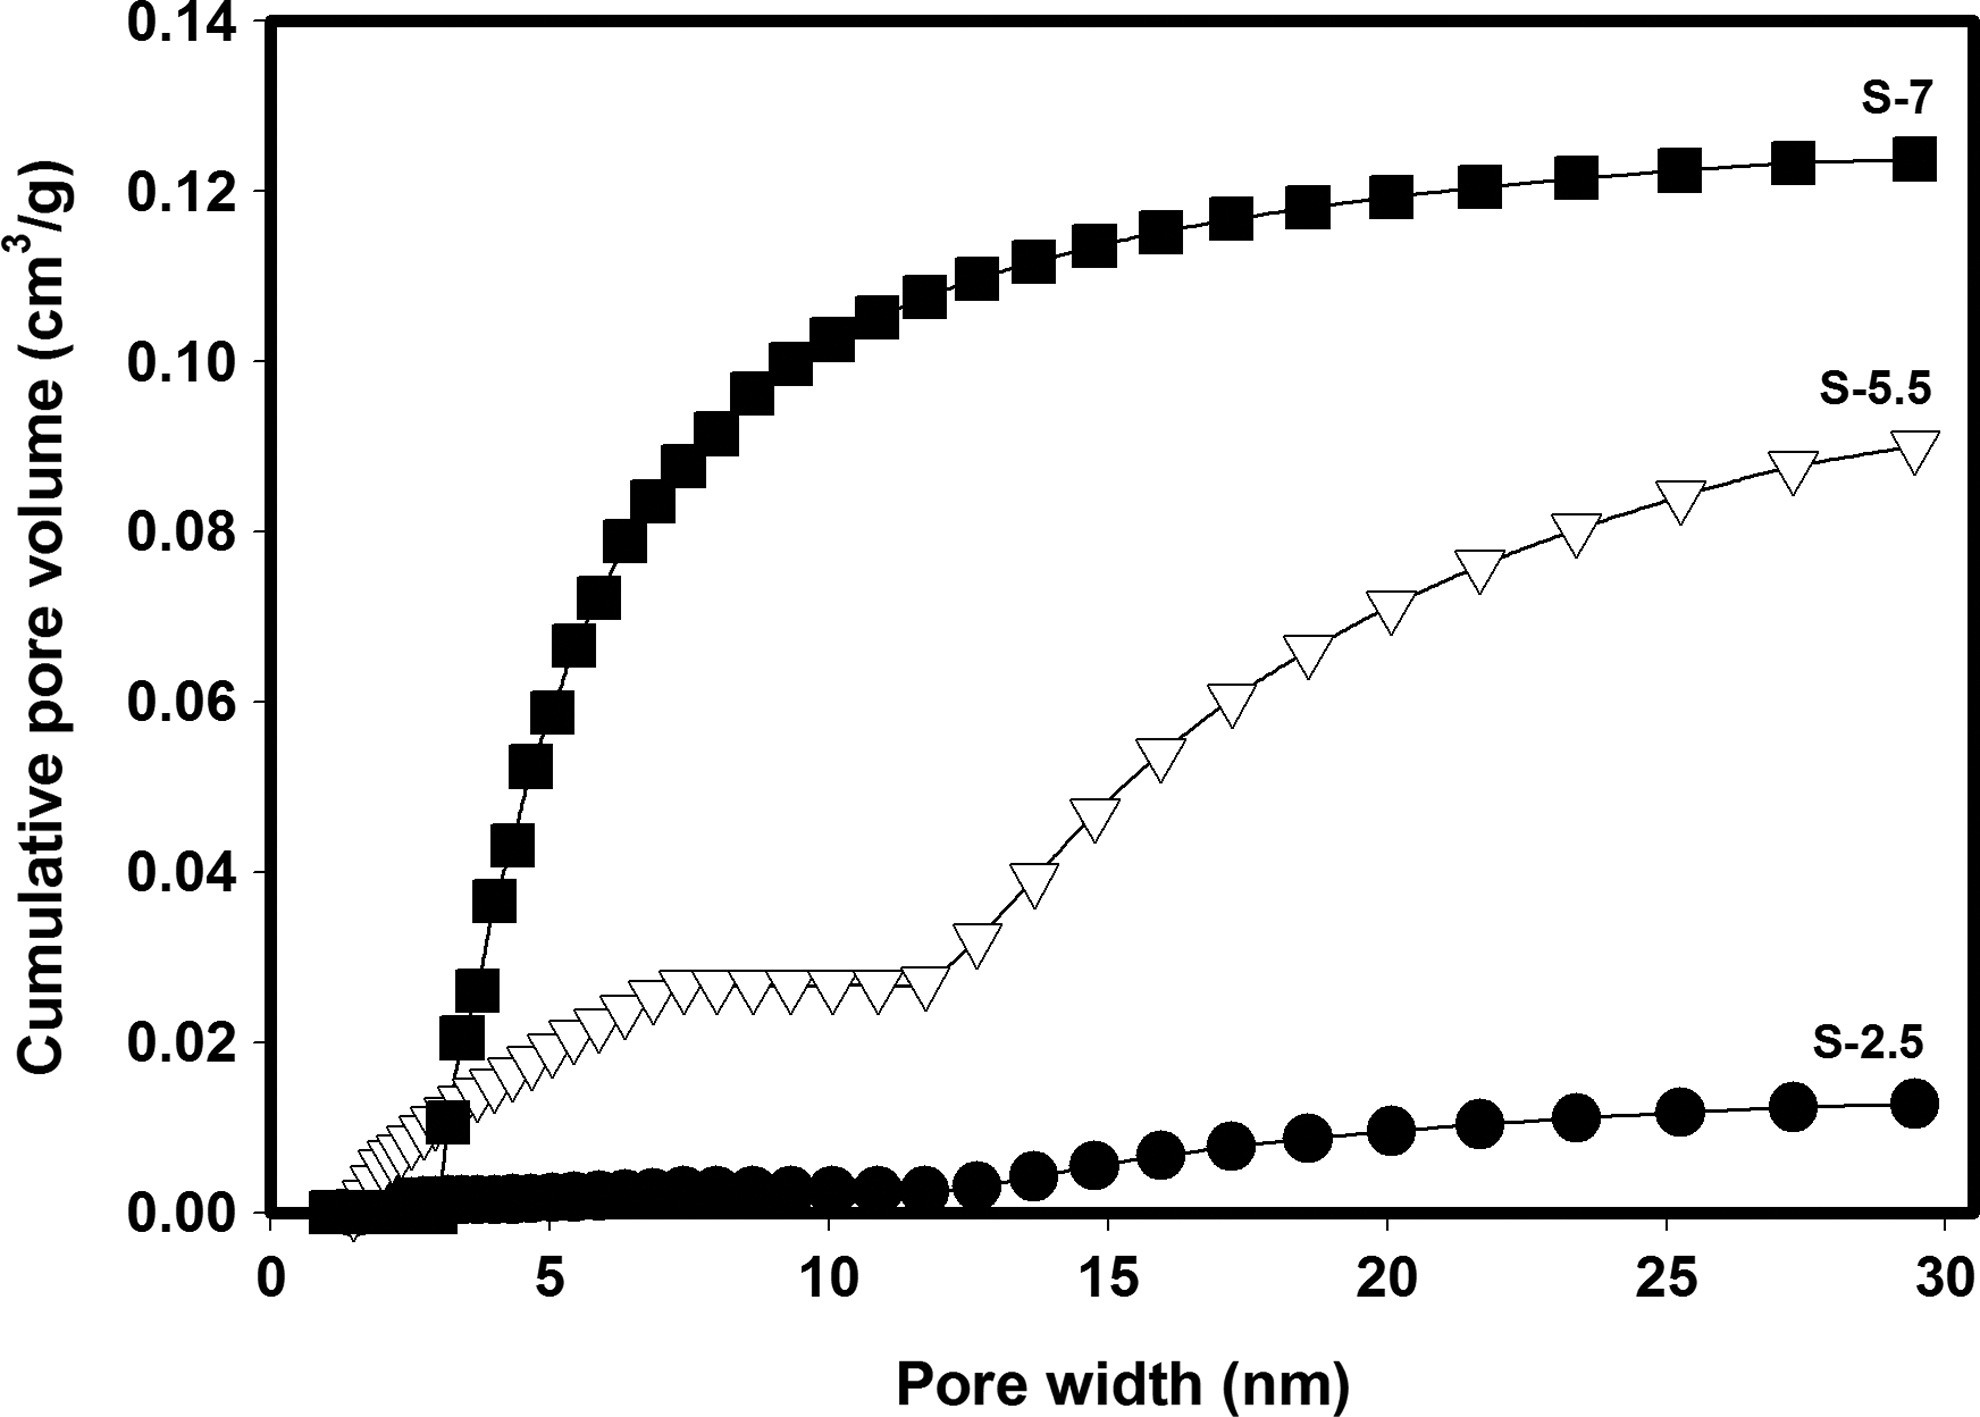
Cumulative pore volume distributions versus pore widths.

Incremental micro- and mesopore volume distributions versus pore widths.
Thermogravimetric analyses
Figure 9 shows the TGAs of different RFXs. When comparing thermal stabilities at a moderately high remaining weight (e.g., 70%, as represented by the caliber line), it was observed that S-7 has the highest thermal stability with a temperature of ∼555°C. The sequence of thermal stability for RFXs at 70% remaining weight is given as S-7>S-5.5>S-4>S-2.5, where S-2.5 exhibits the lowest thermal stability. Therefore, at such remaining weight, the initial solution pH used in RFX in syntheses can affect the resulting thermal stabilities.

Thermogravimetric analysis thermograms of different RFXs.
WAXD measurements
WAXD patterns of RFXs are shown in Fig. 10. Overall, RFX samples do not exhibit any Bragg peaks; therefore, they are not crystalline (as RF gels normally are). However, they might be considered to exhibit a relative crystalinity that can be analyzed for qualitative comparison purposes. It can be observed that all WAXD patterns show a main diffraction peak at 2θ of ∼20°. However, slight variations were observed in the peak intensity for each sample, which reflects on the relative extent of their relative crystalinity. Overall, it was observed that the relative crystalinity follows the sequence as S-7>S-5.5>S-4>S-2.5 based on the intensity and broadness of the corresponding peaks.
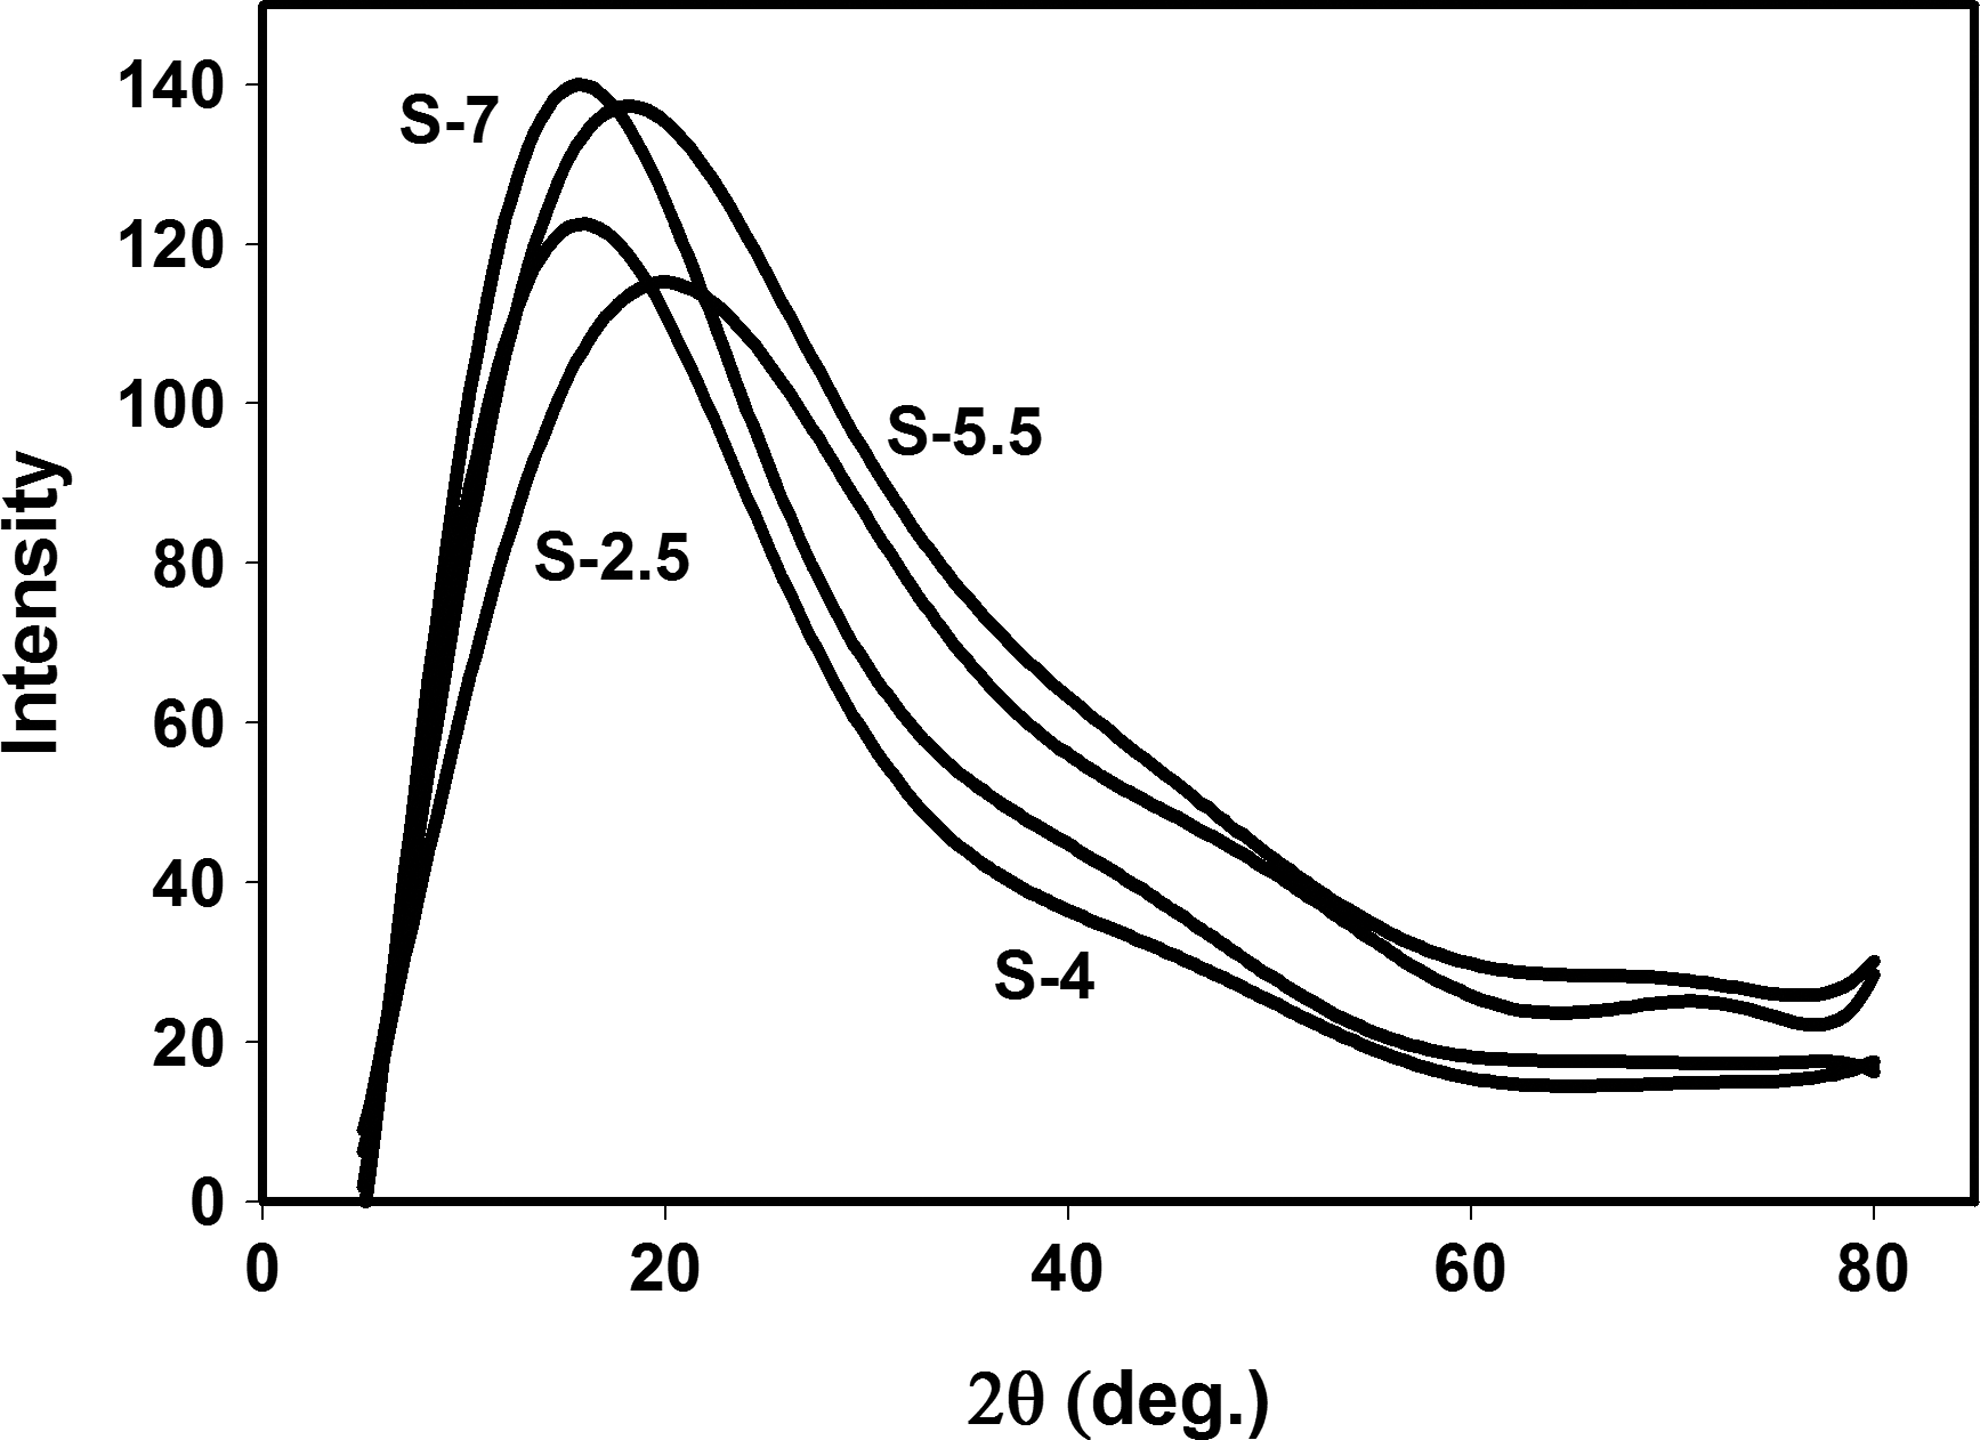
Wide-angle X-ray diffraction patterns for different RFXs.
Adsorption of CV on RFXs
Figure 11 shows the effect of CV concentrations in the initial solutions on the equilibrium adsorption capacities on RFXs at 25°C. The sequence of adsorption capacity on RFXs is S-7>S-5.5>S-4>S-2.5, which is consistent with their structural properties. Therefore, the adsorption capacity of CV on RFXs depends on the preparation conditions of RFXs.
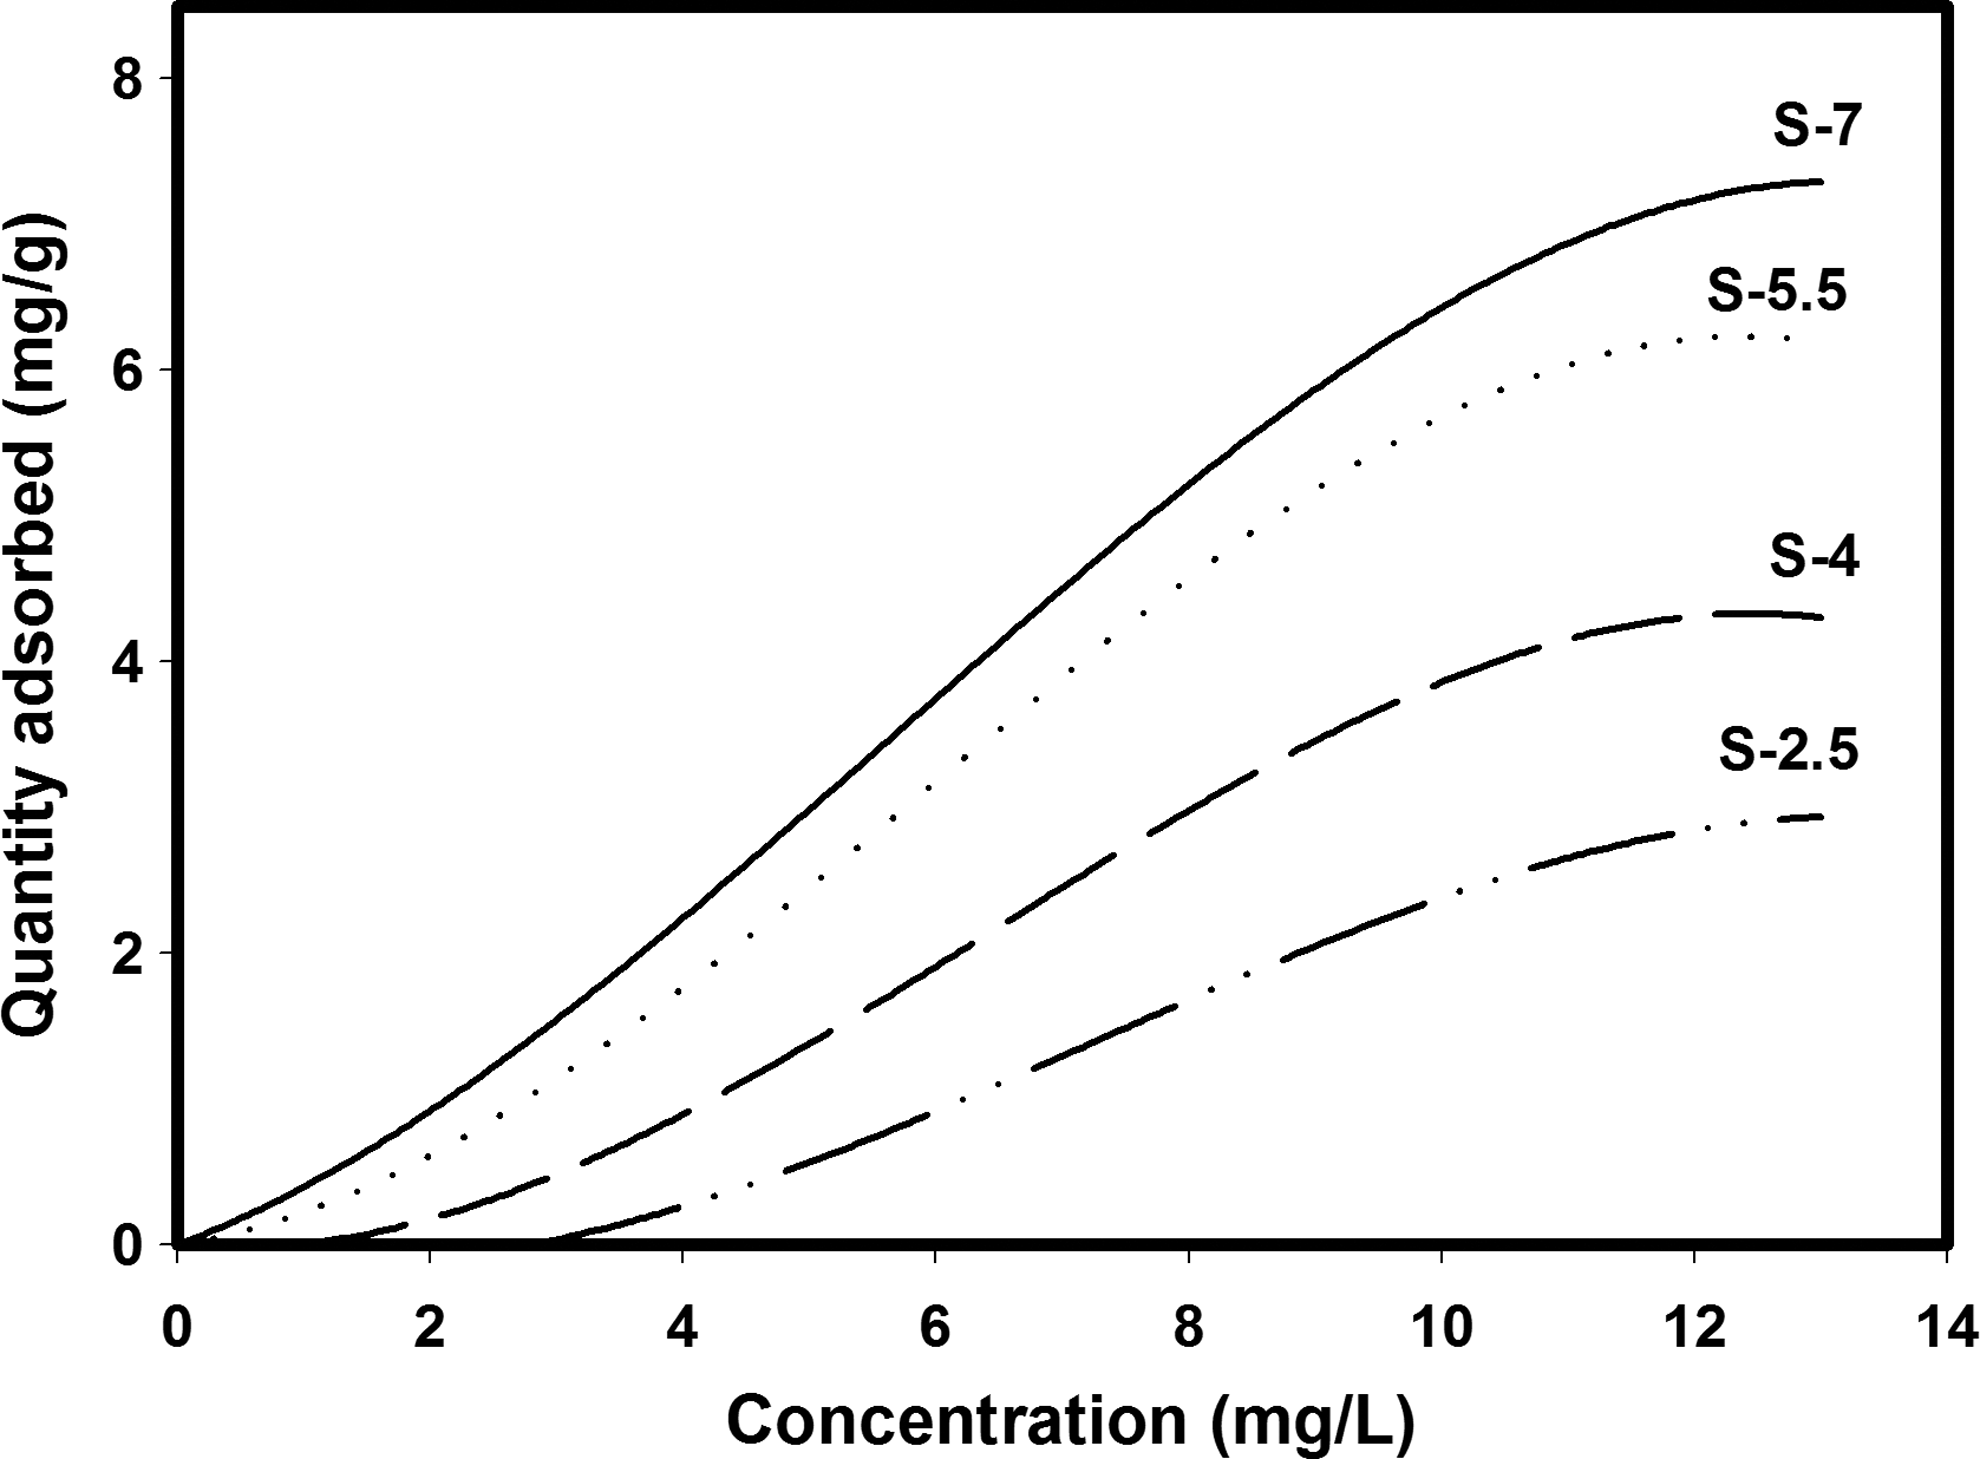
Adsorption isotherms of CV on RFXs at 25°C, with adsorbent weight (0.1–0.2 g) and feed solution pH of 7.
S-7 and S-2.5 represent, respectively, the highest and lowest capacities for CV adsorption. Experiments were conducted with the CV feed solution pH values ranging from 1 to 8. Figure 12 depicts the effect of pH on CV adsorption for an initial CV concentration of 9 mg/L at 25°C. The adsorption capacities of CV increased, when pH rose from 2 to 8. A maximum adsorption capacity of CV was at a pH of ∼7.4–8. The pK for the protonation of CV is about 1, which may be considered the main reason in a slight increment of CV adsorption (Hoppe et al., 1997).

Effect of feed solution pH on the adsorption capacity of CV on S-7 and S-2.5 with adsorbent weight (0.1–0.2 g) at 25°C.
Regeneration and reusability of adsorbents are important aspects in practical applications. The CV adsorption and desorption on RFXs were repeated to examine the recyclability of RFXs for CV adsorption. Adsorbed CV was fully desorbed when washed with 8% (v/v) acetic acid in methanol (Liao et al., 2004). According to Fig. 13, the adsorption capacity of CV on RFXs was not noticeably affected after being regenerated and reused for seven times. Therefore, RFXs are characterized by a high reuse efficiency (∼100%).
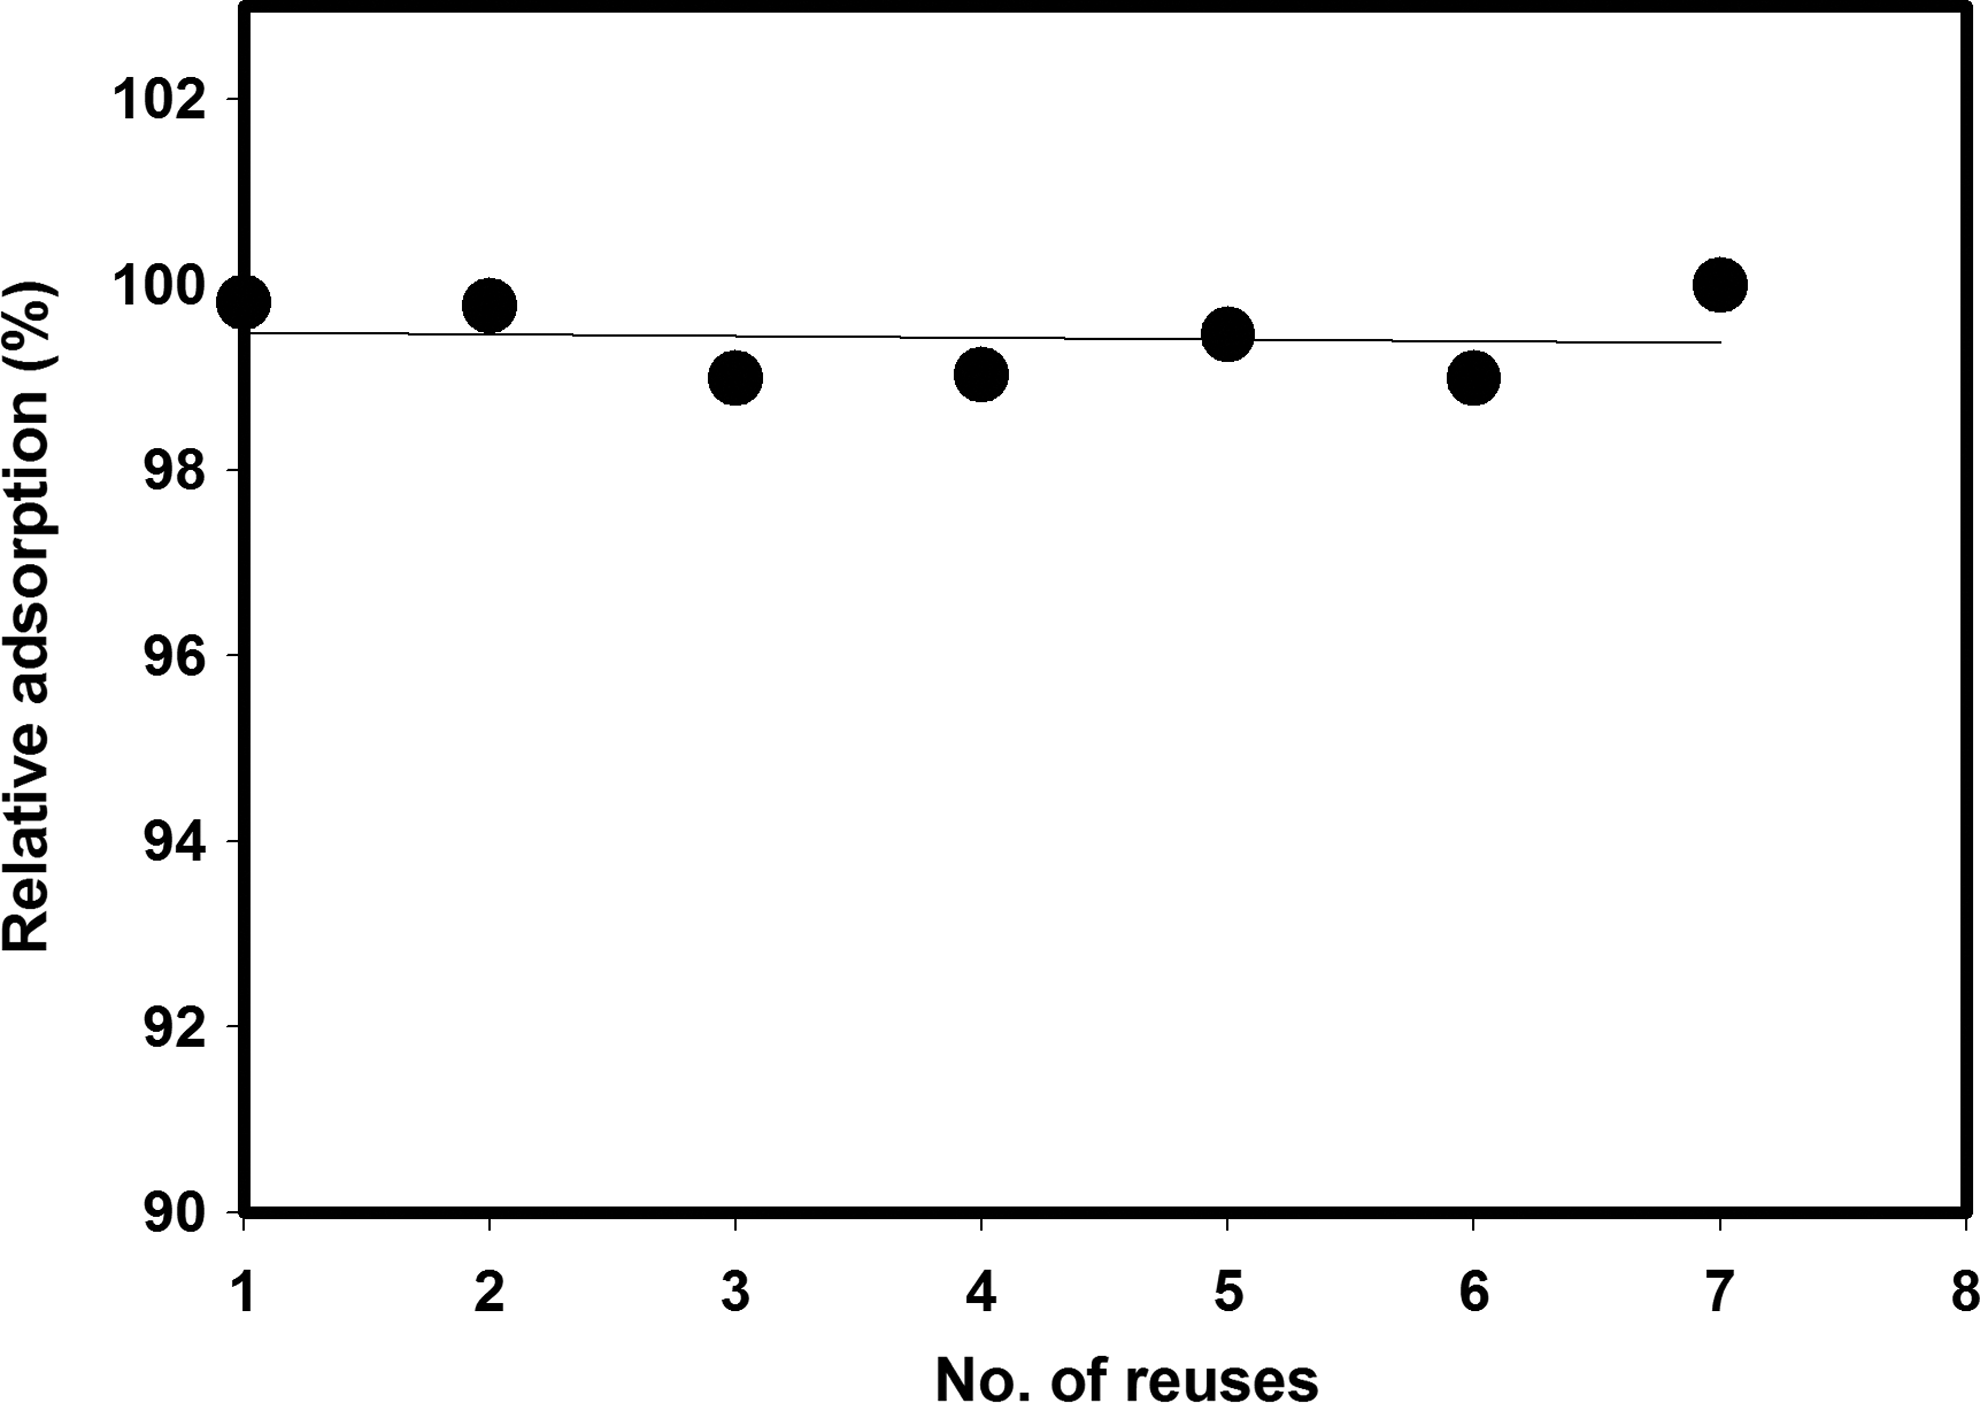
Relative adsorption capacity (percentage of first-cycle capacity) of CV on S-7 after subsequent regenerations and reuses. The initial feed concentration of CV is 3 mg/L, and the adsorbent loading is 0.1 g in 50 mL.
Conclusions
RFXs were synthesized with a fixed recipe and pH of 2.5–7.0, and each RFX has an imprinted pore structure. Both the relative crystalinity and thermal stability of RFXs increase when synthesizing RFXs at higher pH values. The pore structures of RFXs covered the micropore and mesopore scales. The surface areas and pore volumes of RFXs increased with pH. The RFX synthesized with pH of 7 exhibited the highest surface area and adsorption capacity of CV, and vice versa for the RFX synthesized at the lowest pH of 2.5. The results suggested that CV adsorption on RFXs is dependent not only on pore structures, but also on the CV feed solution pH and concentration. RFXs exhibited a high efficiency of regenerating and reusing for the adsorption of CV.
Footnotes
Acknowledgments
This publication was made possible by the support of a National Priorities Research Program grant from the Qatar National Research Program. The statements made herein are solely the responsibility of the authors.
Author Disclosure Statement
No competing financial interests exist.