
Abstract
Abstract
Temporal and spatial drinking water bacterial diversity was evaluated through bulk water sampling from three locations, at varying distances from the treatment plant, in a chlorinated distribution system serving 250,000 people. Most bacteria were identified as alpha-, beta-, and gamma-Proteobacteria based on quantitative polymerase chain reaction assays targeting these bacterial classes as well as bacteria. Temporal variability is correlated with seasonal changes in the chlorine concentration as shown by the positive relationship between the hypochlorite dose and alpha-Proteobacteria. Analysis of variance of alpha-, beta-, and gamma-Proteobacteria and bacteria quantities for all sites and months suggests that temporal patterns are stronger than spatial patterns in this system population. Band patterns from PCR-based denaturing gradient gel electrophoresis using bacterial primers also reveal the importance of temporal variability as samples clustered by months more than by locations. These results demonstrate the consistent presence of alpha-, beta-, and gamma-Proteobacteria at different locations within a particular distribution system and suggest these bacterial classes may be useful indicators of system conditions.
Introduction
D
The stability or consistent predominance of specific bacterial classes during different seasons and at different locations is influenced by the water quality. Specifically, chlorine concentration and temperature have been shown to affect bacterial abundance and diversity. A lower chlorine dose is needed to maintain a consistent residual in the distribution system during cooler temperatures (Boccelli et al., 1998; Roccaro et al., 2008) because the disinfectant decay rate is decreased (Kiene et al., 1998). Significant changes in chlorine dosing during transitional periods may influence the bacterial diversity profile. Alpha-Proteobacteria have been observed to predominate in treated system bulk water, while beta-Proteobacteria were observed more frequently in the presence of a low disinfectant residual, which suggests that the observed beta-Proteobacteria were more chlorine sensitive (Kalmbach et al., 1997; Williams et al., 2004). Moreover, other researchers have observed decreased representation from the phylum Proteobacteria as well as the class beta-Proteobacteria, following chlorine disinfection (Kormas et al., 2010; Poitelon et al., 2010). However, discontinuous chlorination studies yielded the opposite trend, where alpha-Proteobacteria predominated at low disinfectant concentrations in bulk water and biofilm samples (Mathieu et al., 2009). These studies demonstrate bacterial population shifts as a result of temperature-induced chlorine dosing changes indicating that temporal variability of bacterial diversity may be influenced by global system conditions. These temporal trends are strong and reliable. If these trends predominate over spatial variability, these predictable populations may be useful indicators of system disruptions without the need to consider multiple distribution system locations.
In this study, the spatial variability of bacterial diversity at three different locations within a distribution system was evaluated with monthly sampling over one year and analyzed using quantitative polymerase chain reaction (qPCR) and denaturing gradient gel electrophoresis (DGGE) techniques to determine if the predominant bacterial classes, alpha-, beta-, and gamma-Proteobacteria, are consistent across multiple distribution sites. Previous studies have examined several different sites within single or multiple distribution systems, but most studies have limited site sampling to two or three times a year (Keinänen et al., 2004; Ultee et al., 2004; Martiny et al., 2005; Rudi et al., 2009). Previous research suggests consistent bacterial diversity profiles using 16S rRNA gene clone libraries, 16S rRNA gene sequencing of R2A grown colonies, DGGE, and fluorescent in situ hybridization for different spatial samples collected within the same seasonal period or at similar temperatures (Kalmbach et al., 1997; Santo Domingo et al., 2003; Eichler et al., 2006; Poitelon et al., 2009; Revetta et al., 2010). Recently, two studies concluded that bulk water bacterial abundance and community structure were highly similar across several locations, based on two samples from a single month (Henne et al., 2012; Sekar et al., 2012), while another found higher stability in the community structure of distribution system samples, compared with source and prefiltration water samples, collected over three seasons (Pinto et al., 2012). This is the first study to evaluate the spatial variability of bacterial diversity at multiple distribution sites using monthly sampling and molecular techniques for a complete year.
Multiple molecular techniques, including 16S rDNA clone library analysis, 16S rRNA gene fingerprinting, and sequencing of DGGE bands, have determined that Proteobacteria predominate bacterial populations in distribution systems (Kalmbach et al., 1997; Williams et al., 2004; Lee et al., 2005; Tokajian et al., 2005; Eichler et al., 2006; Poitelon et al., 2009; Rudi et al., 2009). Utility implementation of a monitoring method will require a rapid, high-throughput screening method to detect and quantify these bacterial classes, and thus, a multiplex real-time qPCR technique to target and quantify the predominant classes (Rudi et al., 2010) is an ideal approach. The objective of the present study is to determine if the predominant bacterial classes identified in drinking water distribution systems, namely, alpha-, beta-, and gamma-Proteobacteria, have spatial consistency within a system and thus could be used as indicators of system status in a real-time contaminant detection system.
Materials and Methods
Drinking water collection and total DNA extraction
Bulk water samples were collected on the first Wednesday of each month from three different locations, two taps, and one continual flow pipe location, in the Pittsburgh Water and Sewer Authority (PWSA) drinking water distribution system over one year. The free chlorine concentration range for Sites 2 and 3 (data was not available for Site 1) is between 0.06 mg/L (summer) and 0.70 mg/L (winter). The system goal for chlorine residual is 0.05–0.5 mg/L. The water temperature range is between 5°C (winter) and 28°C (summer) at the three sites, based on measurements taken at sampling times. Treated water is delivered to Site 1 from a reservoir, leading to a water age of 60–130 h (2.5–5.5 days) (Daley, 2007). Sites 2 and 3 are fed from another reservoir with water age ranges of 152–159 h (∼6.5 days) and 272–307 h (11.3–12.8 days), respectively. Site water ages were estimated from a 2007 PWSA fluoride tracer. The utility provided data on the treatment plant chlorine dose and temperature, booster station chlorine dose, site free chlorine, site temperature, total organic carbon, and pH.
Sample collection, sample filtration, DNA extraction, and DNA quantification procedures were identical to those described in McCoy and VanBriesen (2012). Briefly, 10-L water samples were collected from each site in two 5-L sterile polypropylene carboys containing 50 mL of 3.0% sodium thiosulfate solution (0.03% final concentration) to quench chlorine reaction. Ten liters of water was filtered on a 0.2-μm filter (Millipore) and DNA was extracted from the filter using the Wizard Genomic DNA Purification Kit (Promega) with three modifications, bead beating before lysozyme addition, different elution buffer (10 mM Tris-Cl, pH 8.5), and decreased elution volume (50 μL). DNA was quantified using the PicoGreen dsDNA quantification reagent (Invitrogen) and 1XTE buffer (10 mM Tris-Cl, 1 mM ethylenediaminetetraacetic acid, pH 7.5) and measuring fluorescence at 480 nm.
qPCR assay for determining alpha-, beta-, and gamma-Proteobacteria
DNA extracted from monthly samples was analyzed using three bacterial class-specific primers and a universal primer, shown in Table 1, to determine the quantity of alpha-Proteobacteria, beta-Proteobacteria, gamma-Proteobacteria, and total bacteria. Before qPCR sample assays, the primer concentration and annealing temperature were optimized using DNA extracted from liquid cultures of relevant drinking water bacteria. Briefly, each 25 μL qPCR reaction contained 1×Power SYBR Green PCR Master Mix (Applied Biosystems), 300 nM of each forward and reverse primer, and 2 μL of DNA templates, except for alpha-Proteobacteria with 600 nM of each forward and reverse primer. Thermal cycling conditions were 50°C for 2 min, 95°C for 10 min, followed by 40 cycles of 95°C for 15 s and 60°C for 1 min, and a 7-min hold at 60°C, except for alpha-Proteobacteria with annealing at 55°C. Triplicate reactions for each target group were run on a 7500 Real-Time PCR System with DNA-grade water negative controls and plasmid DNA standards ranging from 101 to 109 copies/μL. To create plasmid DNA templates, representative bacterial cultures were purchased from the American Type Culture Collection (ATCC). DNA was extracted from representative stationary-phase cultures, Sphingomonas sp. (ATCC BAA-1092) for alpha-Proteobacteria, Delftia sp. (ATCC 15668) for beta-Proteobacteria, and Escherichia coli (ATCC 11775) for gamma-Proteobacteria and bacteria, and the extracted DNA was amplified using BAC27F (5′-AGA GTT TGA TCC TGG CTC AG) (Weisburg et al., 1991) and BAC805R (5′-GAC TAC CAG GGT ATC TAA TCC) (Yu et al., 2005) primers, except for gamma-Proteobacteria, which used primers BAC805F (5′-GGA TTA GAT ACC CTG GTA GTC) and Uni1492R (5′-GGT TAC CTT GTT ACG ACT T) (Weisburg et al., 1991). These PCR products were cloned into pCR2.1-TOPO vectors (Invitrogen), transformed E. coli cells were grown in Luria-Bertani broth with ampicillin overnight, and the QIAquick Spin Miniprep Kit (Qiagen) was used to extract plasmid DNA. Plasmid standards were quantified using the method described previously and serially diluted in a 10 mM Tris-Cl buffer.
Published with permission from ASCE.
Tm, melting temperature; position, 16S rRNA gene sequence position using Escherichia coli numbering.
Denaturing gradient gel electrophoresis
Using extracted DNA as template, the 16S rRNA gene was amplified using primers BAC27F and BAC805R. PCR reactions contained extracted DNA, 1×PCR buffer, 200 μM of each deoxynucleoside triphosphate, 2.0 mM MgCl2, 100 nM of each forward and reverse primer, and 0.05 U of Taq DNA polymerase (Invitrogen). Cycling conditions were 3 min at 95°C, 35 cycles of 94°C for 1 min, 55°C for 45 s, and 72°C for 1 min, with a 15-min final extension at 72°C. The 27F/805R PCR products were used as template DNA in a nested PCR reaction containing 1×PCR buffer, 200 μM of each deoxynucleoside triphosphate, 2.0 mM MgCl2, 300 nM of each bacterial primer, BAC341F-GC (CGC CCG CCG CGC GCG GCG GGC GGG GCG GGG GCC GGG GGG CCT ACG GGA GGC AGC AG) and BAC534R (ATT ACC GCG GCT GCT GG) (Muyzer et al., 1993) and 0.05 U of Taq DNA polymerase. Nested PCR was necessary due to low DNA concentrations in treated drinking water samples. Cycling conditions were 95°C for 3 min, 35 cycles of 94°C for 1 min, 55°C for 45 s, and 72°C for 40 s, with a 7-min final extension. Nested PCR products were purified using the QIAquick PCR Purification Kit (Qiagen). Twenty-five microliters of PCR product was mixed with 25 μL 2×loading dye and loaded on an 8% acrylamide gel with a parallel 40–65% denaturant (urea and formamide) gradient. Gels were run on a DCode Universal Mutation Detection System (Bio-Rad Laboratories) for 15 h at 70 V, stained in SYBR Gold dye (50 μL dye in 500 μL of 1× TAE buffer solution) for 20 min, and visualized with a ultraviolet transilluminator. GelComparII software (Applied Maths, Inc.) was used to normalize images and compare samples using cluster analysis.
Statistical analysis
The Kolmogorov–Smirnov test with a 0.05 significance level was used to confirm the lognormality of the data, grouped by bacterial class or by bacterial class and site. Microsoft Excel 2010 was used to perform single-factor analysis of variance (ANOVA) and linear regression (Analysis Toolpak) as well as determine correlation coefficients and Tukey-Kramer ranges. Critical values for correlation and linear regression coefficients were determined using a two-tailed t distribution and a 0.05 significance level. Critical values for linear regression fit were determined using the one-tailed F distribution and a 0.05 significance level.
Results and Discussion
Factors affecting bacterial diversity
There is a consistent presence of alpha-, beta-, and gamma-Proteobacteria across the monthly samples for the three distribution sites, shown in Fig. 1, but there is some temporal variability in bacterial quantity and diversity. Decreased bacterial abundance during winter compared with summer was observed at all sites. The temporal trend of decreased bacterial quantity in colder months has been reported in other distribution systems (Lechevallier et al., 1991; Torvinen et al., 2007) and is likely because of the temperature effect on microbial metabolism. For mesophilic bacteria, common in aquatic environments, increased temperatures cause faster chemical and enzymatic reactions yielding more metabolic activity and growth. Conversely, it is probable that the bacteria exhibit more limited metabolism and growth in winter with system water temperatures of 5°C.
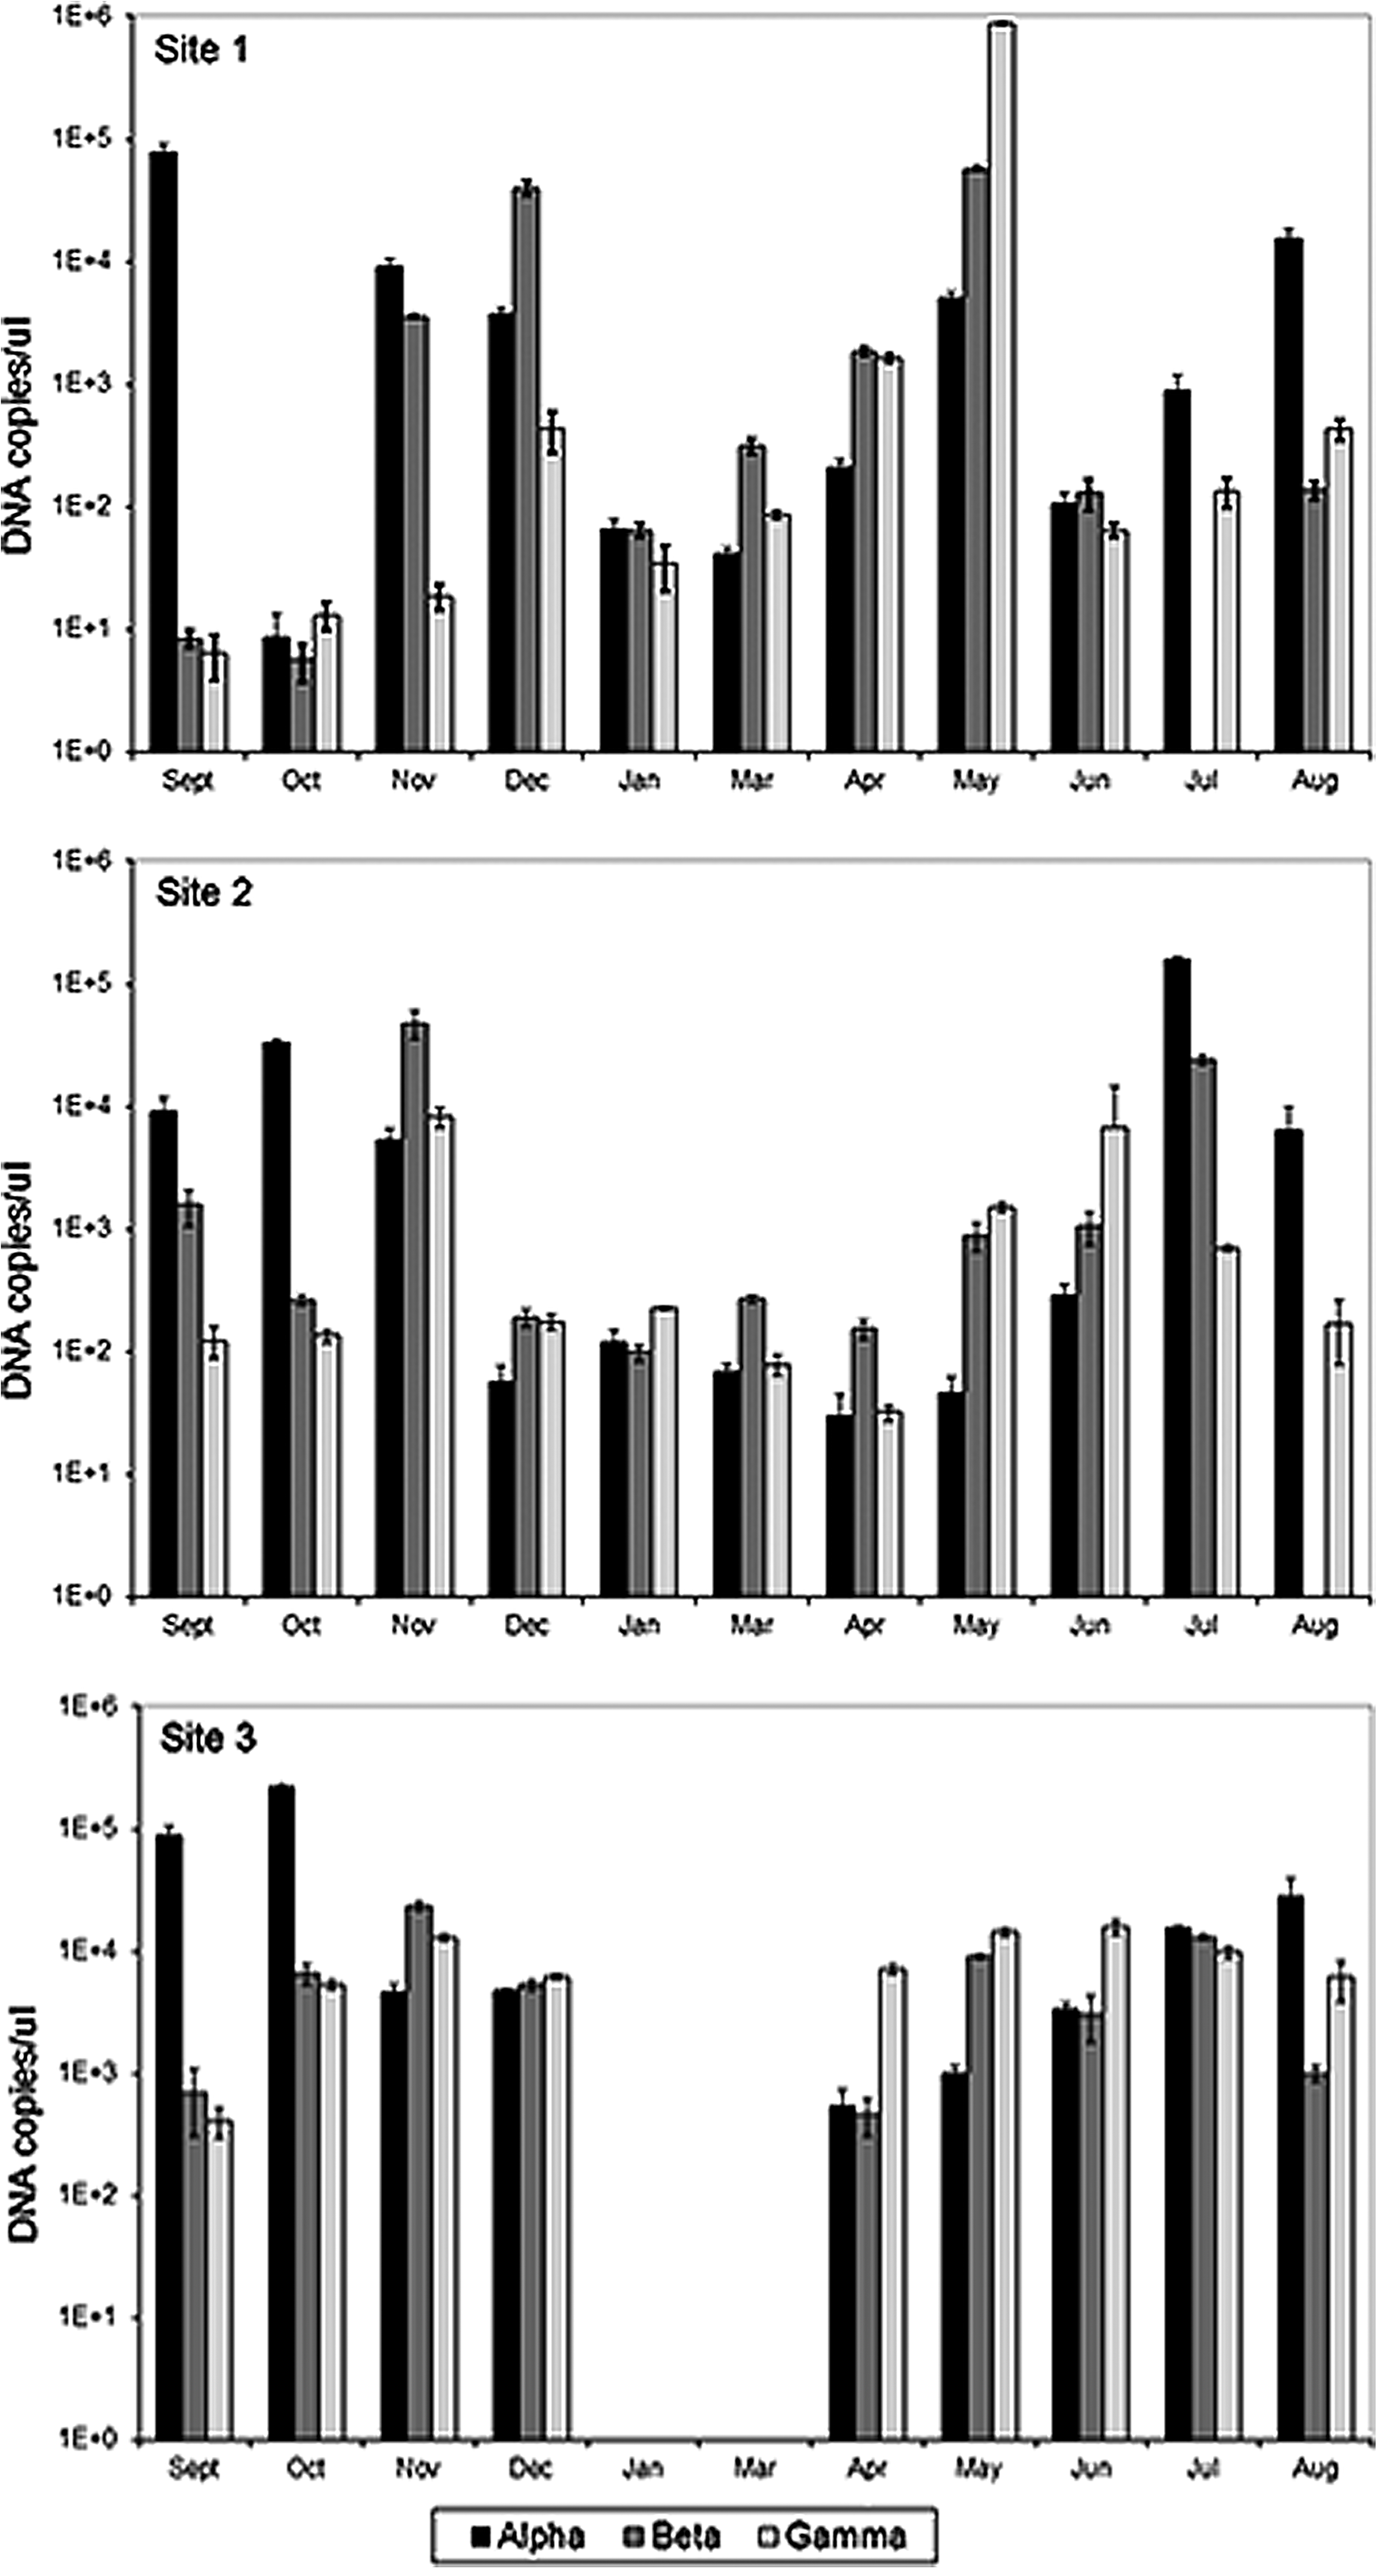
The alpha-, beta-, and gamma-Proteobacteria quantities for monthly samples at all distribution system sites. Site 1 is shown in the top panel, Site 2 in the middle panel, and Site 3 in the bottom panel and the sites are shown in the order of increasing water age. It was not possible to collect samples in January or March at Site 3. Error bars indicate standard deviation of triplicate quantitative polymerase chain reaction samples. Note that the y-axis (DNA copies/μL) is a log scale.
Consistent with the Site 1 temporal trend previously reported in McCoy and VanBriesen (2012), alpha-Proteobacteria predominate Site 2 and 3 bacterial populations during warmer months, while there is increased contribution from beta- and gamma-Proteobacteria in cooler months, which is likely a function of seasonal changes in chlorine. No beta-Proteobacteria were detected in water samples collected at Sites 1 and 2 during the summer months of July and August, respectively, which supports the hypothesis of alpha-Proteobacteria predominance during periods of increased temperature and chlorine dose. Clearwell hypochlorite dose and temperature are shown in Table 2 as well as site free chlorine residual and temperature. These values are not included in Fig. 1 because clearwell temperature, site chlorine, and site temperature were not correlated with the predominant bacterial classes excepting alpha-Proteobacteria at Site 3.
Water is delivered from a central treatment plant (clearwell) to Sites 1, 2, and 3. Samples were not collected in February at all sites and in January and March for Site 3. Site free chlorine and temperature measurements were not recorded at Site 1.
Inlet Cl, the hypochlorite dose at the clearwell entrance; temp., water temperature; site Cl, the free chlorine residual at the sampling location.
Nonparametric Pearson correlation analyses, shown in Table 3, indicate significant positive correlations between clearwell hypochlorite dose (Inlet Cl) and alpha-Proteobacteria at Site 2 and between booster station hypochlorite dose and alpha-Proteobacteria for Sites 2 and 3, which support a strong relationship between chlorine dose and alpha-Proteobacteria in this subsystem as Sites 2 and 3 receive water from the same reservoir. In addition, there is a significant strong positive correlation between alpha-Proteobacteria and site temperature at Site 3, which suggests that temperature may also influence the quantity of this bacterial class. As expected, given the temperature dependence of chlorine decay, there is a significant correlation between clearwell hypochlorite dose and clearwell temperature for all sites and between booster station hypochlorite dose and site temperature for Sites 2 and 3. Interestingly, Sites 2 and 3 demonstrate a positive relationship between booster hypochlorite dose and alpha-Proteobacteria, while there is a negative relationship between beta-Proteobacteria and booster hypochlorite dose at Site 1. Thus, it appears that the two additional sites corroborate the temporal trend that an increased chlorine dose leads to increased alpha-Proteobacteria, but not necessarily that decreased chlorine pressure in winter leads to an increase in chlorine-sensitive species of beta-Proteobacteria (McCoy and VanBriesen, 2012).
Significant correlation coefficients (p<0.05) are shown in bold. Chlorine and temperature measurements were not collected at Site 1. n=11 for Sites 1 and 2; n=9 for Site 3.
Alpha, beta, and gamma: alpha-, beta-, and gamma-Proteobacteria, respectively; booster, the monthly average hypochlorite dose at a booster station upstream of the sampling location.
All sites show significant strong correlations between chlorine dose (clearwell and booster) and temperature (inlet and site), which suggest that temperature may influence these bacterial populations through its effect on chlorine, although there were no significant correlations between clearwell temperature and bacterial class quantity. To separate the variable effects, particularly temperature and chlorine dose, on the temporal variability of the bacterial groups, multivariate linear regressions were generated using alpha-, beta-, and gamma-Proteobacteria as dependent variables and clearwell chlorine dose, clearwell temperature, booster chlorine dose, site chlorine residual, and site temperature as independent variables. For collinear variables with strong correlations, such as Inlet Cl and Outlet Temp, only the dominant variable, based on coefficient significance, was used in the linear regressions.
Significant regressions and coefficients indicate that temporal variations are largely due to hypochlorite dose, as the clearwell hypochlorite dose coefficient is significant (p=0.002) for alpha-Proteobacteria (r2=0.75, p=0.003), while outlet chlorine residual, booster hypochlorite dose, and site chlorine residual coefficients are not. For beta-Proteobacteria (r2=0.27, p=0.076) and gamma-Proteobacteria (r2=0.20, p=0.198), the booster hypochlorite dose is the sole significant coefficient (p=0.031 and p=0.043, respectively). These results show that the seasonal variations in alpha-, beta-, and gamma-Proteobacteria at all locations are not strongly influenced by temperature effects or chlorine residual concentrations, but rather temperature-induced changes in hypochlorite dosing at the treatment plant or booster station. It is likely that the temporal variability of bacterial class predominance is not affected by only chlorine dose, but also by other factors, such as assimilable organic carbon (AOC) or enzyme activity, which may vary seasonally or with different water ages. A previous study found that the water source, specifically dissolved organic matter (DOM) composition, more strongly affected the bacterial community structure and ectoenzymatic activity than the inoculum source or collection date for the Hudson River alpha-, beta-, and gamma-Proteobacteria (Kirchman et al., 2004). The small sample size of dissolved organic carbon data collected at the sites precluded statistical covariation with bacterial classes; however, finished water AOC variability should be considered in future studies of distribution systems, where long residence times may allow significant growth of predominant bacterial classes, despite adequate chlorine residual.
Finally, in Table 3, there is a significant correlation between beta- and gamma-Proteobacteria at Site 1, which suggests a relationship between these two classes and may explain the increased quantities of both beta- and gamma-Proteobacteria during decreased chlorine dosing in this system. Several studies have shown increased chlorine sensitivity of beta-Proteobacteria species commonly found in drinking water (Williams et al., 2004; Kormas et al., 2010; Poitelon et al., 2010), but these results indicate that some gamma-Proteobacteria species may also have increased chlorine sensitivity.
Statistical comparison between sites and between months
Univariate ANOVA was used to compare the natural logarithms of DNA quantities of four groups: alpha-, beta-, and gamma-Proteobacteria, and bacteria, between the three sites and between the eleven months. The ANOVA results suggest that there is limited spatial variability with respect to the bacterial group quantities at the three system locations. For between site comparisons, shown in Table 4, total bacteria, alpha-, and beta-Proteobacteria quantities were not significantly different among the three sites. However, there was a significant difference in the gamma-Proteobacteria quantities between sites (p=0.005). This difference is likely due to greater gamma-Proteobacteria quantities for most months at Site 3, which may result from its higher water age of 272–307 h compared with 60–130 h and 152–159 h for Sites 1 and 2, respectively. Longer water ages allow for more bacterial growth and biofilm sloughing. A recent study noted that gamma-Proteobacteria were the most abundant group in biofilms under different hydraulic regimes (Douterelo et al., 2013), so the higher gamma-Proteobacteria at Site 3 could be related to increased biofilm sloughing; however, further studies would be needed to assess the diversity of biofilms in this drinking water distribution system.
The analysis of variance analyses compared the natural logarithm DNA quantity between the three sites (Site 1, 2, 3), and between the months (September, October, November, December, January, March, April, May, June, July, and August) at a significance level of 0.05. February samples were not collected at all sites and January and March samples were not collected at Site 3. Bold text indicates a statistically significant result.
For between month comparisons, there is a significant difference among the 11 months for total bacteria (p=0.049) and alpha-Proteobacteria (p=0.049) quantities. Subsequent Tukey-Kramer tests revealed no significant differences between individual site pairs (i.e., Site 1 compared with Site 2) for gamma-Proteobacteria or between individual month pairs for total bacteria and alpha-Proteobacteria. A significant ANOVA result and a not significant Tukey-Kramer is not surprising given that the latter test is more conservative to control the significance level across multiple comparisons, but it suggests that the significant ANOVA results be reported with caution. The evaluation of Tukey-Kramer mean ranges shows several nearly significant pairs, including Site 3 and Site 1 for gamma-Proteobacteria, September and March for alpha-Proteobacteria, and September and January for total bacteria. Thus, it is likely that these pairs contribute to the significant ANOVA result, but an additional study with larger sample sizes is needed to validate the observed differences. In addition, the three sigma rule was applied to the lognormally distributed bacterial quantities and no outliers were identified.
Overall, the ANOVA results suggest that temporal variability has more influence than spatial variability for total bacteria and alpha-Proteobacteria because there is a significant difference between months, but not between sites. The analytical methods used may influence this result as another distribution system study observed that diversity profiles derived from molecular and cultivation methods tend to correlate with sampling times and locations, respectively (Burtscher et al., 2009). There is no significant difference between months for the beta- and gamma-Proteobacteria quantities, which indicates that these bacterial classes have a less established temporal pattern. Thus, the present work suggests that the temporal variability, which is highly correlated with changes in chlorine dosing, is the predominant factor influencing bacterial diversity in a distribution system. This is an important result because it suggests that the spatial location of sampling points is not the critical concern in this distribution system. Similar studies would be needed for other drinking water systems to confirm this finding. Moreover, it is important to conduct a long-term assessment (over several years) to establish the temporal patterns in the bacterial diversity of a particular system to use bacterial classes as a valuable indicator of bacterial water quality. As it is not possible to measure all potential pathogens, it may be possible to use predominant bacterial classes as indicators of stability (i.e., good bacterial quality) and significant changes in these indicators would suggest that drinking water safety had been compromised. For example, gamma-Proteobacteria quantity in this system is frequently less than the combined quantity of alpha- and beta-Proteobacteria; thus, it may be possible to detect a significant change in the bacterial quality by monitoring the percentage of gamma-Proteobacteria. Such an indicator would be particularly useful given the large number of water-related pathogens in the gamma-Proteobacteria class (CDC, 2007).
Cluster analysis of DGGE
The cluster analysis of the 16S rRNA gene fingerprints, shown in Fig. 2, corroborates the statistical analyses and indicates that the samples cluster temporally more than they cluster spatially. The dendrogram, shown in Fig. 3, has two major branches showing 58.7% similarity among seven samples (Branch 1) and 61.8% similarity among 19 samples (Branch 2) with 49% similarity between the two branches, while the outlier branch (Branch 3) has only 33% similarity with the other two branches. The samples in Branch 1 cluster temporally with September Site 3, September Site 2, November Site 1, December Site 3 and November Site 3 having 65.4% similarity and with August Site 2 and August Site 3 having 93.4% similarity. In addition, there is also temporal clustering in Branch 2 with 86.6% similarity between March Site 2, April Site 2, April Site 3, May Site 1, May Site 3, and May Site 2 samples. In Branch 2, there is some spatial clustering with November Site 2 and December Site 2 having 96.8% similarity, October Site 1 and December Site 1 having 94.9% similarity, and March Site 1 and April Site 1 having 80.3% similarity, but even in these cases, the samples are from months in the same season.

Denaturing gradient gel electrophoresis (DGGE) band patterns using bacterial primers for all monthly samples. The samples are grouped by months from September to August. Labels 1, 2, and 3 below each lane refer to Sites 1, 2, and 3, respectively. Samples were not collected at Site 3 in January and March.
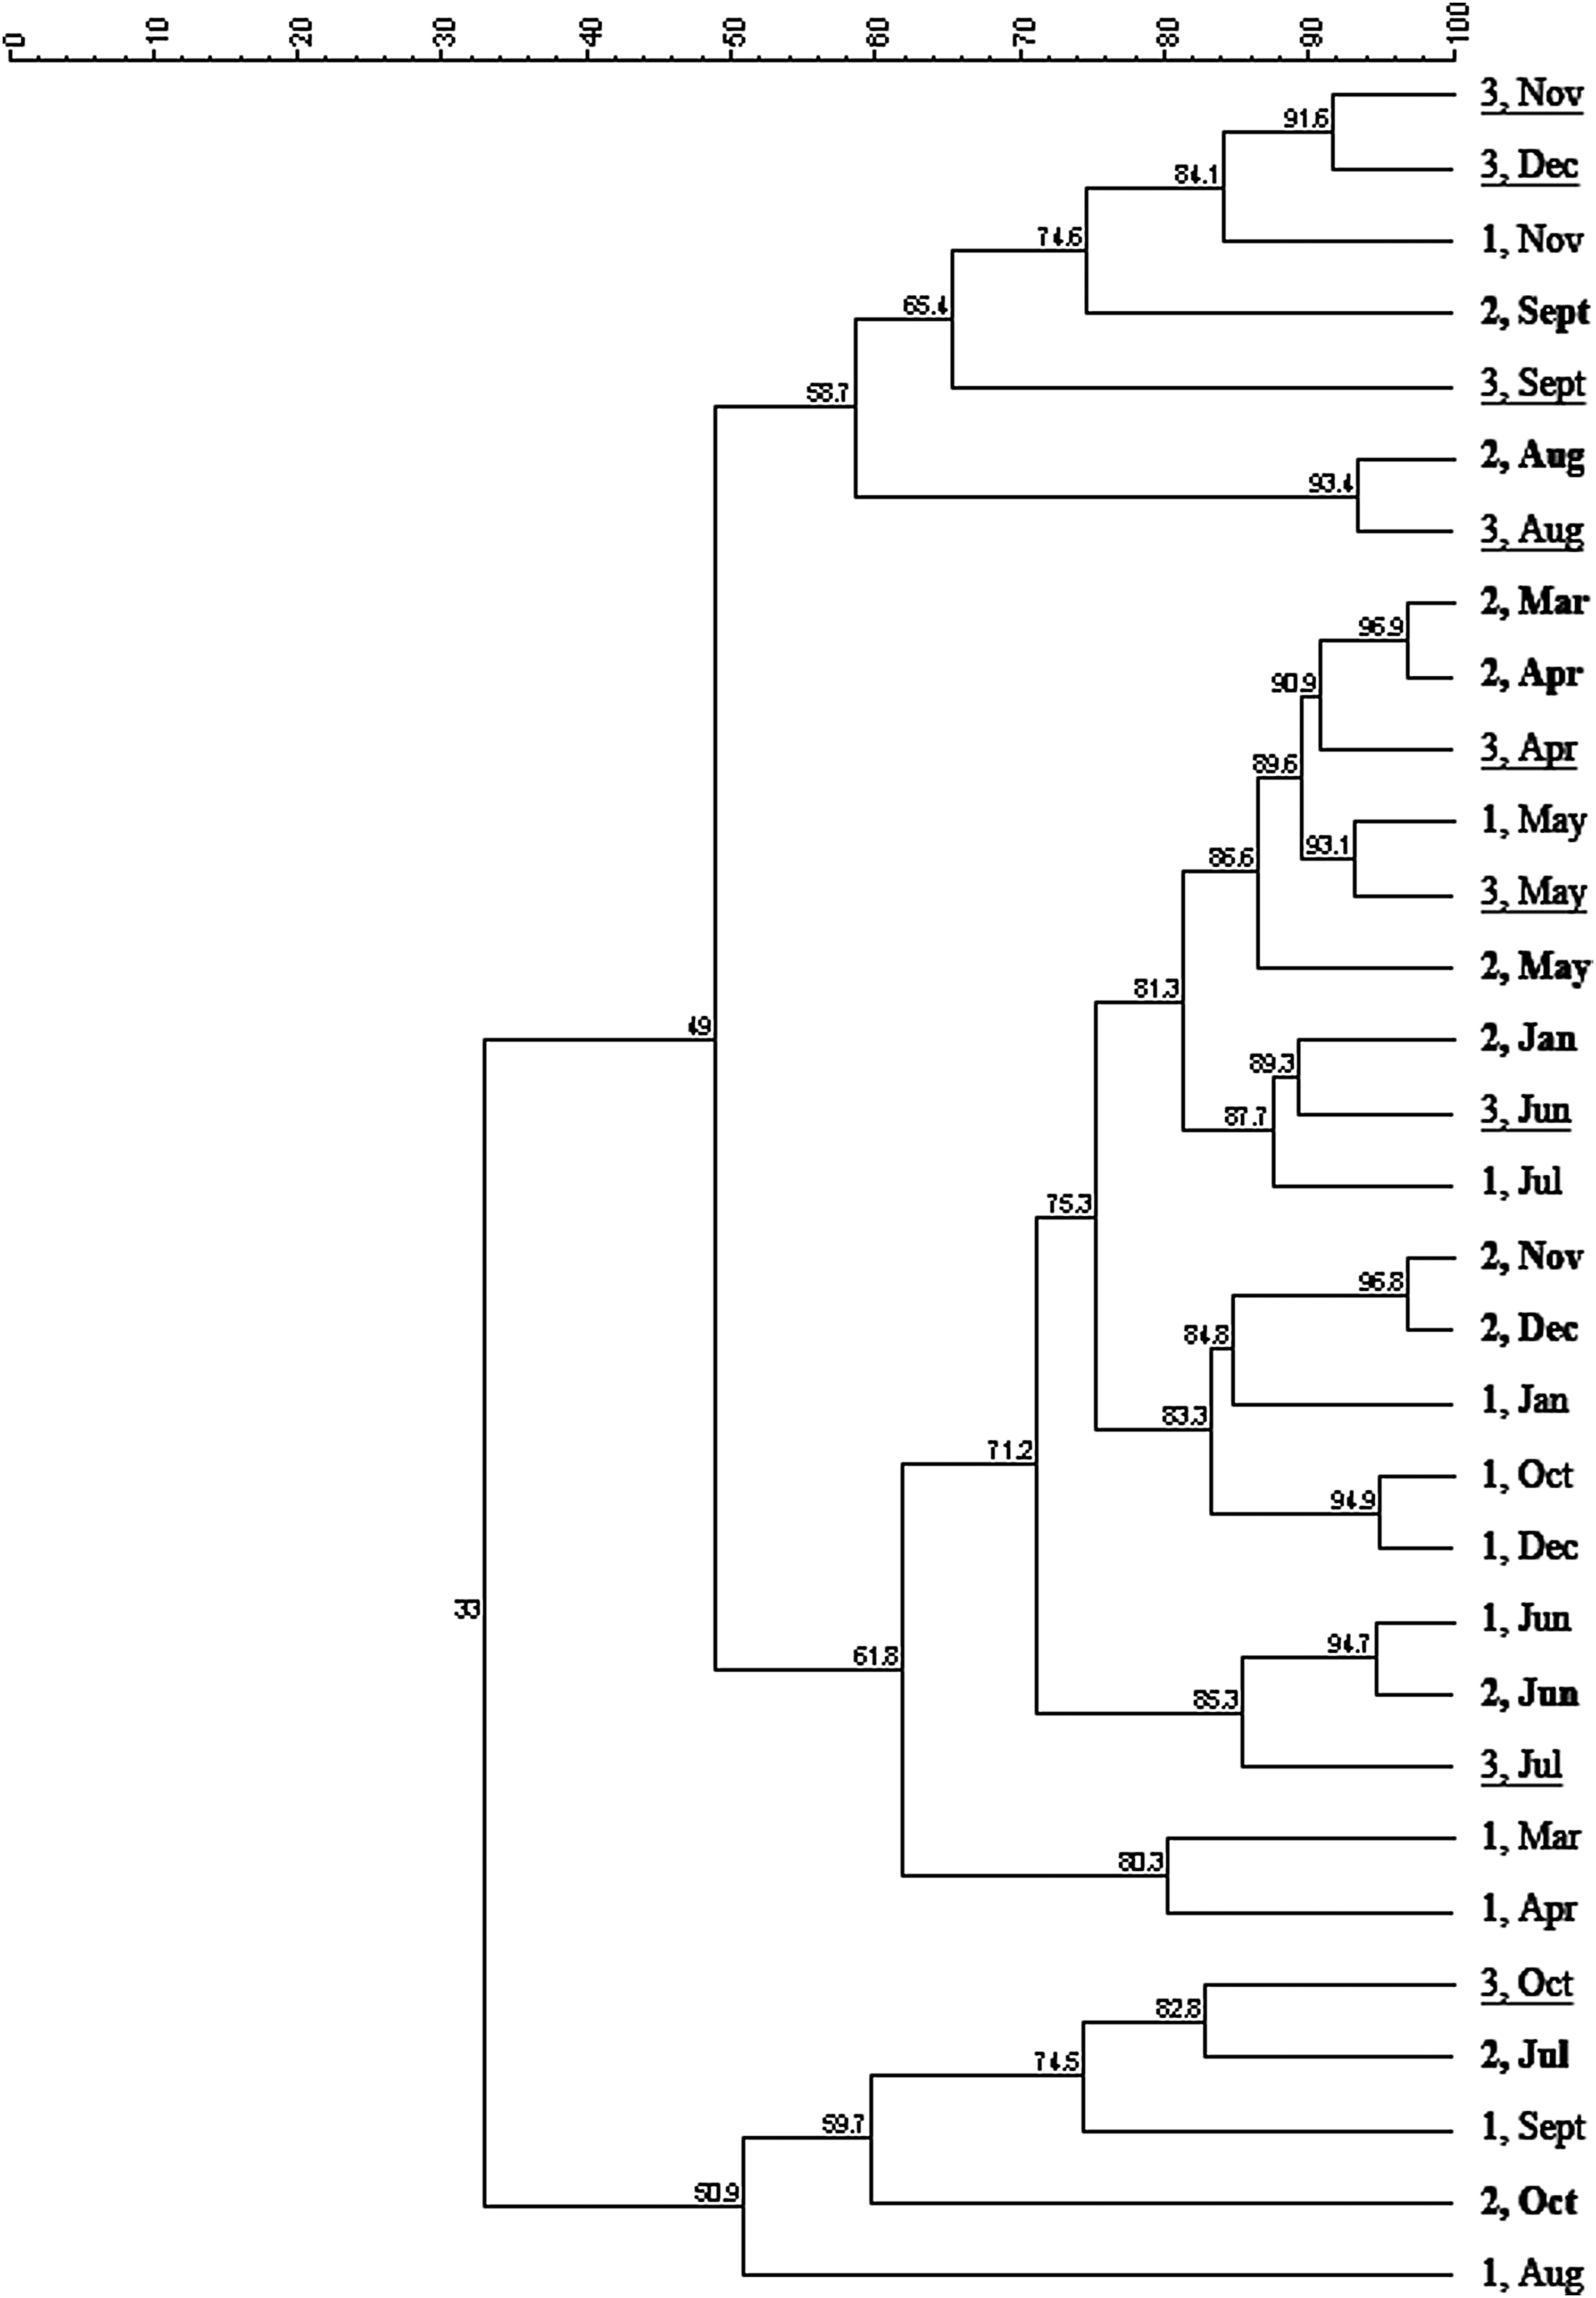
Dendrogram of DGGE band patterns of the monthly samples using the unweighted pair group method with arithmetic mean clustering algorithm. The scale shows the Pearson correlation coefficients. Labels indicate the site number and the month. Sites 1, 2, and 3 are highlighted with regular, bold, and underlined text, respectively.
The cluster analysis indicates that samples cluster temporally (by month or season) more than they cluster spatially (by site), which supports the ANOVA results, but it may have limited power because of the use of nested PCR for DGGE. Nested PCR was used to increase the PCR product yield of extracted drinking water DNA, which reconciled the DGGE band intensity in comparison to single-reaction PCR DGGE gels. Gels loaded with non-nested PCR products yielded band patterns with different intensities, which made normalization and clustering analysis difficult, but comparison of band position and number of bands is fairly consistent for the two gel runs. Although nested PCR may introduce bias through preferential amplification (von Wintzingerode et al., 1997), it increases sensitivity and specificity through elimination of nonspecific amplicons from the first PCR reaction. Moreover, standard samples selected based on the presence of strong intensity, distinct bands in samples collected at Site 1 in December and Site 3 in September, were present in all three gels. Although there are limitations with DGGE, in this case, it is useful to examine the temporal and spatial patterns noted in the qPCR analyses.
Conclusions
This represents the first study to evaluate temporal and spatial variability in autochthonous planktonic bacterial populations in a drinking water distribution system with a year of monthly sampling using qPCR and DGGE. The predominant bacterial classes, alpha-Proteobacteria, beta-Proteobacteria, and gamma-Proteobacteria are consistent across all the three system sites. The three sites have a similar temporal trend with increased total bacterial quantity during warmer temperatures as a result of faster chemical reactions and consequently increased metabolism and growth and increased alpha-Proteobacteria in warmer months as a result of changes in hypochlorite dose, but limited spatial variability based on ANOVA comparisons. The predominance of temporal variability over spatial variability was also demonstrated in the DGGE cluster analysis where samples clustered by seasons more often than by locations. Although further analysis is needed to confirm this finding in other distribution systems, these results demonstrate the consistent and predictable presence of alpha-, beta-, and gamma-Proteobacteria in this particular drinking water distribution system and suggest these bacterial classes may be useful indicators of bacterial water quality, independent of the sampling location.
Footnotes
Acknowledgments
The authors thank Ms. Allison Retotar for her laboratory assistance in processing the monthly samples, and Dr. Stanley States and Mr. Mark Stoner of PWSA for providing access to the collection sites and sharing data on system parameters. This work was supported by a grant from the National Science Foundation for a project entitled, “SENSORS: Placement and Operation of an Environmental Sensor Network to Facilitate Decision Making Regarding Drinking Water Quality and Security,” through the Division of Biological and Environmental Engineering (BES-0329549). All opinions expressed in this article are the authors' and do not necessarily reflect the policies and views of the NSF.
Author Disclosure Statement
No competing financial interests exist.