
Abstract
Abstract
Chelating agents have been widely studied for enhancing the effectiveness of soil remediation. Natural and induced drying process may alter the interactions between chelating agents and iron oxides requiring a better mechanistic understanding. This study employed attenuated total reflectance (ATR) and transmission Fourier-transform infrared (FTIR) and X-ray photoelectron spectroscopy (XPS) to evaluate the influence of aqueous and dehydrated conditions on the adsorption mechanisms of EDDS ([S,S]-ethylene-diamine-N,N′-disuccinic acid) on goethite and hematite, while EDTA (ethylene-diamine-tetraacetic acid) was studied for comparison. In aqueous phase, ATR-FTIR analysis revealed that outer-sphere surface complexation was the dominant adsorption mechanism for both EDDS and EDTA. Chelant adsorption was more significant on goethite than hematite because of higher surface charge and stronger electrostatic attraction at acidic pH. Upon dehydration on the iron oxides, inner-sphere surface complexation was not observed for adsorbed EDDS on goethite and hematite, whereas EDTA formed inner-sphere surface complexes on goethite (bidentate binuclear adsorption) and hematite (monodentate adsorption), as shown by transmission FTIR and XPS analysis. Therefore, EDDS remained weakly bound and mobile compared with EDTA, possibly due to its weaker zwitterionic properties and lower charge density. These results suggest that the environmental fate of EDDS is different from that of EDTA, where wetting–drying process and types of iron oxides also play an important role.
Introduction
C
The interactions of chelating agents with soil minerals would govern the bioavailability and environmental fate of heavy metals in the contaminated soil. Chelant-enhanced metal extraction is believed to start with the facile formation of metal–chelant complexes on the soil surfaces (i.e., surface complexation), followed by kinetic detachment of metal–chelant complexes from the soil surfaces into solution (i.e., dissociation) to maximize their thermodynamic stability (Nowack and Sigg, 1996; Stumm, 1997; Nowack, 2002; Tsang et al., 2009; Zhang and Tsang, 2013). It was shown that, after chelant-enhanced remediation, the bioavailability and mobility of metals were reduced and the residual metals were redistributed (Udovic and Lestan, 2009; Zhang et al., 2010). At the same time, chelants were adsorbed to some extent on iron and aluminium oxides in soils, altering the speciation and availability of chelants and reducing the metal extraction efficiency (Komarek et al., 2009; Yip et al., 2010). Hence, it is important to understand the types of surface complexes that chelants may form upon adsorption on iron oxides. Although a few studies have investigated the interactions of simple organic acids and EDTA at the water–iron oxide interface (Bargar et al., 1999; Noren and Persson, 2007; Ryczkowski, 2007; Noren et al., 2008, 2009; Yip et al., 2010), more spectroscopic information is needed to elucidate the molecular-scale interaction mechanisms between EDDS and iron oxides.
Moreover, natural and induced wetting–drying cycles of soils could be encountered during the course of ex situ (e.g., evaporation between washing cycles or after final washing step) and in situ (e.g., rise and fall of water table during pulsed pumping) site remediation. The structures of surface complexes on iron oxides in aqueous solution may be altered by dehydration at the drying stage (Kang and Xing, 2007; Kang et al., 2008). If outer-sphere complexation is the dominant adsorption mechanism, weakly bound complexes may be readily leached into surrounding environment after soil remediation (Bargar et al., 1999; Noren et al., 2009), which could influence the solution speciation and lead to noticeable metal exchange and contaminant spreading (Tsang et al., 2009; Komarek et al., 2010; Lo et al., 2011b). On the other hand, if inner-sphere complexes are primarily formed (Nowack and Sigg, 1996; Stumm, 1997), rate-limited mineral dissolution would occur to a greater extent that may cause loss of nutrients and soil disintegration, limiting the future reuse of treated soil (Tsang et al., 2007). The interaction mechanisms may vary depending on the types of chelants and iron oxides in addition to environmental conditions.
Therefore, this study aimed to (1) identify the types of surface complexation of adsorbed EDDS on two types of iron oxides (goethite and hematite) in aqueous solutions at pH 5.5 and 8; and (2) evaluate the influence of dehydration on EDDS adsorption mechanisms. For comparison, EDTA adsorption was studied in parallel. Fourier-transform infrared and X-ray photoelectron spectroscopic analyses were conducted to investigate the complexation with carboxylate groups and amine groups of EDDS, respectively.
Materials and Methods
Chemicals and materials
Chelating agents, Na3EDDS (35% in H2O) and Na2EDTA, were purchased from Sigma-Aldrich. The Na2EDTA was dissolved in H2O or deuterium oxide (D2O) for batch experiments and FTIR analysis. The EDDS in H2O was used as received, while the EDDS in D2O was prepared by dissolving freeze-dried (to remove water) EDDS in D2O. The pH values were adjusted to 5.5 and 8 by HCl/NaOH in H2O solution and DCl/NaOD (Aldrich, 35%) in D2O solution (Aldrich, 99.9%), respectively. By using D2O, spectra can be obtained with a superior signal-to-noise ratio (i.e., permitting more light to reach the detector) at 1200–1800 cm−1, where carboxyl groups of chelating agents have the strongest bands (Noren and Persson, 2007; Noren et al., 2008).
Goethite (α-FeOOH, Fluka 71063) and hematite (α-Fe2O3, Wako Pure Chemical Industries) were studied as they are the most thermodynamically stable and abundant iron oxides in natural settings. X-ray diffraction (XRD, Philip PW 1830) and bright-field transmission electron microscope (TEM, JEOL-2010) confirmed the crystalline structures of the iron oxides (not shown). A concentration of about 10 wt% silicon dioxide (quartz) was identified in goethite, whereas impurity in hematite was insignificant. The points of zero charge (pHPZC) of the goethite and hematite were 7.8 and 5.6, respectively, as measured by potentiometric mass titrations (Bourikas et al., 2003). The surface areas were 7.8 and 8.1 m2/g, respectively, as determined by the BET analysis of nitrogen gas adsorption (Micromeritics ASAP 2010, Accelerated Surface Area and Porosimetry System).
Batch study
Solutions of 50 mM of EDDS or EDTA were mixed with goethite or hematite at a solid-to-solution ratio of 50 g/L, with 10 mM NaCl being the background electrolyte. The suspensions were mixed end-over-end at 26 rpm from 1 min to 2 days. Dissolved iron concentrations in the supernatants were measured using atomic absorption spectrometry (Varian SpectrAA 220 FS) and EDDS or EDTA concentrations by total organic carbon analyzer (Shimadzu TOC-5000A). The (pseudo) first-order kinetics of iron dissolution was determined from 1 min to 2 days, of which the r2 values were above 0.97. The variation of pH values before and after experiments was insignificant (pH±0.3). All experiments were replicated four times to ensure the accuracy and reproducibility of the results.
FTIR analysis
Attenuated total reflectance Fourier-transform infrared (ATR-FTIR) analysis was performed to obtain molecular information of the surface complex of EDDS or EDTA in H2O and D2O solutions. The spectra were collected by a single-beam Fourier-transform infrared spectrophotometer, equipped with a Peltier temperature stabilized deuterated tri-glycine sulphate detector and a horizontal ATR accessory with a ZnSe crystal (Spectrum BX, PerkinElmer). The wet mineral paste (goethite or hematite) was purged overnight with nitrogen gas to avoid any CO2 contamination. After the 2-day equilibrium batch experiments, the mineral paste was rinsed with 10 mM NaCl at pH 5.5 or 8 to remove loosely trapped EDDS or EDTA. The sample holding region was covered with a lid to avoid evaporation. Supernatants of the corresponding paste were used as a reference to identify the surface complexes on the iron oxides (Kang and Xing, 2007; Kang et al., 2008; Noren et al., 2008).
Transmission FTIR was used to evaluate the influence of dehydration on the structure of EDDS or EDTA at the surface of iron oxides by comparing with those ATR-FTIR spectra in aqueous phase. The FTIR samples were prepared by mixing the rinsed and freeze-dried mineral paste with KBr (1:99), grinding to fine powder with mortar and pestle, and pressing into thin pellets (radius 1 cm, thickness 0.1 cm). Freeze-dried EDDS or EDTA was used as a reference. The transmission FTIR spectra were recorded at room temperature by scanning 100 times in the spectral ranges.
The scanning range for both ATR and transmission modes was between 1200 and 1800 cm−1, in which carboxyl groups show the strongest bands (Lanigan and Pidsosny, 2007). The spectral resolution and scan speed were set to be 4 cm−1 and 0.5 cm/s, respectively. Subtraction processes were carried out using the procedures described by Noren et al., (2008). All subtractions were performed with the spectrum software (PerkinElmer) by using subtraction factors close to 1 (0.98–1.02). To ensure the reproducibility of peak shift, duplicated samples were prepared for ATR and transmission FTIR analysis.
X-ray photoelectron spectroscopy
X-ray photoelectron spectroscopy (XPS) was used to investigate whether the amine groups of the dehydrated EDDS or EDTA were involved in forming an inner-sphere complex with the iron oxides. The mineral pastes were freeze-dried after the 2-day batch study. The coordinative environment of the element N in the amine group of EDDS or EDTA was determined by acquiring the N 1 s spectra using a PHI 5600 by Physical Electronics with an AlKα monochromatic anode at 350 W.
Results and Discussion
EDDS structure in aqueous solution
Molecular structures and chemical properties of EDDS and EDTA were investigated by the peak assignment in D2O medium. Figure 1 illustrates two strong peaks for EDDS and EDTA at pH 12, corresponding to the fully deprotontated chelants (i.e., EDDS4− and EDTA4−) based on speciation calculation (not shown) using the stability constants (Martell et al., 2004) and Visual MINTEQ (Gustafsson, 2008), where pKa=10.13 (EDDS4−), 6.93 (HEDDS3−), 3.85 (H2EDDS2−), 3.00 (H3EDDS−); and pKa=10.37 (EDTA4−), 6.13 (HEDTA3−), 2.69 (H2EDTA2−), 2.00 (H3EDTA−). The peaks at 1576 and 1395 cm−1 for EDDS at pH 12 (Fig. 1a) should represent the free asymmetric stretching vibration of carboxylate (νasCO2−) and the symmetric stretching vibration of carboxylate (νsCO2−), respectively. This was because the peaks of EDTA (structural isomer of EDDS) at 1582 and 1405 cm−1 (Fig. 1b) were also respectively assigned to carboxyl stretching νasCO2− and νsCO2− in previous studies (Nakamoto, 1997; Noren et al., 2009).
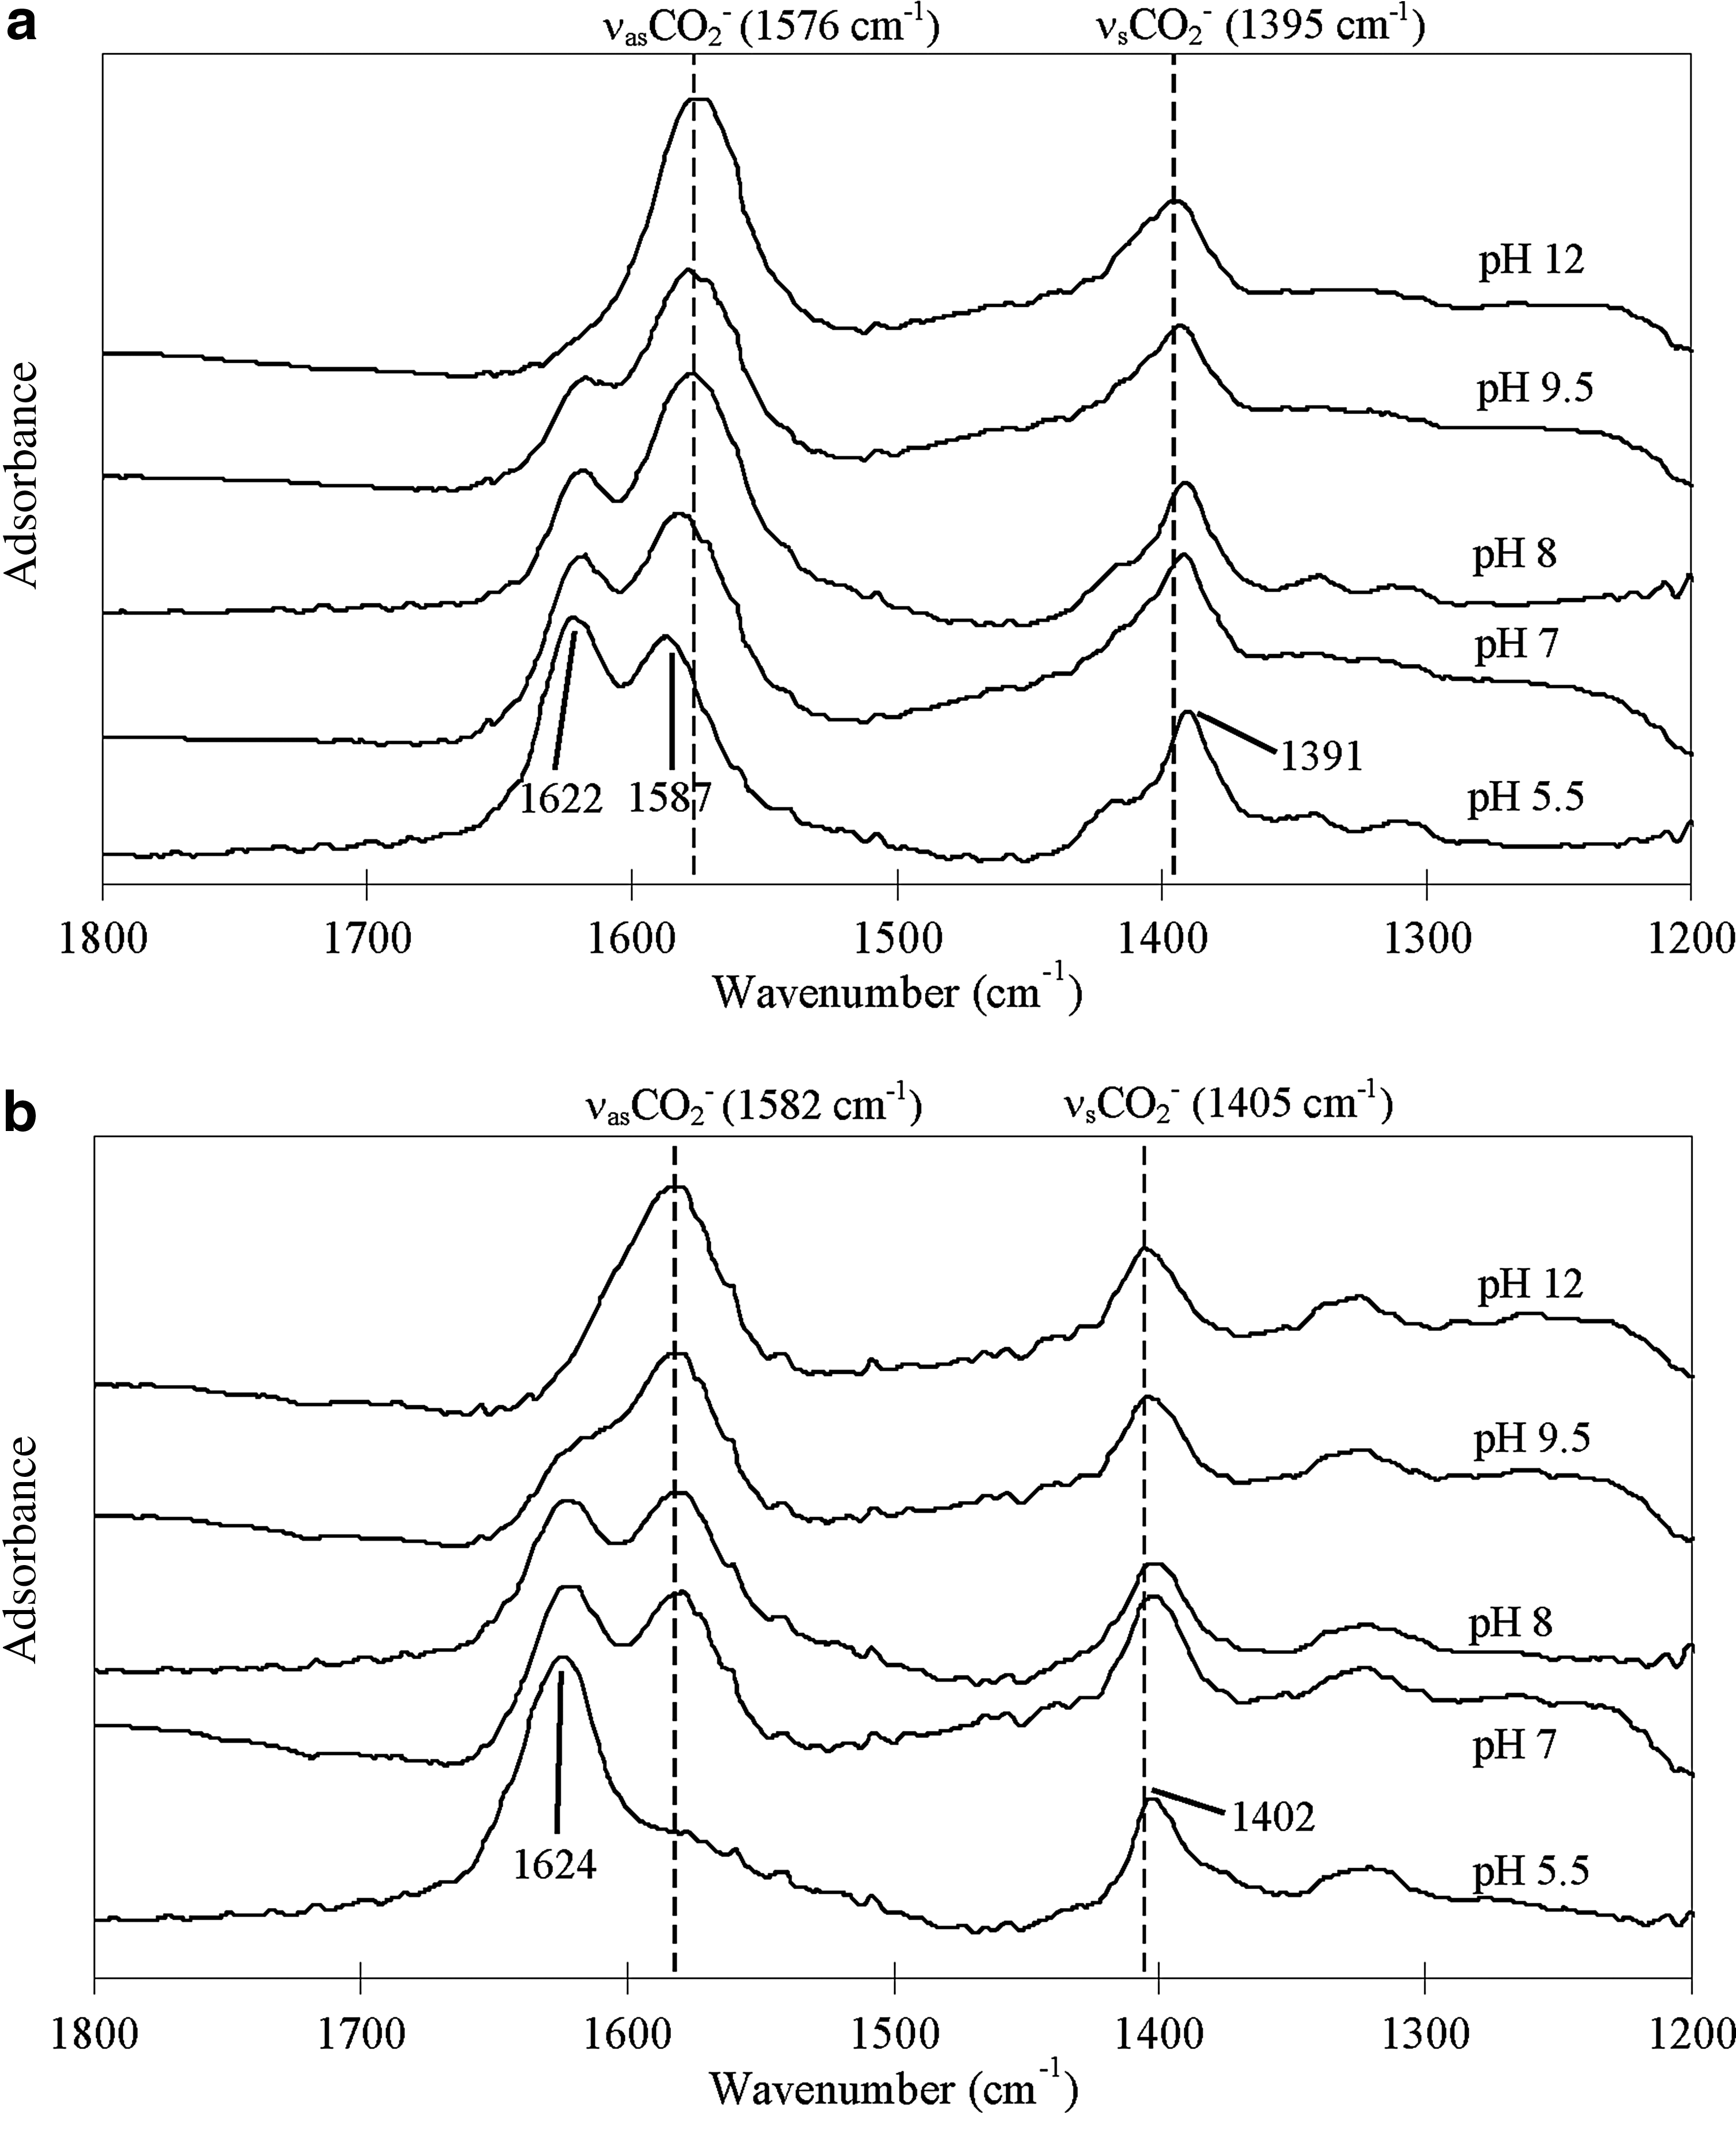
ATR-FTIR spectra of
The peaks of νasCO2− and νsCO2− were shifted due to increasing protonation. With a decreasing pH, an additional peak of νasCO2− was observed at 1624 cm−1 in the EDDS spectra (Fig. 1b), which could be assigned to α-ammonium carboxylate (R2N+HCH2COO−) (Nakamoto, 1997). The original peak of νasCO2− was also shifted from 1576 to 1587 cm−1, indicating the presence of hydrogen-bonded νasCO2− with a different distance from protonated amine. These characteristics suggested that carboxyl groups and neighboring amine groups of EDDS probably formed intramolecular hydrogen bonds (i.e., zwitterionic properties) (Chapman et al., 1963; Dragan and Fitch, 1998). At pH 8 where HEDDS3− was dominant, the co-presence of hydrogen-bonded carboxylate (at 1622 cm−1) and free carboxylate (at 1576 cm−1) showed that the carboxylate groups were only partially hydrogen-bonded with the amine groups. On the other hand, the slight peak shift of νsCO2− from 1395 to 1391 cm−1 was possibly limited by coupling effect of carboxylate vibration with other molecular vibrations (e.g., νC-C) (Noren et al., 2009).
The peak at 1624 cm−1 in the EDTA spectra (Fig. 1b) was similarly assigned to be hydrogen-bonded νasCO2−. The single band of the peak at pH 5.5 (H2EDTA2− was dominant) suggested that the four carboxyl groups of EDTA displayed the same vibration and chemical character (Lanigan and Pidsosny, 2007). The zwitterionic structures of EDDS and EDTA at acidic pH, as shown by ATR-FTIR analysis, were corroborated by the molecular structure (Fig. 2) modeled with ChemBio 3D from ChemBioOffice Ultra® 11.0 (CambridgeSoft) using the MM2 molecular mechanics algorithms, where dotted lines indicate hydrogen bonding between the carboxylate and protonated amine groups.
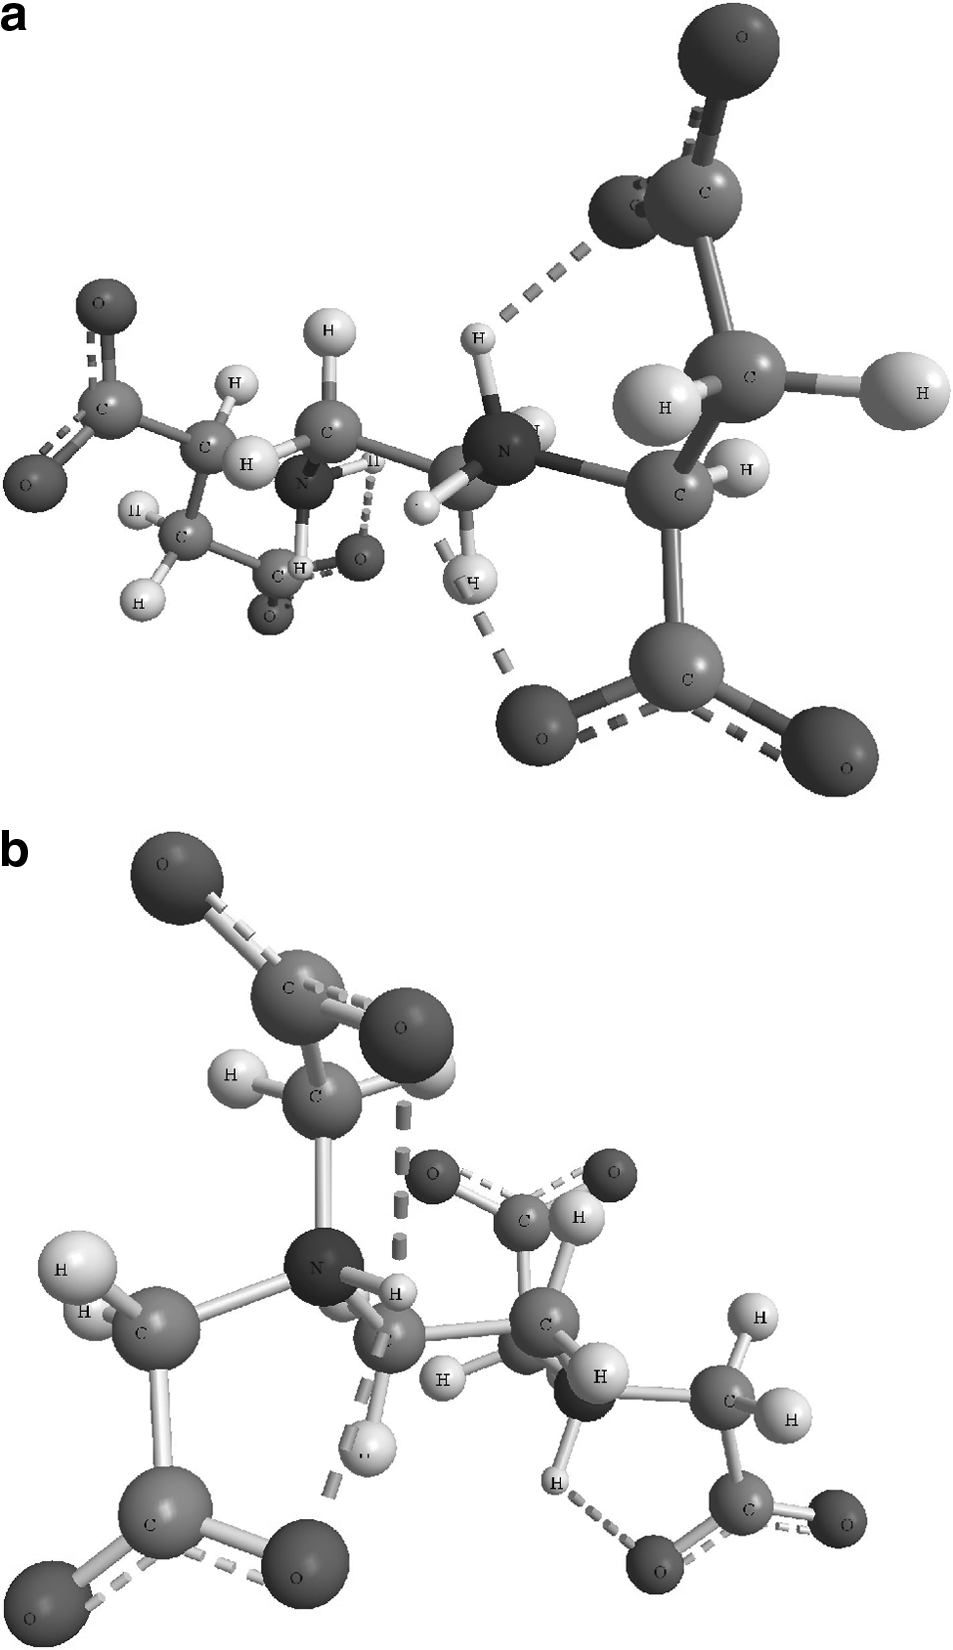
Optimized zwitterionic structure of chelating agents at pH 5.5:
Adsorbed EDDS in aqueous phase
The peaks of νasCO2− and νsCO2− of adsorbed EDDS on goethite and hematite in D2O (Fig. 3a, b) and H2O (data not shown) remained unchanged when compared with the peaks of EDDS in the supernatants. The absence of peak shift indicated that EDDS was primarily adsorbed as outer-sphere surface complexes. Similar results were shown for adsorbed EDTA in this study (Fig. 3c, d), suggesting that outer-sphere surface complexation was also the dominant mechanism, which was in line with previous spectroscopic findings of maleate and EDTA adsorption (Johnson et al., 2004; Noren et al., 2009).
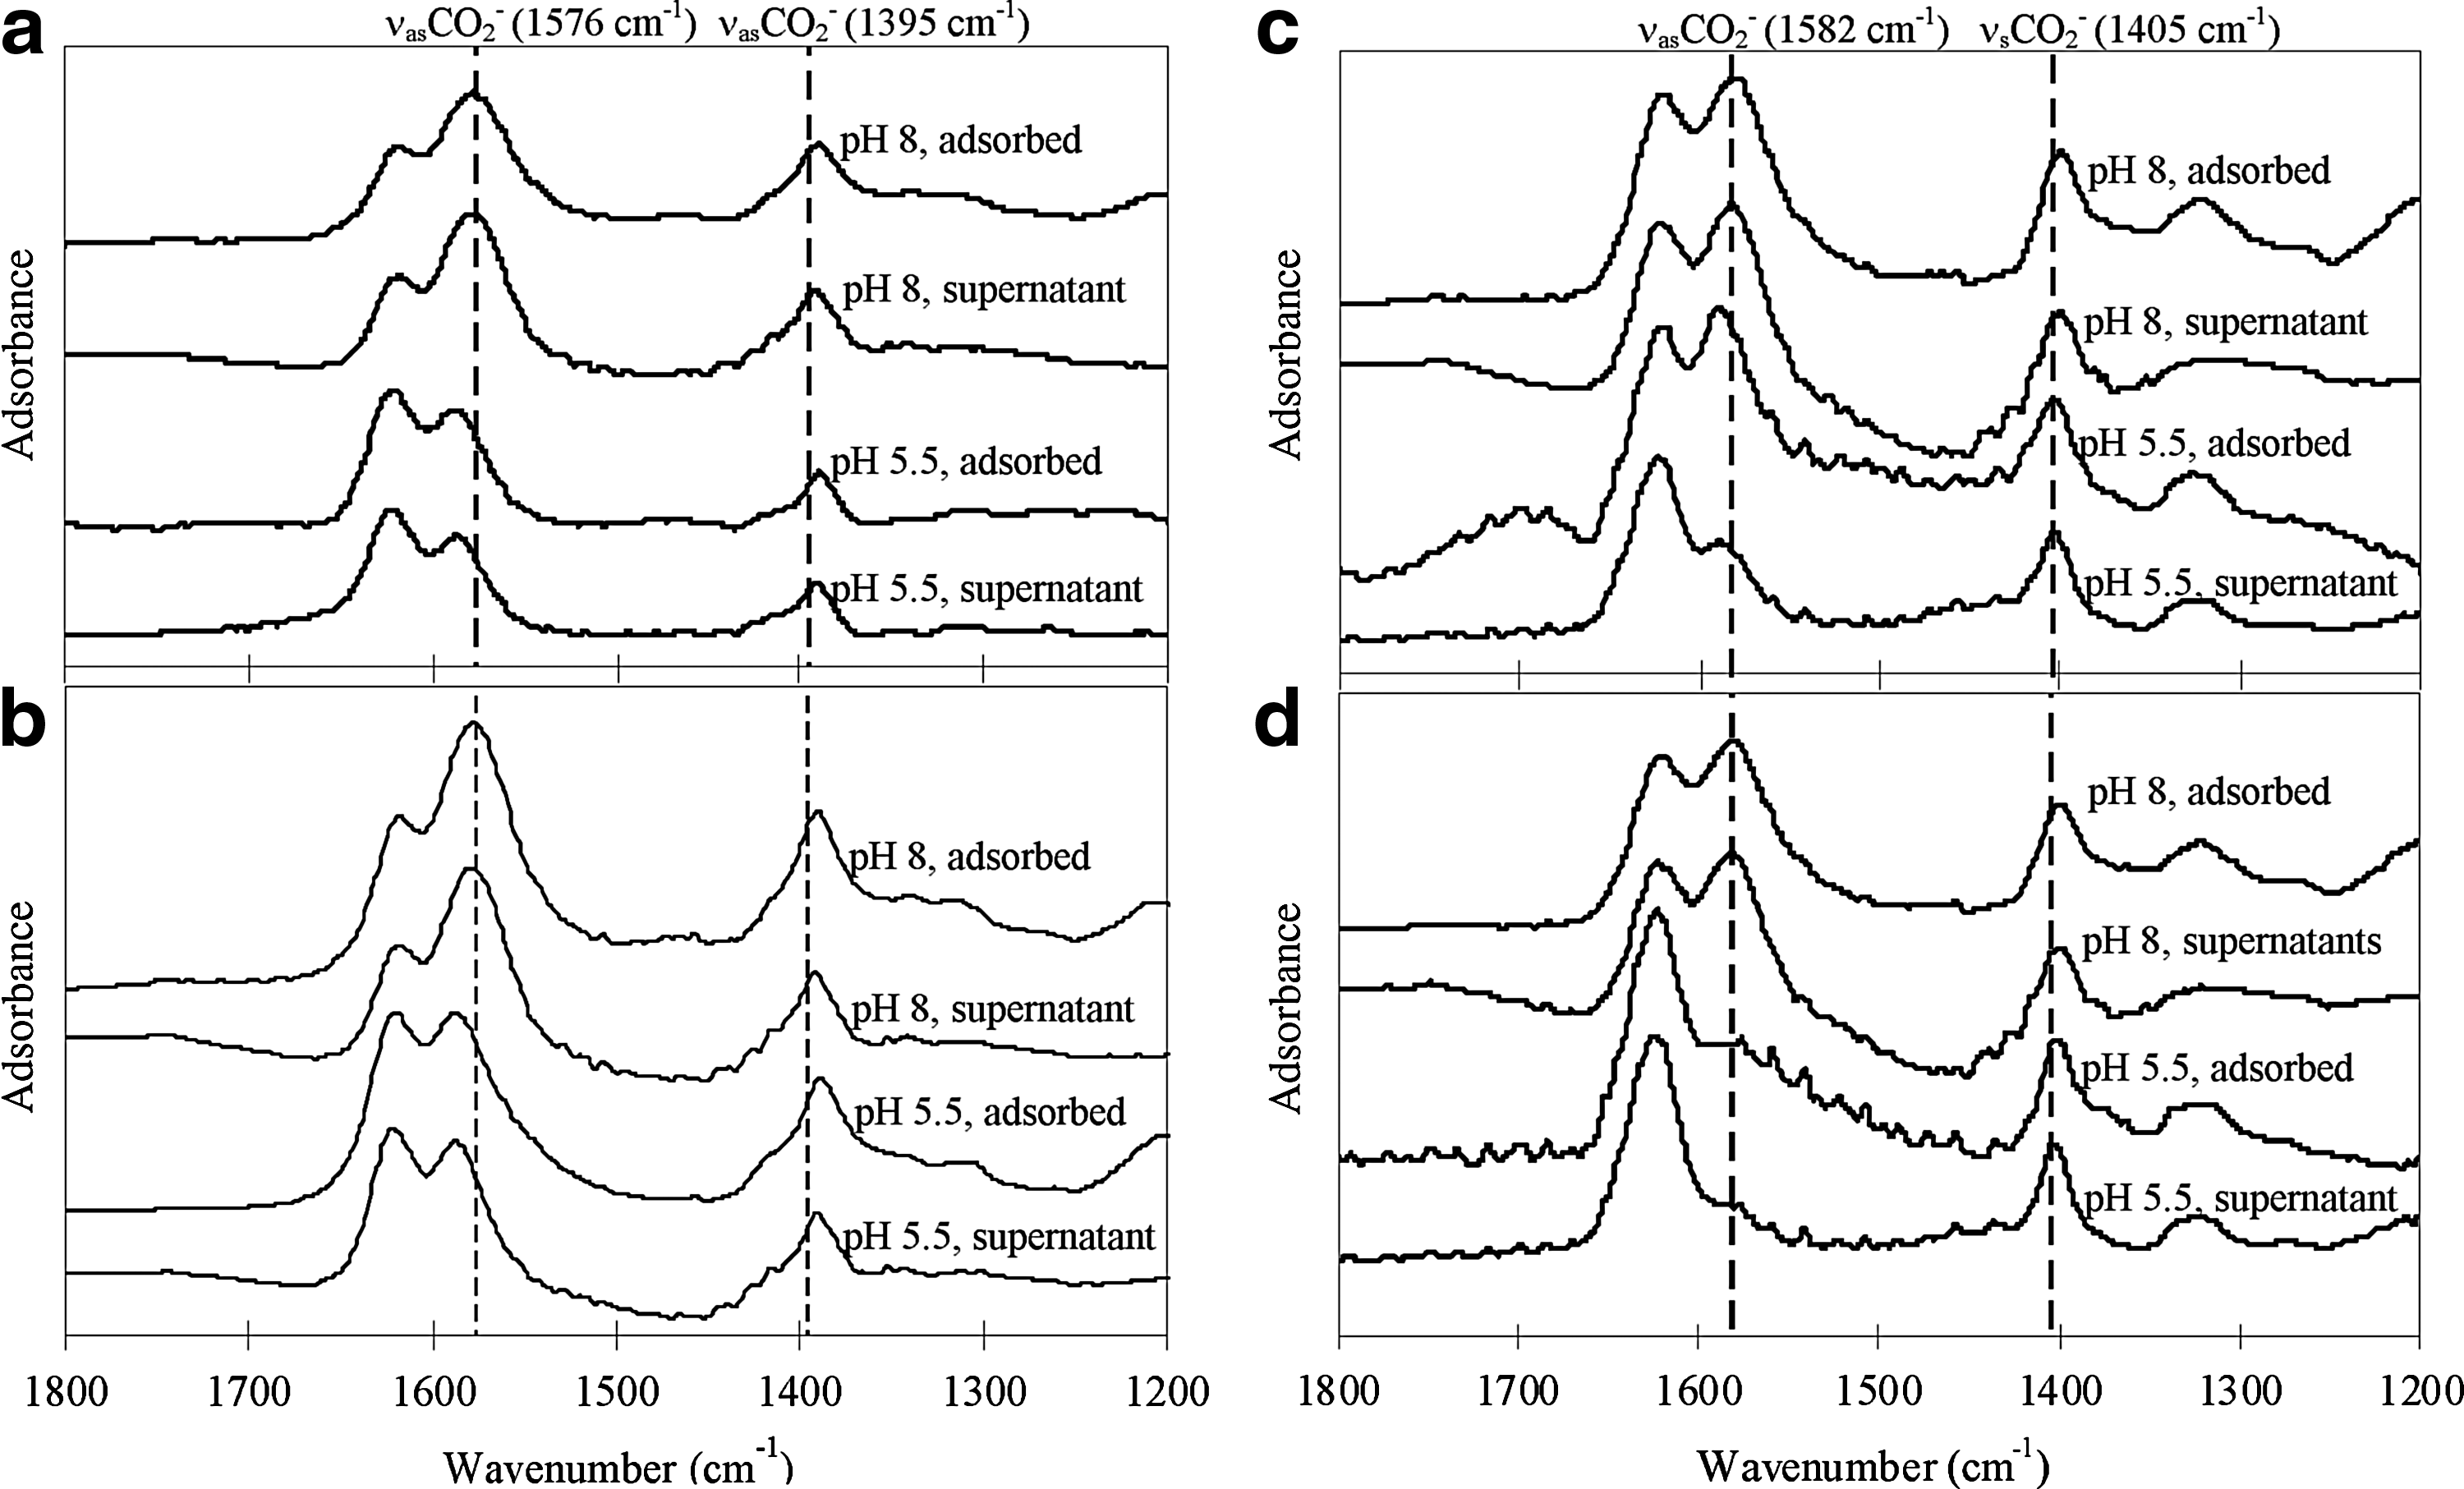
ATR-FTIR spectra (in D2O) of supernatant and adsorbed
It should be remarked that only the sufficiently stable (i.e., high-strength) protonated sites contribute to inner-sphere complexation (Van Leeuwen and Town, 2009). According to previous studies, the total surface site densities range 1–8 sites nm−2 on goethite and 9–16 sites nm−2 on hematite, respectively (Barron and Torrent, 1996; Villalobos et al., 2003). The availability of high-strength binding sites for inner-sphere surface complexation is very limited (Duckworth and Martin, 2001; Sposito, 2004). Therefore, when large amounts of EDDS are applied for site remediation (or spectroscopic studies), EDDS is present in excess with respect to the availability of high-strength binding sites on iron oxides (primary adsorbent for EDDS adsorption onto soil), accounting for the observed prevalence of outer-sphere surface complexes.
Table 1 shows that there was more significant EDDS adsorption on goethite compared with hematite and pH 5.5 was more favorable than pH 8. As outer-sphere surface complexation was the primary adsorption mechanism at the studied concentration, electrostatic interactions played an important role. At acidic pH, both goethite and hematite developed a higher positive surface charge and provided stronger electrostatic attraction for EDDS (Yip et al., 2009; Yan et al., 2010). The pHPZC of goethite (7.8) was higher than that of hematite (5.6), while they had comparable surface area (7.8 and 8.1 m2/g, respectively). Hence, goethite possessed a higher positive surface charge and adsorbed more chelants compared with hematite (Ryczkowski, 2007).
Iron dissolution was undetectable at both pH values in the absence of chelating agents; first-order kinetics for iron dissolution was determined from 1 min to 2 days and all r2 values were above 0.97.
EDDS, [S,S]-ethylene-diamine-N,N′-disuccinic acid; EDTA, ethylene-diamine-tetraacetic acid.
In addition, the adsorption amount and the resulting iron dissolution rate were found to be smaller for EDDS than EDTA, regardless of pH values and type of iron oxides (Table 1). In the zwitterionic structure (Fig. 2), two carboxyl groups were hydrogen-bonded with protonated amine groups, increasing the negative charge density of chelants (Chapman et al., 1963). A higher charge density could enhance the chelant adsorption via electrostatic attraction and facilitate the iron dissolution by polarizing the iron–oxygen bonds to detach iron from the crystal structure (Stumm, 1997; Sposito, 2004). By comparison, the zwitterionic properties of EDDS were less significant due to stabilization by the presence of two types of intramolecular hydrogen bonds, resulting in a smaller extent of EDDS adsorption and iron dissolution.
Adsorbed EDDS in dehydrated state
FTIR spectra of adsorbed EDDS on goethite and hematite showed the same peak positions of EDDS alone (Fig. 4a), indicating the absence of inner-sphere surface complexation via the carboxyl groups of EDDS. Supplementary TEM-EDX analysis illustrated the presence of EDDS crystals on the surfaces (Fig. 5), suggesting that EDDS adsorbed as outer-sphere surface complexes was freeze-dried and formed deposits on the iron oxides upon dehydration. It was possible that the electrostatic interactions of EDDS were too weak (due to comparatively low charge density) to be transformed to inner-sphere surface complexes even with the enhancement of dehydration process.
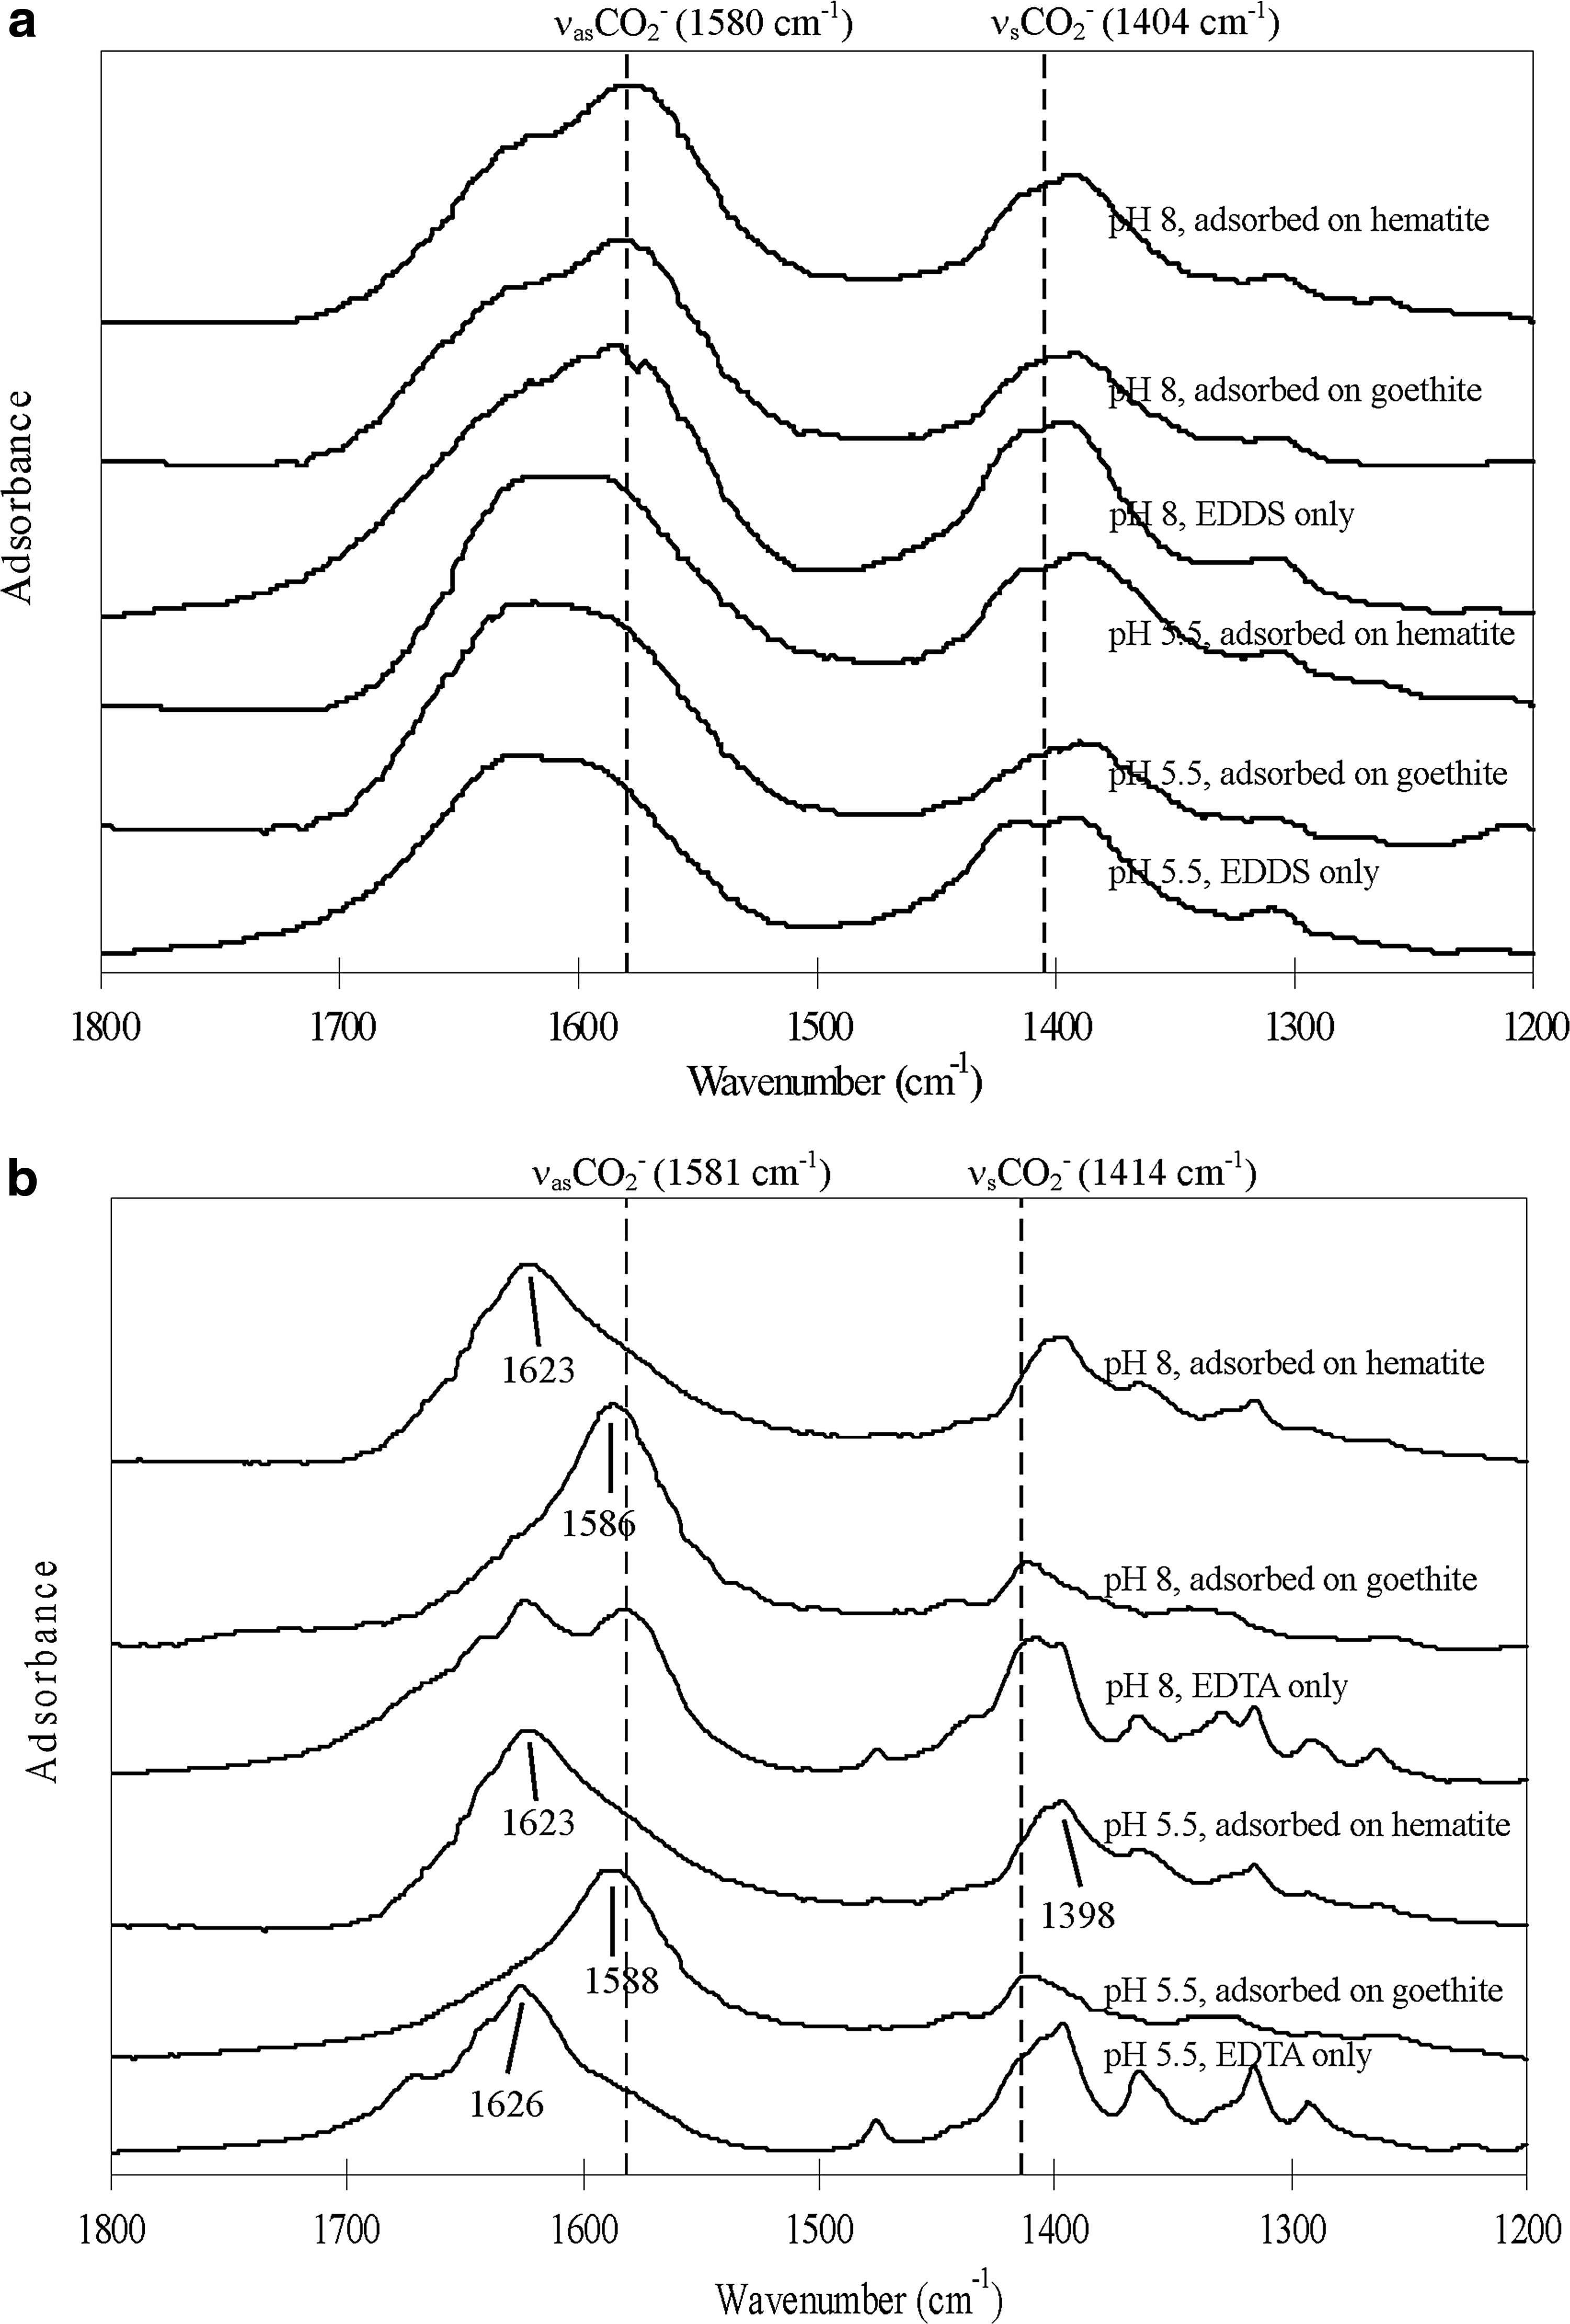
Transmission-FTIR spectra of
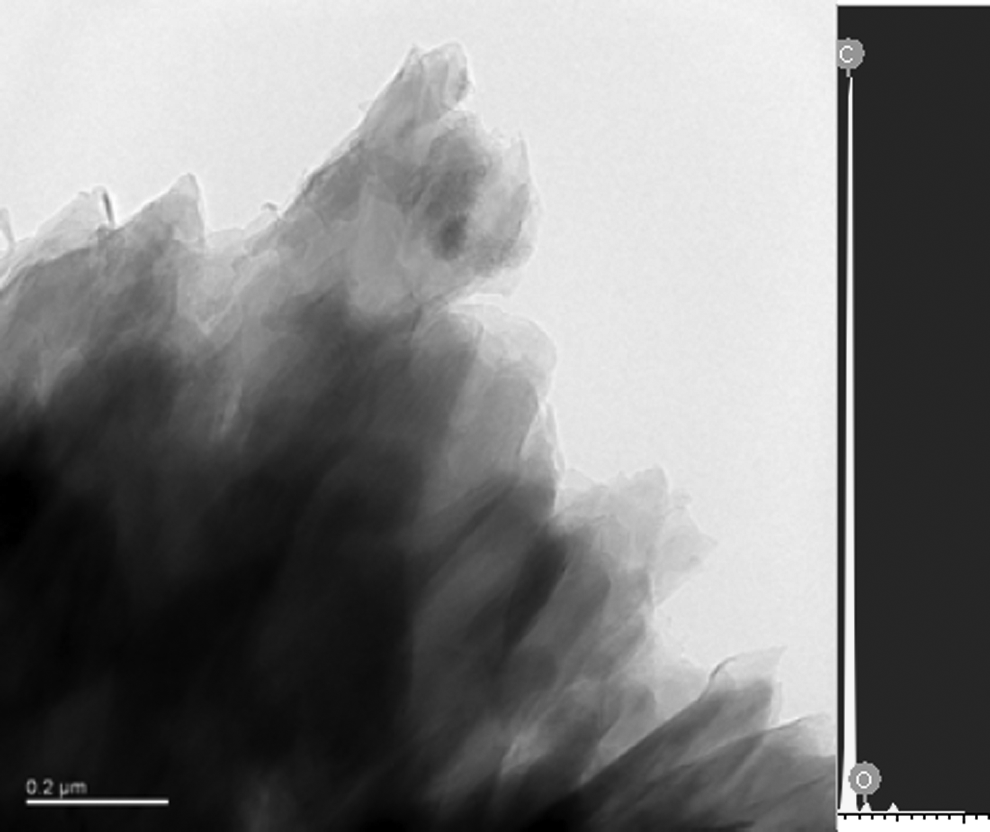
TEM image of EDDS adsorbed on goethite under dehydrated condition. TEM, transmission electron microscopy.
On the contrary, the peaks of νasCO2 of the adsorbed EDTA shifted to varying extent on goethite and hematite, when compared with the dehydrated EDTA alone (Fig. 4b). These peak shifts were indicative of inner-sphere surface complexation. The separation (
Peak shifts upon dehydration (Fig. 4) were attributed to the change of chelant interactions at the surface of iron oxides. In aqueous phase, hydroxyl ions or water molecules may be originally hydrogen-bonded to the surface hydroxyl groups (Fe-OH) of iron oxides. When dehydration strips off hydrogen-bonded water molecules or hydroxyl ions, more inner-sphere surface complexes would form with electrostatically bound EDTA (Zhao et al., 1994; Kang et al., 2008). The types of inner-sphere surface complex would then depend on the physiochemical properties of the types of iron oxide (e.g., availability and proximity of neighboring sites, edge/corner site locations, iron–oxygen bond strength, chemical composition, and lattice structure) (Bargar et al., 1997; Sparks, 2003).
The presence/absence of inner-sphere surface complexes in the outermost surface layer under dehydrated condition was also evaluated by XPS analysis (Fig. 6). Dehydrated EDDS and EDTA alone showed two distinct peaks at pH 5.5 and 8, which represented the deprotonated and protonated amine groups. The absence of peak shifts in the XPS spectra for adsorbed EDDS on iron oxides (Fig. 6a) confirmed that there was no inner-sphere surface complexation with the amine groups of EDDS (while FTIR spectra showed the absence of strong bonding with the carboxylate groups). By contrast, when EDTA was adsorbed on goethite or hematite, a single peak with binding energy between these two original peaks was observed (Fig. 6b), indicating the formation of nitrogen bonding between EDTA and iron oxides (Yoshida and Sawada, 1974). A recent study also corroborated that EDTA could form inner-sphere complexes with iron oxides via both carboxylate groups and amine groups (Noren et al., 2009). The positions of the single peak were different for goethite and hematite, probably reflecting the disparity in binding structures. The peaks remained the same at pH 5.5 and 8, showing that the type of iron oxide was more influential than pH values, as indicated by the FTIR findings.
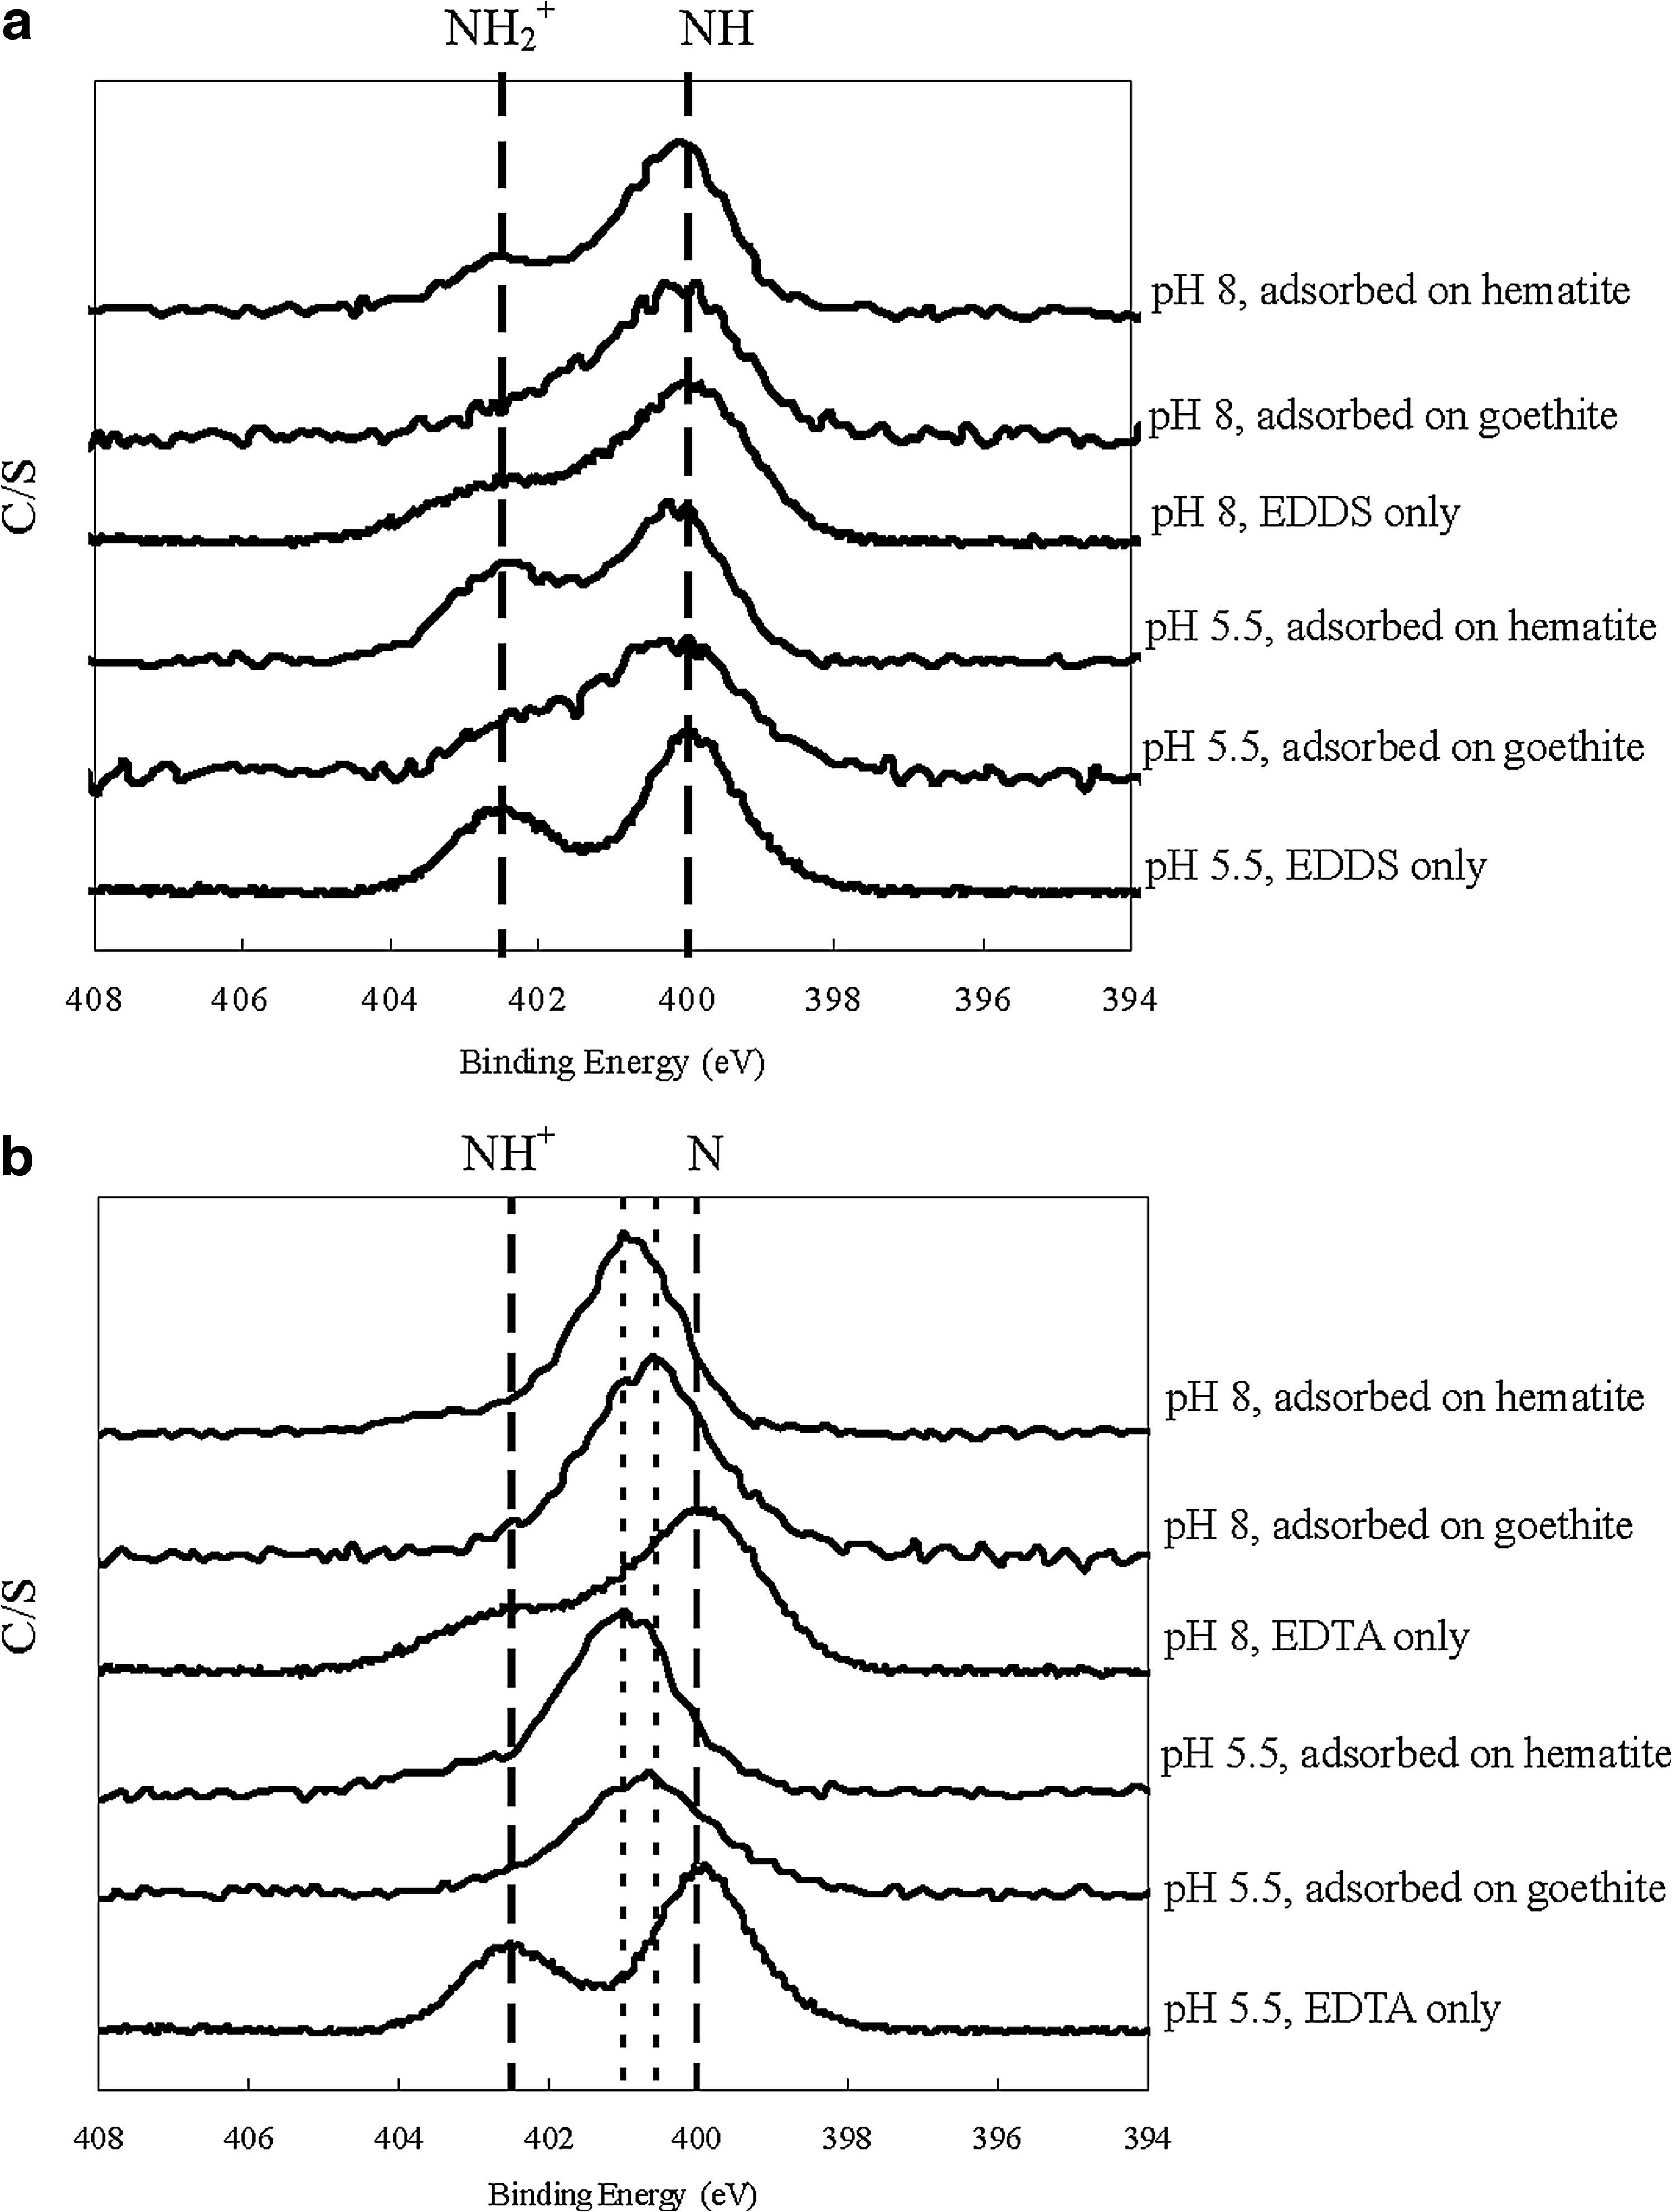
XPS spectra of N 1s of
Engineering Implications
This study revealed that the dominant mechanism for EDDS adsorption on goethite and hematite in aqueous phase is outer-sphere surface complexation. Therefore, EDDS is weakly adsorbed during soil remediation and may be subject to leaching afterward. Yet, this is unlikely to be a significant issue as EDDS is readily biodegradable in soil. By contrast, weakly bound EDTA may result in significant spreading in downstream groundwater and perturbation toward metal speciation, thereby requiring post-treatment monitoring and/or water rinsing of residual EDTA. On the other hand, upon dehydration due to natural or induced wetting–drying cycles in the subsurface or above ground, EDDS tends to remain weakly bound and form deposit on the iron oxide surfaces. On the contrary, EDTA tends to form inner-sphere complexes at the oxide interface through its carboxylate and amine groups, thus becoming immobile residual in the treated soil.
Footnotes
Acknowledgment
The authors thank the Research Grants Council of Hong Kong for providing financial support under the General Research Fund (Project account 616608) for this research study.
Author Disclosure Statement
No competing financial interests exist.