
Abstract
Abstract
When recycling sewage sludge to agriculture, the risk of disease transmission must be taken into account. Sanitizing treatment prevents disease transmission by reducing dissemination of pathogens early in the reuse chain. Sanitization is commonly achieved by heat treatment of sludge, for example, by prepasteurization before anaerobic digestion or by thermophilic anaerobic digestion. This study evaluated ammonia treatment of anaerobically digested dewatered sewage sludge at pilot scale (65 ton) by urea addition at 0.85% and 1.6% wet weight compared with storage without ammonia addition over 145 days of treatment during the Swedish winter, with ambient temperatures below 0°C. Addition of 1.6% urea reduced indicator organisms Enterococcus spp. and Escherichia coli to below the detection limit of 100 and 10 cfu/g, respectively, within 3 months of treatment, whereas the 0.85% urea treatment did inactivate E. coli but not Enterococcus spp. within the study period (145 days). In the control, both indicator bacteria were still present at the end of the study period. Thus, 1.6% treatment with urea is a promising low cost on-demand option for sludge sanitization and can be performed at considerably lower cost than heat treatment.
Introduction
T
Concerns about sewage sludge quality regarding heavy metals, organic pollutants, and pathogenic microorganisms restrict the acceptance and use of sewage sludge on arable land. Application of sewage sludge to land in EU member states is currently regulated by the Sewage Sludge Directive (EC, 1986), which aims to protect human health and the environment by setting limits for heavy metals and proposing treatments to minimize the risk in relation to pathogenic microorganisms. It is up to the member states to implement the directive nationally. A proposed amendment to the Directive specifies reduction levels in microorganisms for validation of treatment methods, sets acceptable limits of organisms in the end-product, and defines treatments in more detail, but has not yet been implemented.
In proposed or existing national regulations in member states on the hygiene quality of sewage sludge to be reused on arable land, the focus is on removal of the bacteria Salmonella spp., for which Escherichia coli (or total thermotolerant coliform bacteria [TTC], of which E. coli is the main constituent) can serve as an indicator Salmonella spp. (U.S. EPA, 1994). Most regulation aims to achieve sanitized sewage that is free from Salmonella spp. before used on land, whereas specified sampling volumes and detection limits varies (Vinnerås and Nordin, 2013). Limits for post-treatment E. coli concentration varies from <102 to <105 g−1 TS depending on the intended use. The proposed amendment to the EC directive has a 6 log10 reduction of E. coli as a measure of advanced treatment. When parasitic helminths are regulated, the concentration of viable eggs is in general expected to be below detection limits, whereas enterovirus limits of <3 MPN per 10 g TS and <1 per 4 g TS are given by France and the U.S. EPA. The use of Enterococcus spp. as a measure of sanitization is rare, although Denmark has a limit of <100 g−1 TS. Most sanitizing treatments involve heat treatment, although other treatments that can deliver the same hygiene quality are accepted after validation (U.S. EPA, 1994) and sewage sludges are often classed according to the level of treatment and reduction of microorganisms and subsequently used accordingly.
In existing sewage treatment plants in Sweden, prepasteurization is the most common option when a sanitization step is included. However, this involves investment in heat exchangers, tanks, piping, and valves, so the costs can be substantial for a medium-sized treatment plant. In addition, the running costs of this sanitization system are high. For example, for a wastewater treatment plant in Sweden with 200,000 person equivalents (pe), the initial investment for prepasteurization can be 2 M€, with annual operating costs of 3 € pe−1 year−1. Therefore, alternatives to heat treatment to sanitize sewage sludge are of high interest.
Ammonia treatment is based on the well-known biocidal effect of uncharged ammonia, NH3 (Warren, 1962), which is regulated by the total ammonia concentration, pH, and temperature. The addition of ammonia to sewage sludge (Pecson et al., 2007; Fidjeland et al., 2013) or source-separated feces (Nordin et al., 2009b) or intrinsic ammonia in diverted human urine (Vinnerås et al., 2008) has been shown to be an efficient treatment for removing pathogens. The ammonia can either be added as an aqueous solution of ammonia or as urea [CO(NH2)2]. Urea is a harmless organic substance until it is degraded by enzymes naturally present in the sludge. Ammonia treatment is effective irrespective of scale and has been tested and used at all scales from a single defecation in the single-use Peepoo toilet (Vinnerås et al., 2009) to large-scale manure slurry tanks of over 1,000 m3 (Ottoson et al., 2008). As the nitrogen added is not consumed during treatment, it increases the fertilizer value of the material. The added ammonia also balances the nutrient content in sludge, which normally contains high amounts of phosphorus, resulting in a balanced fertilizer. Furthermore, as long as the ammonia remains in the sludge, regrowth of pathogenic bacteria is prevented (Vinnerås et al., 2003). However, the toxic form of ammonia (NH3) is volatile so to ensure that the ammonia remains in the sludge throughout treatment until it is used as fertilizer, storage needs to be performed in a closed compartment and air exchange minimized. As the ammonia present inhibits bacterial degradation, there is low biological activity in the sludge during storage. Hence, there is a lower risk of production of unwanted gases such as methane and nitrous oxide, normally formed during storage of sewage sludge. An initial economic analysis of sewage sludge treatment options indicates that ammonia treatment is cheap with operating costs estimated to be below 1 € pe−1 year−1 (Sylwan, 2010) and hardly any investment cost since the equipment used is already in place for other purposes.
The objective of the present study was to evaluate ammonia treatment in pilot-scale (65 ton) of dewatered sewage sludge by monitoring the reduction of Salmonella spp., Escherichia coli, Enterococcus spp., Ascaris suum eggs, and bacteriophages. The treatment evaluated comprised addition of urea at a rate of 0.85 and 1.6% wet weight (ww) compared with storage without ammonia addition.
Materials and Methods
Materials
Sewage sludge
Anaerobically digested (37.5°C) dewatered sewage sludge with a TS content of 31% was obtained from a municipal wastewater treatment plant in Uppsala (Sweden). The plant is dimensioned to treat wastewater from 200,000 PE (14 ton BOD7 d−1) and an incoming flow of 4,800 m3/h−1. A total of 164,200 people are served by the plant, and the industrial load is estimated to correspond to approximately 21,000 pe at 70 g BOD7 PE−1 d−1. In 2012, 20.4 million m3 incoming wastewater containing 3,370 ton organic matter (BOD7), 720 ton total nitrogen (tot-N), and 100 ton total phosphorus (tot-P) were treated at the plant (Uppsala Vatten and Avfall AB, 2012).
The process is divided into mechanical, biological, and chemical treatment. Nitrogen is removed in the biological step with active sludge treatment, including nitrification and denitrification. Phosphorus is removed by a combination of a bio-P processing (sidestream hydrolysis) and chemical flocculation by the addition of FeCl3 (PIX-111; Kemira Kemi AB) combined with lamelle sedimentation. On average, 13 g Fe was added per m3 waste water during 2012. Polyaluminium chloride (PAX-215; Kemira Kemi AB) is used to avoid foaming by filamentous bacteria (Microthrix parvicella) in the active sludge treatment. During 2012, a total of 89 ton of PAX-215 were used (Uppsala Vatten and Avfall AB, 2012).
Primary sludge from presedimentation, biological sludge from the activated sludge treatment, and chemical sludge from the last polishing step with FeCl3 are thickened to 5–6% total solids (TS) by the addition of a polyelectrolyte (Zetag 7557; BASF) and treated with mechanical drum screens. The sludge is then digested under mesophilic conditions (37.5°C) with a hydraulic retention time of 15–20 days before it is dewatered in centrifuges, where more polyelectrolyte (Superfloc C498; Kemira Kemi AB) is added for increased removal of suspended solids. In 2012, the treatment plant produced 12,710 ton dewatered sewage sludge with 27.1% TS (3,490 ton TS). Today, the dewatered digestate is used as the top cover for a landfill (Uppsala Vatten and Avfall AB, 2012).
Ascaris suum egg bags
Adult A. suum worms were collected from the intestines of slaughterhouse pigs, and the eggs were harvested by dissection of the posterior 2 cm of worm uterus. After washing as described by Eriksen (1990), except for no use of sodium hypochlorite, approximately 104 eggs were placed in permeable nylon bags (2×65 cm2; mesh 28 μm) and stored in physiological saline solution (0.9% wt/vol) at 4°C until use. The nylon bags used for the experiment were placed in outer bags (10×10 cm) of polyethene mesh (mesh 5 mm) and attached to strings.
Experimental setup
Anaerobically digested dewatered sewage sludge was collected in two sludge storage silos at the treatment plant during 1 week to provide 200 ton sludge for the experiment. Two days before the start of the experiment, the sludge was transported to the experimental site and stored in one large heap. For the urea-treated windrows, batches of 14 ton of sewage sludge were spread in a 0.5-m-thick layer that was topped with approximately 110 and 220 kg urea for the 0.85% and 1.6% treatments, respectively. The sewage sludge was combined and turned approximately 5 times with a front loader and for the final mixing run through a mixing scoop before windrow formation. This procedure was repeated until 65 ton of sewage sludge had been treated with 490 and 980 kg urea for 0.85% and 1.6% treatments, respectively. As a control, untreated sewage sludge was run through the mixing scoop to create the same structure and windrows as for the urea-treated sludge. Both mixing and windrow formation were carried out on tarmac surface. Each treatment resulted in a single windrow created at the outlet of the mixing scoop with the measures 1.1±0.10 m high, 4.6±0.50 m wide, and 14±0.5 m long (Fig. 1).
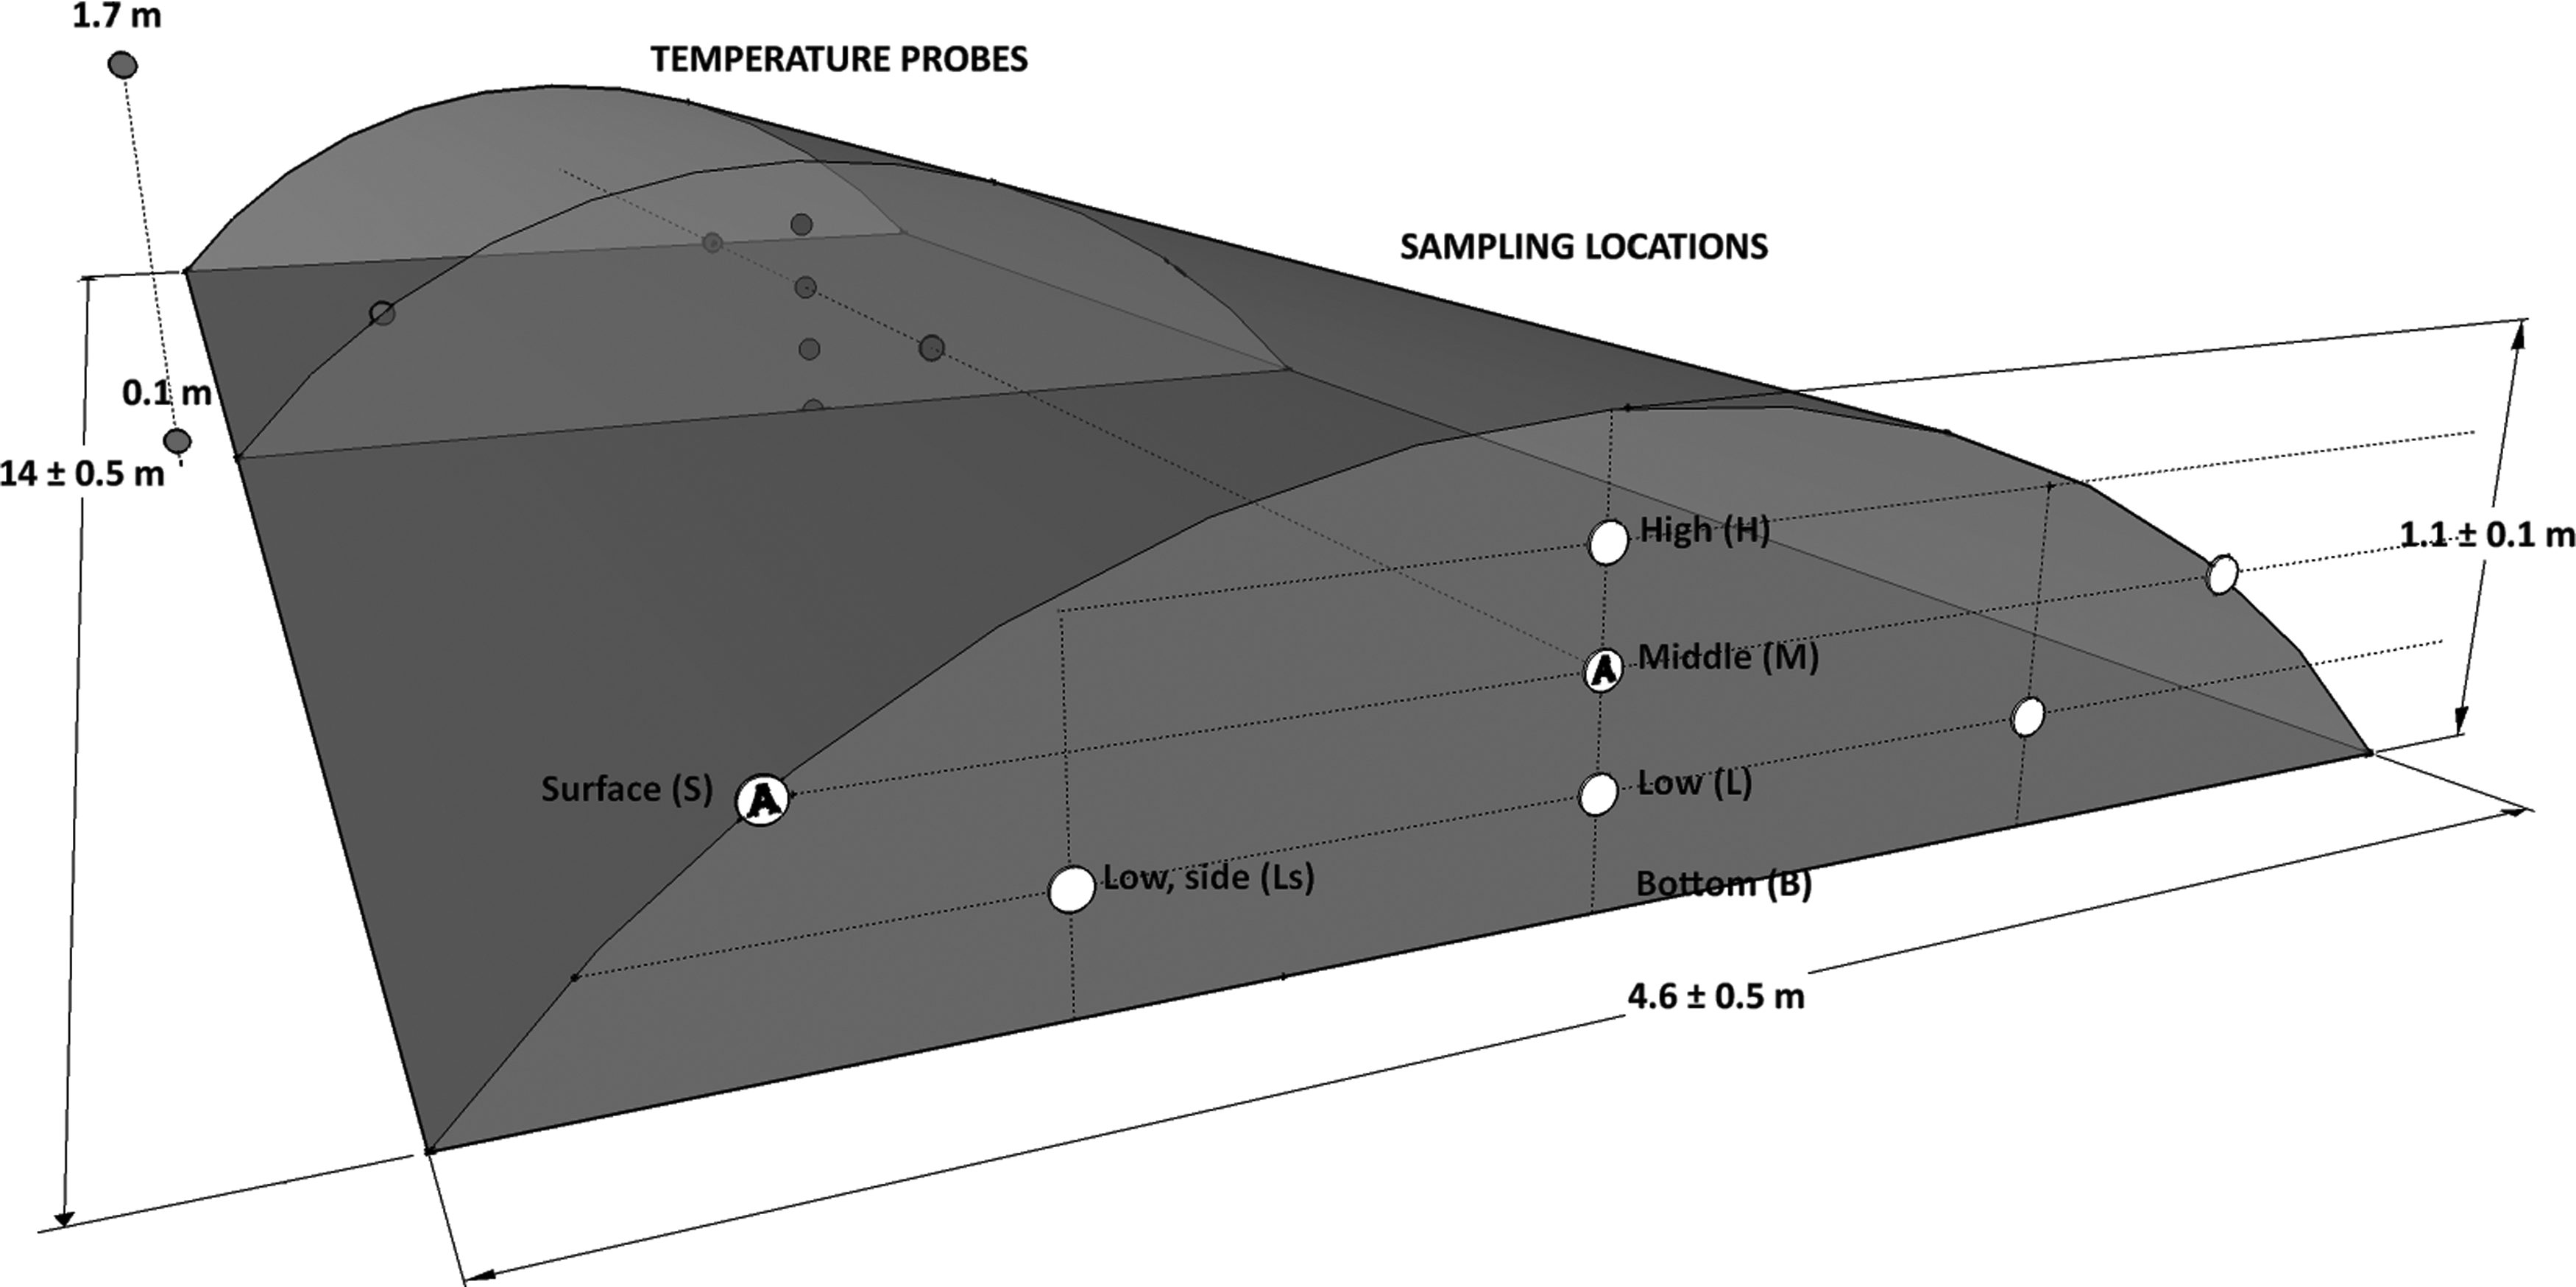
Location of temperature probes (•) over the middle cross section of the windrows and, for middle position, 2 m out lengthwise from the cross section and sludge sampling sites (○) over the cross section of the sludge windrows with locations, where Ascaris suum egg bags were added and sampled, marked with a capital A. In this figure, the sampling sites are depicted on the front of the pile, whereas during the study, 2 m of sludge was taken away from the end of the windrows ahead of sampling.
The permeable bags containing A. suum eggs were inserted into the sludge by a bamboo cane, which was then withdrawn, leaving the end of the attached string outside the windrow to enable sampling. For temperature monitoring, seven temperature probes (OW-TEMP-B3_12xA; Embedded Data Systems) were inserted attached to bamboo canes in each windrow according to Fig. 1. Air temperature was monitored by four probes in total, two at 1.7 m and two at 0.1 m above the surface.
Mixing of sewage sludge and urea and formation of windrows took approximately 5 h. Due to heavy winds, the windrows were not covered until the next morning (15 h later) when they were tightly sealed with the type of polyethene sheeting normally used for covering horizontal silos, kept in place by piles of old compost material.
Sampling
During setup of the experiment, 300 g of samples was collected for every 7.2 ton of sewage sludge (in total 22 samples) for analysis of Salmonella spp., thermotolerant total coliform bacteria (TTC), Escherichia coli, Enterococcus spp, f-specific- and somatic coliphages, TS, volatile solids (VS), pH, and total ammonia nitrogen (TAN). After formation of the windrows, 16 samples of 300 g each were taken from the sides of each windrow (control, 0.85%, and 1.6% urea) approximately 10 cm down from the surface. These samples were pooled per treatment and mixed for approximately 10 min to a composite sample in a thick polyethene bag, after which three subsamples of 200 g each were taken for analysis of ammonia nitrogen and total nitrogen; both analyses performed according to SS-EN 13342:2000 to confirm the average urea dosage. The composite material from the control windrow was also used to test the maturity of the sludge by Solvita and Rottegrad tests.
The study was performed from November 30, 2011, to April 25, 2012, and the sludge was sampled on five occasions (days 12, 40, 61, 89, and 145) during that 5-month period. At sampling during the experiment, the covering on the windrow was removed, and a 2 m layer was removed from the side of the windrow with a front loader. Samples were taken based on the quarter height and width, not at fixed depths, according to Fig. 1. To avoid contamination between locations, at sampling, the surface of the cross sections was cleared with a bag-covered shovel blade, and samples were taken with polyethene lab blender bags, 30 μm thick (Stomacher®; Seward), which were immediately sealed. On arrival to the laboratory (2 h after sampling), samples for analysis of TAN were placed in cold storage for later analysis, pH, TS, and Salmonella spp. were determined immediately and the other sludge samples for microbiological analyses were stored overnight at 4°C.
Analyses
For compost maturity testing, part of the composite material from the control windrow was, after overnight storage at 10°C, allowed to adjust to room temperature (23°C) and then squeezed through a mesh with 2 mm diameter to give a structure that would allow aeration without adding any structure material. Solvita® analyses (Woods End Laboratories, Inc.) were performed according to the manufacturer's instruction (Woods End Research Laboratory, 2009), also described by Changa et al. (2003), at 23°C. The Rottegrade self-heating test (Anonymous, 2002) was performed in two insulated 1.5 L Dewar vessels filled with 135 g of structurized sludge and loosely capped to allow aeration. The temperature was monitored for 10 days to measure the maximum temperature developed.
For analysis of pH, 10 g of sludge was diluted 1:5 with deionized water and thoroughly mixed, and after 1 h at room temperature in capped containers, the pH was measured (PHC 2051 sensor and PHM 210 m; Radiometer). From the 1:5 primary dilution for pH analyses, 1 mL was withdrawn and diluted 1:9 before filtering through a 45-μm filter (Filtropur, Sarstedt AB). The filtered solution was stored at 4°C in capped polypropylene 1.5-mL vials until analyzed for TAN by the phenol blue method (Spectroquant Ammonia; Merck) with the absorbance measured on a spectrophotometer (Genesys 20; Thermo Scientific).
Approximately 50 g of sewage sludge was dried at 105°C for 14 h for analysis of total solids (TS) and subsequently at 550°C for 4 h for analysis of volatile solids (VS).
To detect the presence of Salmonella spp., 25 g of sewage sludge was used for unselective enrichment in 225 mL buffered peptone water (37°C; 18 h) (SVA), followed by selective enrichment on Modified Semi-solid Rappaport Vassiliadis (MSRV) plates (Oxoid) (41.5°C; 24–48 h). For starting samples, enrichment in Rappaport Vassiliadis (RV) broth was performed in parallel. After enrichment with xylose lysine desoxycholate (XLD) agar (Oxoid) containing 0.15% sodium novobiocin (37°C±1°C; 24±3 h) and brilliant Green agar (Oxoid) (37°C±1°C; 24±3 h), presumptive Salmonella spp. were confirmed by triple sugar iron and urease testing and serotyping.
For general microbiological analyses, 10 g of sewage sludge was diluted 10-fold in buffered NaCl peptone water with the surfactant Tween (pH 7) (SVA) and mixed in Stomacher® bags by hand to achieve a homogeneous solution. Then, 1 mL of this solution was serially diluted 10-fold with the same dilution medium. The dilution series was used for enumeration of microorganisms. Enterococcus spp. was enumerated on Slanetz-Bartley (SlaBa) agar (Oxoid) (44°C±0.2°C, 48±2 h), with colonies confirmed by plating on Bile Esculin agar and catalase testing. TTC s and E. coli were enumerated by pour plate according to NMKL No. 125, 3rd ed. (The Nordic Committee on Food Analysis, 1996). Somatic coli- and f-specific RNA phages were detected by the standard ISO 10705-1 (International Organisation for Standardisation, 1995) and 2 (International Organisation for Standardisation, 2000) double-layer agar method, with E. coli (ATCC 13706) and Salmonella typhimurium WG 49 (ATCC 700730) used as bacterial host strains for enumeration of the respective bacteriophages and cultured in nutrient broth (Oxoid).
Statistical analysis (ANOVA and regression) was performed in Minitab 16 (Minitab, Inc.).
Results
Properties of the sewage sludge
Analyses of the 7.2 ton batches of untreated sewage sludge during setup showed relatively low variation for the parameters investigated (Table 1). The concentrations of indicator organisms were in the range of 104–106 log cfu/[pfu·g] sludge for all organisms analyzed except f-specific RNA phages, which were not detected. Salmonella was detected in the untreated sludge and determined to be Salmonella enterica subspecies enterica serovar Paratyphi B variant Java (S. Java), with 33% of the samples testing positive. Of the total TTC bacteria colonies detected, all were confirmed to be E. coli in the consecutive analytical step.
All weight units are on wet weight basis if not specified differently.
Triplicate composite samples from 16 subsamples.
SD, standard deviation; NA, not applicable.
Temperature and self-heating
Testing the dewatered sewage sludge at start-up with Solvita compost maturity test produced results of 3.5 and 3.75 (2,500–8,000 ppm NH3) for the ammonia and 4.5 (2–3% CO2) for the carbon dioxide test. The Solvita compost maturity index was 3 for both tests, placing it in the active compost category. However, the ammonia concentration as an indication of maturity is based on the concept that ammonia will volatilize and decrease during the composting, whereas the sewage sludge had been anaerobically digested, retaining a large part of ammonia in the dewatered sewage sludge.
In the self-heating Rottegrad test, maximum temperature of 42°C, that is, a 19°C rise above ambient temperature, was reached after 7 h. The sewage sludge was therefore categorized as Rottegrad class III–IV, that is, medium to good decomposition of the material.
In the windrows in the field, the temperature also increased and after 2 days was 28–33°C at the surface, and for the 1.6% urea treatment also in the middle of the heap, which is an approximately 28°C rise above the ambient temperature (3°C). Since temperature cables did not start to record the temperature until day 2, the increase from initial temperatures could not be determined and the constant decline in temperature indicated that maximum temperature may have been reached during the first 2 days.
Differences in temperature were not larger between treatments than within treatments (measured at mid-level; Fig. 1). Temperature differences between treatments did not exceed 5°C after the first 2 weeks and the mid-location measurements showed the largest temperature difference between treatments. The ambient temperature during the experiment ranged from −20°C to 20°C. The overall trend for the ambient temperature was a steady decline until the first week in February (day 65) when the coldest temperature was recorded, and thereafter, a general increase in temperature until the end of the study (Fig. 2).
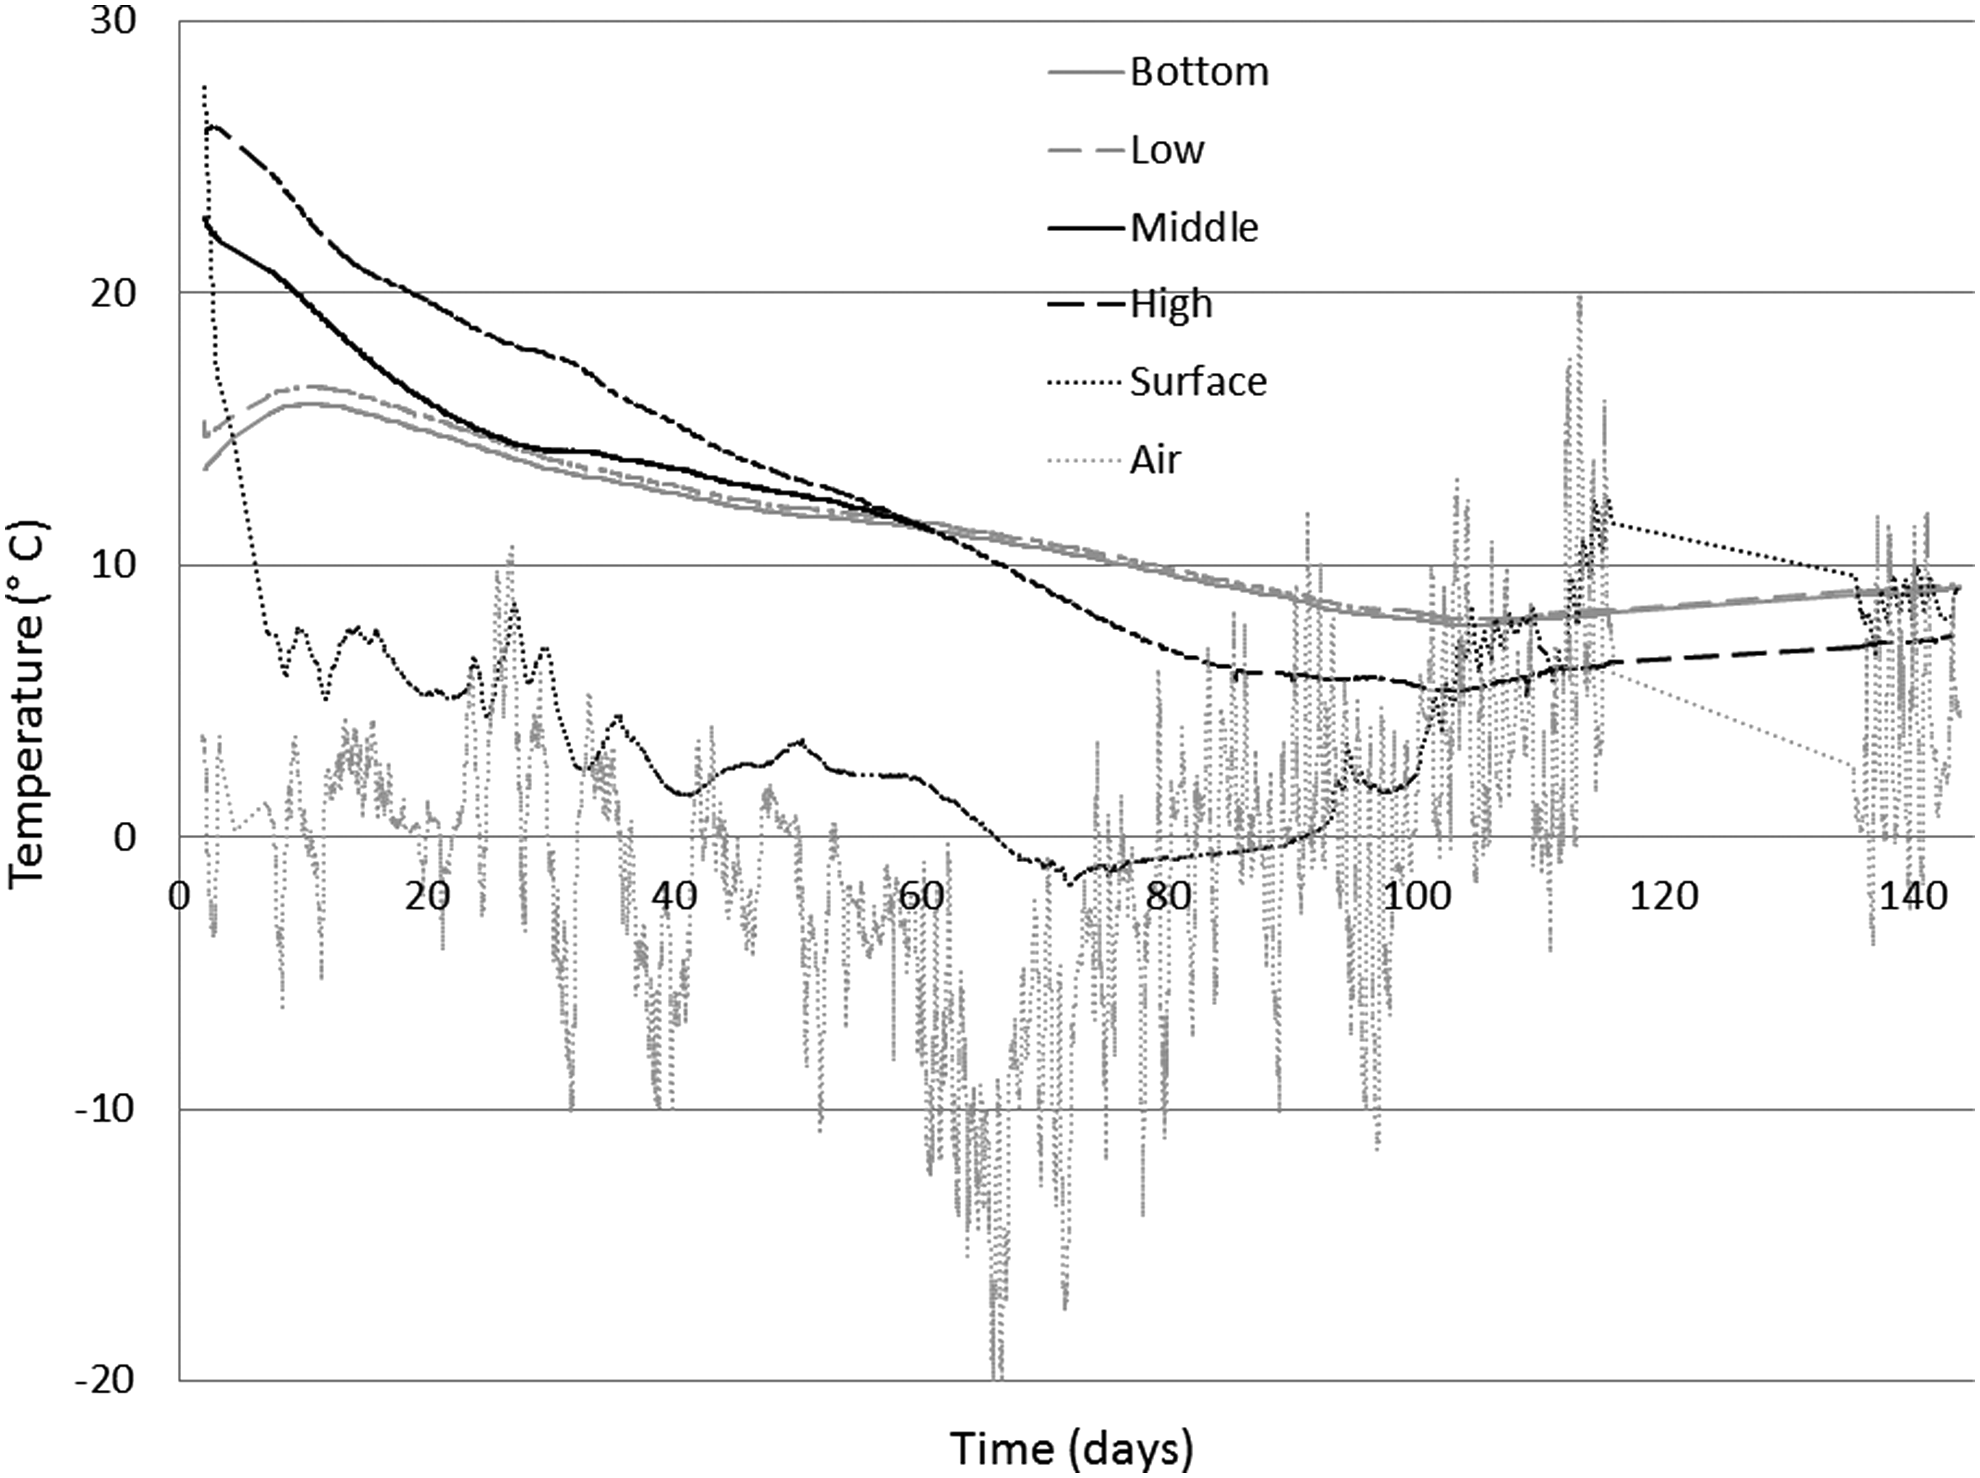
Temperature measured in the windrow at the bottom (bottom), 27 cm up (low), in the middle (middle), 27 cm from the top (high), and 5 cm below the surface on the side of the windrow (surface) and the temperature in the ambient air (air) for the control windrow.
The temperature in cross sections of the sludge windrows showed a pattern, irrespective of whether the sludge was urea-treated or not, with the highest variation in temperature at the surface (Fig. 2). In comparison with the other sampling locations, the surface sites also showed some diurnal temperature variations and temperatures below 0°C. Deeper into the windrows, more stable temperatures were observed, on average 11–12°C at the bottom (B) and low (L) locations, and 11–16°C in the middle (M) of the windrows. A trend for a change from declining temperatures to increasing temperatures was observed approximately 4 weeks after the ambient temperature started to increase with the exception of the surface location, where the delay in temperature in relation to ambient was approximately 2 weeks (Fig. 2).
General observations
During the study, a front with a color change owing to the oxidized iron in the flocculant was observed moving from the outer parts toward the core of the windrows. At the end of the study, this front was approximately 50 cm. In terms of consistency, the urea-treated sludge appeared slightly stickier than the untreated control when sampling. The stickiness was creating some problem during fertilizing with the urea treated sludge (Willén et al., 2013). The TS content decreased slightly, to an average 28% at day 89, in both the urea-treated and control windrows. No decrease in VS was observed during the study.
Ammonia and pH
Analysis of ammonia and total nitrogen after the addition of urea showed that the total nitrogen (TN) concentration increased by 3.9 and 7.3 g/kg wet sludge, which corresponded to the addition of 0.85% and 1.58% urea, respectively.
The pH increased from 7.9 at the start (Table 1) to at most 8.7 and 8.8 for the 0.85% and 1.6% urea treatment, respectively (Fig. 3b). However, in the control windrow, the pH in some samples also increased, to 8.6 at day 40, after which the pH decreased. The pH in the control samples could be correlated to the TAN concentration. The variation in pH within the sewage sludge material at the start was at the most 0.3 pH units, whereas after treatment, the pH varied by at most 0.7 pH units. The 1.6% urea treatment showed less variation in pH than the 0.85%treatment and the control (Fig. 3b). There appeared to be a trend within the windrows for the 0.85% urea-treated sewage sludge to have slightly higher pH in samples closer to the surface, whereas for the control, surface samples held lower pH compared to samples from the middle of the windrow. In contrast to the pH, the TAN concentrations were lowest in the surface samples.

Total ammonia nitrogen (TAN) concentration (g/kg) ) and 1.6% urea (▪). The vertical lines show the expected TAN concentration in the sludge with 0.85% ( ) and 1.6% (
 ) urea addition.
For the control, the TAN concentration decreased slightly over time from the initial 3.7 g/kg−1. For 1.6% urea-treated sludge, the ammonia concentration at day 12 and even at day 40 indicated that decomposition of the urea may have been slow, whereas for the later analyses (day 89 and 145) in part of the samples, ammonia concentrations exceeded those expected from the nitrogen added with urea, that is, 7.7 and 11.1 g/kg−1 (Fig. 3a). For the 1.6% urea treatment, surface samples held lowest TAN concentrations. The pH was expected to increase with increasing urea addition (i.e., ammonia), but the correlation between pH and TAN was more evident at the early samplings.
Fractionation of ammonia as a function of pH and temperature meant that a low fraction of the ammonia was present in the form of uncharged NH3. At the samplings, the current temperature and pH resulted in no more than 16% of ammonia being in the uncharged form (in the 1.6% urea treatment), and due to the declining pH and temperature, the fraction of ammonia present as NH3 decreased over time. In terms of concentrations, the highest values among sampling occasions were 17, 43, and 79 mM NH3 for the control, 0.85% and 1.6% urea treatments, respectively. The fact that the TAN concentrations increased over time could not compensate for the effects of the decreasing pH and temperature. As a result, the NH3 concentration decreased over time and at the end of the study (day 145) was 5, 14, and 48 mM NH3 for the control, 0.85%, and 1.6% urea treatments, respectively.
Inactivation rates
At the first sampling at day 12, Salmonella spp. were not detected (<1 cfu 25 g−1) in sludge from any treatment or the control and E. coli were not detected (<10 cfu/g) in sludge treated with 1.6% urea (Fig. 4; 1a). For the 0.85% urea treatment, 1–2 samples tested positive for E. coli until the last sampling at day 145 (Fig. 4; 1b) when no E. coli were detected. In the control sludge, E. coli were still at concentrations above 3 log10 g−1 at the end of the study (day 145) (Fig. 4; 1c), mainly in the surface samples.
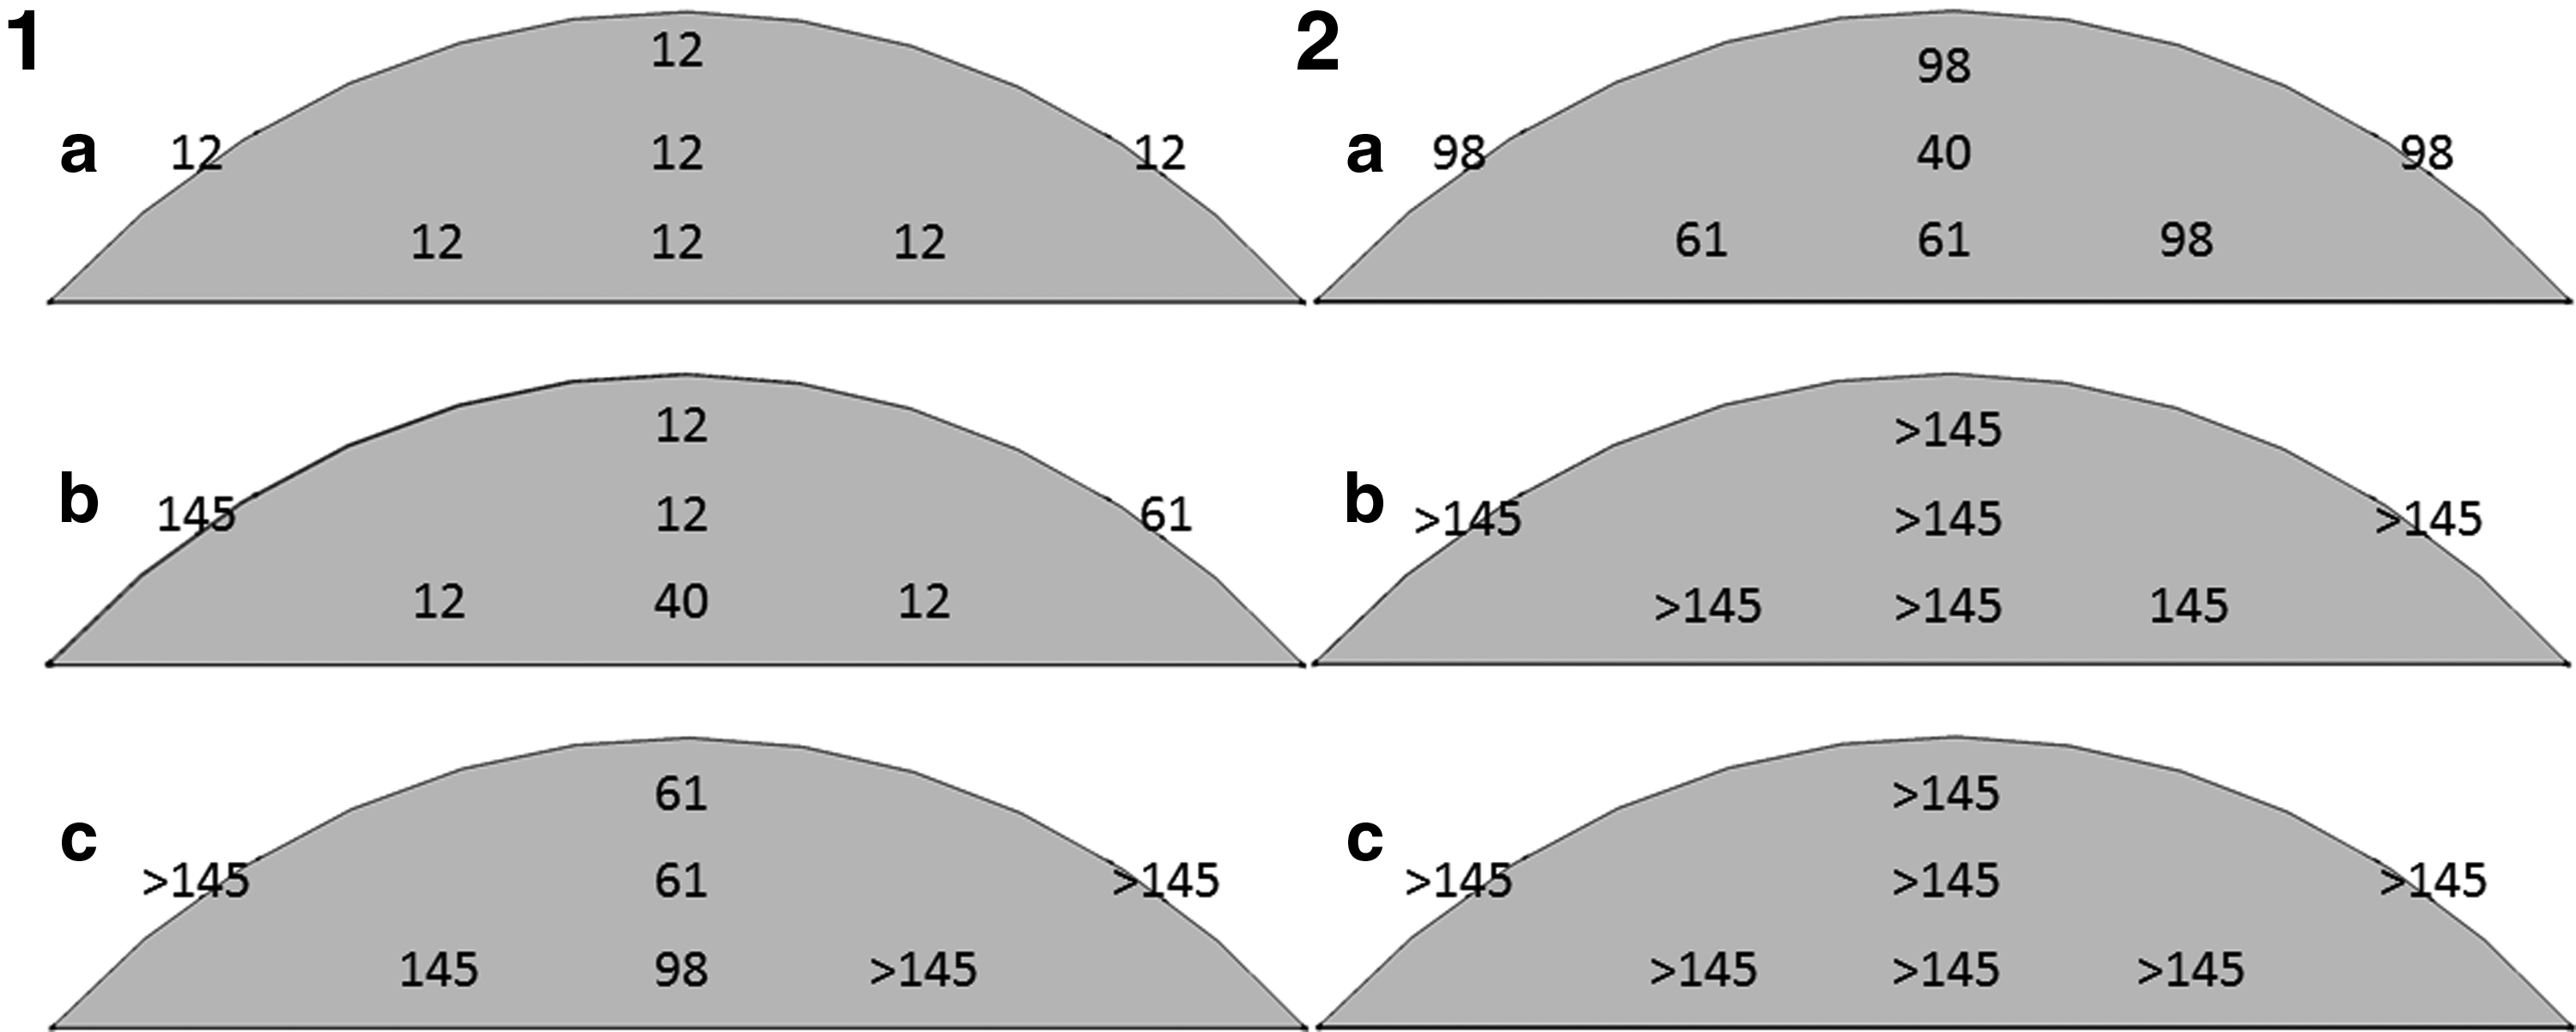
Time of sampling (days) when nondetection concentrations of <10 cfu/g sludge for Escherichia coli
Enteroccocus spp. were reduced below the detection limit (<100 cfu/g) in sludge treated with 1.6% urea after 89 days of treatment (Fig. 4; 2a), whereas at day 61, concentrations were <2–4 log10 cfu/g with the nondetection limit reached in the mid samples. This inactivation was faster than in the control and the 0.85% urea treatment, although the significance (p<0.05) could not be proved for the sampling locations in the middle of the pile (3,4,5) where reaching nondetection limit early resulted in too few data points to be statistically analyzed. For the untreated sludge and the sludge treated with 0.85% urea, there were no differences in the reduction of Enterococcus spp. (p>0.2), with concentrations at the end of the study (day 145) of 3.0–4.1 log10 g−1, that is, corresponding to at most a 2.5 log10 reduction (Fig. 4; 2b,c), which although were significant decreases (p<0.05) in log10 concentration over time.
The coliphages decreased, although slow, in both treatments, and the control and concentrations were 3.1, 3.0, and 2.4 log10 g−1sewage sludge at the end of the study for the control and urea treatment with 0.85% and 1.6%, respectively.
Directly after the removal from the sludge, the Ascaris eggs showed no signs of development at any of the samplings. However, after 3 weeks of incubation at 28°C, a proportion of the eggs developed into motile larvae, that is, counted as viable eggs (Fig. 5). A. suum egg viability initially decreased in all treatments to day 89 with viability ranging from 0% to 18% with no clear relation to urea dose or location (surface or middle). At next sampling at day 145, increases in viability (up to 5–117%) were observed for all egg bags except 0.85% surface sample (p=0.097). During counting, some of the eggs (with no development after incubation) appeared damaged and this fraction of damaged eggs decreased for the later samples.

Fraction of viable A. suum eggs at the surface (open) and in the middle (filled with gray) of the windrow for the control (○/), 0.85% urea (△/), and 1.6% urea (□/ ), with error bars giving the 95% confidence interval.
Discussion
Sanitization of sewage sludge
The initial analyses of each 7.2 ton batch of the sewage sludge during setup (Table 1) corresponded well to the figures reported by the sewage plant for 2011 (Uppsala-Vatten and Avfall AB, 2012) for TS, VS, pH, and TAN. However, total nitrogen was lower in the present study, 40 g N per kg TS compared with 46 g N per kg TS reported by the sewage plant (Uppsala-Vatten and Avfall AB, 2012). The sludge can thus be considered to be fairly representative for parameters relevant for ammonia sanitization.
Salmonella spp. was the only naturally occurring pathogen for which analyses were performed. One-third of the samples tested positive for Salmonella spp, indicating an uneven distribution in the material and/or low concentrations. The detected S. enterica subspecies enterica serovar Paratyphi B dT+, variant Java (S. Java), caused a national outbreak in Sweden at the end of 2011 but with no confirmed source of infection. The strain was indistinguishable from a strain that caused a large outbreak in 2007 when cases were reported in the municipality managing the treatment plant from which sewage sludge studied here was obtained. Sahlström et al. (2004) found patterns indicating that Salmonella spp. may persist in sewage plants, but nondiagnosed clinical cases and subclinical cases were probably the source of the Salmonella spp. in the sewage sludge.
Ammonia inactivation rates of Salmonella spp. have been shown to be similar to the inactivation rates of E. coli (Vinnerås et al., 2008) and since E. coli is present in much higher concentrations, its absence or partly removal can certify the removal of Salmonella spp, which is a requirement before land use, despite that initial concentrations of E. coli (5.0–6.3 log10 cfu/g) in the sludge (Table 1) may not allow to confirm as 6 log10 reduction as suggested in the amendment to EC directive. Enterococcus spp. being gram-positive bacteria with a more complex cell wall has been reported much more persistent toward ammonia compared with the gram-negative bacteria to which Salmonella spp. and E. coli, as well as many pathogenic bacteria belong. A reduction of Enterococcus spp. to below 100 cfu per g TS may be a more relevant indication of the sanitization level than a total removal of Enterococcus spp.
Somatic coliphages were only slightly affected by urea treatment; however, at day 145, with a lower concentration of coliphages in the 1.6% treatment compared with the 0.85% urea treatment and control. This is in line with other studies on ammonia treatment, which report a low reduction in coliphages at ammonia concentrations below 100 mM (Vinnerås et al., 2008; Nordin et al., 2009b). F-RNA phages, which have been proven to be more sensitive to ammonia (Fidjeland et al., 2013), were not present to start with, indicating that they are sensitive to mesophilic anaerobic digestion of the sludge. At present, it cannot be concluded from the persistence of the coliphages that animal viruses will behave similarly, as animal viruses have been proven to be considerably more sensitive to ammonia (Ward, 1978; Emmoth et al., 2011).
The viability of the A. suum varied over time, with an initial decrease in viability followed by an increase from day 98 to 145. The results indicate that the nonviable Ascaris eggs were degraded over time during storage. This phenomenon has also been observed in other studies using the same method with egg bags placed in biomaterial for time periods over 100 days (Magri et al., 2013), as the viability but not the concentration is monitored. Thus, to monitor Ascaris egg inactivation in sewage sludge over long time periods, another method is required. However, in evaluating the inactivation of Ascaris, the eggs have to be added, as it is uncommon to find helminth eggs in sewage sludge in Sweden (Sahlström et al., 2004).
For the indicator bacteria studied here, the survival was higher in the surface samples (Fig. 4). At more central locations, the reduction was faster, for example, in the 1.6% treatment Enterococcus spp. reached the detection limit (<100 cfu/g) at day 61 compared with day 89 when considering also the outer parts of the windrow. For E. coli, this meant that the reduction to the detection limit (<10 cfu/g) could have been met on day 40 in the 0.85% urea treatment. The longer survival in the surface is most probably due to the more aerobic conditions and somewhat lower ammonia concentrations.
Treatment parameters
Inactivation of microorganism during ammonia sanitization has been related mainly to NH3 concentrations and an increase in temperature shown very favorable for increasing the speed of inactivation of microorganisms. For example, Nordin et al. (2013) showed that a peak temperature 5°C above the ambient of 24°C made the inactivation of both bacteria and parasites significantly faster. The temperature increase observed in the present study was not expected as an immediate coverage of the windrows was planned. However, the VS content, Solvita and Rottegrade tests all showed that there was still energy-rich material present in the sewage sludge after anaerobic digestion. The temperature development observed in the outer part of the windrows during the first days was not affected by the added urea as differences in temperature were not larger between windrows than within windrows when measured at mid-levels. Neither did the temperature increase give a markedly inactivation of microorganisms, which indicate that the urea not had been decomposed to any large extent during the first 3 days.
In the cores of the windrows (locations B, L, and M), the temperature was, despite ambient temperatures down to −20°C, not lower than 5°C during the study period. Such heat conservation and slow response to change in ambient temperature makes, as long as surface to volume ratio is minimized, the temperature distribution homogenous and sanitization rates predictable.
Addition of urea to the sludge resulted in a lower pH than generally found in materials, such as manure (Ottoson et al., 2008) or toilet waste (Nordin et al., 2009a). The difference was mainly due to the chemicals added during sludge flocculation (FeCl3), digestion (polyaluminum chloride), and dewatering (polyelectrolyte dosage with Superfloc C498), which buffer the pH. The 15°C temperature found in mid-windrow during the 60 days taken for Enterococcus spp. inactivation and pH of 8.9, 8.8, and 8.6 will result in 18%, 15%, and 10% of ammonia as NH3, respectively. Thus, such differences in pH may have greatly affected the action of the added urea in the 0.85% and 1.6% urea treatments since the TAN concentrations were overlapping most part of the study (Fig. 3a). The TAN concentrations exceeding what was expected from the addition may be due to lysis of inactivated bacteria. However, in the control treatment, the TAN concentration decreased, which may be due to nitrification. Comparing initial nitrogen concentration in 1.6% urea-treated sludge with concentrations when fertilizing with the sludge 10 days after the end of the experiment (Willén et al., 2013), there was a 1 g decrease to 18 g N/kg wet sludge, of which 8 g was TAN. However, comparing on TS basis, there was no decrease in total nitrogen concentration indicating nitrogen conversion rather than ammonia losses. Final total phosphorus concentration was reported by the sewage plant 32 g/kg TS and had a carbon–nitrogen ratio of 4.8 (Willén et al., 2013).
The initial temperature increase and the oxidized layer observed in the sludge indicate air exchange in the outer layers of the windrows, which is the probable explanation of lower TAN concentrations and lower reduction of indicator bacteria in surface samples. Thus, samples from the outer parts were not representative of the full windrow. This surface effect can be avoided by either having an outer insulation layer of already treated sludge or decreasing the surface area, for example, performance of the treatment in cells with fixed walls. A faster decomposition of the urea could shorten the treatment time, and the temperature was probably a limiting factor for the hydrolysis as nitrogen from urea (0.5–2% ww) added to sewage sludge in the laboratory (25°C) could be recovered to 98% after 8 days (data not presented).
Overall, ammonia treatment is thus an efficient low-tech solution for hygiene treatment of sewage sludge. Furthermore, the treatment is easy to adapt in scale, does not require any major additional investments for the treatment plant, and can be performed on demand when sludge needs to be treated before use as a fertilizer. In addition, the treatment itself increases the fertilizer value of the sludge, as no additional nitrogen fertilization is required during the first year of application.
Conclusions
Addition of 1.6% urea to sewage sludge had good effects in terms of inactivation of the indicator bacteria Enterococcus spp. and E. coli in comparison with storage, which can be related to the elimination of Salmonella spp., currently in Sweden the only regulated organism. Within 3 months of treatment during the Swedish winter (temperatures down to −20°C), it was possible to produce sewage sludge without any detectable indicator bacteria. Complementary studies on the inactivation of persistent parasite eggs as Ascaris is needed to evaluate the applicability of the sludge treatment in countries where helminth eggs are found in sludge. The method described for addition of urea to windrows could also be used in a full-scale process, even if a more mechanized method would be preferable. In addition, the treatment is easy to adapt in scale, does not require any major additional investments for the treatment plant, and has low operating costs.
Besides sanitization, urea treatment would also produce a product with a better balance between nitrogen and phosphorus, which could make it easier to commercialize the use of the sludge as fertilizer for arable land. It would also be possible to treat the sludge with different doses of urea to meet the demands from agriculture regarding composition and time of application.
Footnotes
Acknowledgments
The authors acknowledge Tomas Ivarsson for valuable support at Hovgården and Alexande Johansson for field works and assistance in the laboratory. The study was funded by the Swedish Research Council Formas, Svenskt Vatten Utveckling, and Uppsala Vatten and Avfall AB, and the chemicals used for the study were supplied by Kemira Kemi, Helsingborg.
Author Disclosure Statement
No competing financial interests exist.